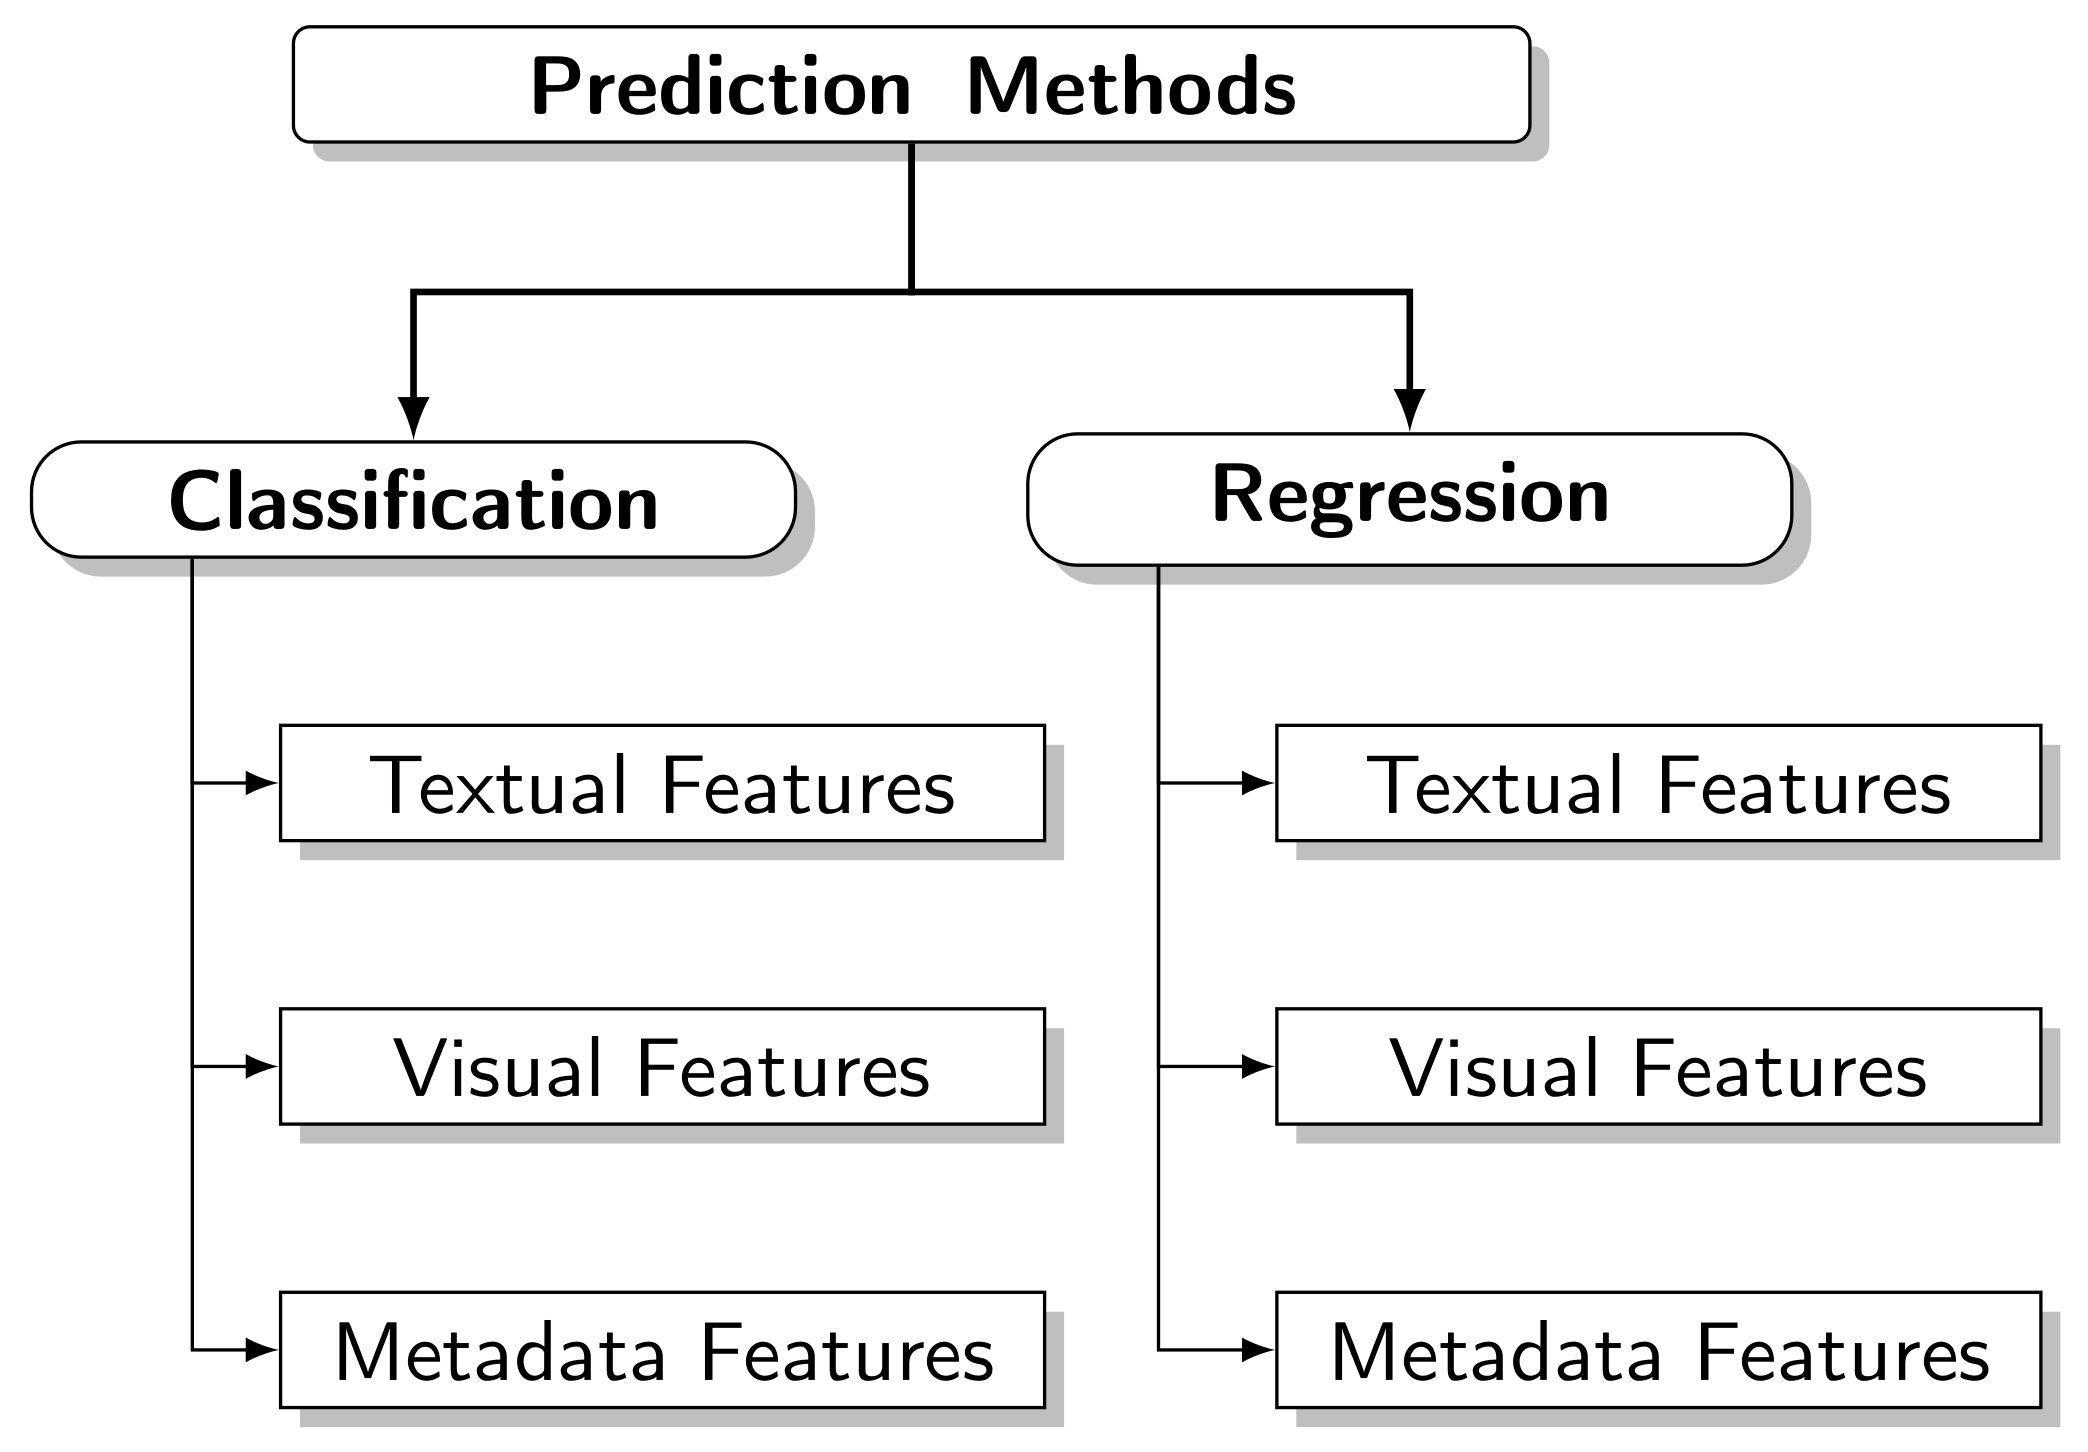
In this section, we present the ML models that use classifiers to predict Web content’s popularity. The definition of the class popular differs from one study to another, taking into account the dataset used and the context of the research. Usually, popular content belongs to the minority class, causing the popularity classes to become unbalanced, allowing the model to obtain high degree of correctness, without necessarily classifying them correctly. For this reason, several studies opt for employing a balancing strategy.
Performance evaluation and comparison between models is vital to find the best answer to the problem in question. Among the metrics used to evaluate the classifiers is
Accuracy, defined by Equation (
2). This metric is the complement of
Error Rate, or incorrect classifications, presented in Equation (
3).
is the classifier,
the known class of
and
the predicted class,
if
is true and 0, otherwise. Using as an example a problem of two classes, where one is popular content and the other unpopular, it is possible to present the Error Rate in a more understandable way as in Equation (
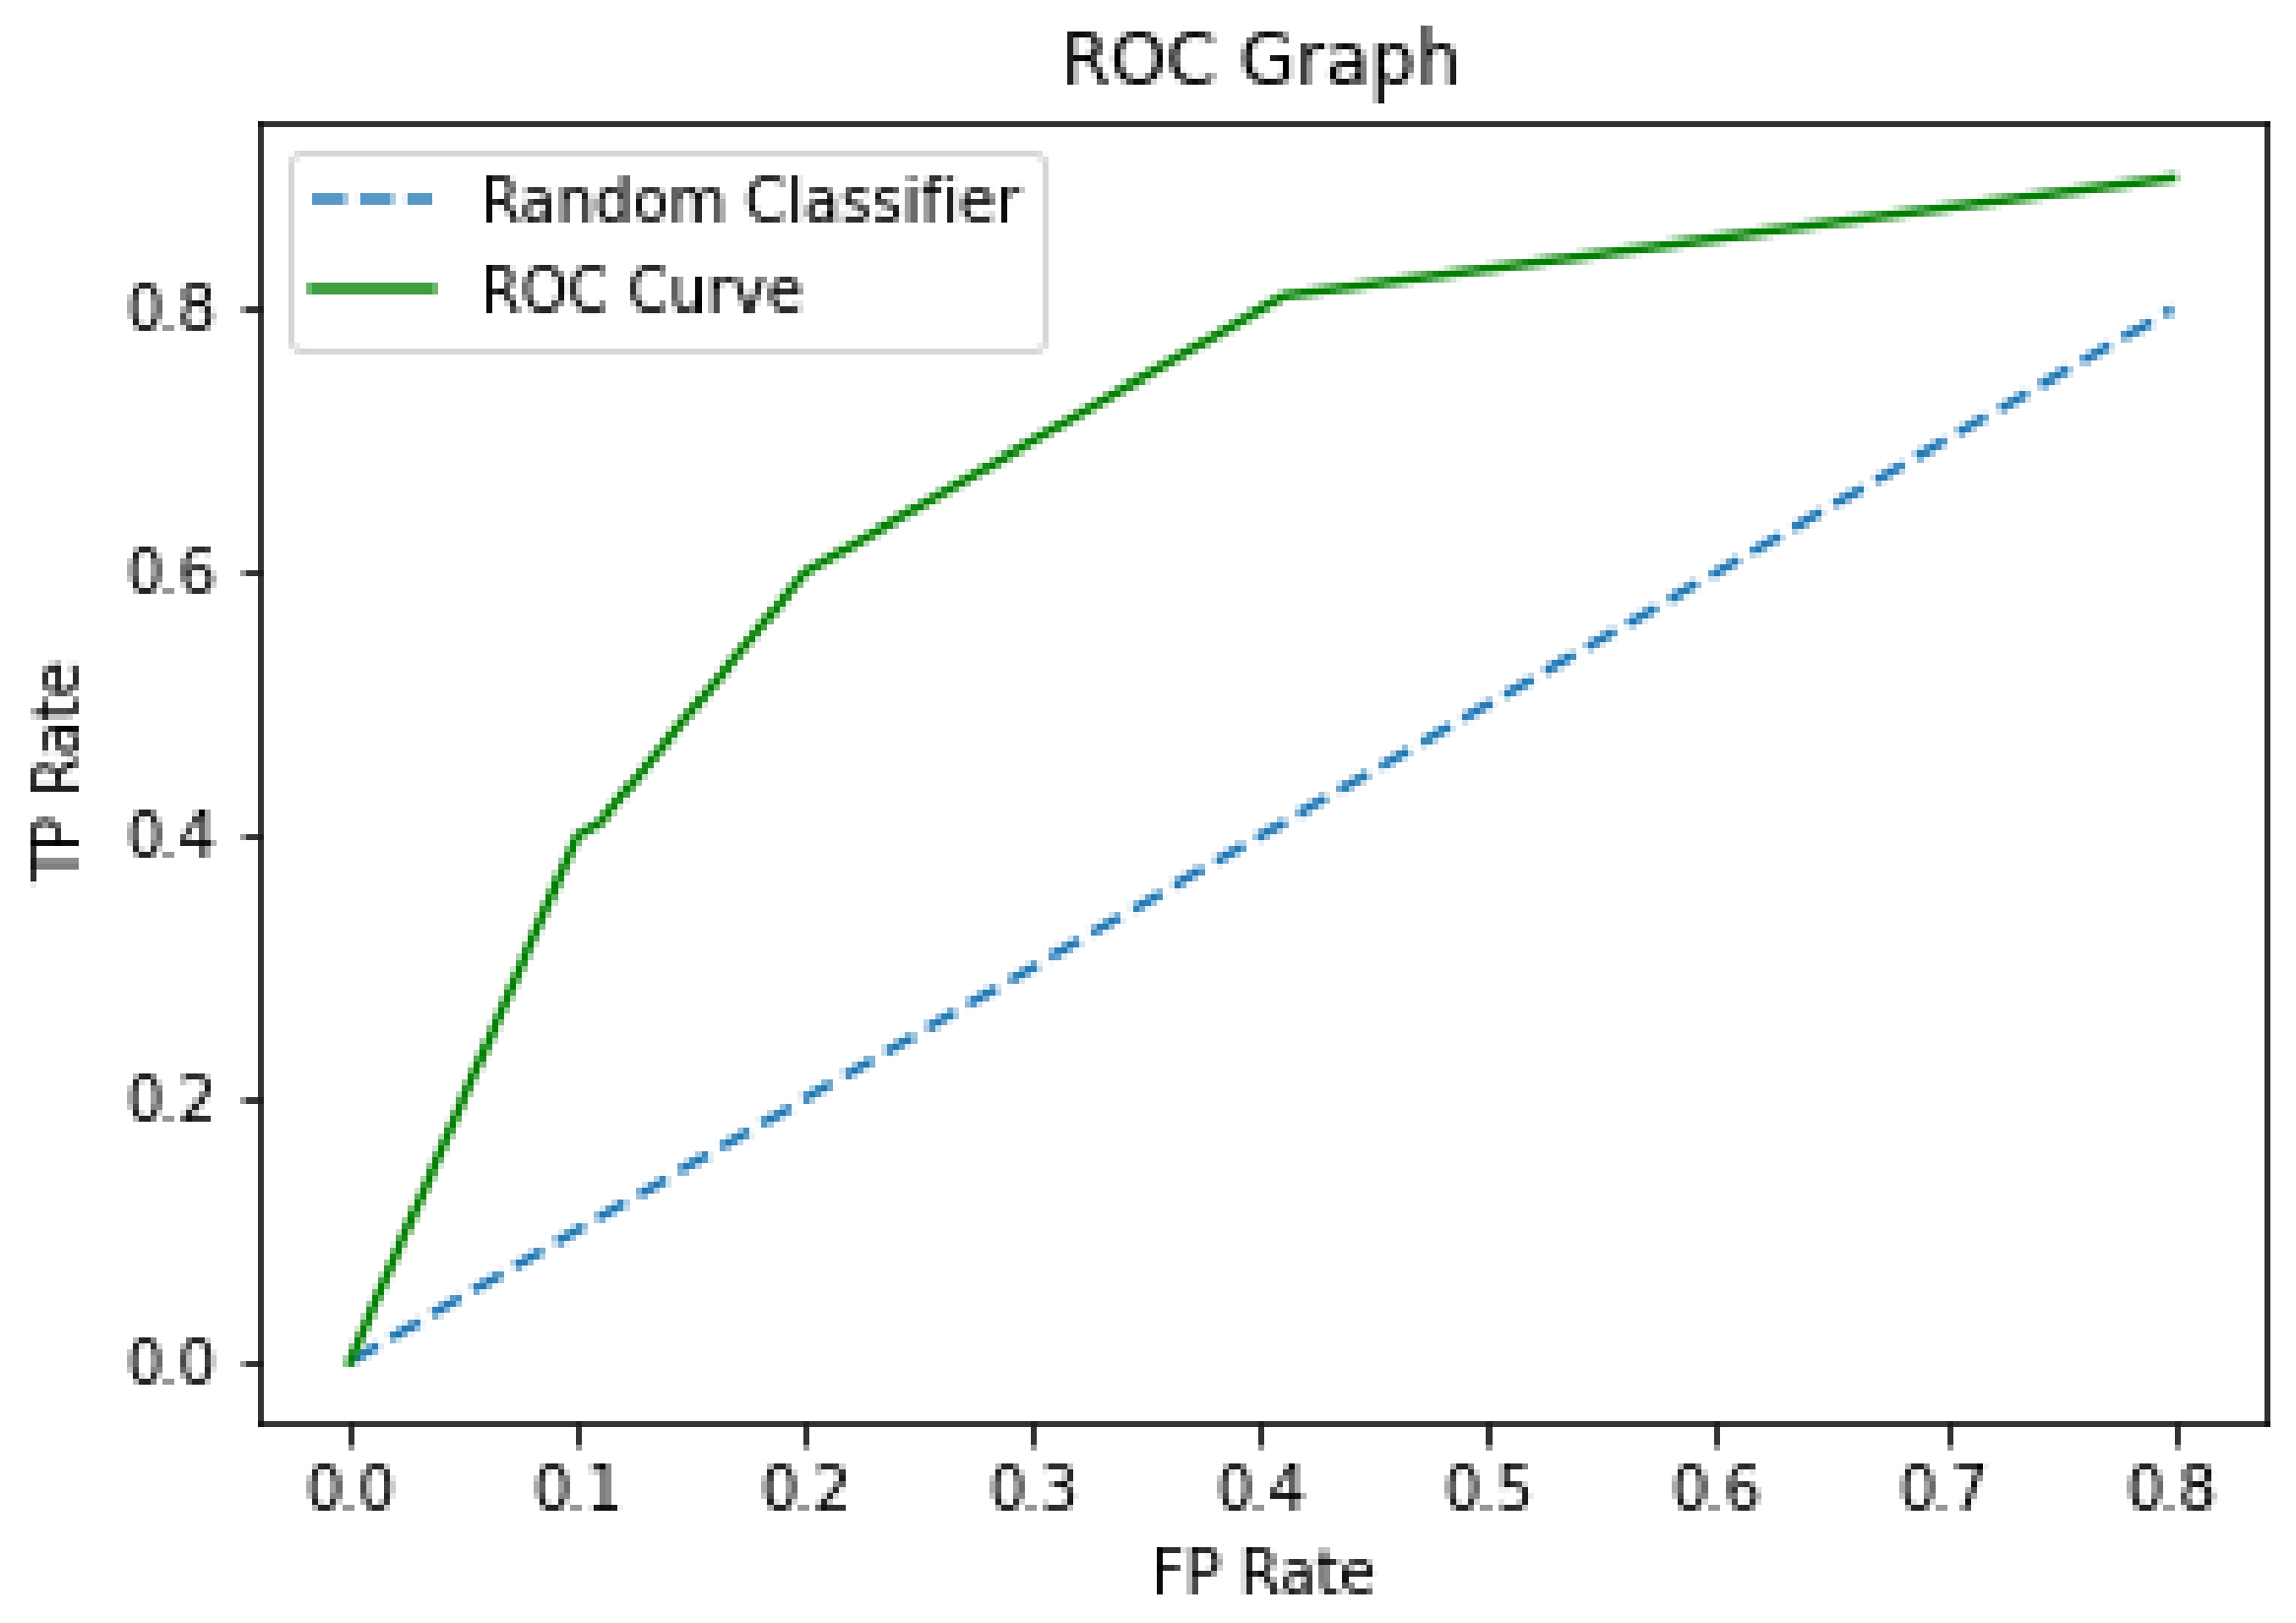
4). FP are false positives, examples belonging to the unpopular class classified as popular and FN are false negatives, examples belonging to the popular class are classified as unpopular. [
17]. As in the case of popularity prediction, popular content is in the minority. The algorithms that classify the content as unpopular tend to have better accuracy. In this context, it is worse to have many false negatives.
4.1. Textual Features
NLP techniques allow the extraction of several attributes directly from content, as in news articles, or from information provided, such as descriptions of videos and images. Among these techniques, there are the sentiment analysis, NER, subjectivity of the text, and discovery of topics with the LDA algorithm [
31].
Twitter, one of the most popular social networks in the world, allows sharing information via short messages. News Articles are shared on Twitter by publishing the news URL and the retweet feature, which allows sending information without modification. Bandari et al. [
13] used five classifiers with a set of multidimensional attributes to predict the popularity of news articles on Twitter through the number of
tweets and
retweets.
The news articles were collected from the news aggregator Feedzilla and the attributes which tried to cover different dimensions of the problem were:
The source of the news, which generated or published the article;
The category of the article, according to Feedzilla;
The subjectivity of the article’s language;
Named entities present in the articles.
They collected data from 8 August 2011, to 16 August 2011, totaling 44,000 articles. For each article, the Topsy [
49] tool provided the number of
tweets. For the recognition of named entities (places, people, or organizations) the Stanford-NER tool was used. For the articles’ subjectivity, a Ling–Pipe classifier was used, which is a set of tools for NLP with ML algorithms developed in Pang and Lee [
50]. To highlight the contribution of subjectivity in the analysis carried out, the authors sought two
corpus: the first had a more informal language while the second was more objective and with less sentiment in the communication carried out. Next, the tool was trained with the transcripts of Rush Limbaugh [
51] and Keith Olberman [
52] as the subjective
corpus. For the training of objective language, the transcripts of the CSPAN [
53] were used, as well as the transcription of articles from the website
FirstMonday [
54].
The data collected showed that the absolute values sometimes did not represent the desired information. For example, the amount of news published in the health category does not emphasize its importance. This category has few published articles, but they are among the most shared. Thus, if we look only at the number of shares, a category with many articles would seem more important, even if your articles are not as shared. Due to this possibility of misinterpretation, the authors proposed the measure
t-
density (Equation (
9)). Thus, a
t-
density was calculated for each category and for each source of the article [
13]:
The dataset was divided into three classes, covering different ranges (
tweets and
retweets were counted as
tweets): Class A with up to 20
tweets, Class B ranged from 20 to 100, and Class C with more than 100
tweets. Articles that were not shared on Twitter, that is, with 0
tweets, were not considered for the popularity prediction. Classifiers are induced from four ML methods: Bagging, Decision Tree J48, SVM, and Naive Bayes. They compare the performance of these models using accuracy as a metric. The results indicate that it is possible to predict the popularity
before the publication with an accuracy of approximately 84% using a set of attributes extracted directly from the news articles’ content, with algorithm Bagging. Moreover, the classifiers trained to predict whether or not an article will be shared from Twitter using the same set of attributes have reached an accuracy of 66% [
13].
Finding relevant textual attributes allows optimizing the content, in addition to prediction. In this sense, Fernandes et al. [
10] propose an Intelligent Decision Support System (IDSS) to predict if a news article is popular or not and subsequently suggest simple changes in the content that would increase its popularity. The prediction module uses as inputs the digital media content (images, videos), previous popularity of the news referenced in the article, the average number of shares of keywords, and NLP attributes [
10]. The news articles are gathered from the website Mashable [
55] covering the period of two years. The metric for measuring popularity was the number of shares, and they considered a binary classification (popular/unpopular). To obtain a balanced distribution, the authors used the median number of shares, so articles with more than 1400 shares were considered popular.
The predictive results are explored in several ways. First, the five most relevant topics are identified in all the articles with the LDA algorithm [
31]. After that, they measured the distance between each article and these topics. The results are incorporated as predictive attributes [
10]. Regarding the subjectivity and polarity of the sentiment analysis, the authors adapted and used the Pattern module [
56] developed in Smedt and Lucas [
57]. Several attributes were extracted from the subjectivity and sentiment analysis, including subjectivity of the title, subjectivity of the text, polarity of the title, rate of positive and negative words, the polarity of the text, polarity of words, and rate of positive words between those that are not neutral and the rate of negative words among those that are not neutral.
The authors tested five classification methods: Random Forest (RF); Adaptive Boosting (AdaBoost), SVM with a Radial Base Function (RBF), KNN, and Naive Bayes (NB). The following metrics were computed: Accuracy, Precision, Recall, Score, and the AUC. The Random Forest has the best results with 0.67 of Accuracy and 0.73 of AUC.
From the results, they identified that, among the 47 attributes used, those related to keywords, proximity to LDA topics, and article category are among the most important. The optimization module seeks the best combination over a subset of features suggesting changes, for example, by changing the number of words in the title. Realize that it is the responsibility of the author of the article to replace the word. Applying the optimization to 1000 articles, the proposed IDSS achieved, on average, a 15% increase in popularity. The authors observed that NLP techniques to extract attributes from the content proved to be successful.
After the study was carried out in [
10], the database was made available in the UCI Machine Learning repository allowing for new research and experiments. In 2018, Khan et al. [
16] presented a new methodology to improve the results presented in [
10]. The first analysis was to reduce features to two dimensions using Principal Component Analysis (PCA). PCA is a statistical procedure that uses orthogonal transformations to convert a set of correlated attributes into a set of linearly uncorrelated values called principal components. Thus, the two-dimensional PCA analysis output would be two linearly separated sets, but the results of that dataset did not allow this separation. Three-dimensional PCA analysis was applied to attempt linear separation, but it was also unsuccessful [
16].
Based on the observation that the features could not be linearly separated and on the trend observed in other studies, the authors sought to test models of nonlinear classifiers and ensemble methods such as Random Forest, Gradient Boosting, AdaBoost, and Bagging. In addition to those, other models were tested to prove the effectiveness of the hypothesis like Naive Bayes, Perceptron, Gradient Descent, and Decision Tree. In addition, Recursive Attribute Elimination (RFE) was applied to obtain the 30 main attributes for the classification models. RFE recursively removes the attributes one by one, building a model with the remaining attributes. It continues until a sharp drop in model accuracy is found [
16]. The classification task adopted two classes: popular articles with more than 3395 shares, and non-popular. Eleven classification algorithms were applied, showing that the ensemble methods obtained the best results, with Gradient Boosting having the best average accuracy. Gradient Boosting is a set of models that trains several “weak” models and combines them into a “strong” model using the gradient optimization. Gradient Boosting reached an accuracy of 79%, improving the result found in Fernandes et al. [
10]. Other models have obtained interesting results as well; for example, the Naive Bayes model was the fastest, but it did not perform well because the attributes are not independent. The Perceptron model had its performance deteriorated as the training data increased, which can be explained by the data’s nonlinearity. Hence, the performance of the MLP classifier significantly improved the accuracy of the predictive task.
An exciting approach focusing on the attributes is presented in [
15]. The authors hypothesized that the title’s grammatical construction and the abstract could emerge curiosity and attract readers’ attention. A new attribute, called
Gramatical Score, was proposed to reflect the title’s ability to attract users’ attention. To segment and markup words, they relied on the open-source tool Jieba [
58]. The
Grammatical Score is computed followed the steps below:
Each sentence was divided into words separated by spaces;
Each word received a grammatical label;
The quantity of each word was counted in all items;
Finally, a table with words, labels, and the number of words was obtained;
Each item receives a score with the Equation (
10), where
represents the Grammatical Score of the
item in the dataset and
k represents the
word in the
item. The
n is the number of words in the title or summary. The
is the amount of the
word in all news articles, and
in this equation is the amount of the
word in the
item:
In addition to this attribute, the authors used a logarithmic transformation and normalization by building two new attributes:
categoryscore and
authorscore:
The
categoryscore is the average view for each category. The variable
n in the Equation (
11) represents the total number of news articles of each author. For each category, the data that belonged to this category were selected, and Equation (
11) was used:
The
authorscore is defined in Equation (
12), where
m represents the total number of news articles of each author. Before calculating the
authorscore, data are grouped by author. For the prediction, the authors used the titles and abstracts’ length and temporal attributes in addition to the three mentioned attributes. The authors’ objective was to predict whether a news article would be popular or not. For this, they used the freebuf [
59] website as a data source. They collected the items from 2012 to 2016, and two classes were defined: popular and unpopular. As these classes are unbalanced and popular articles are the minority, the metric AUC was used, which is less influenced by the distribution of unbalanced classes. In addition, the kappa coefficient was used, which is a statistical measure of agreement for nominal scales [
60]. The authors selected five ranking algorithms to observe the best algorithm for predicting the popularity of news articles: Random Forest, Decision Tree J48, ADTree, Naive Bayes, and Bayes Net. We identified that the ADTree algorithm has the best performance with 0.837 AUC, and the kappa coefficient equals 0.523.
Jeon et al. [
40] proposed a hybrid model for popularity prediction and applied it to a real video dataset from a Korean Streaming service. The proposed model divides videos into two categories, the first category, called A, consisting of videos that have previously had related work, for example, television series and weekly TV programs. The second category, called B, is videos that are unrelated to previous videos, as in the case of movies. The model uses different characteristics for each type. For type A, the authors use structured data from previous contents, including the number of views. For type B, they use unstructured data such as texts from titles and keywords.
The XGBoosting algorithm, a model developed for rapid development and classification based on parallel processing, was used to predict a type A video. The authors use ANN with embedding techniques to obtain generation prediction resources for type B videos. They used Continuous Bag-of-Words (CBOW) through Word2Vec to build embeddings. In the end, they concatenate predictions of both models to deliver the final result. In addition to title and keywords, they use actor names, television channel names, and episode counts for feature extraction. The use of embeddings to obtain the title characteristics improved the prediction performance compared to the other four models with the same dataset [
40].
4.2. Visual Features
Most studies use the textual attributes and meta-attributes provided by the sites. However, in recent years, with technological advances, it has become possible to also use visual attributes extracted directly from videos. One of the first studies in this regard was [
11]. The authors studied the problem of predicting the popularity of videos shared on social networks. The prediction was treated as a classification task, and the attributes were extracted directly from the videos using a Deep Neural Network (DNN) architecture. The authors postulated that, if the predictive model incorporated the sequential information presented in the videos, a better classification accuracy would be obtained. The DNN is a Long Term Recurrent Convolutional Network (LRCN) [
61] that is able to take into account the order of the information when learning the weights. They called this method
Popularity-
LRCN and evaluated it with a dataset of 37,000 videos collected from Facebook [
62].
The network architecture is composed of an input layer that supports 18 frames of 227 × 227 × 3 dimension for each video. There are other eight layers, where the first five are convolutional layers, the sixth layer is a completely connected layer with 4096 neurons, the seventh is a Long Short-Term Memory (LSTM), and the last layer is the classification layer with two neurons. They used
softmax in the classification layer [
11]. To increase the network invariance, layers of
max pooling were used after the first, second, and fifth convolutional layers. ReLU was used as a nonlinear activation function applied to all convolutional layers’ outputs and the layers completely connected. During the training, the 320 × 240 × 3 video frames were randomly reduced to 227 × 227 × 3. In addition, a mirroring technique was used to increase the amount of sample in the training dataset. The network has been trained over 12 epochs with 30,000 iterations each [
11].
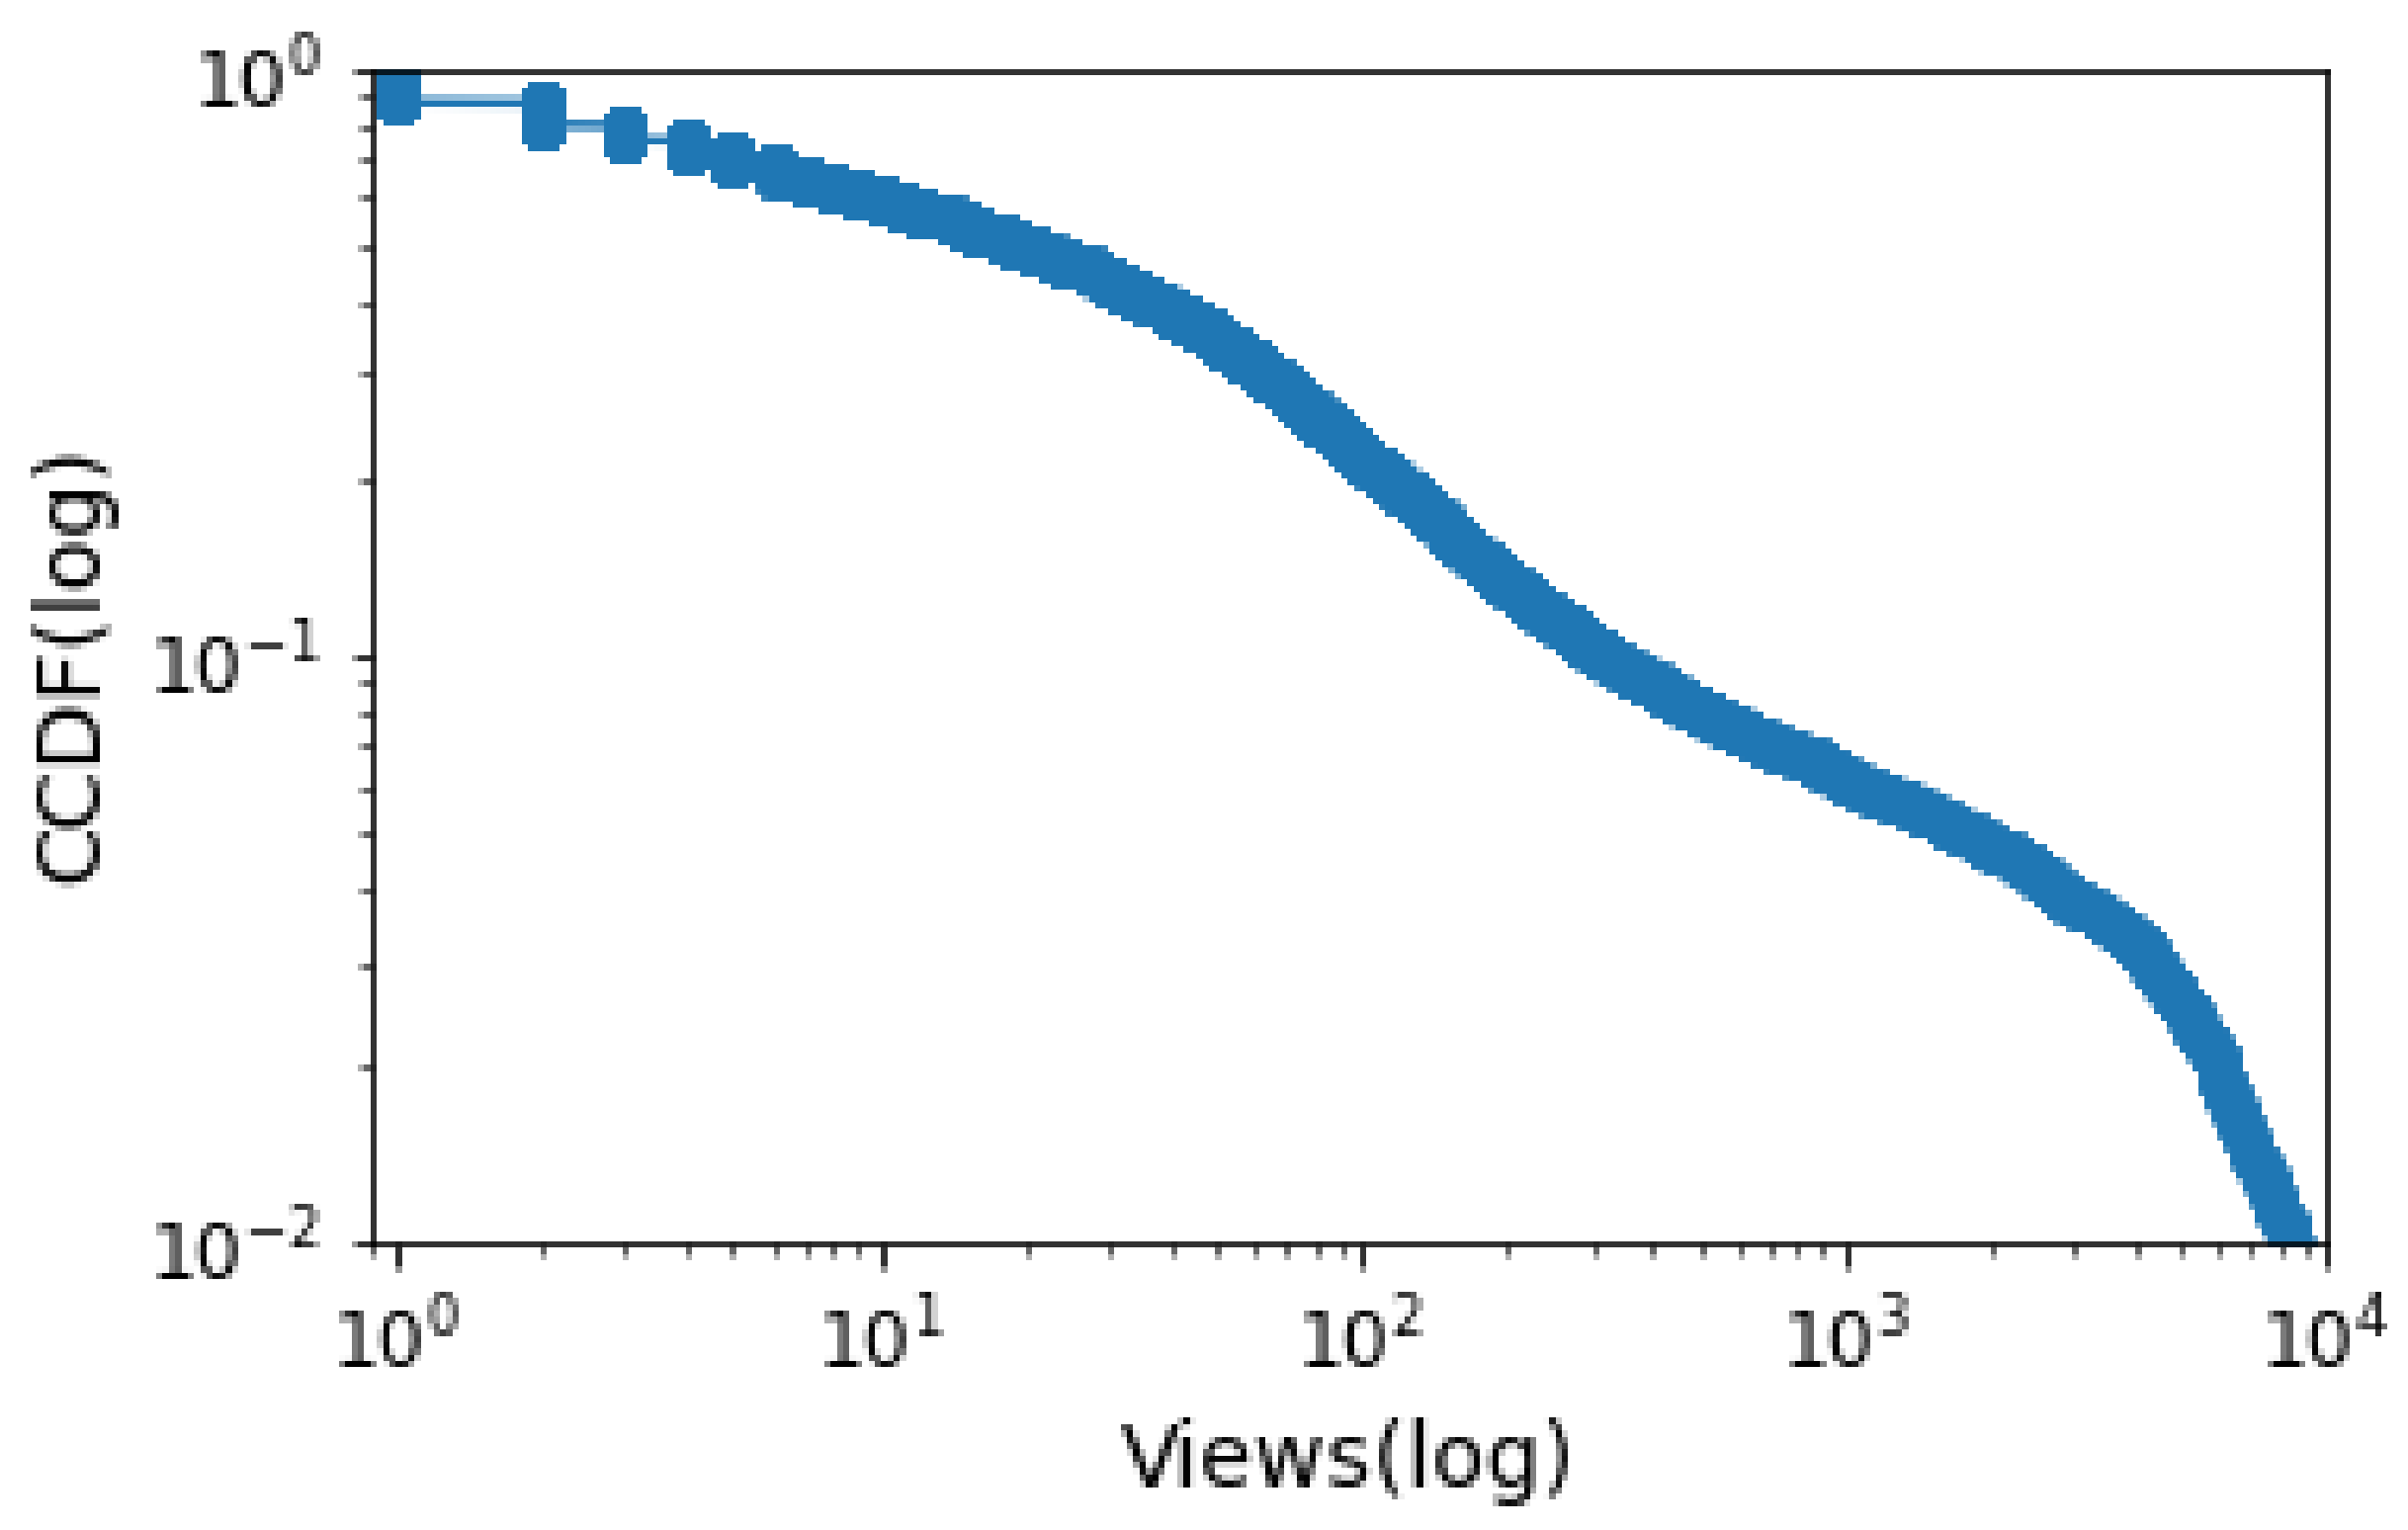
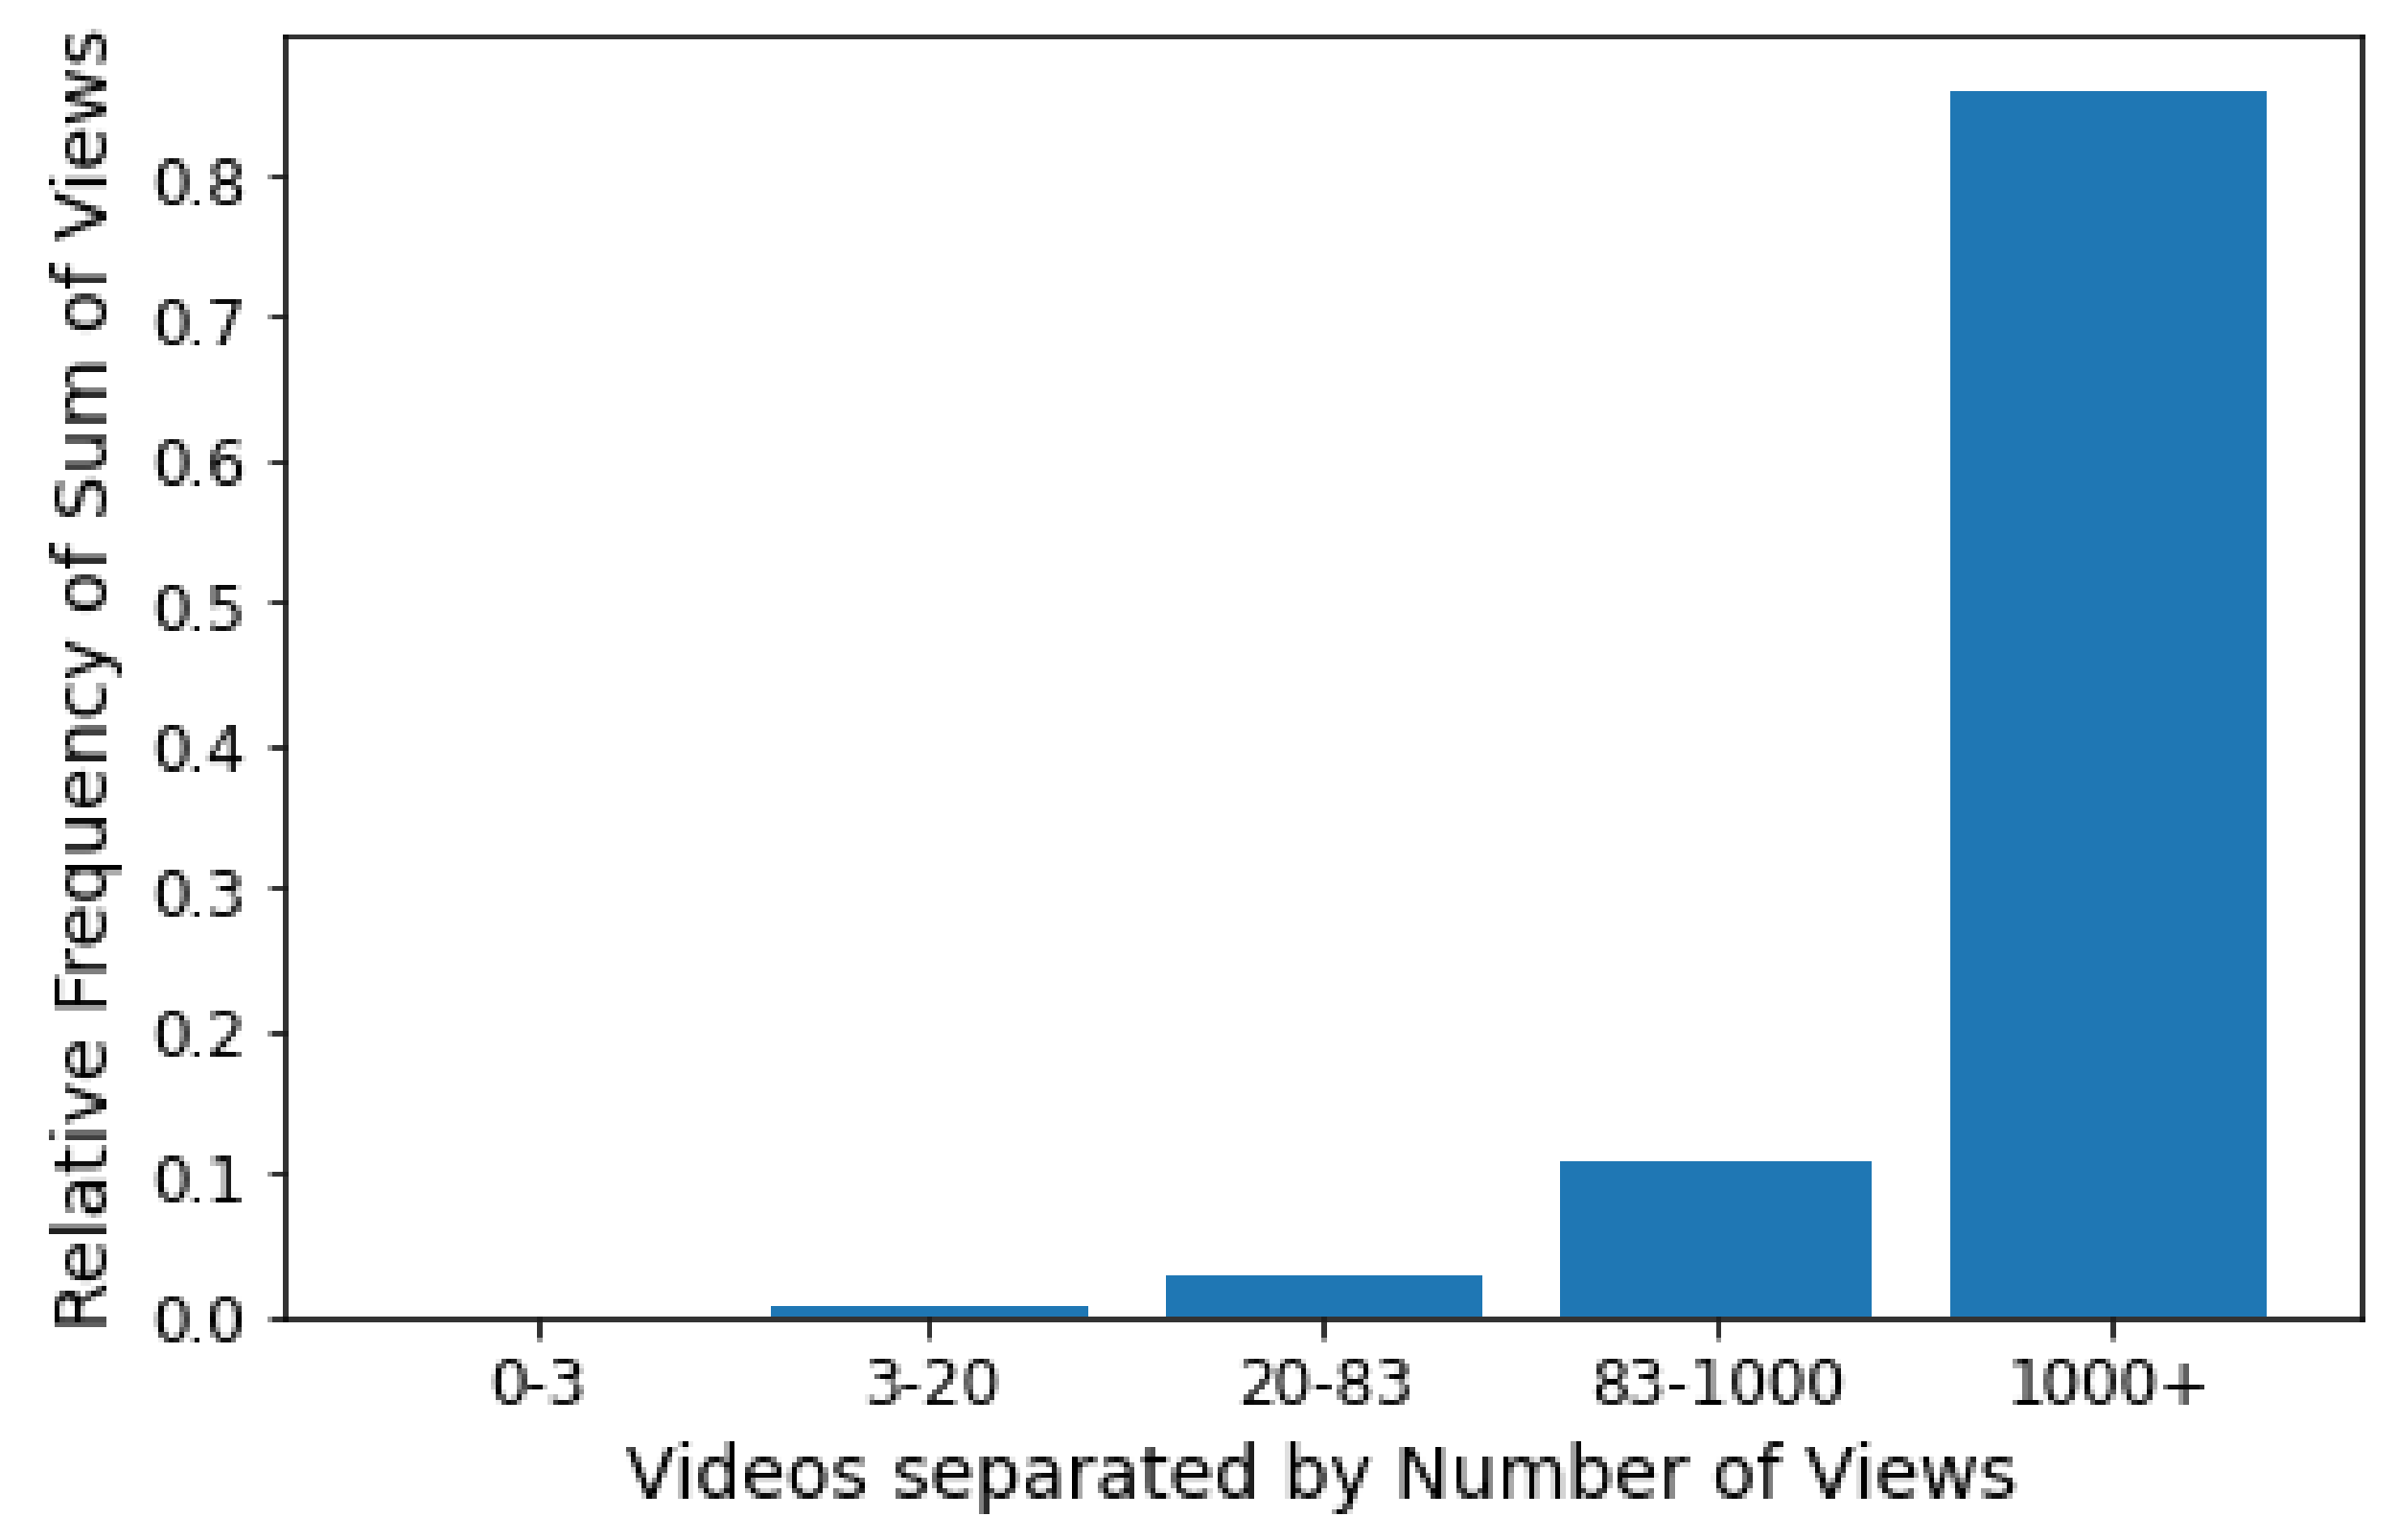
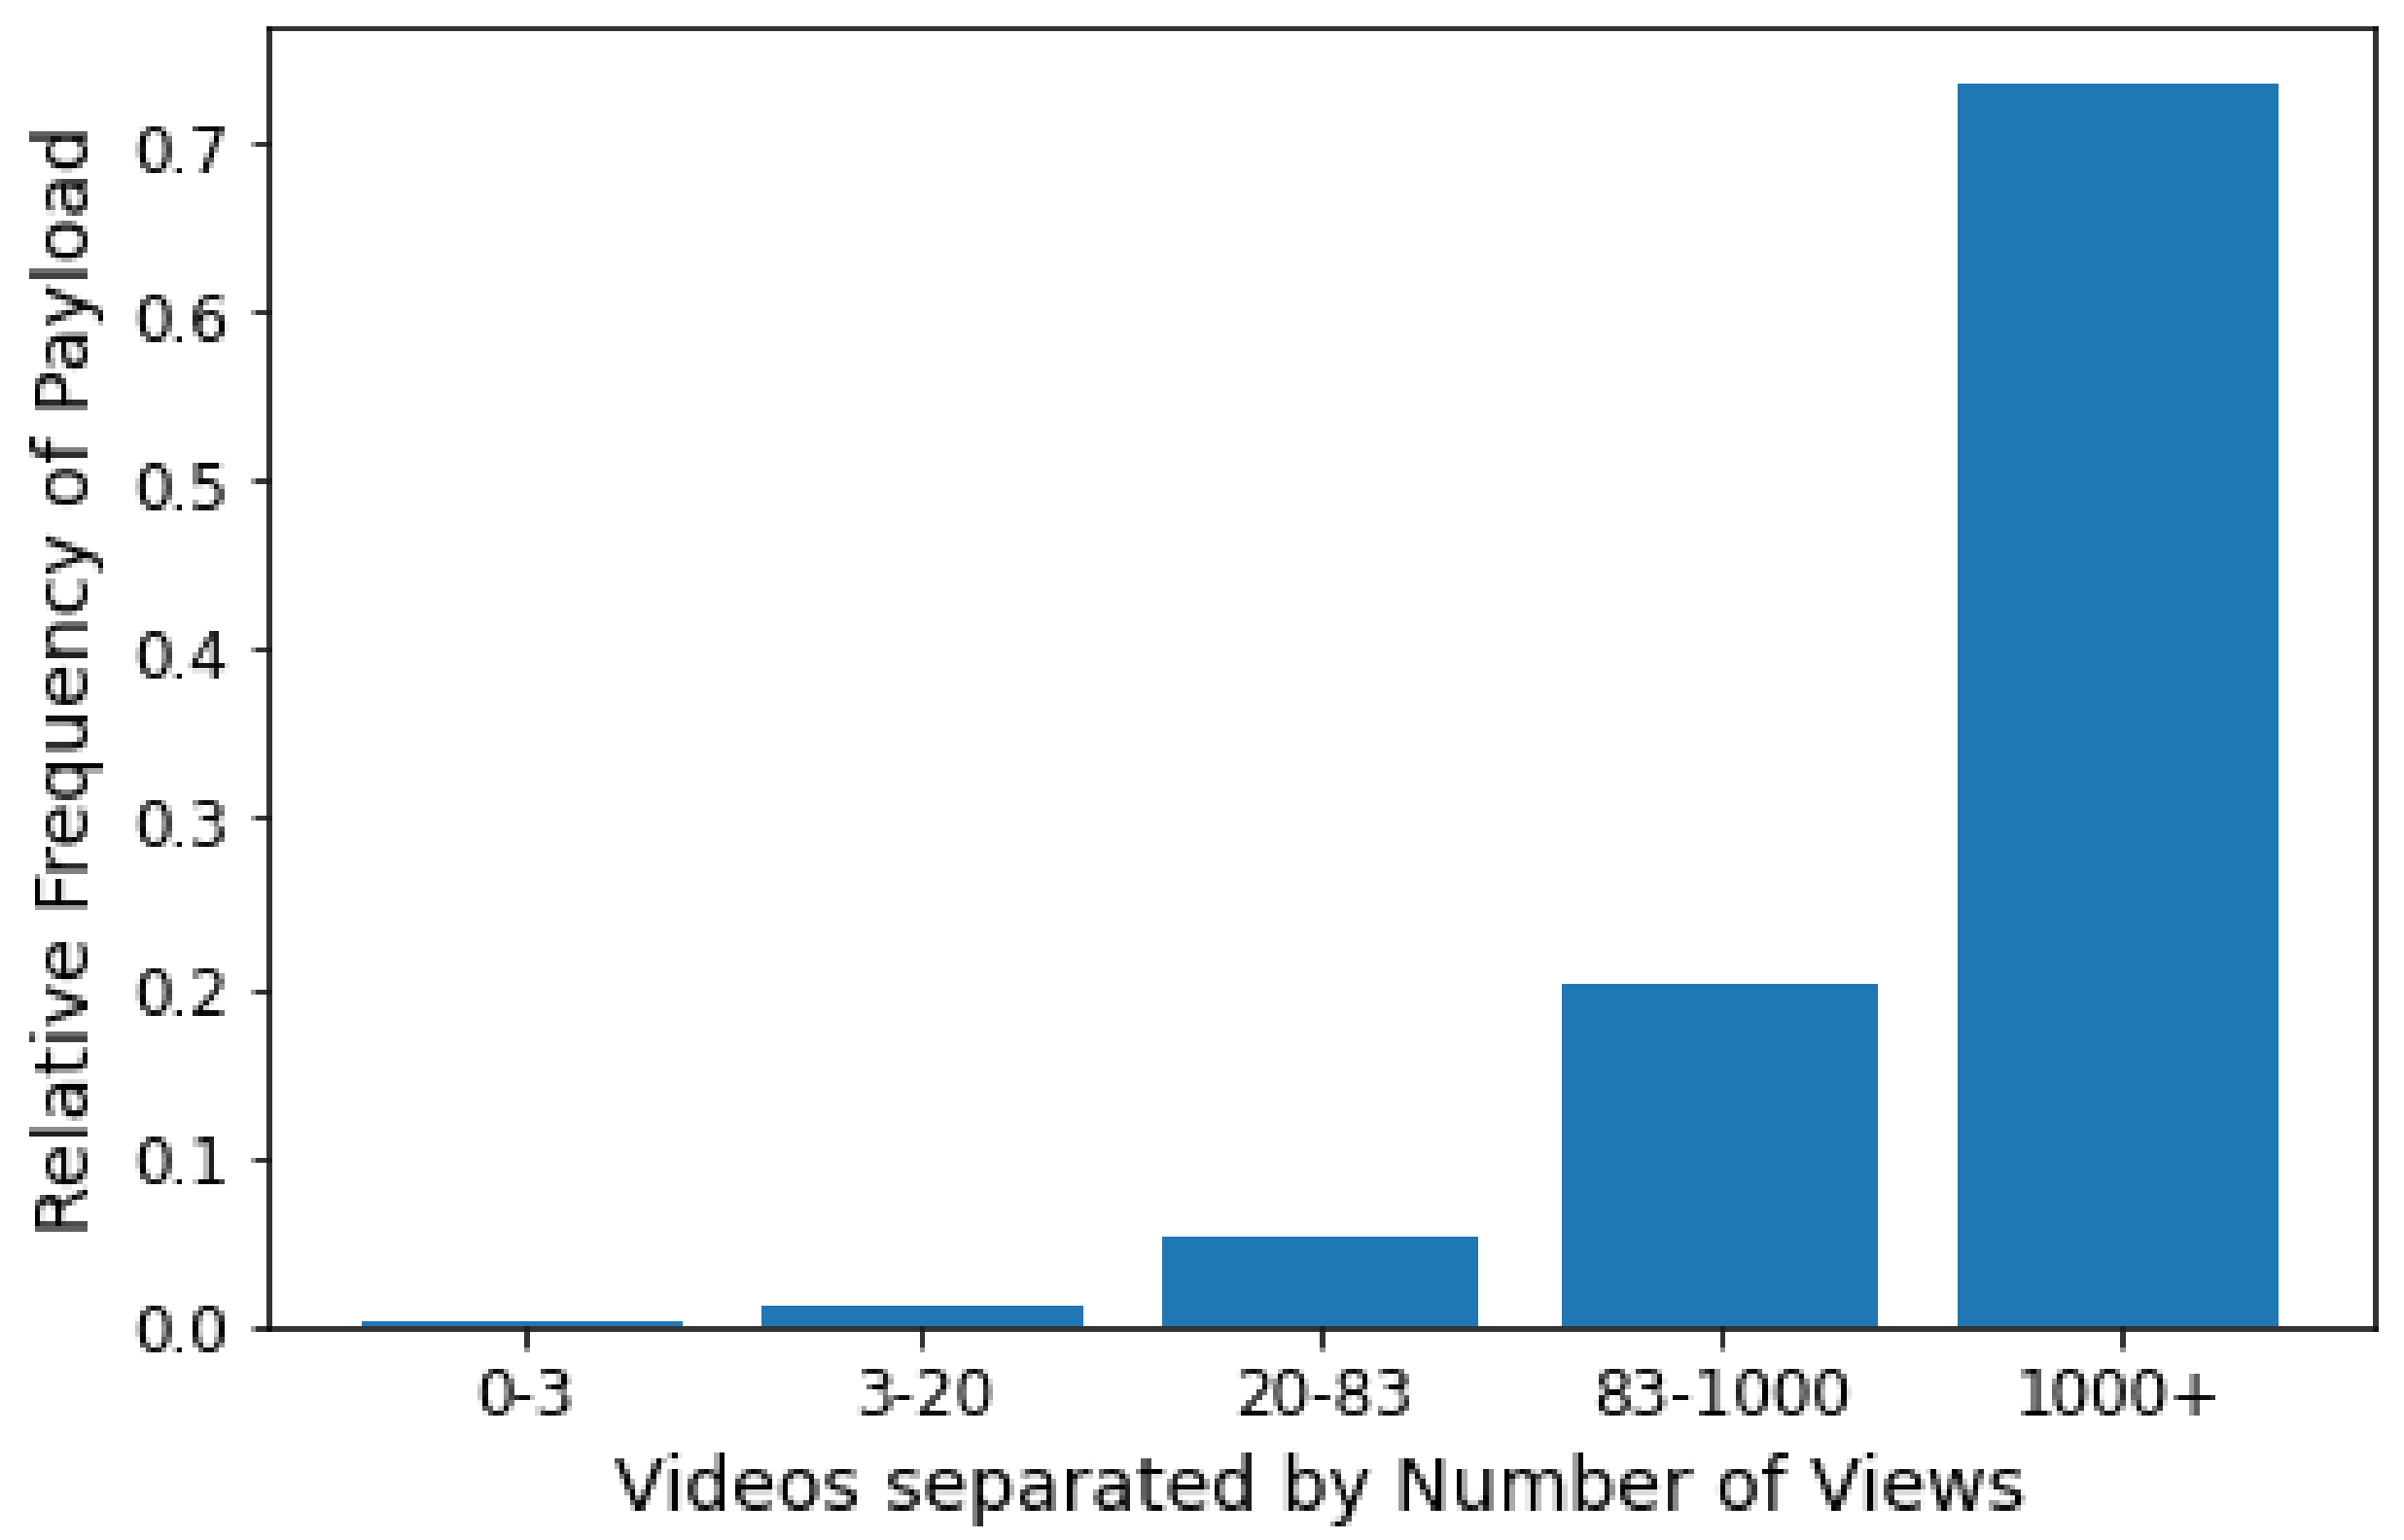
Data were collected from videos shared on Facebook from 1 June 2016 to 31 September 2016. Due to the massive difference in the videos’ number of views (videos with millions of views and videos watched less than 1000 times), authors used a logarithmic transformation. In addition, in order to reduce the bias introduced by the fact that content producers with a large number of followers attract a large number of views, the authors included in the standardization procedure the number of followers of producers [
11]. Thus, the normalized popularity score (
NPS) is calculated using Equation (
13):
After normalization, the dataset was divided into two classes: popular and non-popular. The normalized popularity median enables a balanced distribution of classes. The authors compared the proposed method with two traditional classifiers, namely, a logistic regression, and SVM with a radial base function. The input attributes to the classifiers are as follows:
HOG: a resource descriptor with 8100 dimensions called Histogram of Oriented Gradients [
63];
GIST: a resource descriptor with 960 dimensions [
64];
CaffeNet [
65]: a vector of features with 1000 dimensions extracted from a convolutional network;
ResNet: a vector of features with 1000 dimensions extracted from DNN [
66].
The Popularity-LRCN surpassed the other methods reaching 70% accuracy. The way that came closest was the SVM when used with features from CaffeNet or ResNet, which had an accuracy of approximately 65%. Features from HOG and GIST had less influence on the final result, reaching a maximum accuracy of 60% with logistic regression and SVM and emphasizing that Popularity-LRCN used raw frames without performing attribute engineering.
We present the main popularity classification methods found in the literature. We observed that most of them rely on the extraction of attributes through NLP techniques, even when analyzing videos’ popularity. Recently, Trzcinski et al. [
11] presented a model that extracts features directly from the videos, expanding the search horizon.


