
The Amber-Colored Liquid: A Review on the Color Standards, Methods of Detection, Issues and Recommendations


 , , and
Abstract
1. Introduction
2. Review Methodology
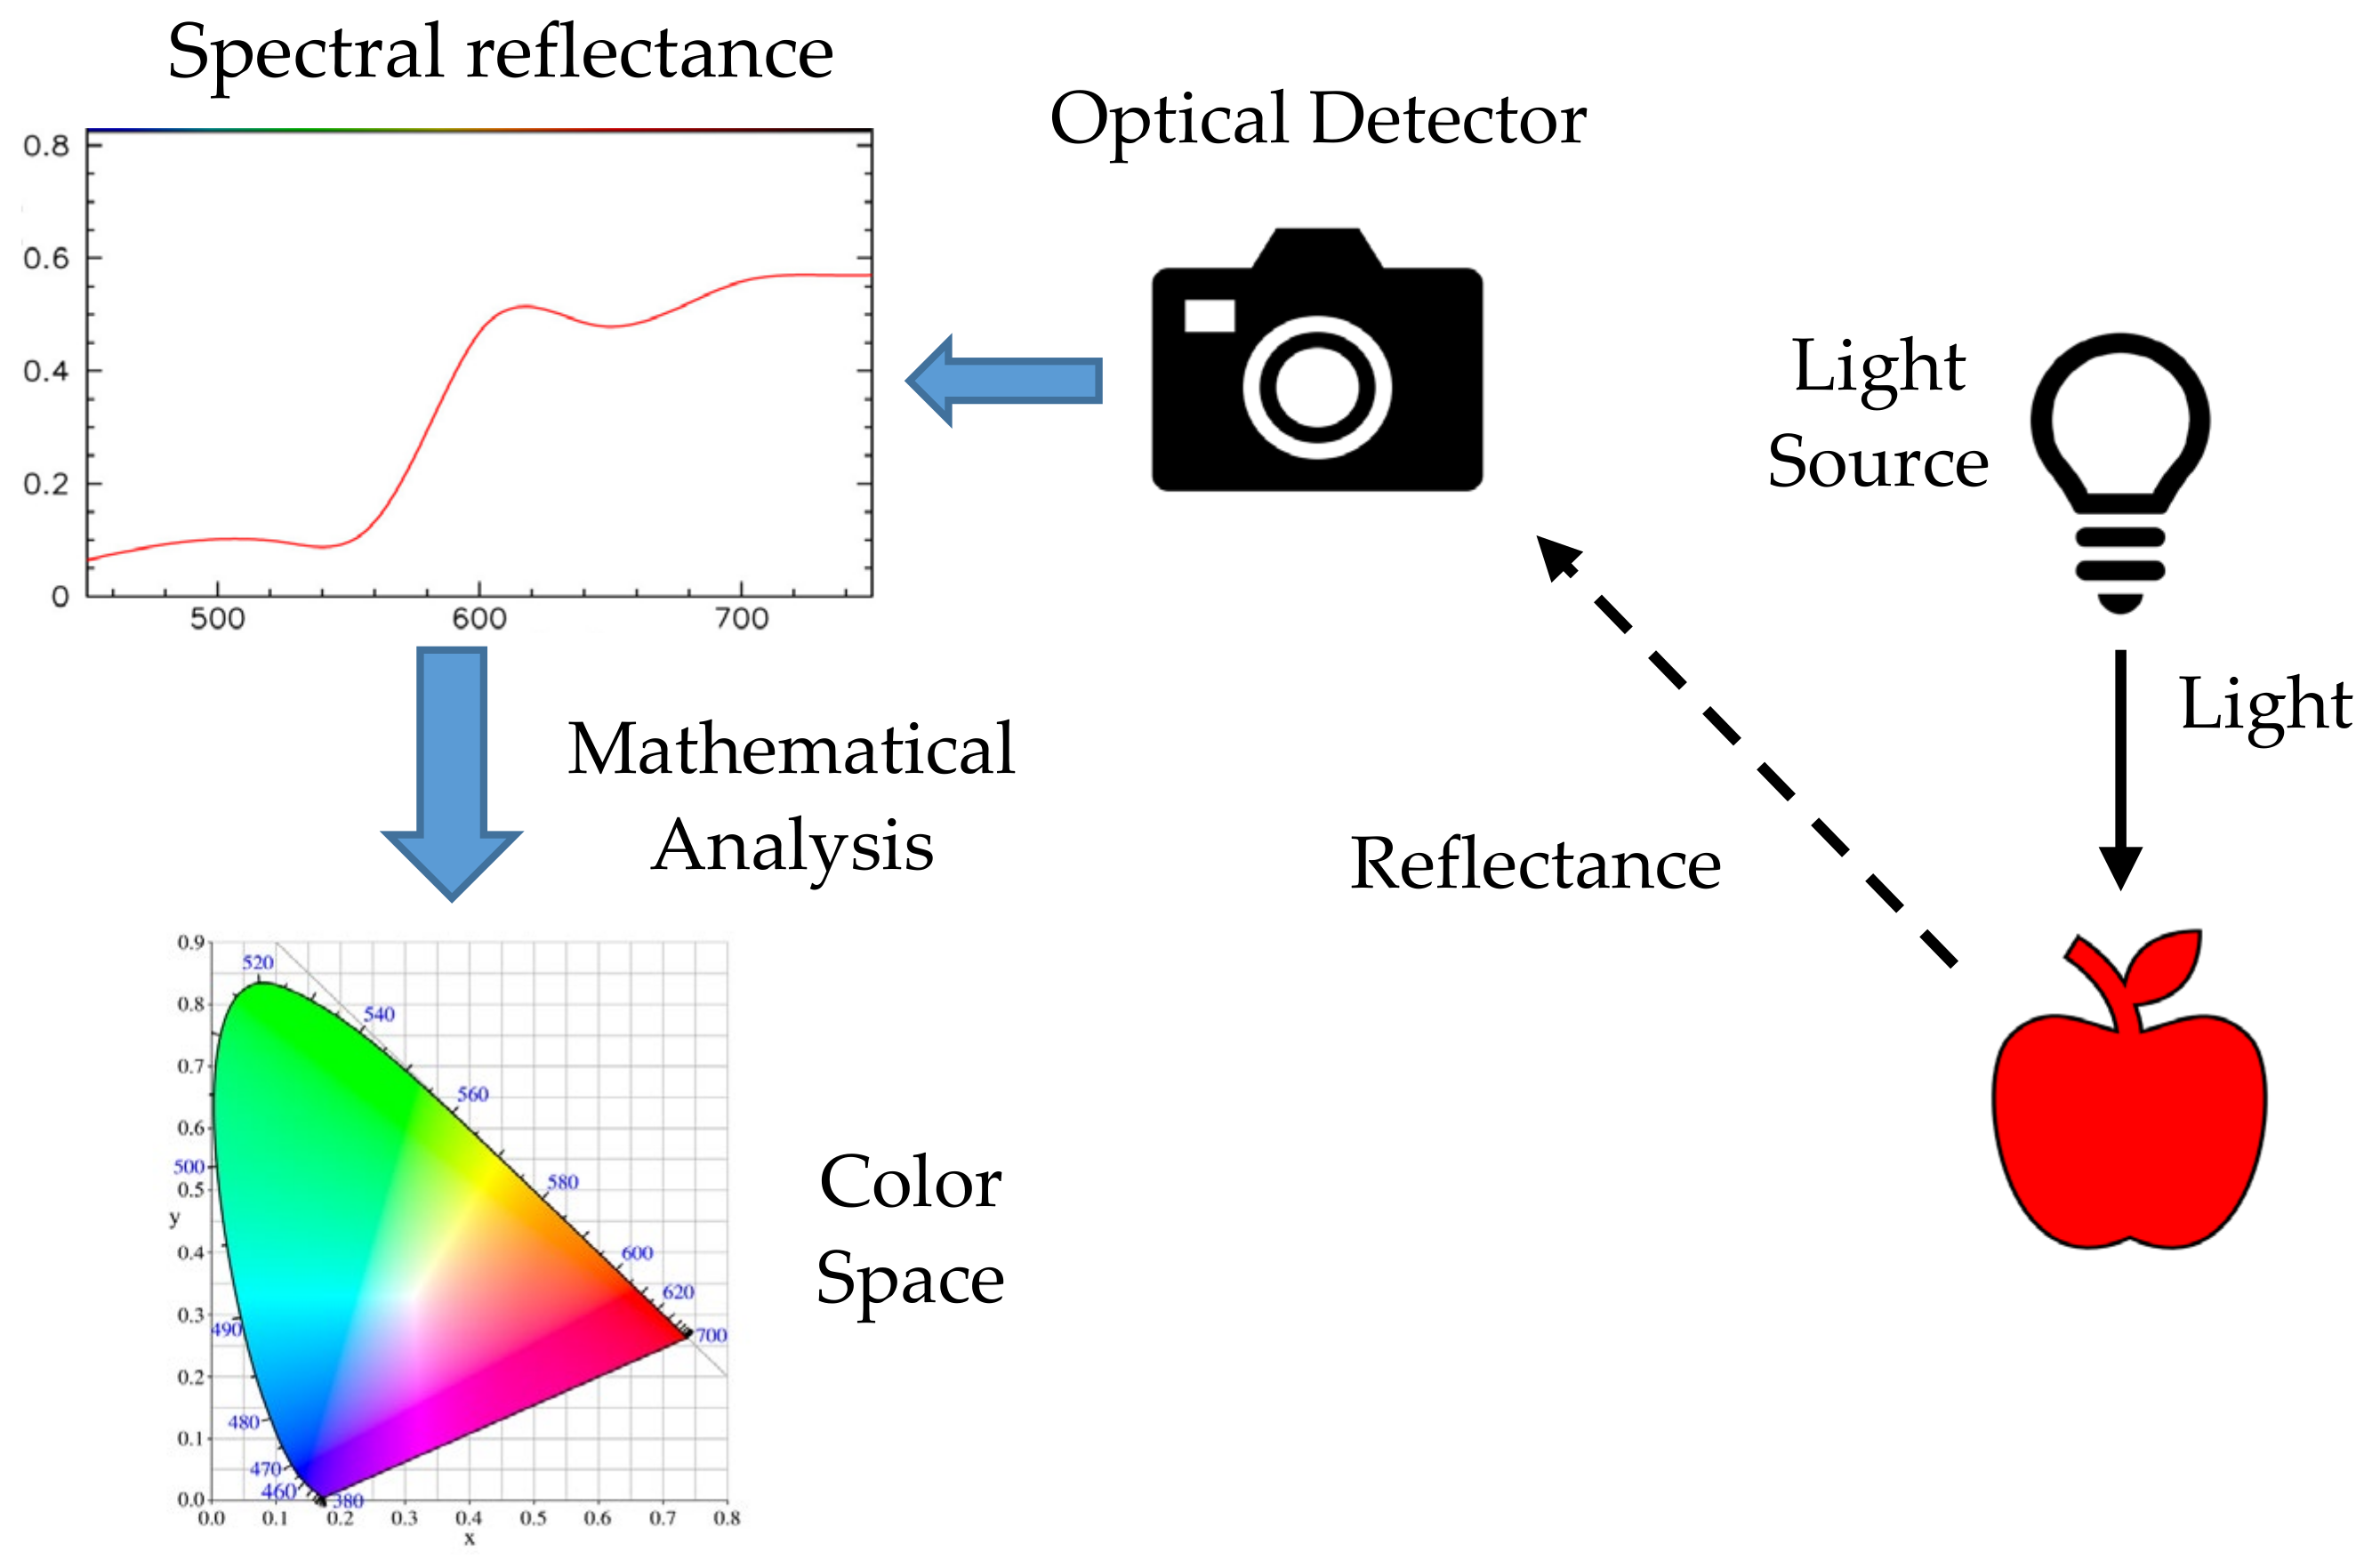
3. International Standards for Color Determination
3.1. CIE Values
3.2. Lovibond RYBN
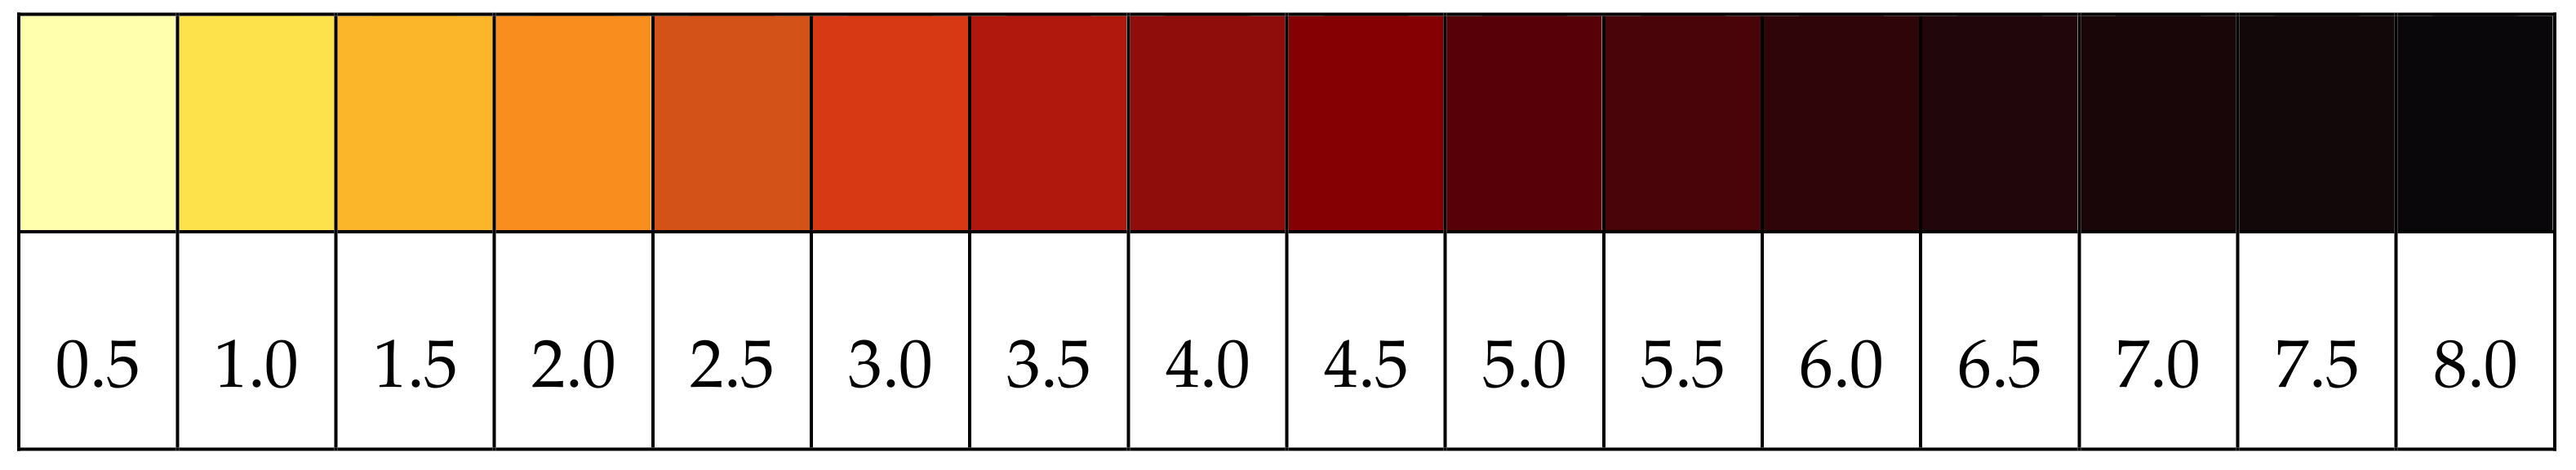
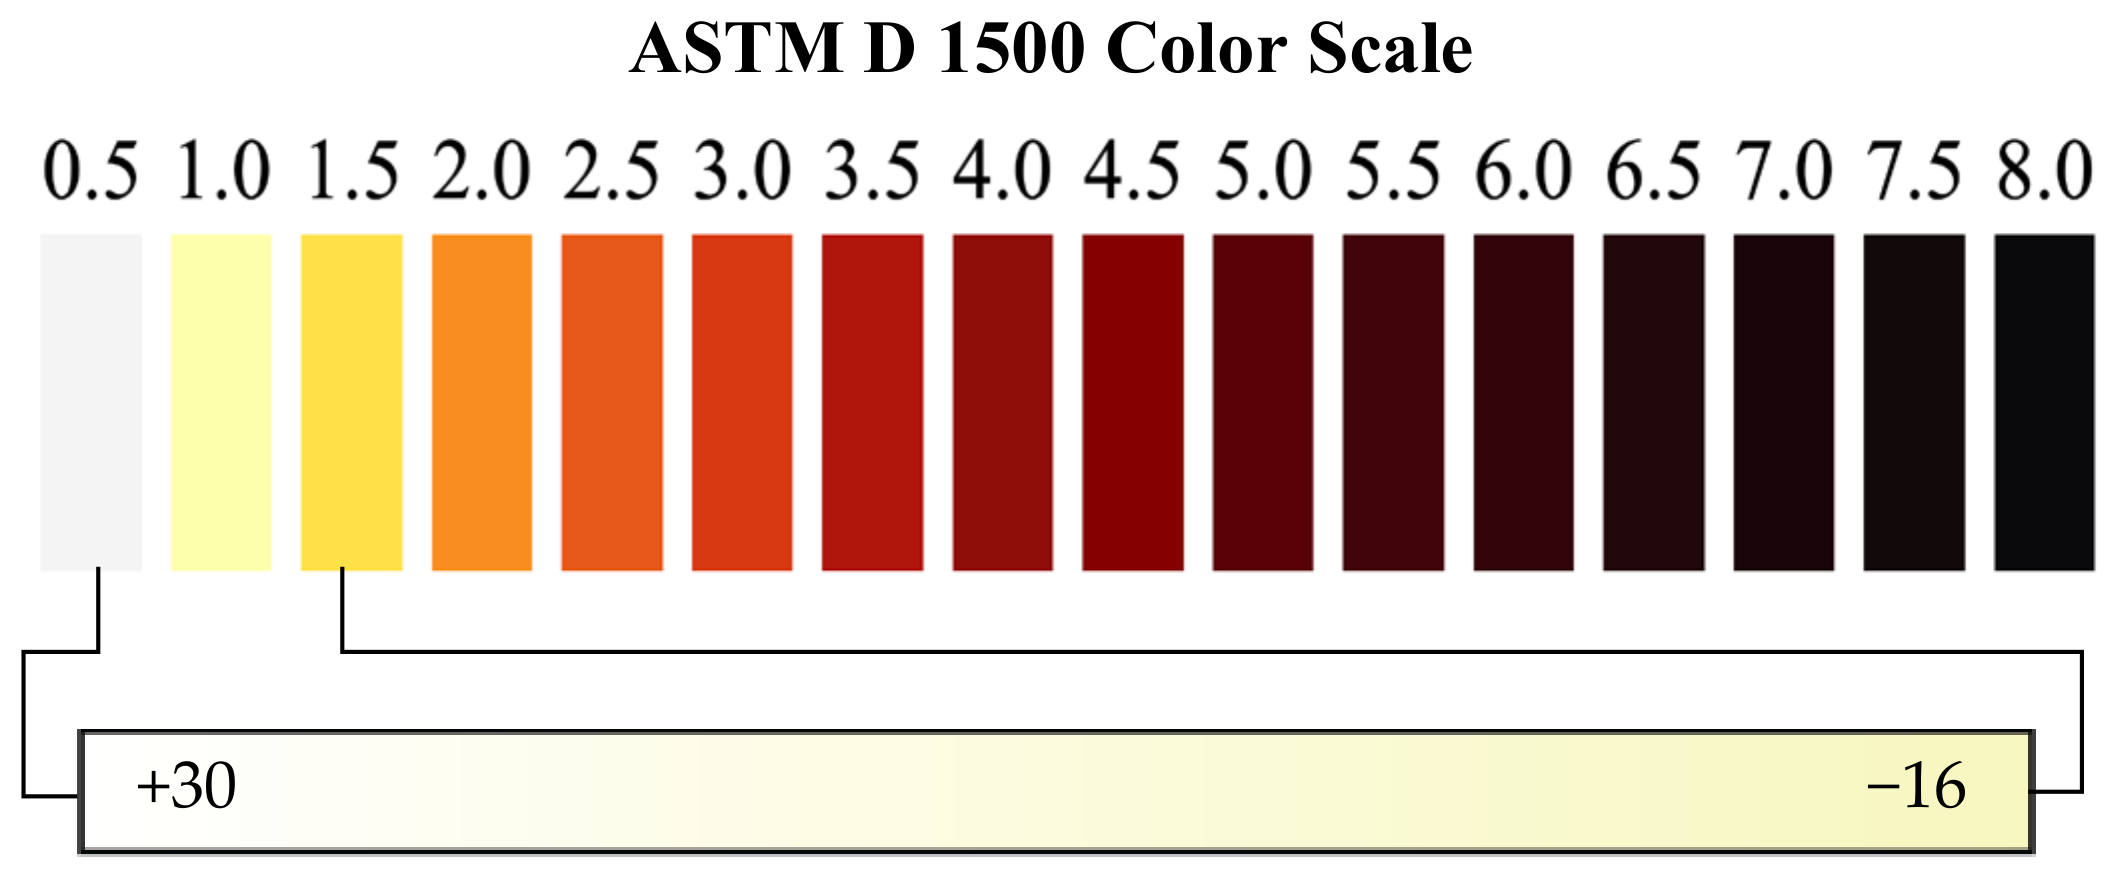
3.3. ASTM Scales
3.3.1. ASTM D 1500
3.3.2. Saybolt Color
3.3.3. Gardner Color
3.4. Pfund Scale
3.5. Beer Color Scale
3.6. Maple Syrup Color Scale
4. Methods for Color Measurement
4.1. Subjective Methods
4.1.1. Visual Examination
4.1.2. Visual Color Comparator
4.1.3. Visual Colorimeter
- i.
- Palm Oil
- ii.
- Chia Seed Oil
- iii.
- Mustard Seed Oil
4.1.4. Issues and Challenges
4.2. Objective Methods
4.2.1. Automatic Color Comparator
4.2.2. Photoelectric Colorimeter
- i.
- Nut Oil
- ii.
- Chia Seed Oil
4.2.3. Optical Spectroscopy
UV-Vis Spectroscopy
- (A)
- Mineral Oil
- Diesel OilThe color of diesel oil was determined through the spectroscopy method in the range of 400–700 nm, where the relationship between the transmittance area and the color of the diesel oil in accordance with ASTM D 1500 was identified [67]. A model was used from the transmittance area values to create an analytical curve. Using this method for 505 diesel oil samples, 96.8% accuracy was obtained when the results were compared with the conventional method of a manual colorimeter.In another study, the color index of metropolitan diesel and interior diesel was determined through combined calibration with PLS to molecular spectrophotometry. In addition, the subjective characteristic of ASTM D 1500 can be eliminated through the UV-Vis spectroscopy method, even if there is a presence of red dye in the interior diesel oil [68]. Corgozinho et al. (2009) developed two calibration models of partial least square regression to correlate the predicted values and the real values of ASTM color [68]. It was found that the coefficients of linear correlation were 0.9956 and 0.9966 for metropolitan diesel and interior diesel, respectively. The findings obtained from both studies showed that there were significant differences in the transmittance spectra for a different color index of diesel oil. As the color index of diesel oil increases, the transmittance spectra decrease.
- Transformer OilAn improvement on the UV-Vis spectroscopy approach related to ASTM D 6802 involves introducing an ANN to estimate the remnant lifespan of transformers [69]. The spectral response of the insulating oil can be instantly measured with cheaper equipment, and anyone in the same field can conduct the test. Leong et al. (2018) have proven the possibility of applying this technique to develop a portable device that can measure the color index of transformer insulating oil on-site in accordance with ASTM D 1500 [11,70]. The regression technique was used to obtain the best representation of the relationship between the absorbance, cutoff wavelength and color index. A mathematical model based on the regression analysis was developed that described the relationship between the area and color index of the transformer oil as in Equation (7):CI = (9.017 × 10⁻³) AreaIt was found that the prototype produced accurate results in determining the color index of the transformer insulating oil with a smaller error in the color index compared with the conventional method of using a visual color comparator, with an RMSE of 0.6274.
- Lubricant OilRefined oil using active Ca-bentonite was evaluated using the spectroscopy technique by scanning in the wavelengths of 200–1200 nm [71]. The effect of the active substances can be observed in the refined oil’s color. However, the focus of this study was to identify the content of the refined oil.In another study, two single-wavelength LEDs at 590 nm and 840 nm were used to measure the color of lubricant oil according to the ASTM D 1500 color scale [72]. Two sets of optical systems were designed using two sets of light-dependent resistors (LDRs) and LEDs. One set was used to measure the color of the lubricant oil, while another set was for measuring the turbidity and to correct the deviation in color scale readings due to turbidity. As the color index of the lubricant oil increases, the light intensity at the LDR decreases. The embedded system reads the transistor–transistor logic pulses from the sensors, counts the pulse frequency and converts the number into a color scale before displaying the results on the LCD. The different color indexes of lubricant oil can be differentiated, as different colors will give different frequencies. The schematic diagram of the experimental set-up can be found in [72]. This method eliminates the use of a spectrometer, making the system compact.Another system to monitor the color of engine oil only makes use of a single light source, turbidity sensors and microcontrollers to measure the amount of light absorbed by the oil [73]. The light source used was a white LED placed directly facing the sensor with the oil samples in between. The sensor measured the amount of light that was scattered by particles in the oil. The turbidity level of the engine oil increased as the amount of particles in the oil increased. This was due to more light being scattered by the particles in the oil. Then, the microcontroller processed the value from the sensors and lit up an LED to indicate the condition of the engine oil. However, no accuracy testing or further analysis was conducted in this study to support the invention.
- Hydraulic OilA color change detecting device for synthetic hydraulic (SHD) oil was developed using LEDs as the light source and photodiodes of three sensing elements [74]. The color ratio (CR) and total contamination parameters based on the transmitted light intensity passing through the oil were used for chemical contamination assessment. The color sensors detected the light and measured the luminous intensity in red, green and blue wavelengths.Figure 6 shows the diagram of the instrumental set-up for the CR detector application. However, for the SHD-1 oil, the CR showed a more unambiguous indication of oil degradation compared with the total contamination index (TCI) detected by all three RGB wavelengths shown in [74]. This shows that color is vital in determining the condition of the oil. TCI-R is the total contamination index for red-wavelength, TCI-G is the total contamination index for the green wavelength, and TCI-B is the total contamination index for the blue wavelength.
- (B)
- Vegetable Oil
- Olive OilOlive oils produced from different origins have different color spectra [75], where color is statically analyzed and correlated to the phenolic compounds and environmental parameters. Color measurement using the spectroscopy method, where the color is expressed in CIE L*a*b* values, is commonly used [15,76,77,78]. A 5-mm path length cell was proposed, as it allowed reliable measurements of even the darkest color of virgin olive oil samples [77]. A different thickness of the oil sample holder can also affect the light measured [15,77]. Furthermore, the study on the color of olive oil through characteristic vector analysis was applicable to the reconstruction of olive oil sample transmittance spectra, and the use of the transmittance spectra was sufficient for a close approximation when the measurements were made with 5-mm path length cells [15].A method for the numerical description of virgin olive oil with only two absorbance measurements at 480 nm and 670 nm from a spectrophotometer was also proposed [76]. The light detected was expressed as CIE L*a*b* values, and the polynomial expressions were obtained with chromatic coordinates and chroma as input data. olive oil.Table 11 shows the equations developed for estimating the chromatic coordinates and the chroma C of the olive oil.A new color scale standard, the Modified Uniform Oil Color Scale (MUOCS), was developed based on a unique set of 1700 virgin oil samples [79]. This newly proposed standard has 60 color scales, which consist of a 3-number code representing lightness (1–14), green (2–16) and yellow (1–14) values. This MUOCS is an improved version of the previous color scale, the Uniform Oil Color Scale (UOCS), and Bromthymol Blue (BTB). A portable device that adopted this new color scale was developed as shown in [79]. This device used a white LED as a light source and a detector sensitive in RGB regions that simultaneously measured the RGB color coordinates of the incident light. Although this device can measure oil in the MUOCS accurately, the differences are significant when compared with the results obtained from the commercial spectrophotometer.
- Palm OilThe color of palm oil not only affects the customer preferences [80] but also serves as an indicator of the levels of the chemical contents, such as the free fatty acid content [24,53,80,81] and total carotenoids [24,82]. These chemical contents determine the quality of the palm oil after a certain refining process. The overall minimum requirement for the free fatty acid content (as palmitic acid) in crude palm oil (CPO) set by the Palm Oil Refiners Association of Malaysia is 5%. They should be less than 0.1% in RBD oil [83].The automated colorimeter based on the UV-Vis spectroscopy technique was proposed by Tan et al. (2004) to determine the Lovibond color of palm oil, refined palm oil (RPO) and refined palm olein (RPOo) [80]. Three light sources of red (R), green (G) and blue (B) LEDs were used with a microprocessor to process all the digital signals and correlate with the Lovibond color units (red and yellow units). The values obtained from the signal processing were compared with the predetermined scale of the color and path length. The readings from the proposed colorimeter were calibrated, and appropriate software using an ANN was used to calculate the Lovibond value. The comparison between the automatic and manual instrument measurements showed an acceptable R2 value of 0.9236 for the red color and 0.7974 for yellow. The developed automated colorimeter instrument showed good results in determining the color of palm oil according to the Lovibond scale. The color analysis was carried out according to ASTM D 6045 using a UV-Vis spectrophotometer. The CIE L*a*b* values were analyzed to study the effect of bentonite on the flashpoint, density and color as refining agents in waste cooking oil [84]. However, a clear relationship between the changes measured in the flashpoint, color and the composition of the waste cooking oil after bentonite was added could not be easily identified.
- Sunflower OilAn in-line measurement system of sunflower oil color using 8 LEDs was developed [85]. This allowed measurement of transmission and reflection at four wavelengths: red (R), green (G), blue (B) and near-infrared (NIR). The RGB light was used to obtain the sunflower oil color, while the NIR light was used to determine the bubble-related scattering effect. A block diagram on how the in-line system works can be found in [85]. The direct method and indirect method were performed for the calibration of the in-line equipment with a Lovibond tintometer.
- Nut OilThe impact of roasting on the composition and quality of cashew nut oil was investigated by Liotrakoon et al. (2016) [86]. The total color change value was calculated based on the standard definition of the CIE L*a*b* color difference to observe the differences in the oil color with and without the roasting process. The oil that was extracted from the roasted nut was browner and affected the oil content. The equation for this determination is shown in Equation (8):where , and denote the color parameters of the unroasted oil and L*, a* and b* indicate the color parameters of the roasted oil. It was found that the total color change value increased from 3.92 to 8.18, showing that the roasted cashew nut oil was darker than the unroasted cashew nut oil. The higher the total color change value, the bigger the difference in color.However, the roasting process of the nut caused significant losses to the bioactive compound in the oil. Al-Bachir (2015) investigated the effect of gamma radiation and storage on the peanut oil characteristics and found that the color was only affected by the storage period [21]. A spectrophotometer colorimeter with CIE L*a*b* values was used for color determination in both studies.A comparison of two methods for measuring the quality of walnut oil, where one of the parameters for quality assessment was the color of the oil, was conducted [87]. Table 13 shows the standard color for walnut oil. The Lovibond colorimeter and spectrophotometric method with absorbance measured at several wavelengths were investigated. The photometric color index (PCI) was calculated using Equation (9) with the data obtained from the spectrophotometric method:where PCI is the photometric color index and A is the absorbance reading at wavelengths of 460 nm, 550 nm, 620 nm and 670 nm. Physicochemical and biochemical changes could be quickly determined using the Lovibond and photometric methods.PCI = 1.29 (A460) + 69.7 (A550) + 41.2 (A620) − 56.4 (A670)
- Linseed OilThe color of linseed oil was evaluated to observe changes in color during periodical heating [19]. Measurements using a spectrophotometer in the visible wavelength range (320–700 nm) was performed. The area under the absorption curve indicates the concentration of the coloring matter in the oil. Sixteen readings of optical density were obtained from 400 nm to 550 nm, with a resolution step of 10 nm. The sum of the 16 readings was then multiplied by 10 to give the approximation for the area under the absorption curve. Two groups of linseed oil samples (stripped and non-stripped) were analyzed individually in triplicate. The results were reported as the mean ± SD. Table 14 shows the color indexes of both groups of samples of linseed oil as measured, where the values are presented as the mean ± SD. The color index was based on a previous study [88] and not a color scale introduced by any authorized bodies.
- (C)
- HoneyThe color of honey ranges from colorless to amber tones and almost black. Usually, bright yellow, greenish or reddish colors are more typical for honey. The color of honey depends on the nectar that has been gathered by the bees. This is because different nectar has different organic and chemical compounds. The color of honey, however, can change with time when exposed to high temperatures [35]. Honey becomes darker when stored at a higher temperature. After some time, the stored honey may granulate, producing crystals. The different sizes of crystals produced can affect the color of the honey. Many variables causes the variation of honey’s color, such as its origin and bee species, in addition to being affected by the weather, processing, packaging and storage [89].Al-Farsi et al. (2018) measured the absorbance at a wavelength of 635 nm [90], while Moniruzzaman et al. (2014) measured the absorbance at 450 nm and 720 nm [91] to determine the color intensity by using a spectrophotometer in accordance with the Pfund scale. A positive correlation between the color, flavonoids and phenolics was observed in both works. The color intensity of the honey increased with higher phenolic and flavonoid contents in the honey. Table 15 shows the correlation established by Al-Farsi et al. (2016) between the color, flavonoids, phenolics and antioxidants. It was found that the darker color of honey was due to the presence of high concentrations of flavonoids and phenolics that increased the number of antioxidants, thus indicating the better qualities of the honey.Another study also measured the color of honey, expressed in CIE L*a*b* values. The results were compared with the conventional method using Lovibond with different background colors [92]. The CIE L*a*b* values obtained from the light intensity based on the UV-Vis spectroscopy technique managed to obtain a strong correlation between the phenolic content and antioxidant activity of honey [93]. Other than that, it was also useful for identifying different types of honey. The honey samples were divided into two groups—bright honey (black locust, goldenrod, rapeseed and lime) and dark honey (buckwheat and heather)—as shown in Table 16. Based on the analysis in correlating the CIE L*a*b* values with the phenolic content and antioxidant activity, good R2 values of 0.9383, 0.9235 and 0.9116 for the L*a*b* values were obtained.
- (D)
- Maple SyrupDifferent grades of maple syrup have different usages in the food industry. Each color grade of maple syrup has unique flavor characteristics. Therefore, the color determination and color grading of maple syrup plays an important role in the customer’s decision-making process.Measuring color by calculating the light transmittance at 560 nm using a spectrophotometer has been studied by several researchers. This was to investigate the effect of air injection on the color [20], investigate the effect of processing parameters (residual pressure or vacuum in the evaporator-crystallizer, mixing speed of the massecuite and crystal growing time) on the crystallization yield, sugar particle size and color of the final sugar [94] and investigate the effects of processing, the production site and the harvesting period on the quality variation and its relationship to the microbial population [95]. Although these studies were meant to investigate the different effects of processing parameters on the maple syrup color and condition, the color measurement method followed the standard protocol introduced by the USDA [37]. The percent of light transmitted through the sample was measured with a spectrophotometer using a 10-mm cuvette at a wavelength of 560 nm.
- (E)
- BeerFinding tristimulus and chromaticity values using light transmission measurements at several wavelengths were first proposed in 1992 by S.M. Smedley [96]. Transmission measurements were conducted at 360 nm, 450 nm, 540 nm, 670 nm and 760 nm on an undiluted beer in a 25-mm path length cell. Curvilinear interpolation was applied to the measurements to generate a set of calculated transmission values at 10-nm intervals in the range of 360–780 nm. Lastly, the tristimulus values were calculated from the set of interpolated transmission values. By using the CIE color matching functions for a secondary observer and the spectral power distribution for CIE Standard Illuminant C., the tristimulus values could then be converted into the desired subset parameters, such as CIE L*a*b* values.Since the utilization of tristimulus values to measure the color of beer has been introduced, many studies proceeded to use the same CIE L*a*b* values. However, there are still differences in terms of measurement methods. One study on the characterization of beer using diffuse light absorption spectroscopy in visible and near-infrared bands. The light detected was expressed in tristimulus color values in the form of a data matrix, and correlation with turbidity and a refractive index was created [97]. The classification of the beer was determined according to its class. The schematic diagram of the set-up for diffuse light absorption spectroscopy using optical fiber technology can be found in [97]. Nearly all the light reflecting on the surface of the sphere is diffusely reflected, and the addition of an absorbing sample in the cavity results in a decrease in the sphere’s radiance, regardless of other scattering effects caused by suspended particles in the sample.Although color determination through the absorbance measurement at 430 nm shows promising results, the other wavelengths that were not detected by the spectrophotometer seem impractical. An investigation on utilizing a single-wavelength LED with a peak wavelength of 430 nm as the light source for a low-cost spectrophotometer for the measurement of beer color based on the EBC method was performed [98]. The device used a photodiode as the detector with a peak spectral response at 436 nm, and a microcontroller was used to obtain the calibration curve equation. A power regression was chosen as the calibration curve, obtaining a coefficient of determination R2 of 0.9677 for the VLOW forward voltage and 0.9963 for the VHIGH forward voltage. VLOW and VHIGH are the luminous intensity for the radiant source. Corresponding to a forward voltage of the LED, VLOW = 3.3 V for the lower intensity, and VHIGH = 4.0 V for the higher intensity. Figure 7 shows the block diagram of the proposed low-cost spectrophotometer.Koren et al. (2020) found that the color determination using CIE L*a*b* color space parameters calculated from the transmission spectra measured in the visible range (380–770 nm) could identify beer color more objectively compared with the absorbance method [99]. This was due to a clear difference between the transmission spectra for each beer that could be observed through the CIE L*a*b* values and the different raw materials in the beers, which contained various coloring compounds. It was found that one wavelength measurement from the absorbance method was insufficient to describe the accurate color of a sample, even if it was a traditional beer type. The color of the beer was first determined according to the standard Analytica-EBC color-measuring method. The transmission spectra were obtained using a spectrophotometer. The tristimulus values and chromaticity coordinates of the samples were calculated from the transmission spectra as defined in the CIE 1931 standard colorimetric system based on the description of the Commission Internationale de l’EćlaiZrage. The values were then converted into CIE L*a*b* values. With the CIE L*a*b* values, the absolute L*a*b* color between two samples was calculated and then compared with the EBC values. Table 17 compares the EBC difference and absolute L*a*b* differences of the beers. From the table, the absolute L*a*b* difference between the same beer category showed a larger value compared with the EBC difference. Zhu et al. (2013) found that if the absolute L*a*b* values were less than 1.5, it meant that there was almost no difference, and if the absolute L*a*b* values were more than 1.5, it meant that there was a slight difference. Meanwhile, if the absolute L*a*b* values were more than 3.0, it meant that there was some difference, and if the absolute L*a*b* values were larger than 6.0, it meant that there were significant differences between the colors of the beer samples, although they were in the same category [100].
Fluorescence Spectroscopy
Image Analysis
- (A)
- Lubricant OilA study by Anacan et al. (2018) investigated developing a machine vision system that scanned a car oil’s engine using LabVIEW software through image processing [109]. The system computes the light intensity from three LEDs (white, red and blue) reflected from the measured sample. The color frequency intensity (CFI) sensor was designed to measure the light intensity of the LEDs. The system developed by Visual Instruments in LabVIEW will then automatically show the status of the engine oil in terms of color, light intensity that can pass through it and its viscosity. The diagram of the system set-up for image acquisition of the engine oil samples can be found in [109].
- (B)
- Vegetable Oil
- (i)
- Palm OilImage analysis enables the color detection of cooking oil, where it reads the RGB color values of the sample [81]. Images were taken by an RGB camera and processed in MATLAB software for the extraction of RGB values as shown in Figure 11. The images were then preprocessed by resizing the sample images to obtain uniformity, followed by converting the colored image to grayscale before the edge detection operation. Edge detection is a process for finding the boundaries of objects within images. The preprocessing stage is to ensure the pictures obtained have the same dimension and traceable boundaries before extraction of the sample’s RGB color. In this study, two simple feed-forward ANN models were used to classify the quality of reused cooking oil. One model used TPM, organic vapor gas and methane as inputs, while the other model used the three RGB values as inputs.
- (ii)
- Cotton OilCotton oil is commonly used as a high-quality standard for measuring the quality parameters of other vegetable oils, such as flavor and odor quality. Its mild taste and odor give features of virtually every imaginable food application. The degree of cotton oil’s color depends on the stage of the refinement process like most oils. The six phases of the cotton seed semi-refined process, along with its changing color, are shown in Table 18.The primary colors of red, yellow, blue and neutral were analyzed for the classification of cotton oil using image processing techniques through the oil color [110]. The colors were extracted from the image captured using the system based on Figure 12. From the color information obtained, the classification of the oil was performed using several classifier models such as K-Nearest Neighbor (KNN), Quadratic Discriminant Analysis (QDA) and the Extreme Learning Machine (ELM) [110]. An ELM neural network produces the highest average accuracy of 95.8% due to its capability to learn based on the training data provided.Table 19 shows the percentage of accuracy for each model in the classification of the cotton oil based on the stages of the semi-refining process.
- (C)
- HoneyThe image analysis technique to determine the color of honey has also been studied by Shafiee et al. (2013) [106] and Dominguez and Centurión (2015) [36]. Shafiee et al. (2013) used machine vision to assess the color of honey that is independent of the individual tester’s experience [106]. The machine vision system consists of a light source, an image capturing device, an image capture board and appropriate computer hardware and software. The image processing part involves image acquisition and smoothing and the conversion of RGB to a different color transformation. The post-processing part includes applying an ANN to achieve classification and prediction of several chemical components. Figure 13 and Figure 14 show the steps for the development program for honey classification using a machine vision system and a schematic diagram of the method for prediction of honey’s characteristics, respectively.However, Dominguez and Centurión (2015) proposed an analytical method based on digital image analysis combined with multivariate calibration to obtain a fast and objective measurement of honey’s color [36]. The Pfund color grader was used as the color reference for developing this technique. An image capturing device was developed where a camera was placed directly on top of the sample in the center of a circular daylight fluorescent lamp. Digital images from different samples of honey with different Pfund color values can be found in [36]. Through this technique, the illumination and the distance between the sample and the camera remained constant. The interior wall of the box was covered with white paper to prevent any light scattering.Data analysis of the images captured was conducted using selected regions of the images and histograms for each color channel. Table 20 shows the obtained results for the calibration models of honey samples in the test set using RGB, HSB and grayscale color models. The root mean square error of calibration (RMSEC) is the measurement of the average difference between the predicted and measured response values in the calibration stage. The root mean square error of cross-validation (RMSECV) is the measurement of the average difference between the predicted and measured response values at the validation stage, which explains the ability of the model to predict the color of a new sample. The bias also can be defined as the mean of the errors. Based on the table, the best calibration model was achieved by using the HSB model. Good correlation can be observed between the values obtained with the reference method and those calculated by the digital images of the HSB color model with an R2 value of 0.97 and root mean square error of prediction (RMSEP) of 2.46 [36].
- (D)
- BeerOther than the optical spectroscopy method, image analysis for color identification has also been investigated [6,111,112]. The information obtained from the images was used as the data for pattern recognition to categorize the beer into its color index according to the RGB channel [112]. Figure 15 shows the procedure for obtaining the image data matrix of the beer. Histograms of the frequency distribution of color indexes according to each RGB color channel were obtained for each digital image and decomposed into vector lines, with each vector having 256 components (indexes or color tones). Digital images of beer can be used to classify different brands of beer of the same type or category. The average histograms of the R, G and B color channels produced similarity patterns in the principal component score plot obtained from images produced on a desk scanner. The magnitude of the color index accompanied the color shifts in the principal component graphs in the principal component axes as a consequence of the average tone for each brand.Another color determination method has been investigated where the colors of beers were determined in two color scales—XYZ and CIE L*a*b*—through a spectrophotometer and digital imaging [111]. The beer color was first modeled by type (light, dark, fresh or with lemon) through step-by-step linear discriminatory analysis. K-means clustering was used to compare and classify the tested types of beer based on their commonality. Correlation and discriminant analyses were conducted to establish the types of beer, including the unknown samples. The proposed model can identify the types of beer and determine the closest group of beer that is not used in the model.
4.2.4. Issues and Challenges
5. Recommendations and Future Prospects
6. Conclusions
- Development of functional devices based on research outcomes to increase the probability of adoption by industries;
- Collaboration among researchers, accredited laboratories, standards or associations and industries in the validation and adoption of new technology;
- Focus the research work on an optical spectroscopy technique that utilizes single-wavelength or dual-wavelength approaches instead of the full visible waveband so that the optoelectronic components and cost can be significantly reduced;
- Fully exploit the computational power of modern microprocessors toward achieving the aim of minimizing the hardware and optoelectronic components.
Author Contributions
Funding
Acknowledgments
Conflicts of Interest
References
- Berns, R.S. Billmeyer and Saltzman’s Principles of Color Technology; John Wiley & Sons: Hoboken, NJ, USA, 2019. [Google Scholar]
- Fairchild, M.D. Color Appearance Models, 2nd ed.; John Wiley & Sons: Hoboken, NJ, USA, 2013. [Google Scholar]
- Tintometer Group. A Guide to Understanding Color Communication, Lovibond Color Meas.; The Tintometer Ltd.: Amesbury, UK, 2013. [Google Scholar]
- Wu, D.; Sun, D.-W. Colour measurements by computer vision for food quality control—A review. Trends Food Sci. Technol. 2013, 29, 5–20. [Google Scholar] [CrossRef]
- Mahanta, D.K.; Laskar, S. Electrical insulating liquid: A review. J. Adv. Dielectr. 2017, 7, 1730001. [Google Scholar] [CrossRef]
- Lukinac, J.; Mastanjević, K.; Mastanjević, K.; Nakov, G.; Jukić, M. Computer Vision Method in Beer Quality Evaluation—A Review. Beverages 2019, 5, 38. [Google Scholar] [CrossRef]
- Samiullah, S.; Roberts, J.; Chousalkar, K. Eggshell color in brown-egg laying hens—A review. Poult. Sci. 2015, 94, 2566–2575. [Google Scholar] [CrossRef] [PubMed]
- Costa, J.J.F.; Giasson, É.; da Silva, E.B.; Coblinski, J.A.; Tiecher, T. Use of color parameters in the grouping of soil samples produces more accurate predictions of soil texture and soil organic carbon. Comput. Electron. Agric. 2020, 177, 105710. [Google Scholar] [CrossRef]
- Chu, S.J.; Trushkowsky, R.D.; Paravina, R.D. Dental color matching instruments and systems. Review of clinical and research aspects. J. Dent. 2010, 38 (Suppl. 2), e2–e16. [Google Scholar] [CrossRef] [PubMed]
- Hu, C.; Mei, H.; Guo, H.; Zhu, J. Color analysis of textile fibers by microspectrophotometry. Forensic Chem. 2020, 18, 100221. [Google Scholar] [CrossRef]
- Leong, Y.S.; Ker, P.J.; Jamaludin, M.Z.; Nomanbhay, S.M.; Ismail, A.; Abdullah, F.; Looe, H.M.; Lo, C.K. UV-Vis Spectroscopy: A New Approach for Assessing the Color Index of Transformer Insulating Oil. Sensors 2018, 18, 2175. [Google Scholar] [CrossRef]
- Ma, J.; Ruan, S.; Hu, J.; Sun, Y.; Fei, Y.; Jiang, X.; Dong, S.; Chen, T.; Wu, N. The intrinsic relationship between color variation and performances of the deteriorated aviation lubrication oil. J. Ind. Eng. Chem. 2020, 92, 88–95. [Google Scholar] [CrossRef]
- Duarte, D.P.; Nogueira, R.; Bilro, L.B. Low cost color assessment of turbid liquids using supervised learning data analysis—Proof of concept. Sensors Actuators A Phys. 2020, 305, 111936. [Google Scholar] [CrossRef]
- Zobkov, M.; Zobkova, M. New spectroscopic method for true color determination in natural water with high agreement with visual methods. Water Res. 2020, 177, 115773. [Google Scholar] [CrossRef] [PubMed]
- Moyano, M.J.; Ayala, F.; Echávarri, J.F.; Alba, J.; Negueruela, A.I.; Heredia, F.J. Simplified measurement of virgin olive oil color by application of the characteristic vector method. J. Am. Oil Chem. Soc. 2001, 78, 1221–1226. [Google Scholar] [CrossRef]
- Pascual-Maté, A.; Osés, S.M.; A Fernández-Muiño, M.; Sancho, M.T. Métodos analíticos en mieles. J. Apic. Res. 2018, 57, 38–74. [Google Scholar] [CrossRef]
- N’Cho, J.S.; Fofana, I.; Hadjadj, Y.; Beroual, A. Review of Physicochemical-Based Diagnostic Techniques for Assessing Insulation Condition in Aged Transformers. Energies 2016, 9, 367. [Google Scholar] [CrossRef]
- Fernandes, S.S.; Tonato, D.; Mazutti, M.A.; de Abreu, B.R.; Cabrera, D.D.C.; Doca, C.; Prentice, C.; Salas-Mellado, M.D.L.M. Yield and quality of chia oil extracted via different methods. J. Food Eng. 2019, 262, 200–208. [Google Scholar] [CrossRef]
- Megahed, M. Effect of microwave heating of linseed oil on the formation of primary and secondary oxidation products. Agric. Biol. J. North Am. 2011, 2, 673–679. [Google Scholar] [CrossRef]
- Van den Berg, A.K.; Perkins, T.D.; Isselhardt, M.L.; Godshall, M.-A.; Lyold, S.W. Effects of Air Injection During Sap Processing on Maple Syrup Color, Chemical Composition and Flavor Volatiles. Int. Sugar J. 2009, 111, 37–42. Available online: https://www.researchgate.net/publication/47538862_Effects_of_air_injection_during_sap_processing_on_maple_syrup_color_chemical_composition_and_flavor_volatiles (accessed on 15 August 2020).
- Al-Bachir, M. Quality characteristics of oil extracted from gamma irradiated peanut (Arachis hypogea L.). Radiat. Phys. Chem. 2015, 106, 56–60. [Google Scholar] [CrossRef]
- Dominguez, R.Q.; Reyes-Carrillo, J.L.; De La Cruz-Larios, L.; González-Eguiarte, D.R. Bee honey color variation throughout the year in Hejotitán, Jalisco, México. Sustain. Agric. Food Environ. Res. 2018, 6, 1–9. [Google Scholar] [CrossRef]
- Kalathiripi, H.; Karmakar, S. Analysis of transformer oil degradation due to thermal stress using optical spectroscopic techniques. Int. Trans. Electr. Energy Syst. 2017, 27, e2346. [Google Scholar] [CrossRef]
- De Almeida, D.T.; Curvelo, F.M.; Costa, M.M.; Viana, T.V.; De Lima, P.C. Oxidative stability of crude palm oil after deep frying akara (Fried Bean Paste). Food Sci. Technol. 2017, 38, 142–147. [Google Scholar] [CrossRef]
- ASTM D1524-15. Standard Test Method for Visual Examination of Used Electrical Insulating Liquids in the Field; ASTM International: West Conshohocken, PA, USA, 2015. [Google Scholar]
- Lovibond. Colour Grading according to the Gardner Colour Scale (ASTM D1544). Available online: https://www.lovibond.com/en/PC/Colour-Scales/Gardner-Colour-ASTM-D-1544-ASTM-D-6166-AOCS-Td-1a-MS-817-Part-10/Gardner-Colour-ASTM-D-1544-ASTM-D-6166-AOCS-Td-1a-MS-817-Part-108 (accessed on 3 May 2020).
- ASTM International United States. Standard Test Method for ASTM Color of Petroleum Products (ASTM Color Scale) 1. Annu. B ASTM Stand. 2011, 5, 1–5. [Google Scholar] [CrossRef]
- Phadungthin, R.; Chaidee, E.; Haema, J.; Suwanasri, T. Analysis of Insulating Oil to Evaluate the Condition of Power Transformer. In Proceedings of the ECTI-CON 2010: 2010 ECTI Intertnational Conference of Electrical Engineering, Computer, Telecommunications and Information Technology, Chiang Mai, Thailand, 19–21 May 2010; pp. 108–111. [Google Scholar]
- Alshehawy, A.M.; Mansour, D.-E.A.; Rezk, A.; Ghali, M. Impact of thermal aging of transformer oil on UV-Vis optical spectrum and dielectric properties. In Proceedings of the 2016 18th International Middle East Power Systems Conference (MEPCON), Cairo, Egypt, 27–29 December 2016; pp. 860–865. [Google Scholar]
- Sing, L.Y.; Ker, P.J.; Jamaludin, Z.; Ismail, A.; Abdullah, F.; Mun, L.H.; Saniyyat, C.N.; Shukri, M. Determining the Inhibitor Content of Transformer Insulating Oil Using UV-Vis Spectroscopy. In Proceedings of the 2016 6th IEEE International Conference on Control System, Computing and Engineering (ICCSCE), Penang, Malaysia, 25–27 November 2016; pp. 179–183. [Google Scholar] [CrossRef]
- Godinho, M.S.; Blanco, M.R.; Neto, F.F.G.; Lião, L.M.; Sena, M.M.; Tauler, R.; de Oliveira, A.E. Evaluation of transformer insulating oil quality using NIR, fluorescence, and NMR spectroscopic data fusion. Talanta 2014, 129, 143–149. [Google Scholar] [CrossRef] [PubMed]
- Wang, M.; Vandermaar, A.; Srivastava, K. Review of condition assessment of power transformers in service. IEEE Electr. Insul. Mag. 2002, 18, 12–25. [Google Scholar] [CrossRef]
- Testa, R.; Asciuto, A.; Schifani, G.; Schimmenti, E.; Migliore, G. Quality Determinants and Effect of Therapeutic Properties in Honey Consumption. An Exploratory Study on Italian Consumers. Agriculture 2019, 9, 174. [Google Scholar] [CrossRef]
- Cicerale, S.; Liem, G.; Keast, R.S. Consumer Perception, Attitudes, Liking and Preferences for Olive Oil. Prod. Olive Tree 2016. [Google Scholar] [CrossRef]
- Da Silva, P.M.; Gauche, C.; Gonzaga, L.V.; Costa, A.C.O.; Fett, R. Honey: Chemical composition, stability and authenticity. Food Chem. 2016, 196, 309–323. [Google Scholar] [CrossRef] [PubMed]
- Dominguez, M.A.; Centurión, M.E. Application of digital images to determine color in honey samples from Argentina. Microchem. J. 2015, 118, 110–114. [Google Scholar] [CrossRef]
- United States Department of Agriculture (USDA). United States Standards for Grades of Maple Syrup. 2015; p. 7. Available online: https://www.ams.usda.gov/grades-standards/maple-syrup-grades-standards (accessed on 14 August 2020).
- Dieffenbacher, A.; Pocklington, W.D.; International Union of Pure and Applied Chemistry Commission on Oils. Standard Methods for the Analysis of Oils, Fats and Derivatives, 1st Supplement to the 7th Edition International Union of Pure and Applied Chemistry Commission on Oils, Fats and Derivatives; Blackwell Scientific Publications: Oxford, UK, 1992; p. 151. [Google Scholar]
- Tintometer Group. Lovibond® Colour Measurement Oils & Fats Oils & Fats. Available online: www.lovibondcolour.com (accessed on 15 July 2020).
- Hunt, R.W.; Pointer, M.R. Measuring Colour, 4th ed.; Fountain Press Ltd.: Kingston, UK, 1998. [Google Scholar]
- Commission Internationale de l’Eclairage (CIE). CIE S 017/E:2020. ILV: International Lighting Vocabulary 2nd. 2020. Available online: https://cie.co.at/e-ilv (accessed on 28 September 2021).
- Durmus, D. CIELAB color space boundaries under theoretical spectra and 99 test color samples. Color Res. Appl. 2020, 45, 796–802. [Google Scholar] [CrossRef]
- Hunter Lab. Hunterlab Gardner Color Index. Appl. Note 2008, 10, 1–3. [Google Scholar]
- ASTM International. ASTM Standards & Publications. 2020. Available online: https://www.astm.org/Standard/standards-and-publications.html (accessed on 2 March 2021).
- Hadjadj, Y.; Fofana, I.; Sabau, J.; Briosso, E. Assessing insulating oil degradation by means of turbidity and UV/VIS spectrophotometry measurements. IEEE Trans. Dielectr. Electr. Insul. 2015, 22, 2653–2660. [Google Scholar] [CrossRef]
- Belbin, A.A.; Road, W. Color in oil. In Encyclopedic Dictionary of Polymers; Springer: Berlin/Heidelberg, Germany, 2007; p. 209. [Google Scholar]
- Bodor, Z.; Benedek, C.; Urbin, Á.; Szabó, D.; Sipos, L. Colour of honey: Can we trust the Pfund scale?—An alternative graphical tool covering the whole visible spectra. LWT 2021, 149, 111859. [Google Scholar] [CrossRef]
- United States Department of Agriculture (USDA). Extracted Honey Grading Manual; U.S. Department of Agriculture, Agricultural Marketing Service, Fruit and Vegetable Division, Processed Products Branch: Washington, DC, USA, 1985. [Google Scholar]
- Shellhammer, T.H. Beer Color. In Beer: A Quality Perspective; Bamworth, C.W., Russel, I., Stewart, G., Eds.; Academic Press: Cambridge, MA, USA, 2009; p. 279. [Google Scholar]
- Producteurs et Productrices Acéricoles du Québec, Classification. 2018. Available online: http://ppaq.ca/en/producer/retail-sales/classification/ (accessed on 23 April 2020).
- MMLC Global. Classification of Maple Syrup. Available online: http://www.mmlcglobal.ca/en/maple-products/classification-of-maple-syrup/ (accessed on 16 November 2020).
- Totani, N.; Tateishi, S.; Chiue, H.; Mori, T. Color and Chemical Properties of Oil Used for Deep Frying on a Large Scale. J. Oleo Sci. 2012, 61, 121–126. [Google Scholar] [CrossRef]
- Sulaiman, N.S.; Mohd-Yusof, K.; Mohd-Saion, A. Quality Prediction Modeling of Palm Oil Refining Plant in Malaysia Using Artificial Neural Network Models. Int. J. Eng. Technol. 2018, 7, 19–22. [Google Scholar] [CrossRef][Green Version]
- Ixtaina, V.Y.; Martínez, M.L.; Spotorno, V.; Mateo, C.M.; Maestri, D.M.; Diehl, B.W.K.; Nolasco, S.M.; Tomás, M.C. Characterization of chia seed oils obtained by pressing and solvent extraction. J. Food Compos. Anal. 2011, 24, 166–174. [Google Scholar] [CrossRef]
- Segura-Campos, M.R.; Ciau-Solís, N.; Rosado-Rubio, G.; Chel-Guerrero, L.; Betancur-Ancona, D. Physicochemical characterization of chia (Salvia hispanica) seed oil from Yucatán, México. Agric. Sci. 2014, 05, 220–226. [Google Scholar] [CrossRef]
- Imran, M.; Nadeem, M.; Manzoor, M.F.; Javed, A.; Ali, Z.; Akhtar, M.N.; Ali, M.; Hussain, Y. Fatty acids characterization, oxidative perspectives and consumer acceptability of oil extracted from pre-treated chia (Salvia hispanica L.) seeds. Lipids Health Dis. 2016, 15, 162. [Google Scholar] [CrossRef] [PubMed]
- Shen, Y.; Zheng, L.; Jin, J.; Gentili, A.; Fu, J.; Wang, M.; Guan, Y.; Song, X. Phytochemical and Biological Characteristics of Mexican Chia Seed Oil. Molecules 2018, 23, 3219. [Google Scholar] [CrossRef] [PubMed]
- De, B.K.; Patel, J.D.; Patel, J.B.; Patel, V.K.; Patel, V.R. Bleaching of mustard oil with some alternative bleaching agents and acid activated clay. J. Oleo Sci. 2009, 58, 57–63. [Google Scholar] [CrossRef][Green Version]
- Nayak, P.K.; Dash, U.; Rayaguru, K. Quality assessment of mustard oil in deep fat frying. Asian J. Dairy Food Res. 2016, 35, 168–171. [Google Scholar] [CrossRef][Green Version]
- Shevell, S.K. The time course of chromatic adaptation. Color Res. Appl. 2001, 26 (Suppl. 1), S170–S173. [Google Scholar] [CrossRef]
- Mitschele, J. Beer-Lambert Law. J. Chem. Educ. 1996, 73, A260. [Google Scholar] [CrossRef]
- Karabulut, I.; Topcu, A.; Yorulmaz, A.; Tekin, A.; Ozay, D.S. Effects of the industrial refining process on some properties of hazelnut oil. Eur. J. Lipid Sci. Technol. 2005, 107, 476–480. [Google Scholar] [CrossRef]
- Santos, O.; Corrêa, N.; Carvalho, R.; Costa, C.; Lannes, S. Yield, nutritional quality, and thermal-oxidative stability of Brazil nut oil (Bertolletia excelsa H.B.K) obtained by supercritical extraction. J. Food Eng. 2013, 117, 499–504. [Google Scholar] [CrossRef]
- El-Naggar, E.A. Physicochemical Characteristics of Tiger Nut Tuber (Cyperus esculentus Lam) Oil. Middle East J. Appl. Sci. 2016, 6, 1003–1011. [Google Scholar]
- Timilsena, Y.P.; Vongsvivut, J.; Adhikari, R.; Adhikari, B. Physicochemical and thermal characteristics of Australian chia seed oil. Food Chem. 2017, 228, 394–402. [Google Scholar] [CrossRef] [PubMed]
- Deb, H.; Nunisa, J.; Jidung, S.; Sarmah, D. Transformer Oil Quality Diagnostic Using Spectroscopy Techniques—A Review. ADBU J. Electr. Electron. Eng. 2019, 3, 43–50. [Google Scholar]
- Santana, D.W.E.A.; Sepulveda, M.P.; Barbeira, P.J.S. Spectrophotometric determination of the ASTM color of diesel oil. Fuel 2007, 86, 911–914. [Google Scholar] [CrossRef]
- Corgozinho, C.N.C.; Carvalho, M.M.D.O.; Barbeira, P.J.S. Spectrophotometric and Chemometric Determination of the ASTM Color of Automotive Diesel. Energy Fuels 2009, 23, 2136–2142. [Google Scholar] [CrossRef]
- Malik, H.; Yadav, A.K.; Tarkeshwar; Jarial, R. Make use of UV/VIS spectrophotometer to determination of dissolved decay products in mineral insulating oils for transformer remnant life estimation with ANN. In Proceedings of the 2011 Annual IEEE India Conference, Hyderabad, India, 16–18 December 2011; pp. 1–6. [Google Scholar]
- Sing, L.Y.; Ker, P.J.; Jamaludin, Z.; Ismail, A.; Abdullah, F.; Mun, L.H.; Shukri, C.N.S.M. Determining the color index of transformer insulating oil using UV-Vis spectroscopy. In Proceedings of the 2016 IEEE International Conference on Power and Energy (PECon), Melaka, Malaysia, 28–29 November 2016; pp. 234–238. [Google Scholar]
- Salem, S.; Salem, A.; Babaei, A.A. Preparation and characterization of nano porous bentonite for regeneration of semi-treated waste engine oil: Applied aspects for enhanced recovery. Chem. Eng. J. 2015, 260, 368–376. [Google Scholar] [CrossRef]
- Sanga, R.; Sivaramakrishna, M.; Srinivasan, V.S.; Rao, G.P. Design and Development of Opto-Resistive Type Quasi-Digital Sensor and Instrument for Online Assessment of the Quality of Lubricant Oil. IEEE Sens. J. 2019, 19, 7499–7506. [Google Scholar] [CrossRef]
- Kumaresan, N.; Manikandan, S.; Santhosh, M.; Sudharsan, V. Engine Oil Color Monitoring System. Int. Res. J. Eng. Technol. IRJET 2019, 6, 7750–7754. [Google Scholar]
- Ossia, C.V.; Hosung, K.; Markova, L.V. Utilization of color change in the condition monitoring of synthetic hydraulic oils. Ind. Lubr. Tribol. 2010, 62, 349–355. [Google Scholar] [CrossRef]
- Becerra-Herrera, M.; Martín, A.V.; Ramos-Merchante, A.; Richter, P.; Beltrán, R.; Sayago, A. Characterization and evaluation of phenolic profiles and color as potential discriminating features among Spanish extra virgin olive oils with protected designation of origin. Food Chem. 2018, 241, 328–337. [Google Scholar] [CrossRef] [PubMed]
- Escolar, D.; Haro, M.R.; Ayuso, J. An efficient method for a numerical description of virgin olive oil color with only two absorbance measurements. J. Am. Oil Chem. Soc. 2002, 79, 769–774. [Google Scholar] [CrossRef]
- Robledo, L.G.; Melgosa, M.; Huertas, R.; Roa, R.; Moyano, M.J.; Heredia, F.J. Virgin-Olive-Oil Color in Relation to Sample Thickness and the Measurement Method. J. Am. Oil Chem. Soc. 2008, 85, 1063–1071. [Google Scholar] [CrossRef]
- Moyano, M.J.; Heredia, F.J.; Meléndez-Martínez, A.J. The Color of Olive Oils: The Pigments and Their Likely Health Benefits and Visual and Instrumental Methods of Analysis. Compr. Rev. Food Sci. Food Saf. 2010, 9, 278–291. [Google Scholar] [CrossRef]
- Salmerón, J.F.; Robledo, L.G.; Carvajal, M.Á.; Huertas, R.; Moyano, M.J.; Gordillo, B.; Palma, A.J.; Heredia, F.J.; Melgosa, M. Measuring the colour of virgin olive oils in a new colour scale using a low-cost portable electronic device. J. Food Eng. 2012, 111, 247–254. [Google Scholar] [CrossRef]
- Tan, Y.-A.; Kuntom, A.; Lee, C.K.; Low, K.S. Comparative evaluation of palm oil color measurement using a prototype palm oil colorimeter. J. Am. Oil Chem. Soc. 2004, 81, 733–736. [Google Scholar] [CrossRef]
- Ishak, A.J.; Rahman, R.Z.A.; Soh, A.C.; Shamsudin, R.; Jalo, S.A.; Lim, F.C.; Lin, H.K. Quality identification of used cooking oil based on feature fusion of gas sensor and color. Int. J. Control Theory Appl. 2016, 9, 2405–2413. [Google Scholar]
- Rossi, M.; Gianazza, M.; Alamprese, C.; Stanga, F. The effect of bleaching and physical refining on color and minor components of palm oil. J. Am. Oil Chem. Soc. 2001, 78, 1051–1055. [Google Scholar] [CrossRef]
- Azeman, N.H.; Yusof, N.A.; Othman, A.I. Detection of Free Fatty Acid in Crude Palm Oil. Asian J. Chem. 2015, 27, 1569–1573. [Google Scholar] [CrossRef]
- Mannu, A.; Vlahopoulou, G.; Sireus, V.; Petretto, G.L.; Mulas, G.; Garroni, S. Bentonite as a Refining Agent in Waste Cooking Oils Recycling: Flash Point, Density and Color Evaluation. Nat. Prod. Commun. 2018, 13, 613–616. [Google Scholar] [CrossRef]
- Muzzio, C.R.; Díaz, R.J.; Dini, N.G. In-line measurement of sunflower oil color in the Lovibond scale using a low-cost robust device. J. Food Eng. 2014, 120, 88–93. [Google Scholar] [CrossRef]
- Liaotrakoon, W.; Namhong, T.; Yu, C.H.; Chen, H.H. Impact of roasting on the changes in composition and quality of cashew nut (Anacardium occidentale) oil. Int. Food Res. J. 2016, 23, 986–991. [Google Scholar]
- Sandulachi, E. Photometric Color Index of Walnut Oil; Moldova: Chișinău, Moldova, 2014; pp. 281–286. [Google Scholar]
- Walter, J.; Pons, A.; James, C.K.; Vernon, L.F. Process for Bleaching Off-Color Cottonseed Oils. U.S. Patent 3,036,102, 22 May 1962. [Google Scholar]
- Escuredo, O.; Seijo, M.C. Honey: Chemical Composition, Stability and Authenticity. Foods 2019, 8, 577. [Google Scholar] [CrossRef]
- Al-Farsi, M.; Al-Amri, A.; Al-Hadhrami, A.; Al-Belushi, S. Color, flavonoids, phenolics and antioxidants of Omani honey. Heliyon 2018, 4, e00874. [Google Scholar] [CrossRef]
- Moniruzzaman, M.; An, C.Y.; Rao, P.V.; Hawlader, M.N.I.; Azlan, S.A.B.M.; Sulaiman, S.A.; Gan, S.H. Identification of Phenolic Acids and Flavonoids in Monofloral Honey from Bangladesh by High Performance Liquid Chromatography: Determination of Antioxidant Capacity. BioMed Res. Int. 2014, 2014, 737490. [Google Scholar] [CrossRef]
- Szabó, R.T.; Mézes, M.; Szalai, T.; Zajácz, E.; Weber, M. Colour identification of honey and methodical development of its instrumental measuring. Columella J. Agric. Environ. Sci. 2016, 3, 29–36. [Google Scholar] [CrossRef]
- Kuś, P.M.; Congiu, F.; Teper, D.; Sroka, Z.; Jerkovic, I.; Tuberoso, C.I.G. Antioxidant activity, color characteristics, total phenol content and general HPLC fingerprints of six Polish unifloral honey types. LWT Food Sci. Technol. 2014, 55, 124–130. [Google Scholar] [CrossRef]
- Aider, M.; De Halleux, D.; Belkacemi, K. Production of granulated sugar from maple syrup with high content of inverted sugar. J. Food Eng. 2007, 80, 791–797. [Google Scholar] [CrossRef]
- Filteau, M.; Lagacé, L.; LaPointe, G.; Roy, D. Maple sap predominant microbial contaminants are correlated with the physicochemical and sensorial properties of maple syrup. Int. J. Food Microbiol. 2012, 154, 30–36. [Google Scholar] [CrossRef] [PubMed]
- Smedley, S.M. Colour Determination of Beer Using Tristimulus Values. J. Inst. Brew. 1992, 98, 497–504. [Google Scholar] [CrossRef]
- Mignani, A.G.; Ciaccheri, L.; Mencaglia, A.A.; Ottevaere, H.; Báca, E.E.S.; Thienpont, H. Optical measurements and pattern-recognition techniques for identifying the characteristics of beer and distinguishing Belgian beers. Sens. Actuators B Chem. 2013, 179, 140–149. [Google Scholar] [CrossRef]
- Di Caro, D.; Liguori, C.; Pietrosanto, A.; Sommella, P. A low-cost device for beer color measurement. In Proceedings of the 2019 IEEE International Workshop on Metrology for Agriculture and Forestry (MetroAgriFor), Portici, Italy, 24–26 October 2019; pp. 222–226. [Google Scholar]
- Koren, D.; Vecseri, B.H.; Kun-Farkas, G.; Urbin, Á.; Nyitrai, Á.; Sipos, L. How to objectively determine the color of beer? J. Food Sci. Technol. 2020, 57, 1183–1189. [Google Scholar] [CrossRef]
- Zhu, K.-X.; Li, J.; Li, M.; Guo, X.-N.; Peng, W.; Zhou, H.-M. Functional properties of chitosan–xylose Maillard reaction products and their application to semi-dried noodle. Carbohydr. Polym. 2013, 92, 1972–1977. [Google Scholar] [CrossRef] [PubMed]
- Clément, A.; Lagacé, L.; Panneton, B. Assessment of maple syrup physico-chemistry and typicity by means of fluorescence spectroscopy. J. Food Eng. 2010, 97, 17–23. [Google Scholar] [CrossRef]
- Wicaksono, B.; Kong, H.; Markova, L.V.; Han, H.-G. Application of fluorescence emission ratio technique for transformer oil monitoring. Meas. J. Int. Meas. Confed. 2013, 46, 4161–4165. [Google Scholar] [CrossRef]
- Deepa, S.; Sarathi, R.; Mishra, A.K. Synchronous fluorescence and excitation emission characteristics of transformer oil ageing. Talanta 2006, 70, 811–817. [Google Scholar] [CrossRef] [PubMed]
- Lagace, L.; Girouard, C.; Dumont, J.; Fortin, J.; Roy, D. Rapid Prediction of Maple Syrup Grade and Sensory Quality by Estimation of Microbial Quality of Maple Sap Using ATP Bioluminescence. J. Food Sci. 2002, 67, 1851–1854. [Google Scholar] [CrossRef]
- León, K.; Mery, D.; Pedreschi, F.; León, J. Color measurement in L∗a∗b∗ units from RGB digital images. Food Res. Int. 2006, 39, 1084–1091. [Google Scholar] [CrossRef]
- Shafiee, S.; Minaei, S.; Moghaddam-Charkari, N.; Ghasemi-Varnamkhasti, M.; Barzegar, M. Potential application of machine vision to honey characterization. Trends Food Sci. Technol. 2013, 30, 174–177. [Google Scholar] [CrossRef]
- Almaleeh, A.A.; Adom, A.H.; Zakaria, A. Development of Rapid and Accurate Method to Classify Malaysian Honey Samples using UV and Colour Image. Int. J. Technol. 2017, 3, 396–486. [Google Scholar] [CrossRef]
- Minaei, S.; Shafiee, S.; Polder, G.; Moghadam-Charkari, N.; van Ruth, S.; Barzegar, M.; Zahiri, J.; Alewijn, M.; Kuś, P.M. VIS/NIR imaging application for honey floral origin determination. Infrared Phys. Technol. 2017, 86, 218–225. [Google Scholar] [CrossRef]
- Anacan, R.M.; Cabautan, A.C.; A Cayabyab, J.M.; A Miguel, S.X.; Modrigo, V.D.; Rosites, C.J.V.; Sagun, A.C. Development of Oil Quality Estimator Using Machine Vision System. In Proceedings of the 2018 IEEE 10th International Conference on Humanoid, Nanotechnology, Information Technology, Communication and Control, Environment and Management (HNICEM), Baguio City, Philippines, 29 November–2 December 2018; pp. 1–6. [Google Scholar] [CrossRef]
- Araujo, P.D.; Moya, M.V.M.; De Paula, I.C. Classification of cotton oil in the semi-refining process using image processing techniques: Image processing for industrial applications. In Proceedings of the 2017 Seventh International Conference on Innovative Computing Technology (INTECH), Luton, UK, 16–18 August 2017; pp. 21–25. [Google Scholar] [CrossRef]
- Nikolova, K.T.; Gabrova, R.; Boyadzhiev, D.; Pisanova, E.S.; Ruseva, J.; Yanakiev, D. Classification of different types of beer according to their colour characteristics. J. Phys. Conf. Ser. 2017, 794, 12035. [Google Scholar] [CrossRef]
- Silva, T.C.O.; Godinho, M.S.; de Oliveira, A.E. Identification of pale lager beers via image analysis. Lat. Am. Appl. Res. 2011, 41, 141–145. [Google Scholar]
- Karagiorgos, N.; Nenadis, N.; Trypidis, D.; Siozios, K.; Siskos, S.; Nikolaidis, S.; Tsimidou, M. An approach for estimating adulteration of virgin olive oil with soybean oil using image analysis. In Proceedings of the 2017 6th International Conference on Modern Circuits and Systems Technologies (MOCAST), Thessaloniki, Greece, 4–6 May 2017; pp. 1–4. [Google Scholar] [CrossRef]


| Color | Range |
|---|---|
| Red | 0–79.9 |
| Yellow | 0–79.9 |
| Blue | 0–39.9 |
| Neutral | 0–39.0 |
| Color Name | Pfund Scale (mm) |
|---|---|
| Water white | <9 |
| Extra white | 0–17 |
| White | 18–34 |
| Extra light amber | 35–50 |
| Light amber | 51–85 |
| Amber | 86–115 |
| Dark amber | >114 |
| Beer Color | |||||||||||||
|---|---|---|---|---|---|---|---|---|---|---|---|---|---|
| SRM | 2 | 3 | 4 | 6 | 8 | 10 | 13 | 17 | 20 | 24 | 29 | 35 | 40+ |
| EBC | 4 | 6 | 8 | 12 | 16 | 20 | 26 | 33 | 39 | 47 | 57 | 69 | 79 |
| Class | Grade | Description |
|---|---|---|
| Canada 1 | Extra Light Light Medium Amber Dark |
|
| Canada 2 | Amber |
|
| Canada 3 | Dark |
|
| Class | Grade | Description |
|---|---|---|
| 1 | AA (Extra Light) A (Light) B (Medium) C (Amber) D (Dark) |
|
| 2 | AA (Extra Light) A (Light) B (Medium) C (Amber) D (Dark) |
|
| Grade A Color Classes | Flavor | Light Transmittance (%) |
|---|---|---|
| Golden | Delicate | ≥75.0 |
| Amber | Rich | 50.0–74.9 |
| Dark | Robust | 25.0–49.9 |
| Very Dark | Strong | <25.0 |
| Standards | Color Scale | Range | Methods | Applications |
|---|---|---|---|---|
| ASTM D 1500 | ASTM D 1500 | 0.5–8.0 | Visual Comparator | Petroleum products, lubricating oil, heating oils and diesel fuel oils |
| ASTM D 156 | Saybolt Color | From 30 to −16 | Colorimeter | Automobile and aviation gasoline, jet fuel, naphtha, kerosene, petroleum waxes and pharmaceutical white oils |
| ASTM D 1544 | Gardner Color | 1–18 | Comparator | Resins, varnishes, lacquers, drying oils, fatty acids, lecithin, sunflower oil and linseed oil |
| Lovibond | Lovibond RYBN | 84 calibrated glass color standards | Visual Colorimeter | Color of oils, chemicals, foods and beverages |
| United States Standards for Grades of Extracted Honey | Pfund Scale | Water white, extra white, white, extra light amber, light amber, amber and dark amber | Visual Comparator | Honey |
| Standard Reference Method | SRM Value | 1–70 | Spectroscopy | Wort or beer |
| European Brewery Convention | EBC Value | 4–140 | Spectroscopy | Wort or beer |
| United States Standards for Grades of Maple Syrup | Grade A Classification | Golden, amber, dark and very dark | Spectroscopy | Maple syrup |
| CIE Values | XYZ tristimulus values xyY chromacity coordinates CIE L*a*b* color space (−199 to 270) CIE L*C*h | Colorimeter Spectroscopy Image Analysis | Any color of matter |
| ANN Model | Prediction | R | MSE |
|---|---|---|---|
| MISO-1 | FFA content | 0.5764 | 0.0552 |
| MISO-2 | Red Lovibond color | 0.8845 | 0.0589 |
| MISO-3 | Yellow Lovibond color | 0.8480 | 0.0904 |
| MIMO-1 | Red and yellow Lovibond color | 0.8554 | 0.1054 |
| MIMO-2 | FFA content, red and yellow Lovibond color | 0.8926 | 0.0543 |
| Refinery Process | Color Values | ||
|---|---|---|---|
| Lightness (L*) | Redness (a*) | Yellowness (b*) | |
| Crude Oil | 40.54c | 2.01a | 23.71b |
| Neutralized | 36.50c | 0.67b | 17.62b |
| Bleached | 43.22a | −1.69c | 9.95c |
| Deodorized | 40.96b | −0.87c | 2.45d |
| LSD | 0.1423 | 0.2250 | 0.1560 |
| Oils | Tiger Nut | Olive | Maize | Sunflower | Soybean | |
|---|---|---|---|---|---|---|
| Parameter | ||||||
| Color | Yellow | 35 | 35 | 35 | 35 | 35 |
| Red | 0.9 | 3.1 | 0.8 | 0.8 | 4 |
| Equation | R2 | SEE a | RMSE b |
|---|---|---|---|
| L* = 0.556458(A480)2 − 2.51145A480 + 0.55504(A670)2 − 8.53016A670 + 98.4089 | 0.914 | 0.74 | 0.83 |
| a* = 0.177372(A480)2 + 2.1363A480 + 1.43254(A670)2 − 0.789231A670 − 13.9246 | 0.881 | 0.54 | 0.72 |
| b* = −16.0277(A480)2 + 79.8932A480 − 5.06558(A670)2 + 3.36169A670 + 31.9405 | 0.992 | 1.28 | 1.28 |
| C = −15.8439(A480)2 + 78.9312A480 − 5.26784(A670)2 + 3.56917A670 + 33.3927 | 0.992 | 1.28 | 1.29 |
| Method | RMSE YI | RMSE RI |
|---|---|---|
| Visual | 0.597 | 0.275 |
| Automatic | 0.338 | 0.258 |
| Types of Oils | Color | Index | Standard |
|---|---|---|---|
| English Walnut Oil | Color (51/4 Lovibond Scale) | 10Yellow/1.5Red Typical | LVO STANDARD |
| Walnut Oil | Lovibond (Red) | 1.5R Max | Kosher Certification Available |
| Walnut Oil | Lovibond Tintometer 133, 4 mm | Y 30 max. R 4.0 max | - |
| Natural Walnut Oil for Cooking, Henan, China (Mainland) | A Clear, Bright Yellow Oil | - | SGS 8024–09–07 |
| Walnut Oil, R. Moldova | Color, GOST 5477–93 (at the Request of the Benefit Or in Case of Dispute) | Yellow, max30 mgI2/10cm2 | GD Nr.434 27.05.2010 TR Edible Vegetable Oils |
| Heating Time (Min) | Color Index | |
|---|---|---|
| Stripped | Non-Stripped Oil | |
| 0 | 140.38 ± 1.75 B,b | 373.50 ± 4.67A B,a |
| 1 | 149.10 ± 2.01 A,b | 381.45 ± 5.15 A,a |
| 2 | 140.99 ± 1.76 B,b | 365.24 ± 4.57B C,a |
| 3 | 138.45 ± 1.87 B,b | 363.84 ± 4.91B C,a |
| 4 | 81.96 ± 1.02 C,b | 357.86 ± 4.47 C,a |
| 5 | 27.75 ± 0.37 D,b | 174.62 ± 2.36 D,a |
| Color | Flavonoids | Phenolics | Antioxidants | |
|---|---|---|---|---|
| Color | 1 | |||
| Flavonoids | 0.999 | 1 | ||
| Phenolics | 0.974 | 0.977 | 1 | |
| Antioxidants | 0.608 | 0.616 | 0.771 | 1 |
| Black Locust (n = 4) | Goldenrod (n = 2) | Rapeseed (n = 10) | Lime (n = 4) | Heather (n = 3) | Buckwheat (n = 5) | |
|---|---|---|---|---|---|---|
| L* | ||||||
| Average | 86.2 | 83.7 | 81.8 | 83.4 | 67.3 | 41.5 |
| SD | ±1.2 | ±2.4 | ±3.3 | ±3.9 | ±4.8 | ±3.1 |
| Median | 86.3 | 83.7 | 81.7 | 83.2 | 69.7 | 41.8 |
| Min | 84.7 | 82.0 | 76.5 | 78.9 | 61.7 | 37.3 |
| Max | 87.4 | 85.4 | 85.8 | 88.3 | 70.5 | 45.6 |
| a* | ||||||
| Average | −1.6 | −1.2 | −0.5 | −1.1 | 10.5 | 31.9 |
| SD | ±0.2 | ±0.7 | ±0.3 | ±1.2 | ±3.5 | ±1.7 |
| Median | −1.6 | −1.2 | −0.6 | −1.7 | 9.5 | 31.8 |
| Min | −1.9 | −1.7 | −1.2 | −1.8 | 7.6 | 29.5 |
| Max | −1.4 | −0.7 | −0.1 | 0.7 | 14.3 | 33.6 |
| b* | ||||||
| Average | 19.6 | 34.5 | 28.4 | 36.3 | 68.0 | 69.2 |
| SD | ±1.3 | ±6.3 | ±6.5 | ±12.6 | ±2.3 | ±4.2 |
| Median | 19.4 | 34.5 | 29.6 | 39.1 | 68.4 | 69.6 |
| Min | 18.2 | 30.1 | 16.9 | 18.6 | 65.5 | 63.2 |
| Max | 21.4 | 38.9 | 38.0 | 48.3 | 70.0 | 74.5 |
| Beer Category (Sample Number) | EBC Difference | Absolute L*a*b* Difference |
|---|---|---|
| Weissbier (30) | 0.6 | 17.4 |
| Weissbier (31) | ||
| Alcohol-free beer-based mixed drink with lemon juice (5) | 0.3 | 12.6 |
| Belgian strong pale ale (28) | ||
| Alcohol-free beer-based mixed drink with grapefruit juice (6) | 0.1 | 7.7 |
| European pale lager (18) | ||
| International amber lager (24) | 1.6 | 7.3 |
| Irish red ale (34) | ||
| Irish stout (35) | 1.1 | 4.5 |
| Dunkles bock (36) |
| Oil State during the Process | Color |
|---|---|
| Crude oil (C) | |
| First refining (1R) | |
| Second refining (2R) | |
| Washing (W) | |
| Washing and drying (WD) | |
| Final product (semi-refined oil) (FP) |
| Color Model | KNN | QDA | ELM | |
|---|---|---|---|---|
| Average Accuracy (%) | RGB | 90.6 | 94.7 | 95.8 |
| YIQ | 92.7 | 94.7 | 95.8 |
| Model | LV | RMSEC | RMSECV | R2 | Slope | Bias | Correlation |
|---|---|---|---|---|---|---|---|
| RGB | 6 | 2.60 | 4.73 | 0.97 | 0.97 | 7.15 × 10⁻⁷ | 0.98 |
| HSB | 4 | 3.14 | 4.33 | 0.97 | 0.97 | 5.88 × 10⁻⁷ | 0.98 |
| Grayscale | 4 | 2.06 | 3.63 | 0.98 | 0.98 | −1.28 × 10⁻⁶ | 0.99 |
| Methods | Equipment | Sample Preparation | Destructive | Wavelength (nm) | Model Equation | AI-Based Processing | Accuracy | Ref No. | |
|---|---|---|---|---|---|---|---|---|---|
| Mineral Oil | Visual Examination | ✓ | ✕ | ✕ | NA | NA | NA | NA | [23] |
| Visual Comparator | ✓ | ✕ | ✕ | NA | ✕ | NA | NA | [25] | |
| ✓ | ✕ | ✕ | NA | ✕ | NA | NA | [45] | ||
| UV-Vis Spectroscopy | ✓ | ✕ | ✕ | 400–700 | ✓ | ✕ | RMSE = 0.6274 | [62] | |
| ✓ | ✕ | ✕ | 400–700 | ✓ | ✕ | R2 = 0.99971 | [67] | ||
| ✓ | ✓ | ✕ | 300–800 | ✓ | ✕ | RMSEP = 0.18, 0.23 | [68] | ||
| ✓ | ✓ | ✕ | 300–700 | ✓ | ✕ | NA | [74] | ||
| ✓ | ✕ | ✕ | 590, 840 | ✓ | ✕ | R2 = 0.9974 | [72] | ||
| Image Analysis | ✓ | ✕ | ✕ | NA | ✕ | ✕ | NA | [100] | |
| Olive Oil | UV-Vis Spectroscopy | ✓ | ✕ | ✕ | 300–800 | ✕ | ✕ | NA | [77] |
| ✓ | ✓ | ✕ | 380–770 | ✕ | ✕ | NA | [75] | ||
| ✓ | ✕ | ✕ | 380–770 | ✓ | ✕ | color diff. = 3.6 | [79] | ||
| ✓ | ✕ | ✕ | 430–480 and 660–670 | ✓ | ✕ | R2 = 0.881–0.992 | [76] | ||
| Image Analysis | ✓ | ✓ | ✓ | NA | ✕ | ✕ | AAE = 3% | [113] | |
| Palm Oil | Visual Colorimeter | ✓ | ✕ | ✓ | NA | ✕ | ✓ | MSE = 7.0348 × 10⁻⁵ | [53] |
| UV-Vis Spectroscopy | ✓ | ✓ | ✓ | RGB | ✓ | ✕ | R2 = 0.9236 | [80] | |
| ✓ | ✓ | ✓ | 380–780 | ✕ | ✕ | NA | [84] | ||
| Image Analysis | ✓ | ✓ | ✓ | NA | ✕ | ✓ | MSE = 0.0011 | [81] | |
| Nut Oil | Automatic Colorimeter | ✓ | ✓ | ✕ | NA | ✕ | ✕ | NA | [62] |
| ✓ | ✓ | ✕ | NA | ✕ | ✕ | NA | [63] | ||
| ✓ | ✓ | ✕ | NA | ✕ | ✕ | NA | [64] | ||
| UV-Vis Spectroscopy | ✓ | ✓ | ✕ | 400–700 | ✓ | ✕ | R2 = 0.8717, 0.854 | [21] | |
| ✓ | ✓ | ✕ | 400–700 Abs–460, 550, 620, 670 | ✓ | ✕ | R2 = 0.8717 @ 20 °C, R2 = 0.854 @ 40 °C | [87] | ||
| ✓ | ✓ | ✕ | 400–700 | ✕ | ✕ | NA | [86] | ||
| Maple Syrup | UV-Vis Spectroscopy | ✓ | ✓ | ✕ | Abs = 560 | ✕ | ✕ | NA | [94] |
| ✓ | ✓ | ✕ | Abs = 560 | ✕ | ✕ | NA | [20] | ||
| ✓ | ✓ | ✕ | Abs = 560 | ✕ | ✕ | NA | [95] | ||
| Fluorescence Spectroscopy | ✓ | ✓ | ✓ | 230–370 | ✓ | ✕ | R2 = 0.91 and 0.88 | [101] | |
| ✓ | ✓ | ✕ | Abs = 560 | ✕ | ✕ | NA | [104] | ||
| Honey | Automatic Colorimeter | ✓ | ✕ | ✕ | NA | ✕ | ✕ | NA | [22] |
| UV-Vis Spectroscopy | ✓ | ✓ | ✕ | 380–780 | ✕ | ✕ | NA | [93] | |
| ✓ | ✓ | ✕ | 450–720 | ✕ | ✕ | NA | [91] | ||
| ✓ | ✓ | ✕ | ABS = 450, 635, 720 | ✕ | ✕ | NA | [90] | ||
| Image Analysis | ✓ | ✕ | ✕ | NA | ✕ | ✓ | NA | [106] | |
| ✓ | ✓ | ✕ | NA | ✕ | ✓ | Accuracy ≥ 90% | [108] | ||
| ✓ | ✕ | ✕ | NA | ✓ | ✓ | R2 = 0.97 | [36] | ||
| Beer | UV-Vis Spectroscopy | ✓ | ✕ | ✕ | 450–800, | ✕ | ✕ | NA | [97] |
| 900–1200 | |||||||||
| ✓ | ✓ | ✕ | 380–780 Abs = 430 | ✕ | ✕ | NA | [99] | ||
| ✓ | ✓ | ✕ | 430 | ✓ | ✕ | R2Vlow = 0.9677, R2VHigh = 0.9963 | [98] | ||
| Image Analysis | ✓ | ✕ | ✕ | NA | ✓ | ✕ | NA | [112] | |
| ✓ | ✕ | ✕ | NA | ✓ | ✓ | 100% | [111] |
Publisher’s Note: MDPI stays neutral with regard to jurisdictional claims in published maps and institutional affiliations. |
© 2021 by the authors. Licensee MDPI, Basel, Switzerland. This article is an open access article distributed under the terms and conditions of the Creative Commons Attribution (CC BY) license (https://creativecommons.org/licenses/by/4.0/).
Share and Cite
Hasnul Hadi, M.H.; Ker, P.J.; Thiviyanathan, V.A.; Tang, S.G.H.; Leong, Y.S.; Lee, H.J.; Hannan, M.A.; Jamaludin, M.Z.; Mahdi, M.A. The Amber-Colored Liquid: A Review on the Color Standards, Methods of Detection, Issues and Recommendations. Sensors 2021, 21, 6866. https://doi.org/10.3390/s21206866
Hasnul Hadi MH, Ker PJ, Thiviyanathan VA, Tang SGH, Leong YS, Lee HJ, Hannan MA, Jamaludin MZ, Mahdi MA. The Amber-Colored Liquid: A Review on the Color Standards, Methods of Detection, Issues and Recommendations. Sensors. 2021; 21(20):6866. https://doi.org/10.3390/s21206866
Chicago/Turabian StyleHasnul Hadi, Muhamad Haziq, Pin Jern Ker, Vimal A. Thiviyanathan, Shirley Gee Hoon Tang, Yang Sing Leong, Hui Jing Lee, Mahammad A. Hannan, Md. Zaini Jamaludin, and Mohd Adzir Mahdi. 2021. "The Amber-Colored Liquid: A Review on the Color Standards, Methods of Detection, Issues and Recommendations" Sensors 21, no. 20: 6866. https://doi.org/10.3390/s21206866
APA StyleHasnul Hadi, M. H., Ker, P. J., Thiviyanathan, V. A., Tang, S. G. H., Leong, Y. S., Lee, H. J., Hannan, M. A., Jamaludin, M. Z., & Mahdi, M. A. (2021). The Amber-Colored Liquid: A Review on the Color Standards, Methods of Detection, Issues and Recommendations. Sensors, 21(20), 6866. https://doi.org/10.3390/s21206866