Binary Amplitude Reflection Gratings for X-ray Shearing and Hartmann Wavefront Sensors


Abstract
1. Introduction
New Challenges
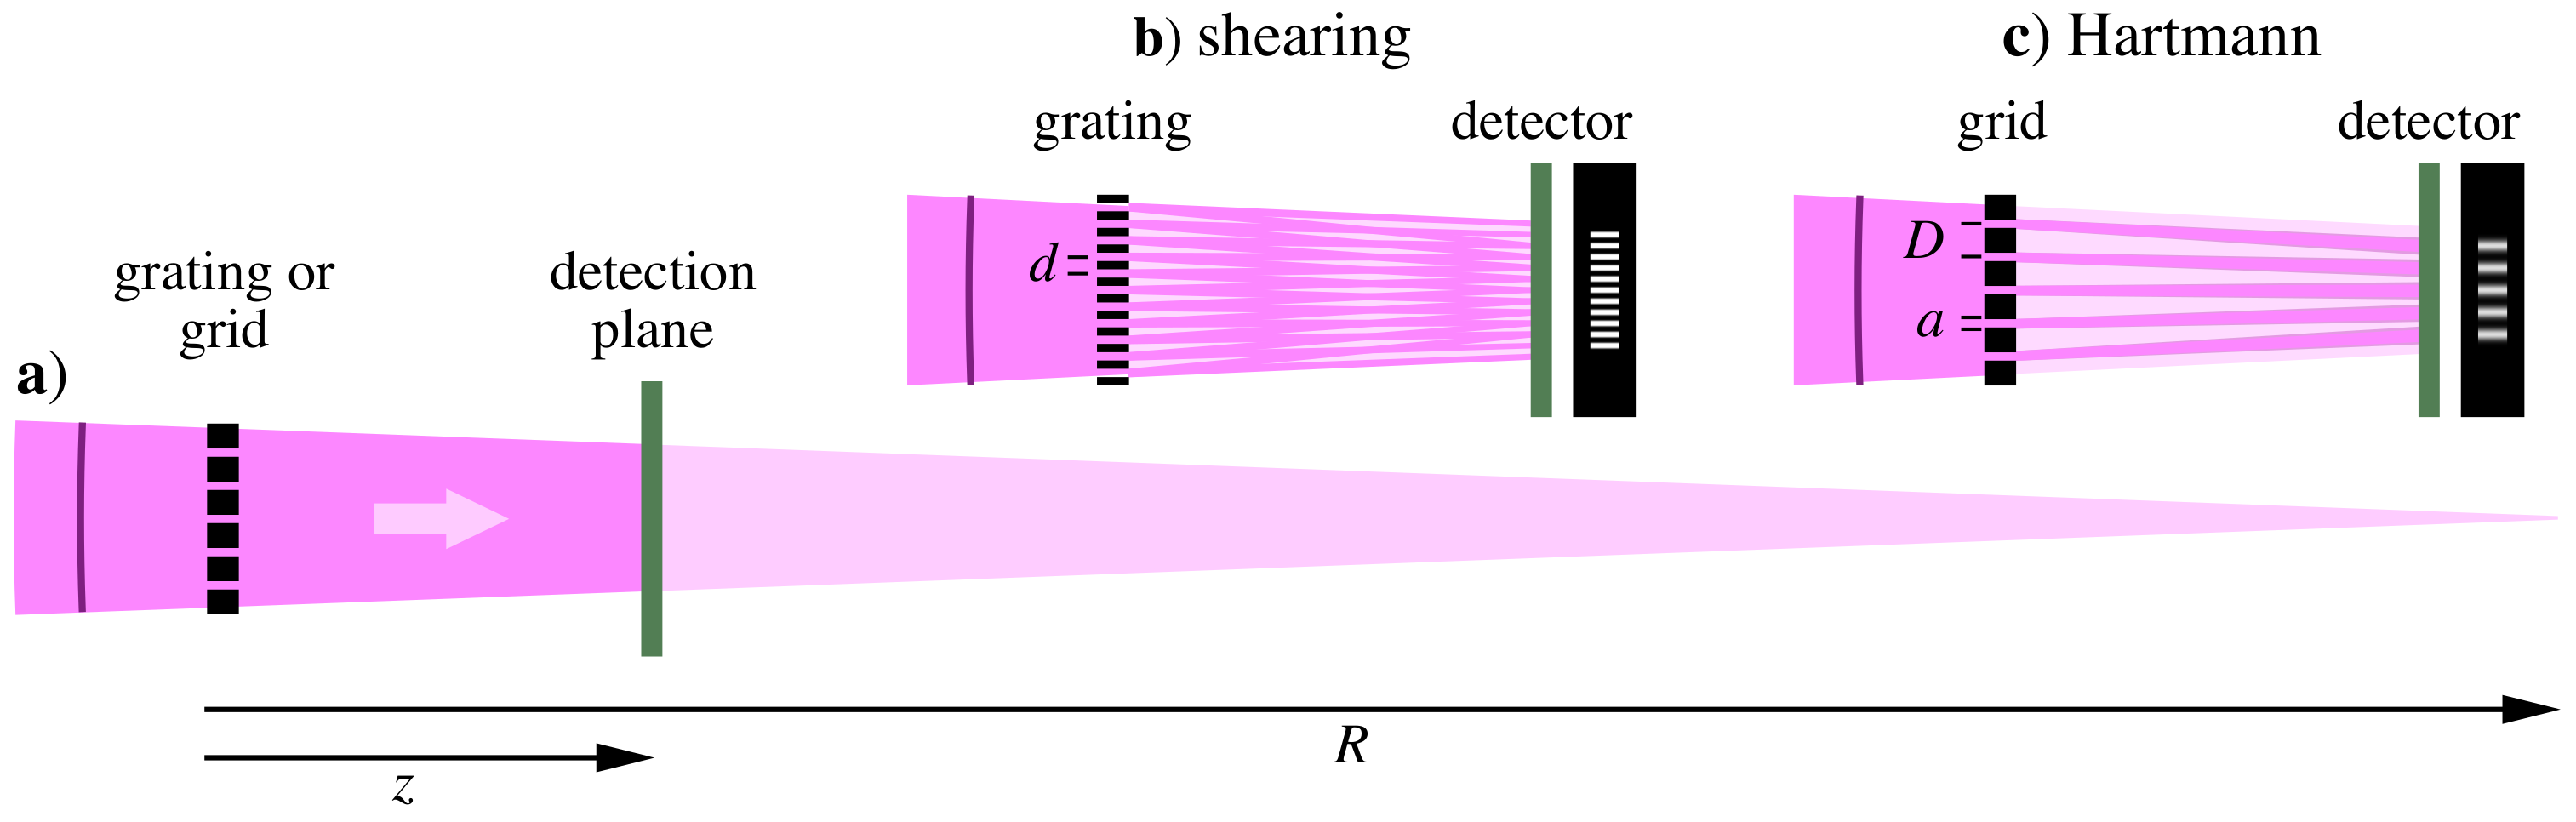
2. Shearing Grating and Hartmann Grid Design
2.1. Binary Amplitude Shearing Grating Design
2.2. Hartmann Wavefront Sensor Grid Design
3. Shearing and Hartmann Usable Bandwidth and Array Creation
3.1. Number of Gratings Required to Span a Range
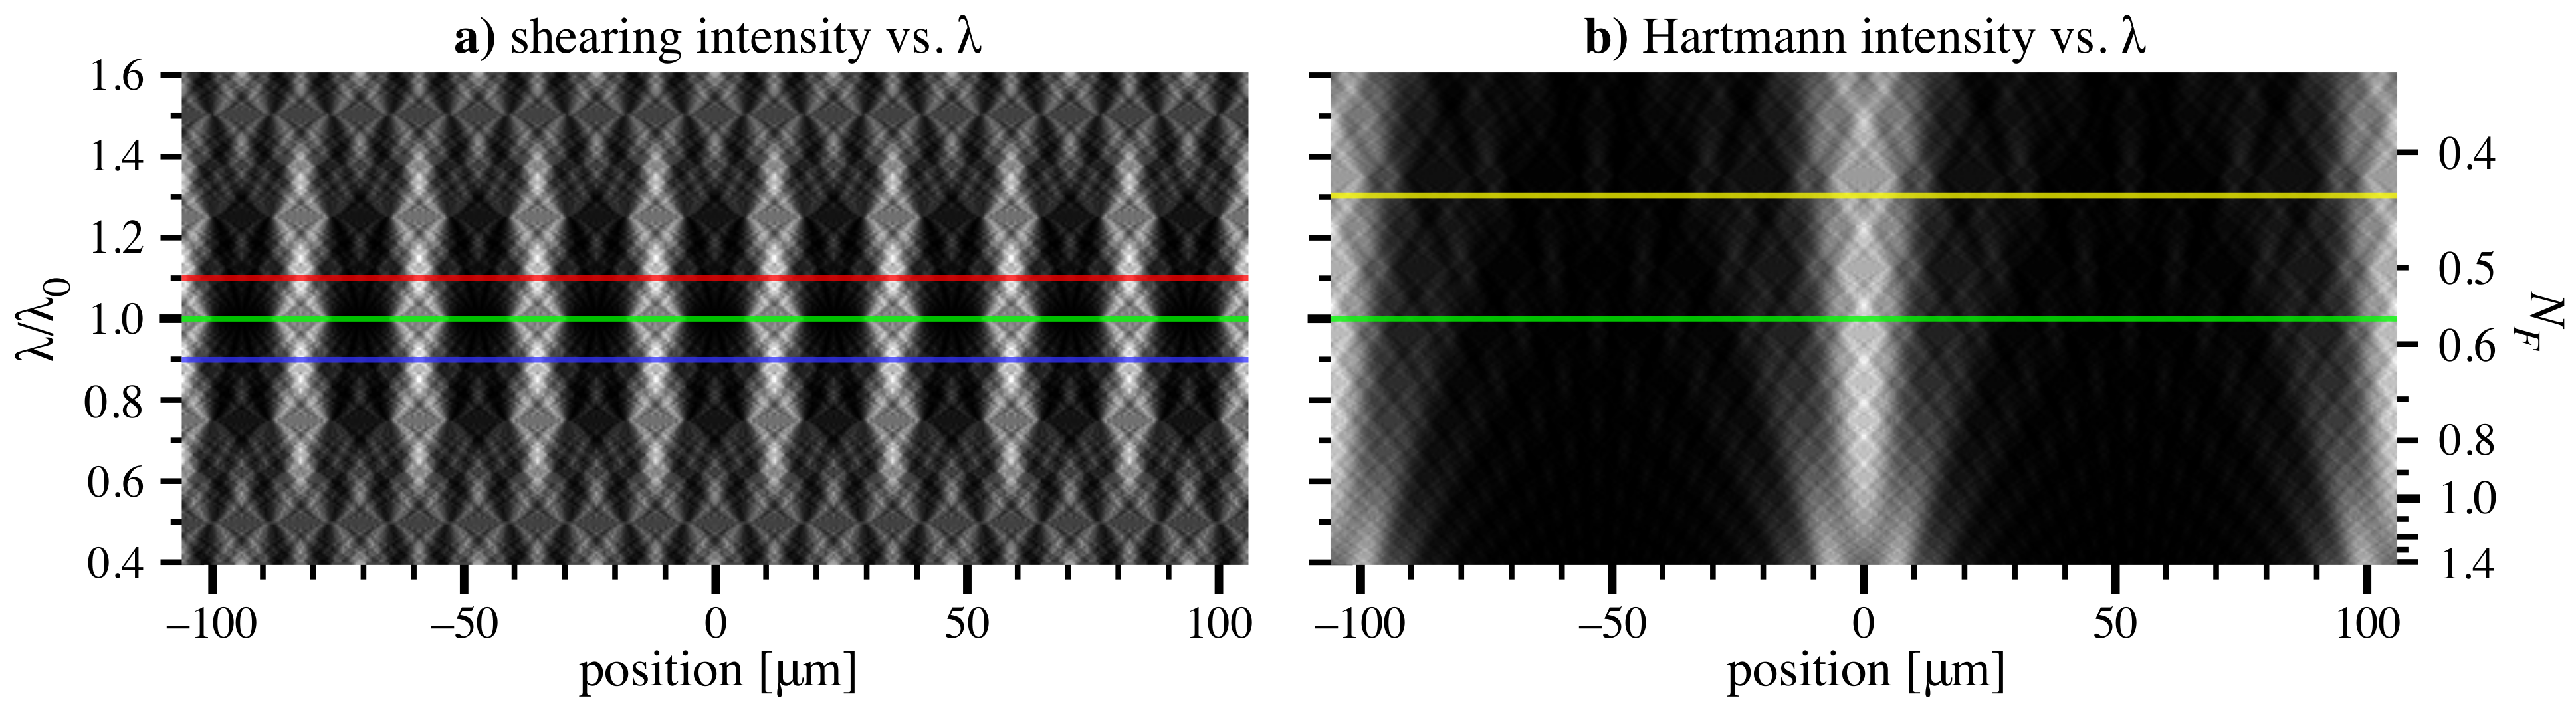
3.2. Usable Bandwidth Considerations for Shearing and Hartmann
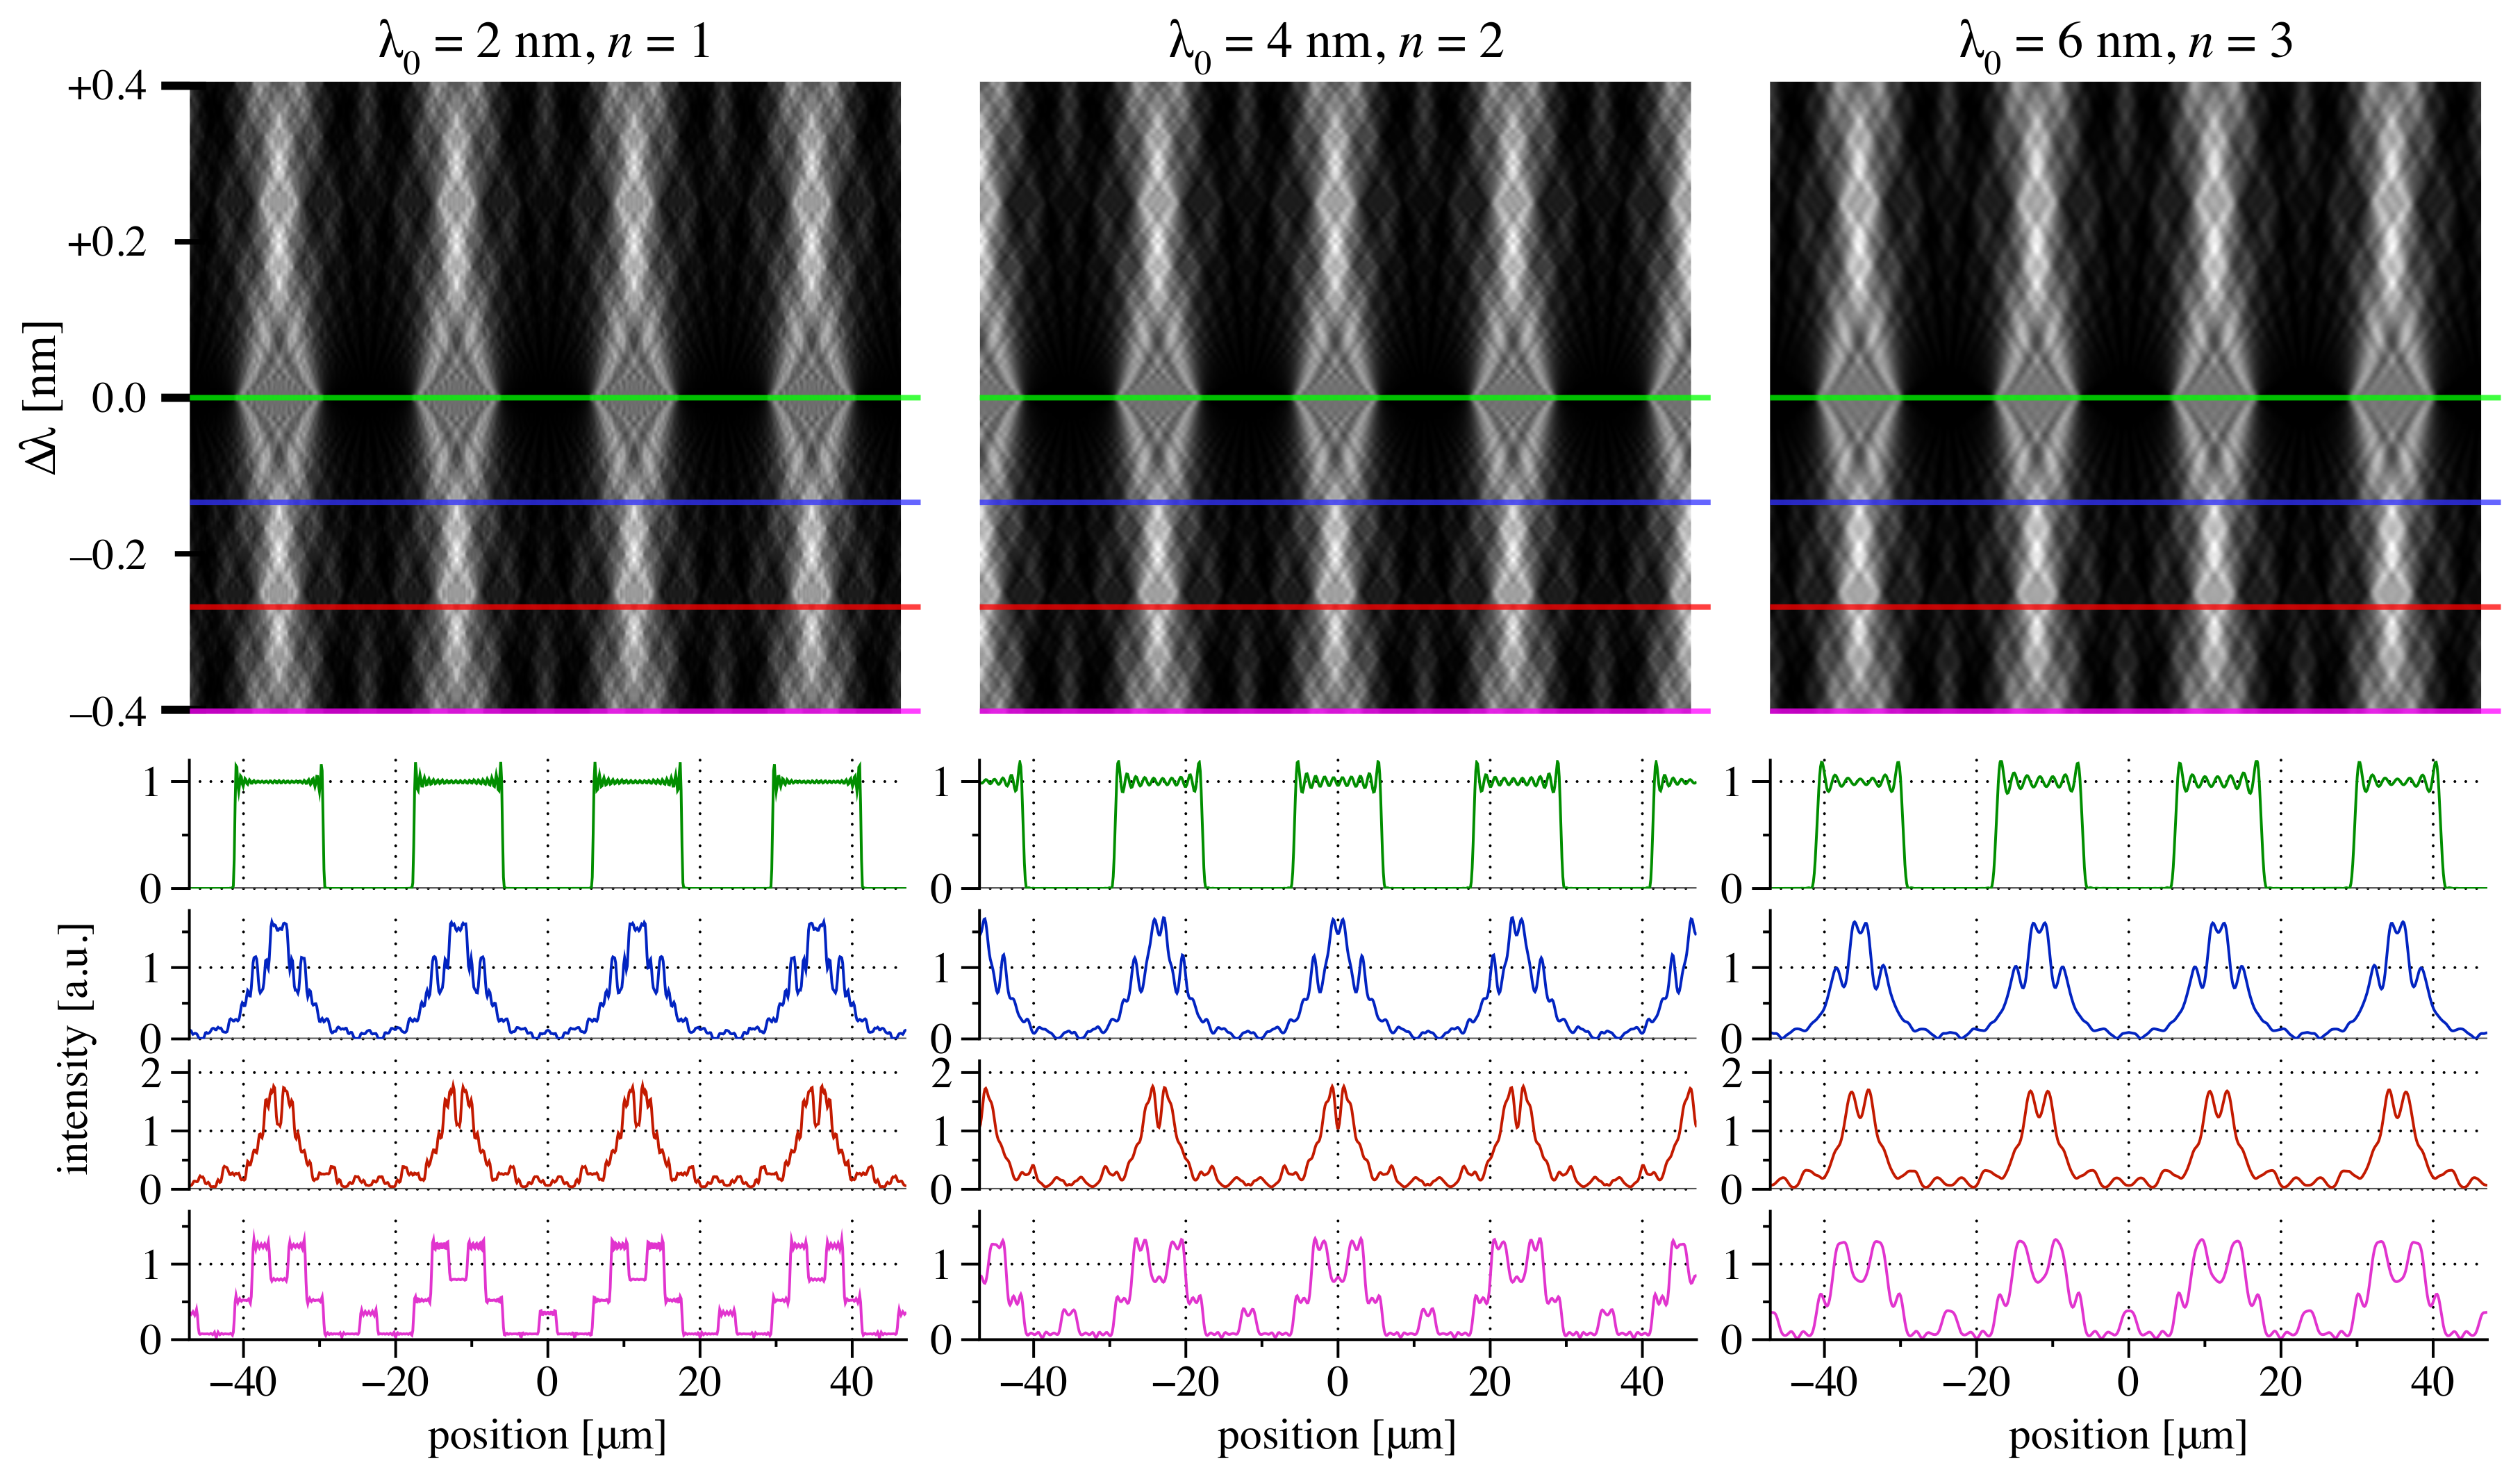
3.3. Shearing Bandwidth in the Talbot Planes
4. Shearing and Hartmann Design Example
4.1. Shearing Grating and Hartmann Grid Arrays
4.2. The Etched Grating Chip
5. Modeling
5.1. Shearing
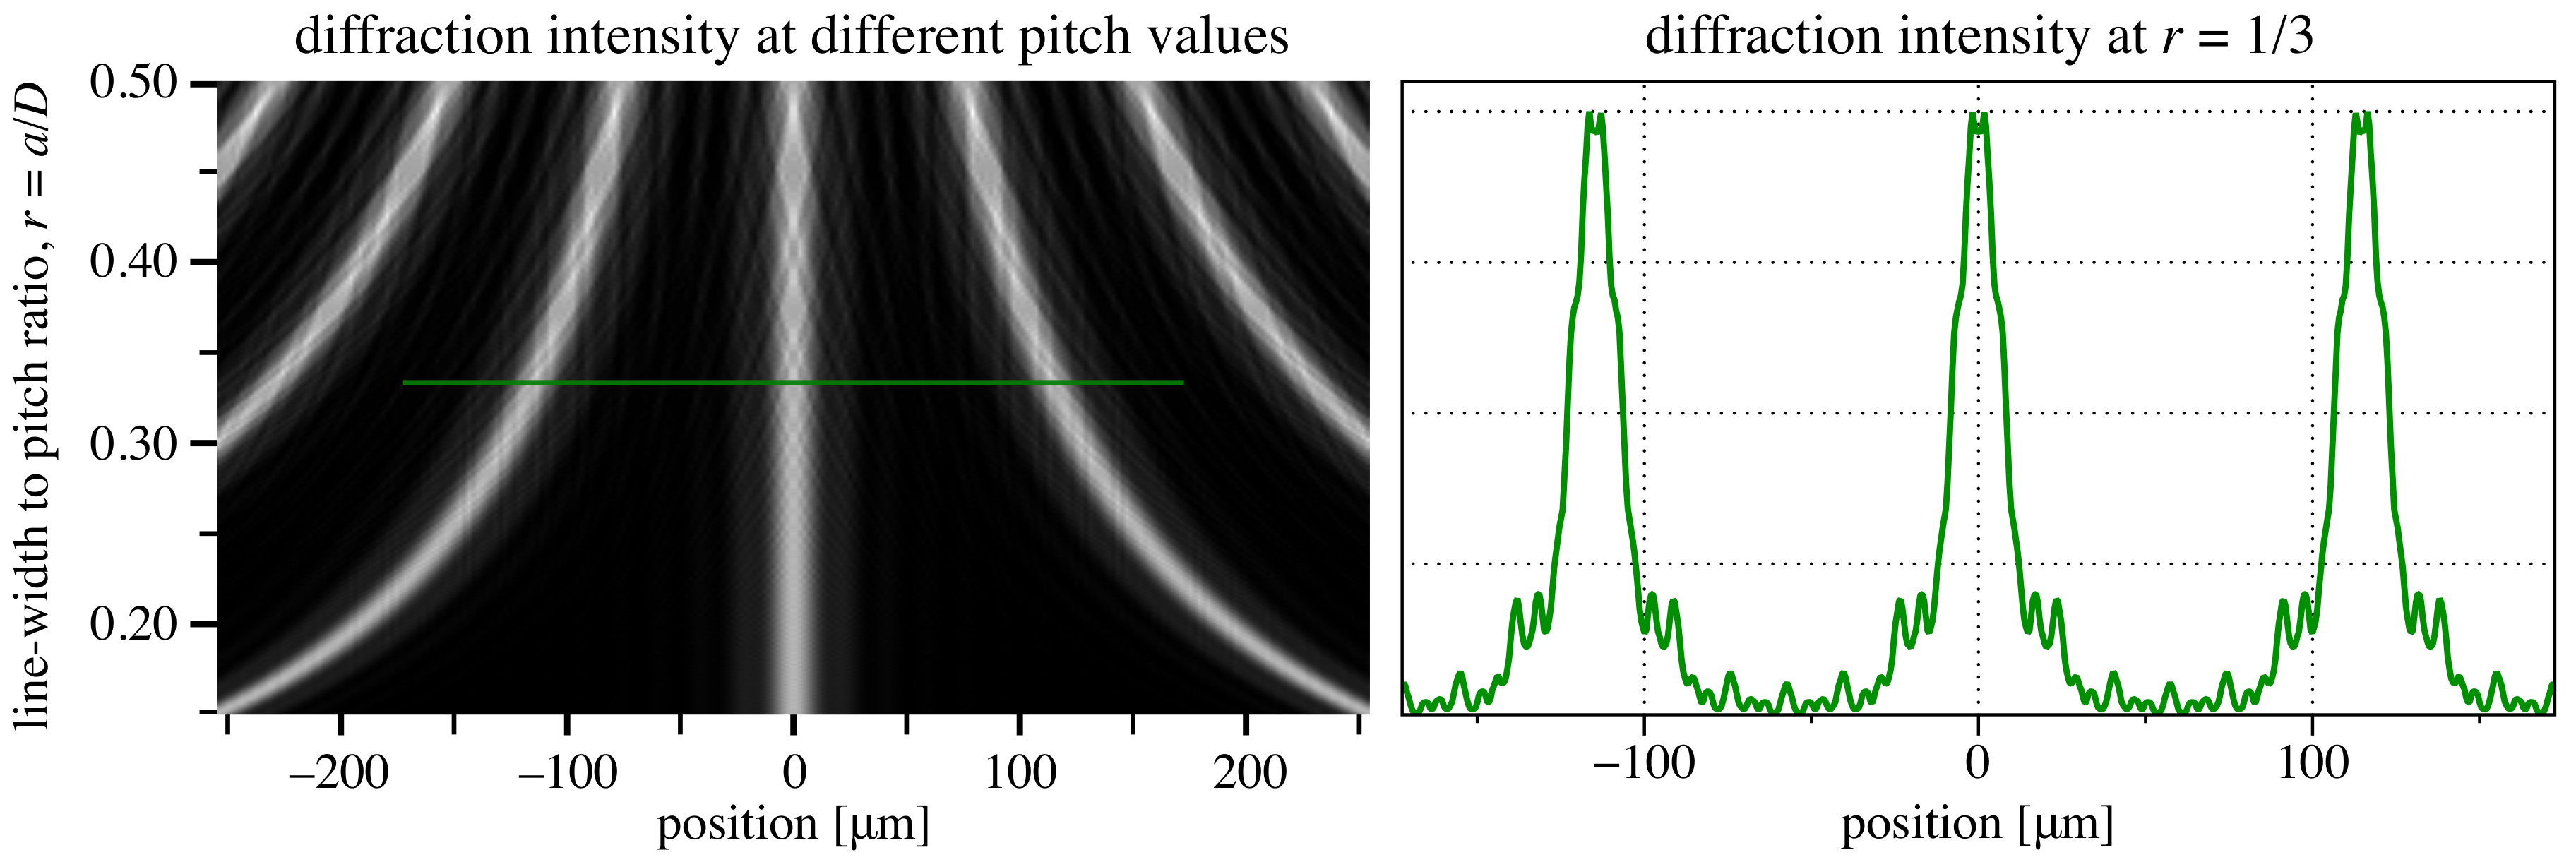
5.2. Hartmann
5.3. Modeling Aberrated Wavefronts
6. Discussion
Author Contributions
Funding
Acknowledgments
Conflicts of Interest
References
- Thibault, P.; Dierolf, M.; Menzel, A.; Bunk, O.; David, C.; Pfeiffer, F. High-Resolution Scanning X-ray Diffraction Microscopy. Science 2008, 321, 379–382. [Google Scholar] [CrossRef] [PubMed]
- Shpyrko, O.G. X-ray photon correlation spectroscopy. J. Synchrotron Radiat. 2014, 21, 1057–1064. [Google Scholar] [CrossRef] [PubMed]
- Naulleau, P.P.; Goldberg, K.A.; Bokor, J. Extreme ultraviolet carrier-frequency shearing interferometry of a lithographic four-mirror optical system. J. Vac. Sci. Technol. B 2000, 18, 2939–2943. [Google Scholar]
- Sugisaki, K.; Okada, M.; Otaki, K.; Zhu, Y.; Kawakami, J.; Murakami, K.; Ouchi, C.; Hasegawa, M.; Kato, S.; Hasegawa, T.; et al. EUV wavefront measurement of six-mirror optics using EWMS. Proc. SPIE 2008, 6921, 788–796. [Google Scholar] [CrossRef]
- Matsuyama, S.; Yokoyama, H.; Fukui, R.; Kohmura, Y.; Tamasaku, K.; Yabashi, M.; Yashiro, W.; Momose, A.; Ishikawa, T.; Yamauchi, K. Wavefront measurement for a hard-X-ray nanobeam using single-grating interferometry. Opt. Express 2012, 20, 24977–24986. [Google Scholar] [CrossRef]
- Merthe, D.J.; Yashchuk, V.V.; Goldberg, K.A.; Kunz, M.; Tamura, N.; McKinney, W.R.; Artemiev, N.A.; Celestre, R.S.; Morrison, G.Y.; Anderson, E.H.; et al. Methodology for optimal in situ alignment and setting of bendable optics for nearly diffraction-limited focusing of soft X-rays. Opt. Eng. 2013, 52, 1–14. [Google Scholar] [CrossRef][Green Version]
- Wojdyla, A.; Bryant, D.; Chao, W.; Assoufid, L.; Cocco, D.; Idir, M.; Goldberg, K.A. Design and demonstration of tunable soft X-ray lateral shearing and Hartmann wavefront sensors. Proc. SPIE 2018, 10760, 1076003. [Google Scholar] [CrossRef]
- Seaberg, M.; Cojocaru, R.; Berujon, S.; Ziegler, E.; Jaggi, A.; Krempasky, J.; Seiboth, F.; Aquila, A.; Liu, Y.; Sakdinawat, A.; et al. Wavefront sensing at X-ray free-electron lasers. J. Synchrotron Radiat. 2019, 26, 1115–1126. [Google Scholar] [CrossRef]
- Mercère, P.; Zeitoun, P.; Idir, M.; Le Pape, S.; Douillet, D.; Levecq, X.; Dovillaire, G.; Bucourt, S.; Goldberg, K.A.; Naulleau, P.P.; et al. Hartmann wave-front measurement at 13.4 nm with λEUV/120 accuracy. Opt. Lett. 2003, 28, 1534. [Google Scholar] [CrossRef]
- Mercère, P.; Idir, M.; Moreno, T.; Cauchon, G.; Dovillaire, G.; Levecq, X.; Couvet, L.; Bucourt, S.; Zeitoun, P. Automatic alignment of a Kirkpatrick-Baez active optic by use of a soft-X-ray Hartmann wavefront sensor. Opt. Lett. 2006, 31, 199–201. [Google Scholar] [CrossRef]
- Idir, M.; Mercere, P.; Modi, M.H.; Dovillaire, G.; Levecq, X.; Bucourt, S.; Escolano, L.; Sauvageot, P. X-ray active mirror coupled with a Hartmann wavefront sensor. Nucl. Instruments Methods Phys. Res. A 2010, 616, 162–171. [Google Scholar] [CrossRef]
- Keitel, B.; Plönjes, E.; Kreis, S.; Kuhlmann, M.; Tiedtke, K.; Mey, T.; Schäfer, B.; Mann, K. Hartmann wavefront sensors and their application at FLASH. J. Synchrotron Radiat. 2016, 23, 43–49. [Google Scholar] [CrossRef] [PubMed]
- Le Pape, S.; Zeitoun, P.; Idir, M.; Dhez, P.; Rocca, J.J.; François, M. Electromagnetic-Field Distribution Measurements in the Soft X-ray Range: Full Characterization of a Soft X-ray Laser Beam. Phys. Rev. Lett. 2002, 88, 183901. [Google Scholar] [CrossRef]
- Reininger, R.; de Castro, A. High resolution, large spectral range, in variable-included-angle soft X-ray monochromators using a plane VLS grating. Nucl. Instruments Methods Phys. Res. Sect. A Accel. Spectrometers, Detect. Assoc. Equip. 2005, 538, 760–770. [Google Scholar] [CrossRef]
- Balmer, R.T. Modern Engineering Thermodynamics; Academic Press: Boston, MA, USA, 2011; p. 128. [Google Scholar] [CrossRef]
- Assoufid, L.; Shi, X.; Marathe, S.; Benda, E.; Wojcik, M.J.; Lang, K.; Xu, R.; Liu, W.; Macrander, A.T.; Tischler, J.Z. Development and implementation of a portable grating interferometer system as a standard tool for testing optics at the Advanced Photon Source beamline 1-BM. Rev. Sci. Instrum. 2016, 87, 052004. [Google Scholar] [CrossRef] [PubMed]
- Neviere, M.; Maystre, D.; Hunter, W.R. On the use of classical and conical diffraction mountings for xuv gratings. J. Opt. Soc. Am. 1978, 68, 1106–1113. [Google Scholar] [CrossRef]
- Goldberg, K.A.; Bryant, D.; Wojdyla, A.; Helmbrecht, M.; Gullikson, E. Reflective binary amplitude grating for soft X-ray shearing and Hartmann wavefront sensing. Opt. Lett. 2020, 45, 4694–4697. [Google Scholar] [CrossRef]
- Uhlén, F.; Rahomäki, J.; Nilsson, D.; Seiboth, F.; Sanz, C.; Wagner, U.; Rau, C.; Schroer, C.G.; Vogt, U. Ronchi test for characterization of X-ray nanofocusing optics and beamlines. J. Synchrotron Radiat. 2014, 21, 1105–1109. [Google Scholar] [CrossRef]
- Wyant, J.C. Double Frequency Grating Lateral Shear Interferometer. Appl. Opt. 1973, 12, 2057–2060. [Google Scholar] [CrossRef]
- Schwider, J. Single sideband Ronchi test. Appl. Opt. 1981, 20, 2635. [Google Scholar] [CrossRef]
- Sugisaki, K.; Okada, M.; Zhu, Y.; Otaki, K.; Liu, Z.; Kawakami, J.; Ishii, M.; Saito, J.; Murakami, K.; Hasegawa, M.; et al. Comparisons between EUV at-wavelength metrological methods. Adv. Metrol. X-ray EUV Opt. 2005, 5921, 59210D. [Google Scholar] [CrossRef]
- Siegel, C.; Loewenthal, F.; Balmer, J.E. A wavefront sensor based on the fractional Talbot effect. Opt. Commun. 2001, 194, 265–275. [Google Scholar] [CrossRef]
- Bjorkholm, J.E.; MacDowell, A.A.; Wood, O.R.; Tan, Z.; LaFontaine, B.; Tennant, D.M. Phase-measuring interferometry using extreme ultraviolet radiation. J. Vac. Sci. Technol. B 1995, 13, 2919–2922. [Google Scholar] [CrossRef]
- Ray-Chaudhuri, A.K.; Krenz, K.D. At-wavelength characterization of an extreme ultraviolet camera from low to mid-spatial frequencies with a compact laser plasma source. J. Vac. Sci. Technol. B Microelectron. Nanometer Struct. 1997, 15, 2462. [Google Scholar] [CrossRef]
- Winthrop, J.T.; Worthington, C.R. Theory of Fresnel Images I Plane Periodic Objects in Monochromatic Light. J. Opt. Soc. Am. 1965, 55, 373. [Google Scholar] [CrossRef]
- Talbot, H. LXXVI. Facts relating to optical science. No. IV. Lond. Edinb. Dublin Philos. Mag. J. Sci. 1836, 9, 401–407. [Google Scholar] [CrossRef]
- Rayleigh, L. XXV. On copying diffraction-gratings, and on some phenomena connected therewith. Lond. Edinb. Dublin Philos. Mag. J. Sci. 1881, 11, 196–205. [Google Scholar] [CrossRef]
- Paganin, D. Coherent X-ray Optics; Oxford University Press: Oxford, UK, 2006; p. 397. [Google Scholar] [CrossRef]
- Podanchuk, D.; Kovalenko, A.; Kurashov, V.; Kotov, M.; Goloborodko, A.; Danko, V. Bottlenecks of the wavefront sensor based on the Talbot effect. Appl. Opt. 2014, 53, B223–B230. [Google Scholar] [CrossRef]
- Westerholm, J.; Turunen, J.; Huttunen, J. Fresnel diffraction in fractional Talbot planes: A new formulation. J. Opt. Soc. Am. A 1994, 11, 1283. [Google Scholar] [CrossRef]
- Bobroff, N. Position measurement with a resolution and noise-limited instrument. Rev. Sci. Instrum. 1986, 57, 1152–1157. [Google Scholar] [CrossRef]
- Goodman, J.W. Introduction to Fourier Optics, 2nd ed.; McGraw-Hill: New York, NY, USA, 1996. [Google Scholar]
- Hibino, K.; Farrant, D.I.; Ward, B.K.; Oreb, B.F. Dynamic range of Ronchi test with a phase-shifted sinusoidal grating. Appl. Opt. 1997, 36, 6178–6189. [Google Scholar] [CrossRef] [PubMed]
- Marathe, S.; Shi, X.; Wojcik, M.J.; Kujala, N.G.; Divan, R.; Mancini, D.C.; Macrander, A.T.; Assoufid, L. Probing transverse coherence of X-ray beam with 2-D phase grating interferometer. Opt. Express 2014, 22, 14041–14053. [Google Scholar] [CrossRef] [PubMed]


Publisher’s Note: MDPI stays neutral with regard to jurisdictional claims in published maps and institutional affiliations. |
© 2021 by the authors. Licensee MDPI, Basel, Switzerland. This article is an open access article distributed under the terms and conditions of the Creative Commons Attribution (CC BY) license (http://creativecommons.org/licenses/by/4.0/).
Share and Cite
Goldberg, K.A.; Wojdyla, A.; Bryant, D. Binary Amplitude Reflection Gratings for X-ray Shearing and Hartmann Wavefront Sensors. Sensors 2021, 21, 536. https://doi.org/10.3390/s21020536
Goldberg KA, Wojdyla A, Bryant D. Binary Amplitude Reflection Gratings for X-ray Shearing and Hartmann Wavefront Sensors. Sensors. 2021; 21(2):536. https://doi.org/10.3390/s21020536
Chicago/Turabian StyleGoldberg, Kenneth A., Antoine Wojdyla, and Diane Bryant. 2021. "Binary Amplitude Reflection Gratings for X-ray Shearing and Hartmann Wavefront Sensors" Sensors 21, no. 2: 536. https://doi.org/10.3390/s21020536
APA StyleGoldberg, K. A., Wojdyla, A., & Bryant, D. (2021). Binary Amplitude Reflection Gratings for X-ray Shearing and Hartmann Wavefront Sensors. Sensors, 21(2), 536. https://doi.org/10.3390/s21020536