Abstract
Sulfamethazine (SMZ) as a broad antibiotic is widely used in livestock and poultry. However, the abuse of SMZ in livestock feed can lead to SMZ residues in food and the resistance of bacteria to drugs. Thus, a method for the detection of SMZ in food is urgently needed. In this study, quantum dot (QD) nanobeads (QBs) were synthesized by encapsulating CdSe/ZnS QDs using a microemulsion technique. The prepared QBs as signal probes were applied in lateral flow immunoassay (LFIA) for the detection of SMZ in chicken and milk. Our proposed method had limits of detection of 0.1138–0.0955 ng/mL and corresponding linear ranges of 0.2–12.5, 0.1–15 ng/mL in chicken and milk samples, respectively. The recovery of LFIA for the detection of SMZ was 80.9–109.4% and 84–101.6% in chicken and milk samples, respectively. Overall, the developed QBs-LFIA had high reliability and excellent potential for rapid and sensitive screening of SMZ in food.
1. Introduction
Sulfanilamides (SAs) had been used as a family of broad-spectrum synthetic bacteriostatic antibiotics given to food animals for prophylactic or therapeutic purposes after G. Domagk found that SAs can inhibit bacterial growth [1,2]. Meanwhile, SAs are chemotherapeutic agents widely used as antibacterial drugs in human pharmaceuticals and veterinary practice [3].
SMZ is a derivative of SAs and widely used in livestock [4] and poultry breeding. However, abuse in livestock feed can cause SMZ residues in food [5,6,7]. Widespread use of antibiotics can increase bacterial resistance to drugs; therefore, excessive use of antibiotics will pose a threat to human safety [8]. SMZ exposed in the environment can enter the human body through the food chain and pose a serious threat to human health [9]. Therefore, an effective system that can detect the residues of SMZ needs to be developed. The maximum residue limit of SAs in animal-derived food has been established at 100 μg/kg [10,11].
Many sensitive and specific methods can be used to detect SMZ, including high-performance liquid chromatography [12,13], gas chromatography-mass spectrometry [14], and waveguide interrogated optical immunosensor [15]. Although these methods are relatively sensitive and specific, they require a complex sample preparation process and trained personnel and expensive equipment to perform the operations [16]. LFIA is based on specific recognition of antigens and antibodies. LFIA can be considered a convenient and practical test, and it represents a classic transformation between sample-to-laboratory so that it can be easily used to make decisions [17]. Compared with other methods, it is an analytical method with many superior advantages, such as a short analysis time, long-term stability of test strips, ease of use, and cost-effectiveness [18,19,20,21,22]. Given these advantages, some nanoparticle-based LFIAs have been widely used in qualitative and quantitative detection [23,24]. For example, conventional LFIA using colloidal gold as a label exhibits relatively low sensitivity because of its insufficient brightness. Shim et al. established a rapid immunochromatographic (ICG) strip based on a conjugate of colloidal gold and monoclonal antibody (mAb) for the detection of SMZ in meat and egg samples. The detection limit of the ICG strip is 2 ng/mL [25]. O’Keeffe et al. used mouse anti-rat IgG F(abV)2 fragment-specific antibody, adsorbed to colloidal carbon, as the detection ligand in the LFIA. The LFIA device had a cutoff value of 6.3 ng/mL in diluted (1/10) urine [26]. Compared with traditional methods, polymer nanocontainers have attracted increasing interest in signal amplification systems. The fluorescence-based immunoassay is widely used in biotechnology and clinical testing. Antibodies or antigenic proteins can be easily labeled with a variety of fluorophores for fluorescence detection [27]. For improving the sensitivity of traditional LFIA, the use of QBs has recently attracted our attention due to their incomparable optical properties, such as broad UV excitation with narrow fluorescent emission spectra, large molar extinction coefficient, and high quantum yield [28,29].
In the present work, a novel LFIA was established based on QBs as the label for the sensitive detection of SMZ in chicken and milk. Through the assay mentioned above, QBs-LFIA may be a remarkable method for the sensitive detection of other targets at low concentrations to ensure food safety.
2. Materials and Methods
2.1. Reagents and Materials
SMZ, sulfaguanidine, sulfanilamide, sulfamonomethoxine, sulfadiazine, sulfamethoxazole, sulfacetamide, sulfathiazole, sulfamethizole, and other non-SA antibiotics (lomefloxacin, amantadine, florfenicol) were obtained from J&K Scientific Ltd. (Shanghai, China), and the stock solution of these SAs in methanol (5 mg/mL) was prepared for further use. Hydrophobic octadecylamine-coated CdSe/ZnS QDs were obtained from Ocean NanoTech, LLC (San Diego, CA, USA). Bovine serum albumin (BSA), poly (maleicanhydride-alt-1-octadecene) (PMAO), and goat anti-mouse antibody was obtained from Sigma (St. Louis, MO, USA). Poly (methyl methacrylate) (PMMA), 1-ethyl-3-(3-dimethylaminopropyl) carbodiimide (EDC), and sodium dodecyl sulfonate (SDS) were purchased from Aladdin Bio-Chem Technology Co., Ltd. The monoclonal antibody (mAb) against SMZ was provided by Wuxi Zodoboer Biotech. Co., Ltd. (Wuxi, China). The detective antigen SMZ − BSA was prepared in our laboratory. All of the solvents and other chemicals were of analytical reagent grade. Nitrocellulose (NC) membrane was supplied by Millipore (Bedford, MA, USA). A polyvinylchloride backing pad, an absorbent pad, a sample pad, and a conjugate pad were purchased from Shanghai Kinbio Tech. Co., Ltd. (Wuxi, China). The BioDot XYZ platform, which was equipped with an automated motion control, was acquired from BioDot (Irvine, CA, USA). Fluorescence intensity strip reader for the sake of recording the signal of QBs-LFIA was purchased from Hangzhou Hemai Technology Co., Ltd. (Hangzhou, China).
2.2. Preparation of QBs
The QBs were obtained by encapsulating CdSe/ZnS QDs using the microemulsion technique [30,31]. CdSe/ZnS QDs CHCl3 stock solution (40 mg/mL) was added into PMMA/PMAO CHCl3 stock solution (PMMA: 60 mg/mL; PMAO: 40 mg/mL). Then, the solution was added into SDS aqueous solution by using an ultrasonic homogenizer for 3 min in an ice bath. Subsequently, the CHCl3 was removed by using a rotary evaporator. The mixture was centrifuged at 13,000 r/min at 4 °C for 15 min and washed three times with distilled water. The obtained QBs were purified via centrifugation and then resuspended in 1 mL of 0.01 M NaOH solution for 8 h to modify the carboxyl on the surface of the QBs. Finally, the carboxylated QBs were washed three times with Millipore water.
2.3. Preparation and Characterization of QBs-mAb
The anti-SMZ monoclonal antibodies were directly bound to QBs. An amount of 5 μL of EDC (0.5 mg/mL), 5 μL of QBs (12.6 mg/mL), and 50 μL mAb (0.2 mg/mL) was added to 0.5 mL of 0.01 M PB buffer (pH7.0) with gentle stirring for 1 h at room temperature. Then, 0.1 mL BSA (10% wt/vol) was added to block the remaining sites for 1 h. The resulting mixture was centrifuged at 13,500 r/min for 10 min. Then the QBs and the anti-SMZ mAb conjugates (QBs-mAb) were resuspended in 0.1 mL of PBS (0.01 M, pH 7.4). The hydration size of the free QBs and QBs-mAb probes were given analysis by using a particle size analyzer (Malvern Instruments Ltd., Worcestershire, UK).
2.4. Assembling of QBs-LFIA Sensor
The goat anti-mouse IgG and SMZ − BSA were diluted with PBS (0.01 M), and then the two mixtures were sprayed to control lines (C) and test lines (T) on the nitrocellulose membrane and dried at 37 °C overnight. The distance between the T and C lines was about 5 mm. After drying at 60 °C for 2 h, the sample pad, NC membrane, and absorption pad were neatly attached to the plastic pad, cut into 4 mm wide strips, placed in a plastic box, and stored in a drying box at room temperature.
2.5. Procedure of QBs-LFIA
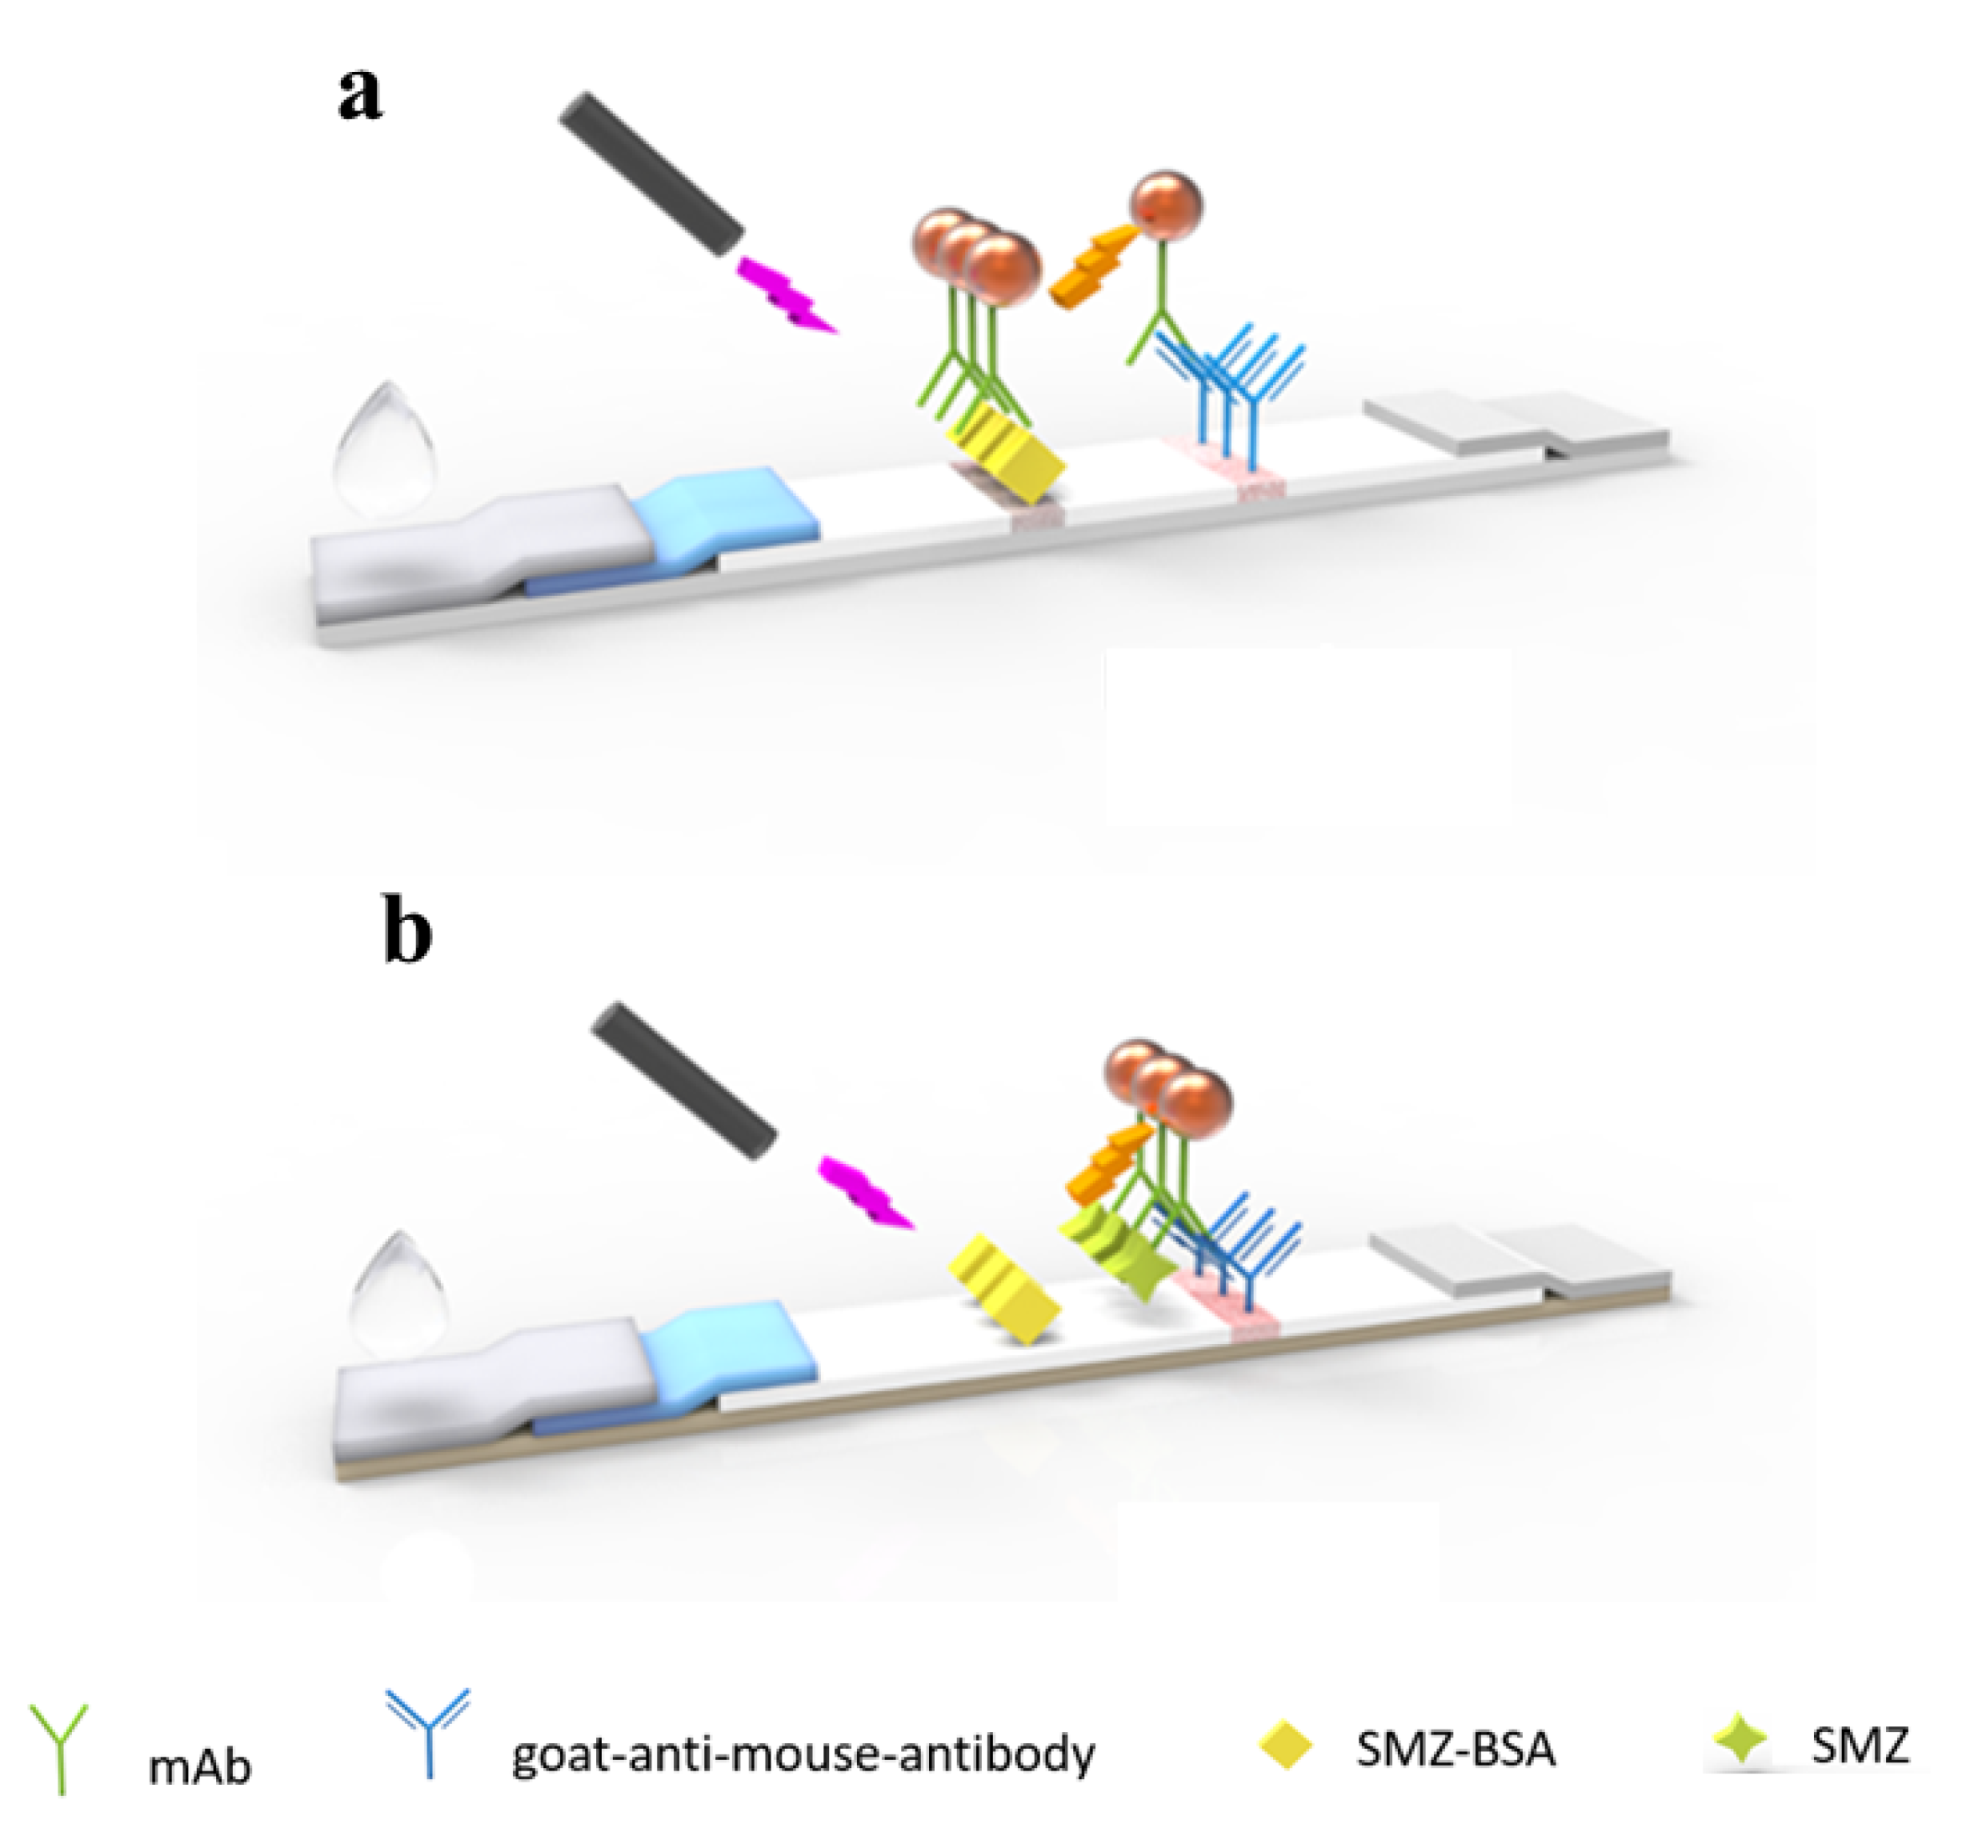
SMZ stock solution was diluted in 0.01 M PBS, 0.1 mL of sample solution, and 2 μL of QBs-mAb probe, and was mixed for 5 min and then added on the sample pad of the LFIA test strip. After 20 min of reaction, the fluorescence intensity on the test line was recorded by the corresponding reader. As shown in Scheme 1, with the help of the absorption pad, the conjugates migrate to the NC membrane. When the sample is negative, the QBs-mAb probe binds to the antigen on the T line. By contrast, when SMZ is present in the sample, the QBs-mAb probe combines with SMZ preferentially, and the excess probe captures the antigen on the T line. The more SMZ in the sample, the lower the fluorescence intensity of the T line. All the QBs-mAb probes should react with the goat anti-mouse IgG to form a fluorescent band on the C line.

Scheme 1.
Schematic illustration of the QBs-LFIA for SMZ detection. (a) Negative, (b) positive.
2.6. Optimization of the Key Parameters
For the best performance of our proposed QBs-LFIA, we used single-factor analysis to optimize the key factors that could influence the limit of detection, such as the coupling pH, concentration of EDC, amount of mAb decorated to QBs, concentration of SMZ − BSA on the T line, amount of QBs-mAb, and immunological kinetic reaction time [32].
2.7. Study on Immune Dynamic Response
The immune response of antigen antibody on the immunochromatographic strip is a dynamic process in which the T-line signal intensity changes dynamically with the increase of the reaction time. The signal strength will rise slowly and then gradually stabilize. Therefore, in order to make the experimental results more reliable, immunodynamic analysis was performed. After incubating 100 μL of negative PBS (without SMZ) and positive PBS (with 1 ng/mL SMZ) with 5 μL of QB-labeled antibody for 5 min, they were dropped into the sample hole on the test strip. After 2 min, the signal strength of the T-line was measured with a reader every 1 min, and the detection continued for 50 min. Using the detection time as the abscissa and the T-line fluorescence intensity and inhibition rate as the ordinate, the immune response dynamic curve was drawn to select the optimal detection time.
2.8. Establishment of Standard Calibration Curve in PBS
SMZ (0, 0.01, 0.05, 0.1, 0.25, 0.5, 1.0, 2, 2.5, 5.0, 10.0, 20, 25, 50, 100 ng/mL) was added to PBS. A standard curve was established using the logarithm of the concentration of SMZ and fluorescence intensity of the T line. The limit of detection (LOD) was defined as IC90 [15]. All experiments were performed in triplicate.
2.9. Specificity Assessment
The specificity of QBs-LFIA was tested at a concentration of 20.0 ng mL−1 with structurally similar analogs, including SMZ, sulfaguanidine, sulfapyridine, sulfanilamide, sulfamonomethoxine, sulfadiazine, sulfamethoxazole, sulfacetamide, sulfathiazole, sulfamethizole, and other non-SAs antibiotics (lomefloxacin, amantadine, florfenicol). All experiments were performed in triplicate.
2.10. Sample Preparation
2.10.1. Chicken Sample Pretreatment
Samples of chicken were smashed and stored at −20 °C for further analysis. An amount of 10 µL of working standard solution was added to the chicken sample (5.0 g) in a centrifuge tube, and the mixture was vortexed for 30 s. After being sonicated for 30 min and centrifuged at 8500 rpm at 4 °C for 15 min, the resulting supernatant solution was concentrated to near dryness under nitrogen at 50 °C. The resulting residue was redissolved in 1 mL PBS for further analysis.
2.10.2. Milk Sample Pretreatment
For sample treatment, 5 g milk sample was centrifuged at 9000 rpm for 20 min. The supernatant solution was collected and diluted 10-fold for further analysis.
2.11. Detection of SMZ in Real Samples
2.11.1. Establishment of Standard Calibration Curve in Real Samples
SMZ (0, 0.01, 0.05, 0.1, 0.25, 0.5, 1.0, 2, 2.5, 5.0, 10.0, 20, 25, 50, 100 ng/mL) was spiked to the chicken and milk. We established a standard curve using the logarithm of the concentration of SMZ and fluorescence intensity. All experiments were performed in triplicate.
2.11.2. Recovery of SMZ on the QBs-LFIA System in 2 Food Matrices
SMZ (0.5, 5, and 7.5 ng/mL) was added to the 2 food matrices. The recovery and coefficient of variation (CV) of SMZ in the real samples were quantitatively analyzed on the LFIA system. All experiments were performed in triplicate.
2.11.3. Analysis of HPLC
Eight chicken samples and eight milk samples were selected and determined by the developed QBs-LFIA and HPLC [33] to verify the reliability of the QBs-LFIA.
3. Results and Discussion
3.1. Characterization of QBs and QBs-mAb
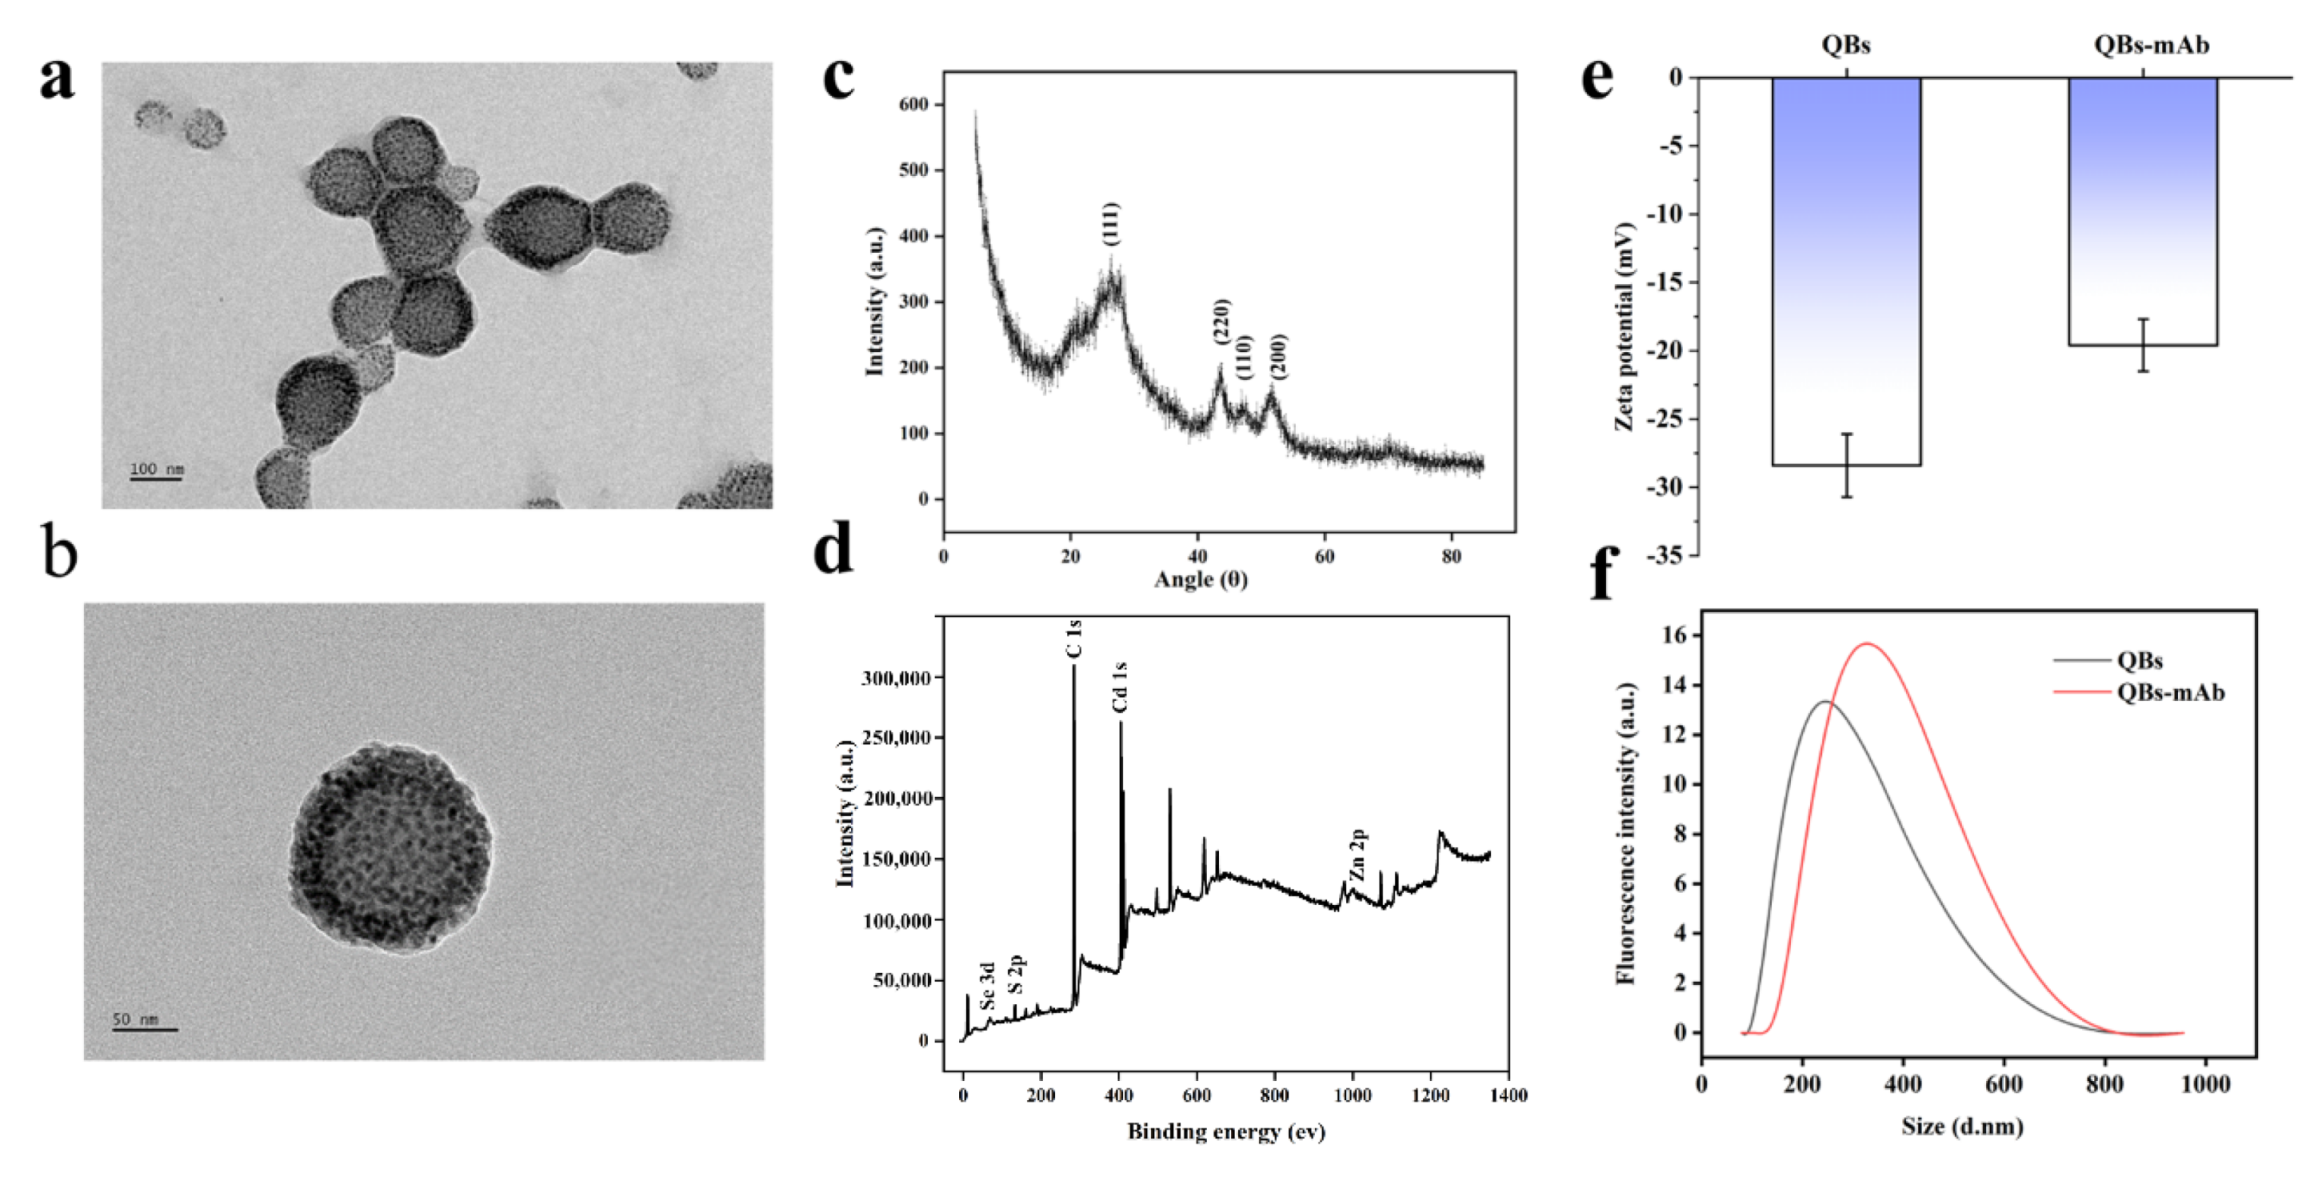
Figure 1a shows a transmission electron microscope (TEM) image of the QBs. The image indicates that the QBs have relatively uniform particle size distribution and present regular quasi-spherical shapes with an average diameter of 158 nm, while Figure 1b shows an individual QB at high magnification. XRD patterns in Figure 1c show that the three distinct QBs peaks positioned at 26.6, 43.5, and 51, which were similar to the QDs in a previous report, still retained CdSe/ZnS QDs structural characteristics [34,35]. X-ray photoelectron spectroscopy was employed to demonstrate the chemical composition and surface chemical states of QBs. As Figure 1d shows, the survey spectra of QBs were composed of Zn, Cd, and Se elements, which is consistent with the QDs spectra, as a previous work reported [36,37]. In Figure 1f, DLS analysis indicates that the hydrodynamic diameter of the QBs is about 255 nm, while that of the QBs-mAb raises it to 315 nm. Meanwhile, the zeta-potential of QBs and QBs-mAb was monitored; as Figure 1e shows, the zeta potential of QBs is −28 mV, while the QBs-mAb raises it to −18 mV. The results demonstrate that the anti-SMZ mAb was favorably coupled on the surface of the QBs.
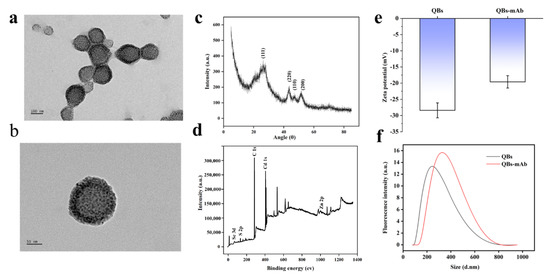
Figure 1.
Characterization of QBs and QBs-mAb. (a) High-resolution TEM image of the QBs. (b) Individual QB at high magnification. (c) XRD patterns of QBs, (d) XPS survey of QBs, (e) zeta potential of QBs before and after coupling with mAb. (f) Size distribution of the hydrodynamic diameter of QBs and QBs-mAb.
3.2. Optimization of QBs-LFIA
3.2.1. Optimization of the Coupling pH
It is necessary to optimize the pH of the label because it affects the activity of the antibody and the conjugation between the antibody with the QBs. We evaluated the effect of pH value through analyzing the fluorescence intensity, which varied, as the pH values ranged from 5.5 to 8.0. As can be seen from Figure 2, when the QBs-labeled antibody is sufficient, the detection signal strength of the T line fluctuates according to the coupling pH. The T-line signal reached its maximum strength at pH = 6.5, but the inhibition rate was lower than that at pH = 7.0. Both high FIT0 and inhibition ratio were attained at pH 7.0. Therefore, pH = 7.0 was chosen as the optimal pH.
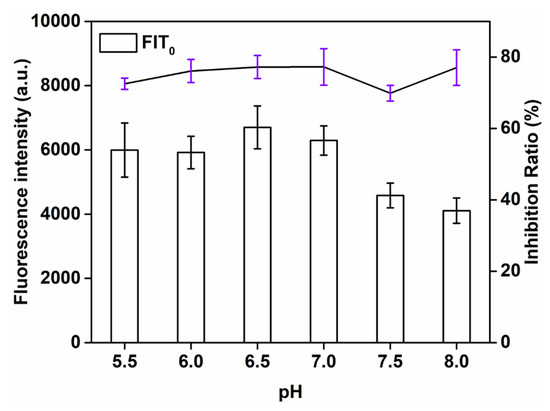
Figure 2.
Optimization detection conditions of QBs-LFIA. Effects of pH value.
3.2.2. Optimization of the Concentration of EDC
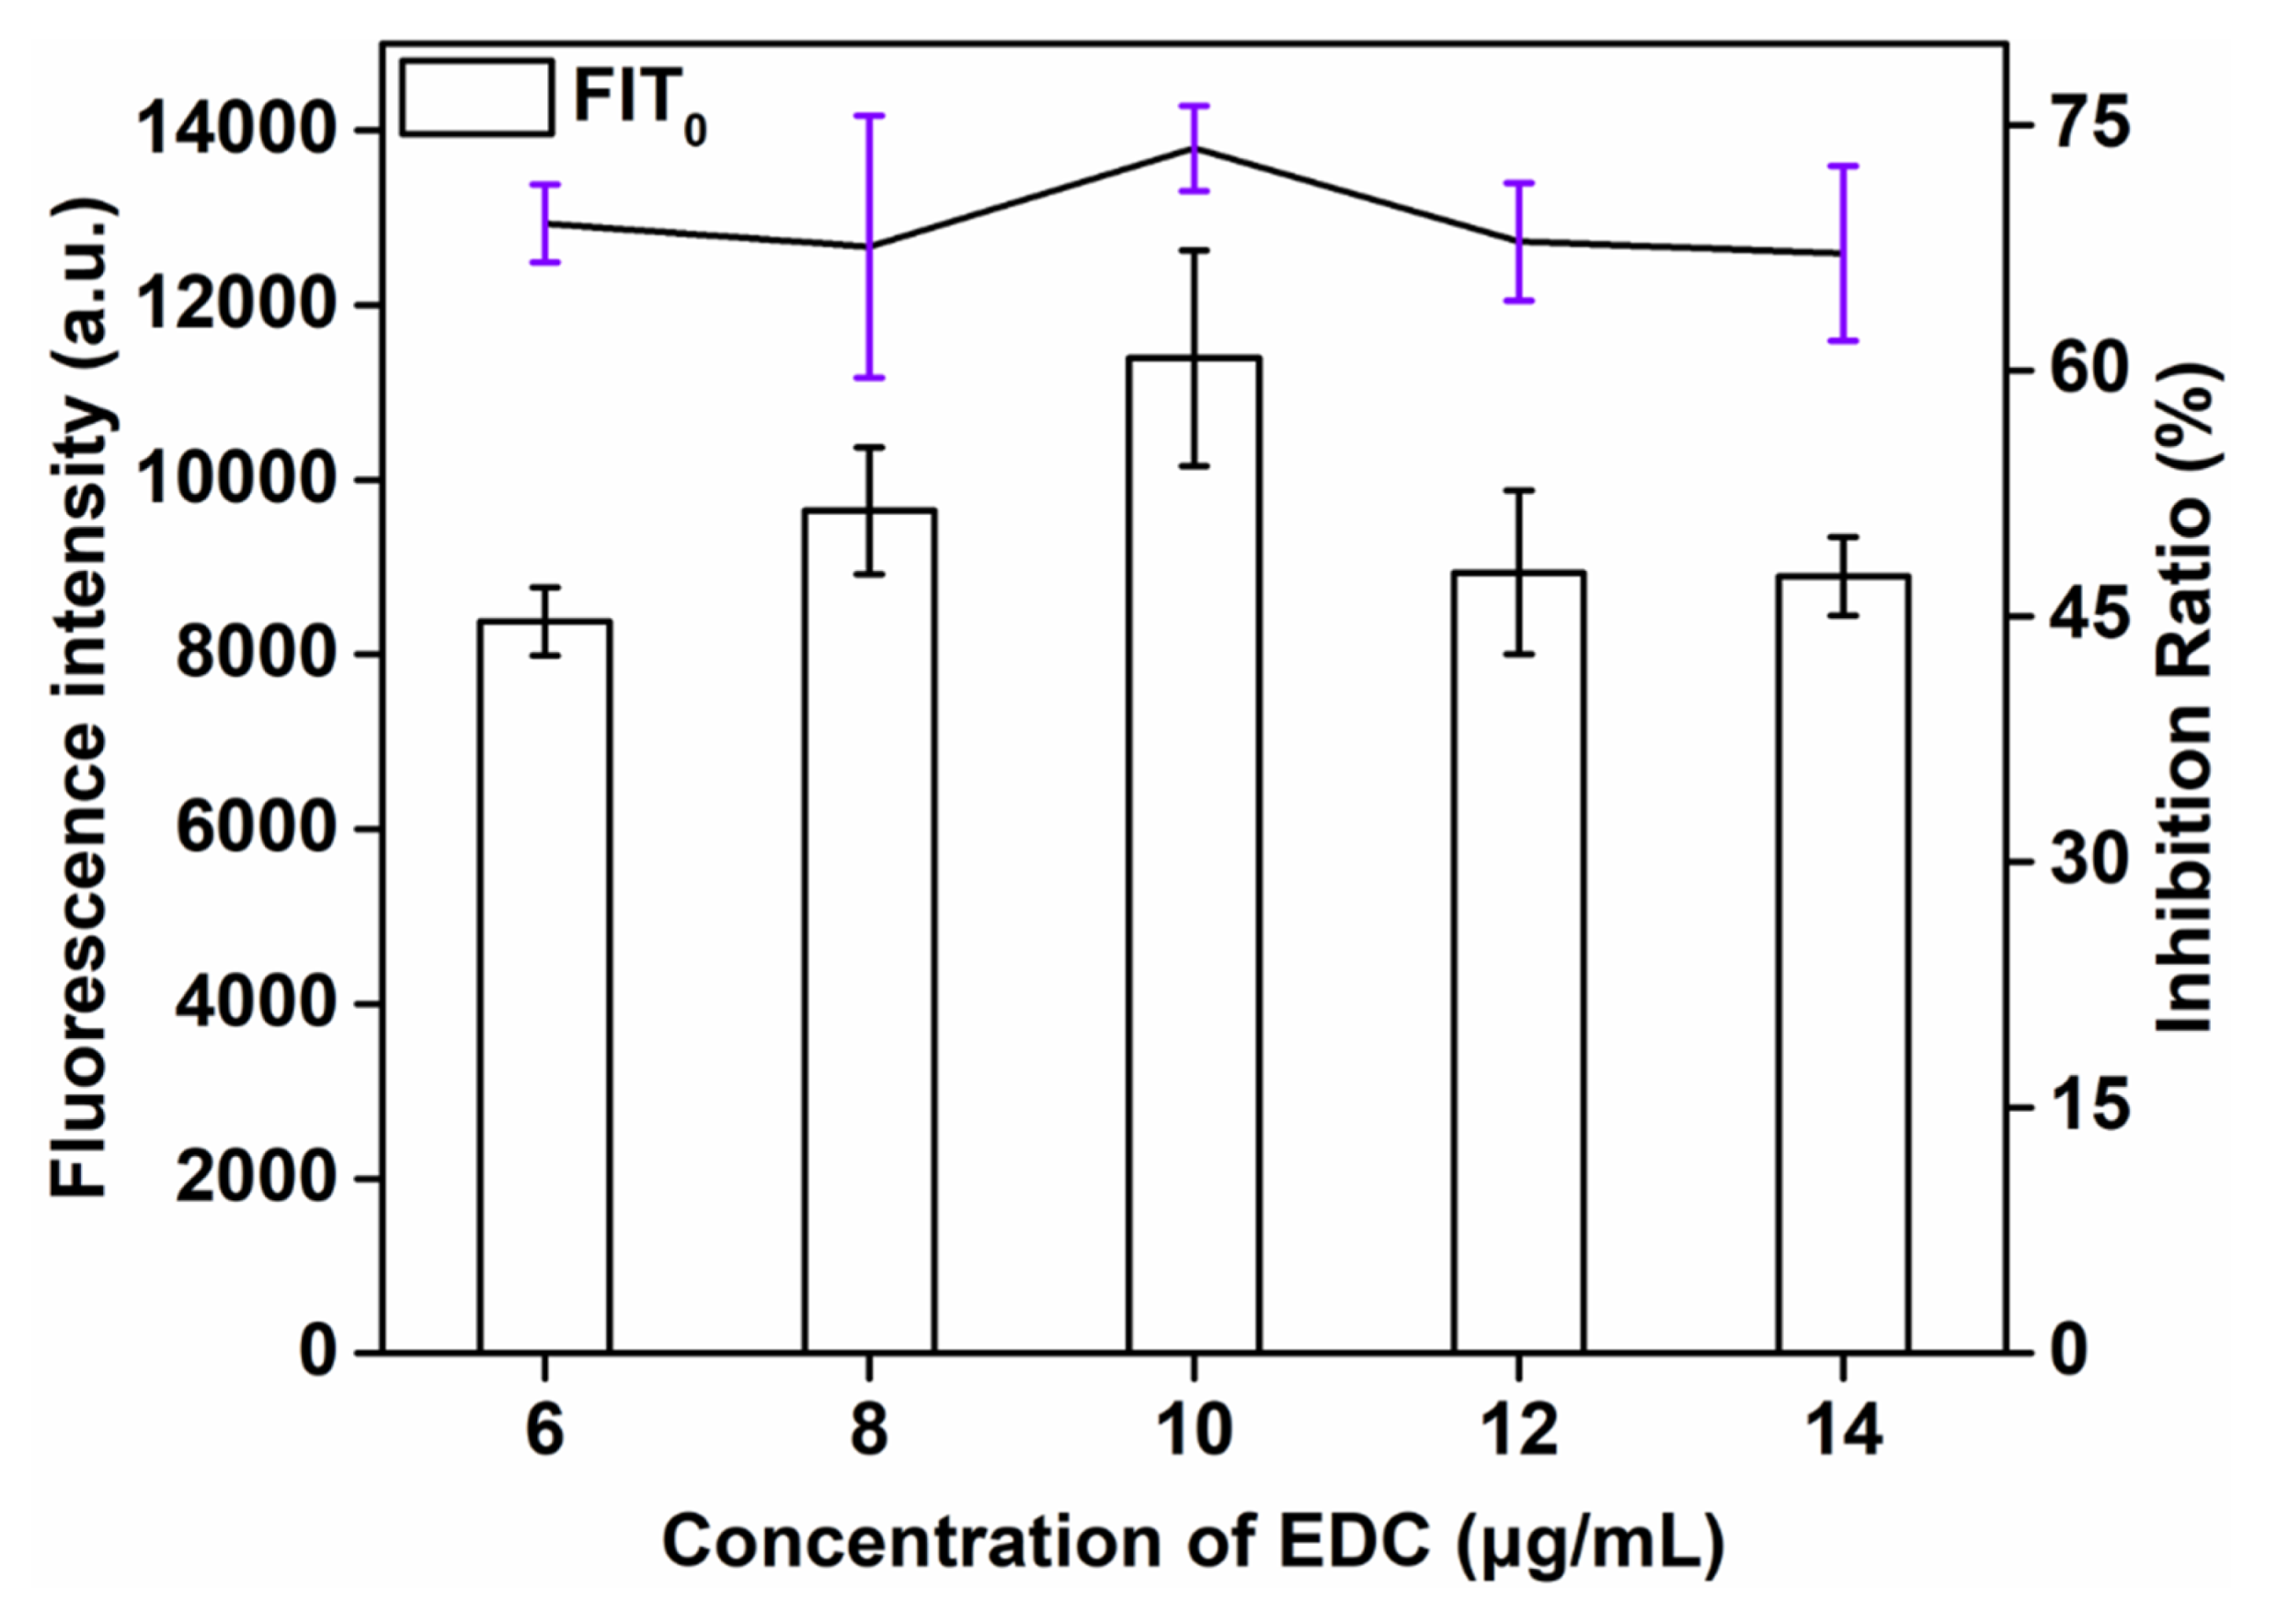
The effect of the concentration of EDC, an important factor influencing the F of the biosensor, on the sensitivity of QBs-LFIA was also investigated. The successful preparation of the probe was mainly attributed to covalently coupling the amino group of anti-SMZ mAb with the carboxyl group of QBs in the presence of EDC. This study explored the influence of the concentration of EDC (6, 8, 10, 12, and 14 μg/mL) on the detection signal strength and inhibition rate. As can be seen from Figure 3, the signal strength and inhibition rate both increased with the additive amount of EDC consumption and reached the maximum value at 10 μg/mL (73.8%). When the concentration of EDC continued to increase, the signal strength and inhibition rate showed a downward trend. Therefore, the optimal amount of EDC was 10 μg/mL.
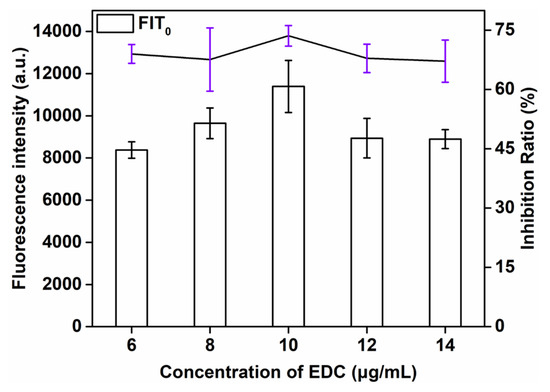
Figure 3.
Optimization detection conditions of QBs-LFIA. Effects of concentration of EDC.
3.2.3. Optimization of the Amount of mAb
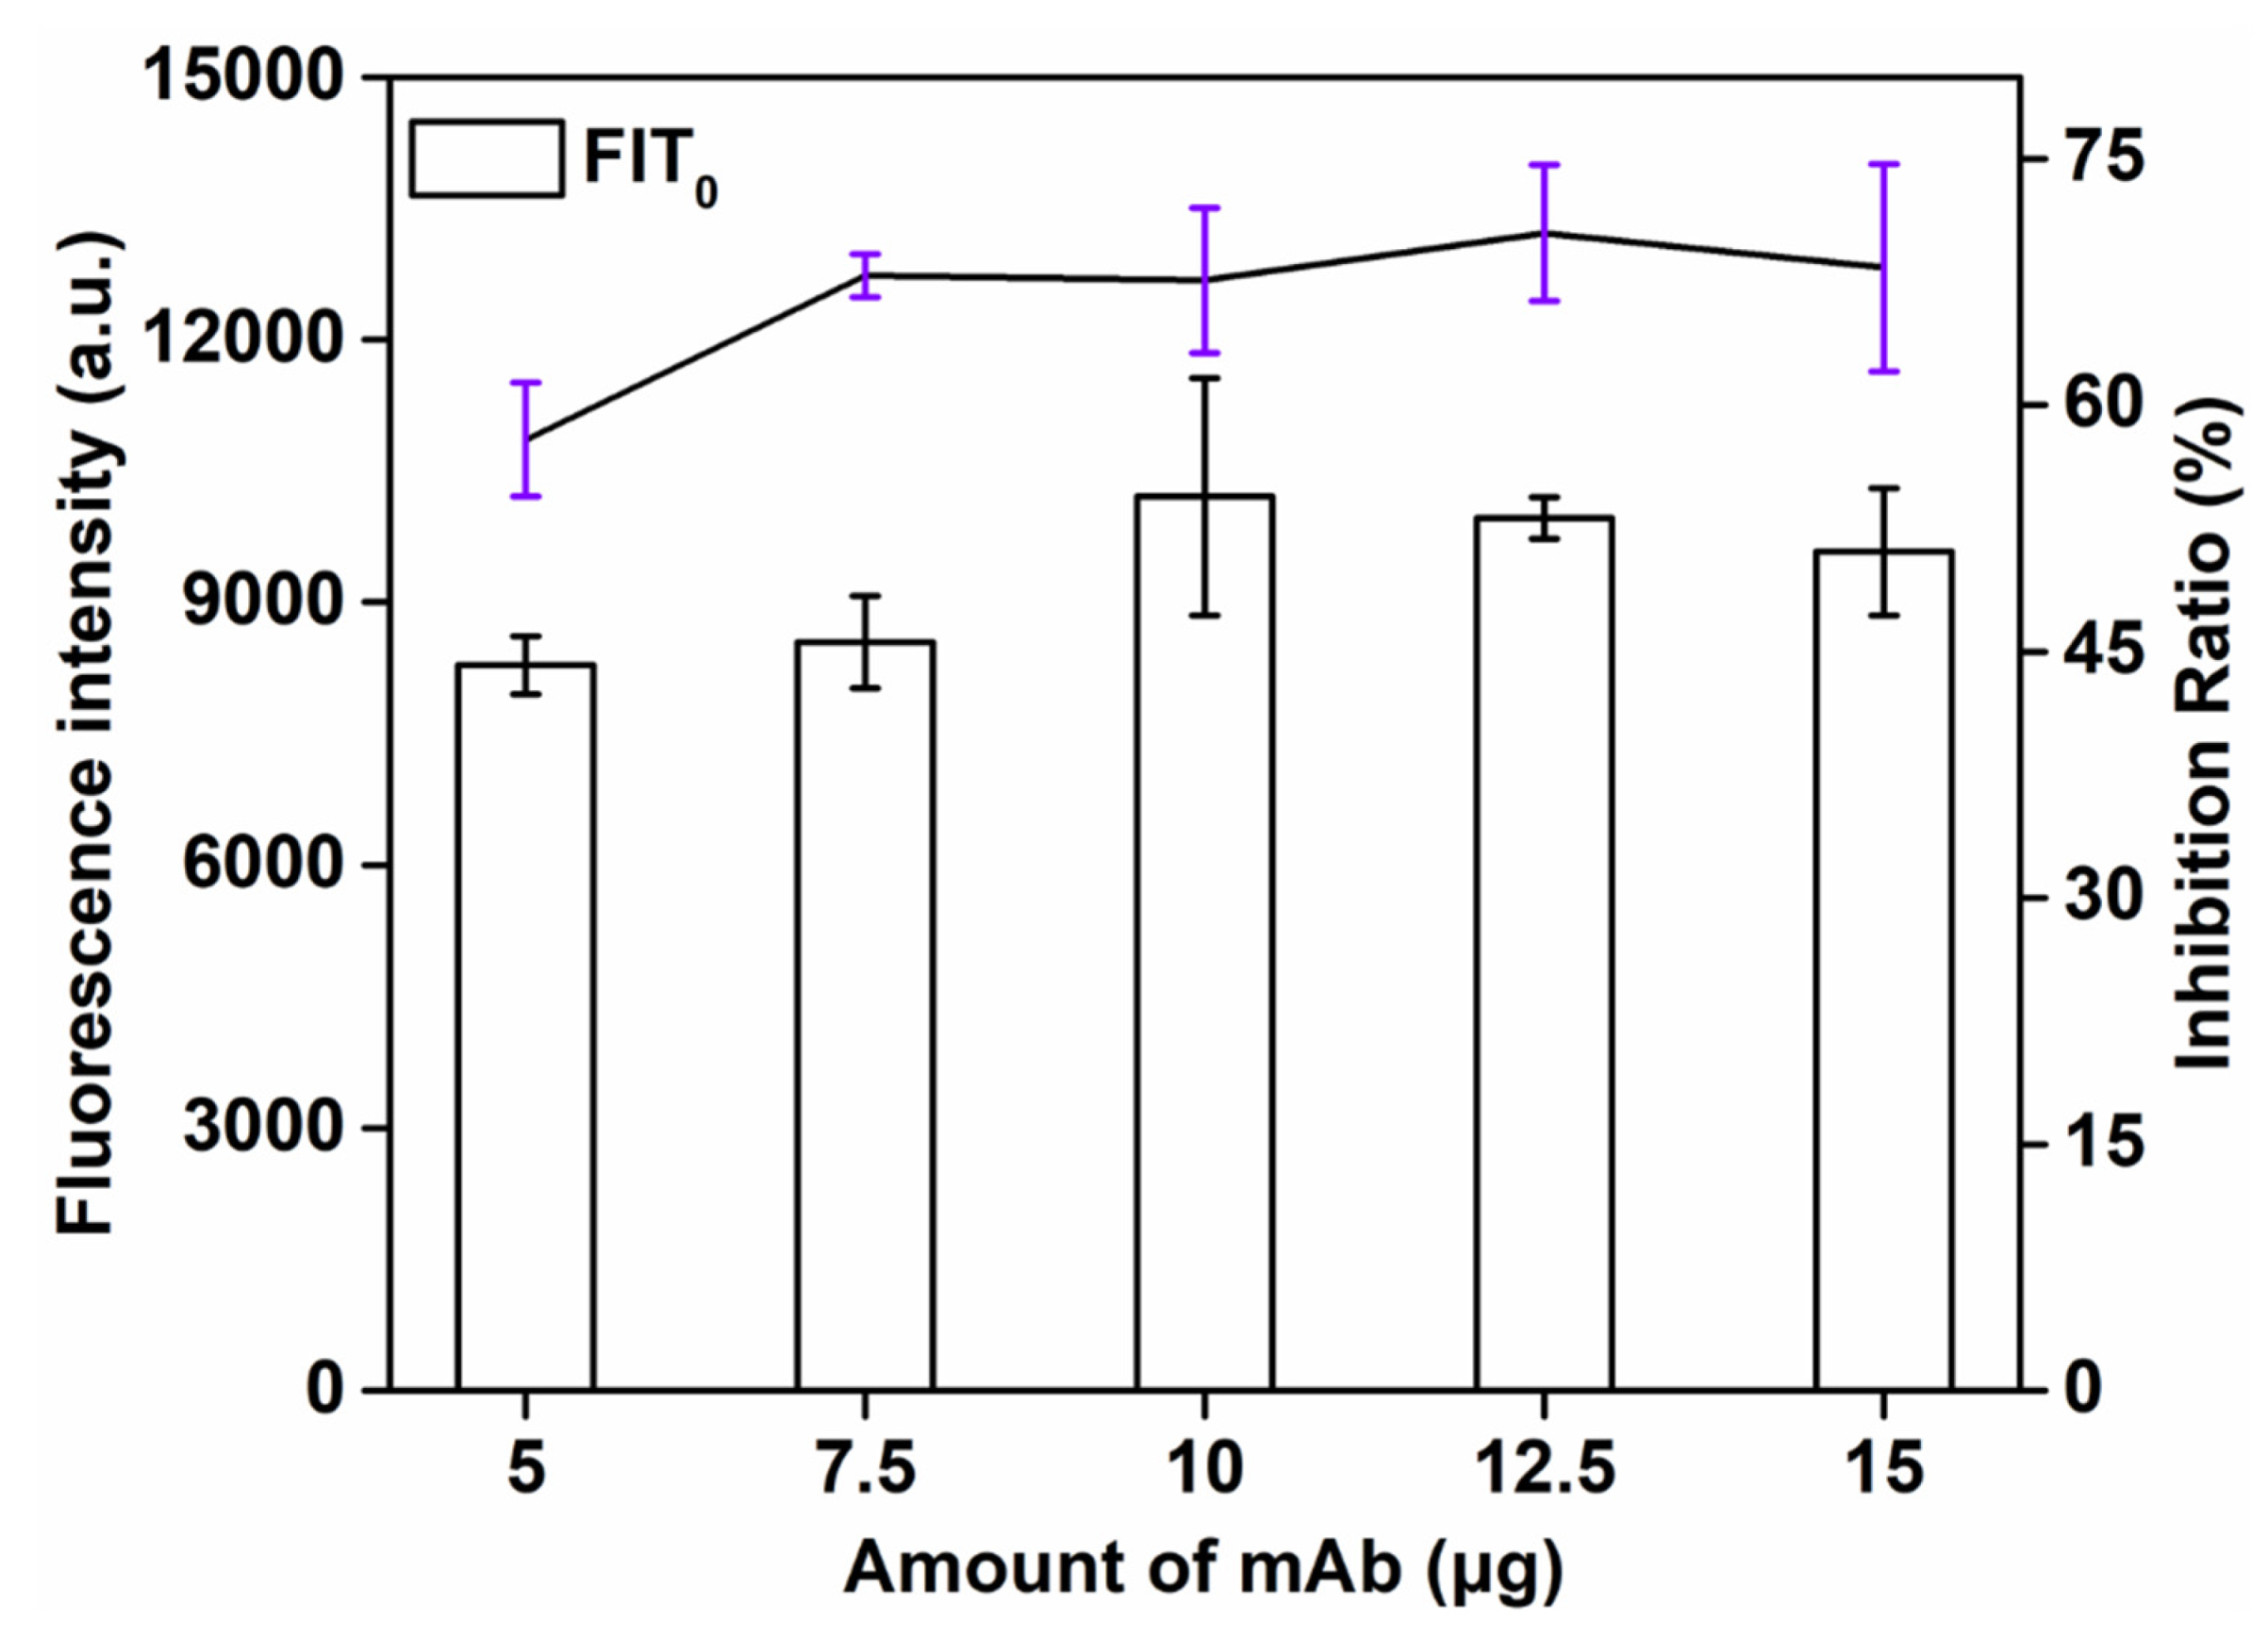
This study explored the influence of the amount of labeled antibody (5, 7.5, 10, 12.5, 15 μg) on the detection signal strength and inhibition rate. As can be seen from Figure 4, the signal strength increased with the increase in the amount of labeled antibody. The higher the volume of the antibody, the more SMZ − BSA binding and the stronger the T-line signal. When 12.5 μg of mAb was applied, the maximum inhibition rate (72.3%) was obtained. However, the T-line signal was the strongest when the amount of mAb was 10 μg, and the inhibition rate (70.8%) was a little lower than the amount of mAb at 12.5 μg. Finally, the optimal amount of mAb was 12.5 μg.

Figure 4.
Optimization detection conditions of QBs-LFIA. Effects of amount of mAb.
3.2.4. Optimization of the Concentration of SMZ − BSA on the T Line
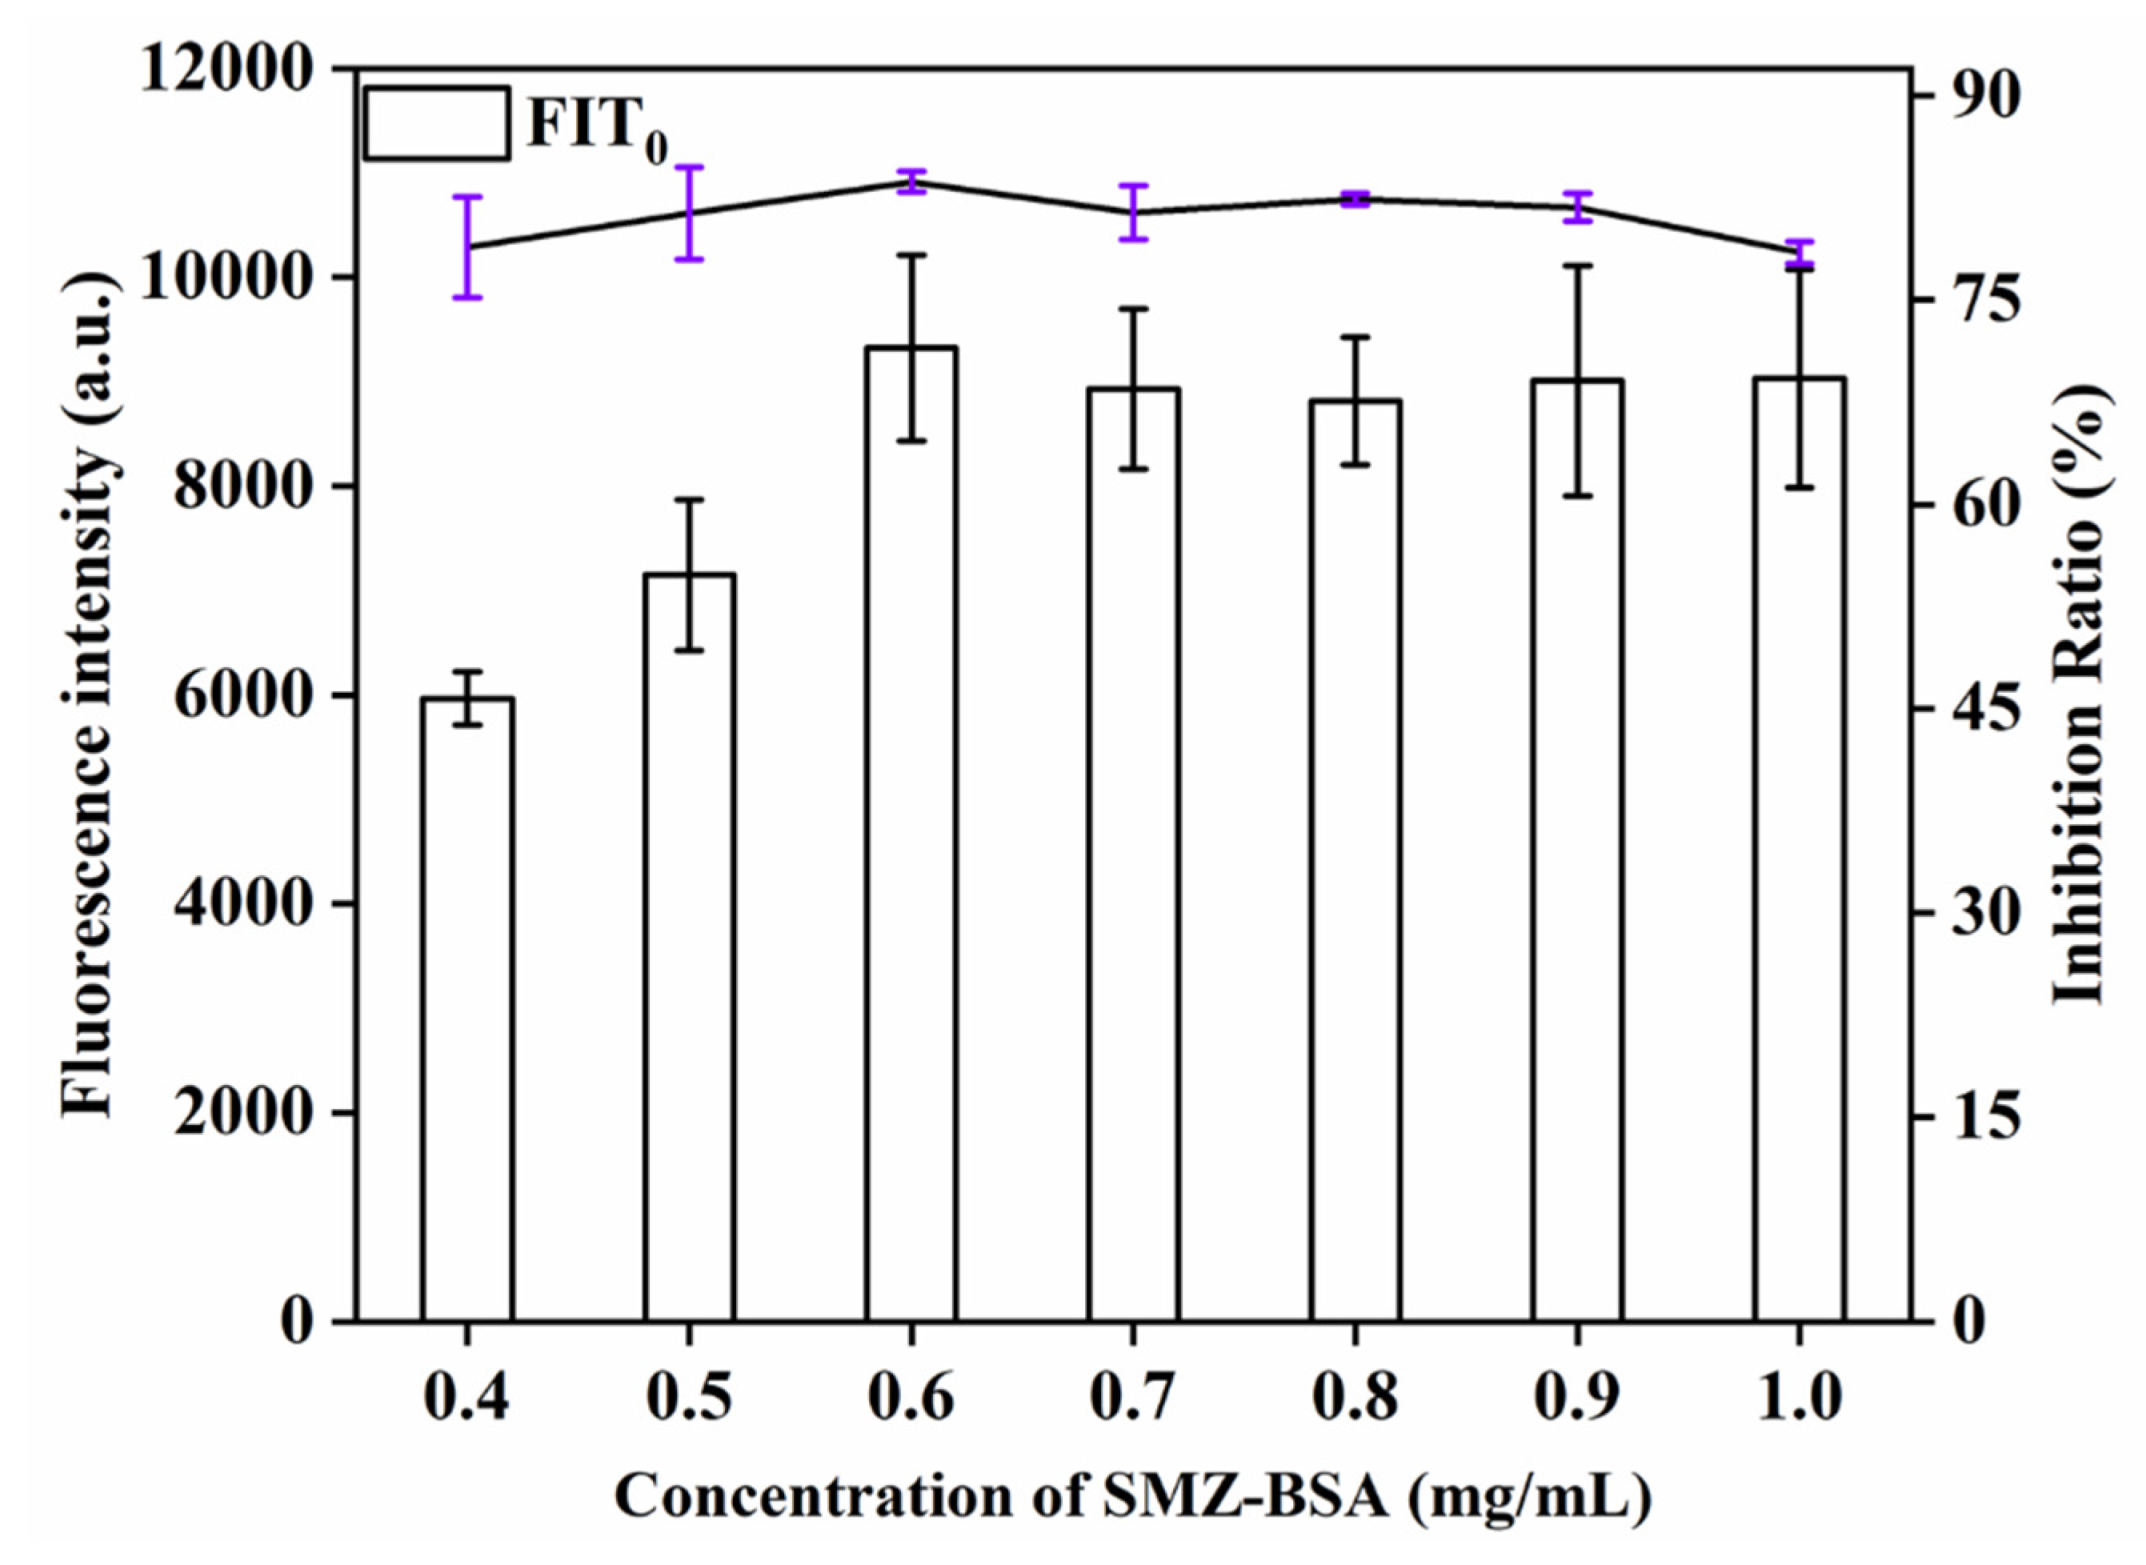
This study explored the influence of different concentrations (0.4, 0.5, 0.6, 0.7, 0.8, 0.9, 1.0 mg/mL) of SMZ − BSA on detection signal strength and inhibition rate. As can be seen from Figure 5, when the QBs-labeled antibody was sufficient, the detection signal strength of the T line increased with the increase of SMZ − BSA concentration. With increasing amount of SMZ − BSA, more QBs antibody conjugates can be captured, and the T line will show a stronger signal. The T-line signal was the strongest and the inhibition rate (81.2%) was the highest when the concentration of SMZ − BSA was 0.6 mg/mL; when the concentration of SMZ − BSA continued to increase, the signal strength and inhibition rate decreased. Therefore, 0.6 mg/mL was chosen as the optimal concentration of SMZ − BSA on the T line.
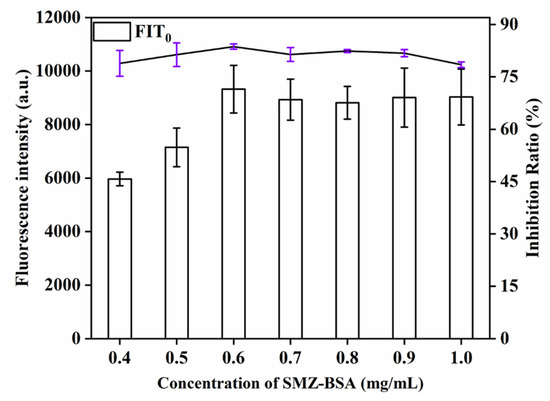
Figure 5.
Optimization detection conditions of QBs-LFIA. Effects of concentration of SMZ − BSA.
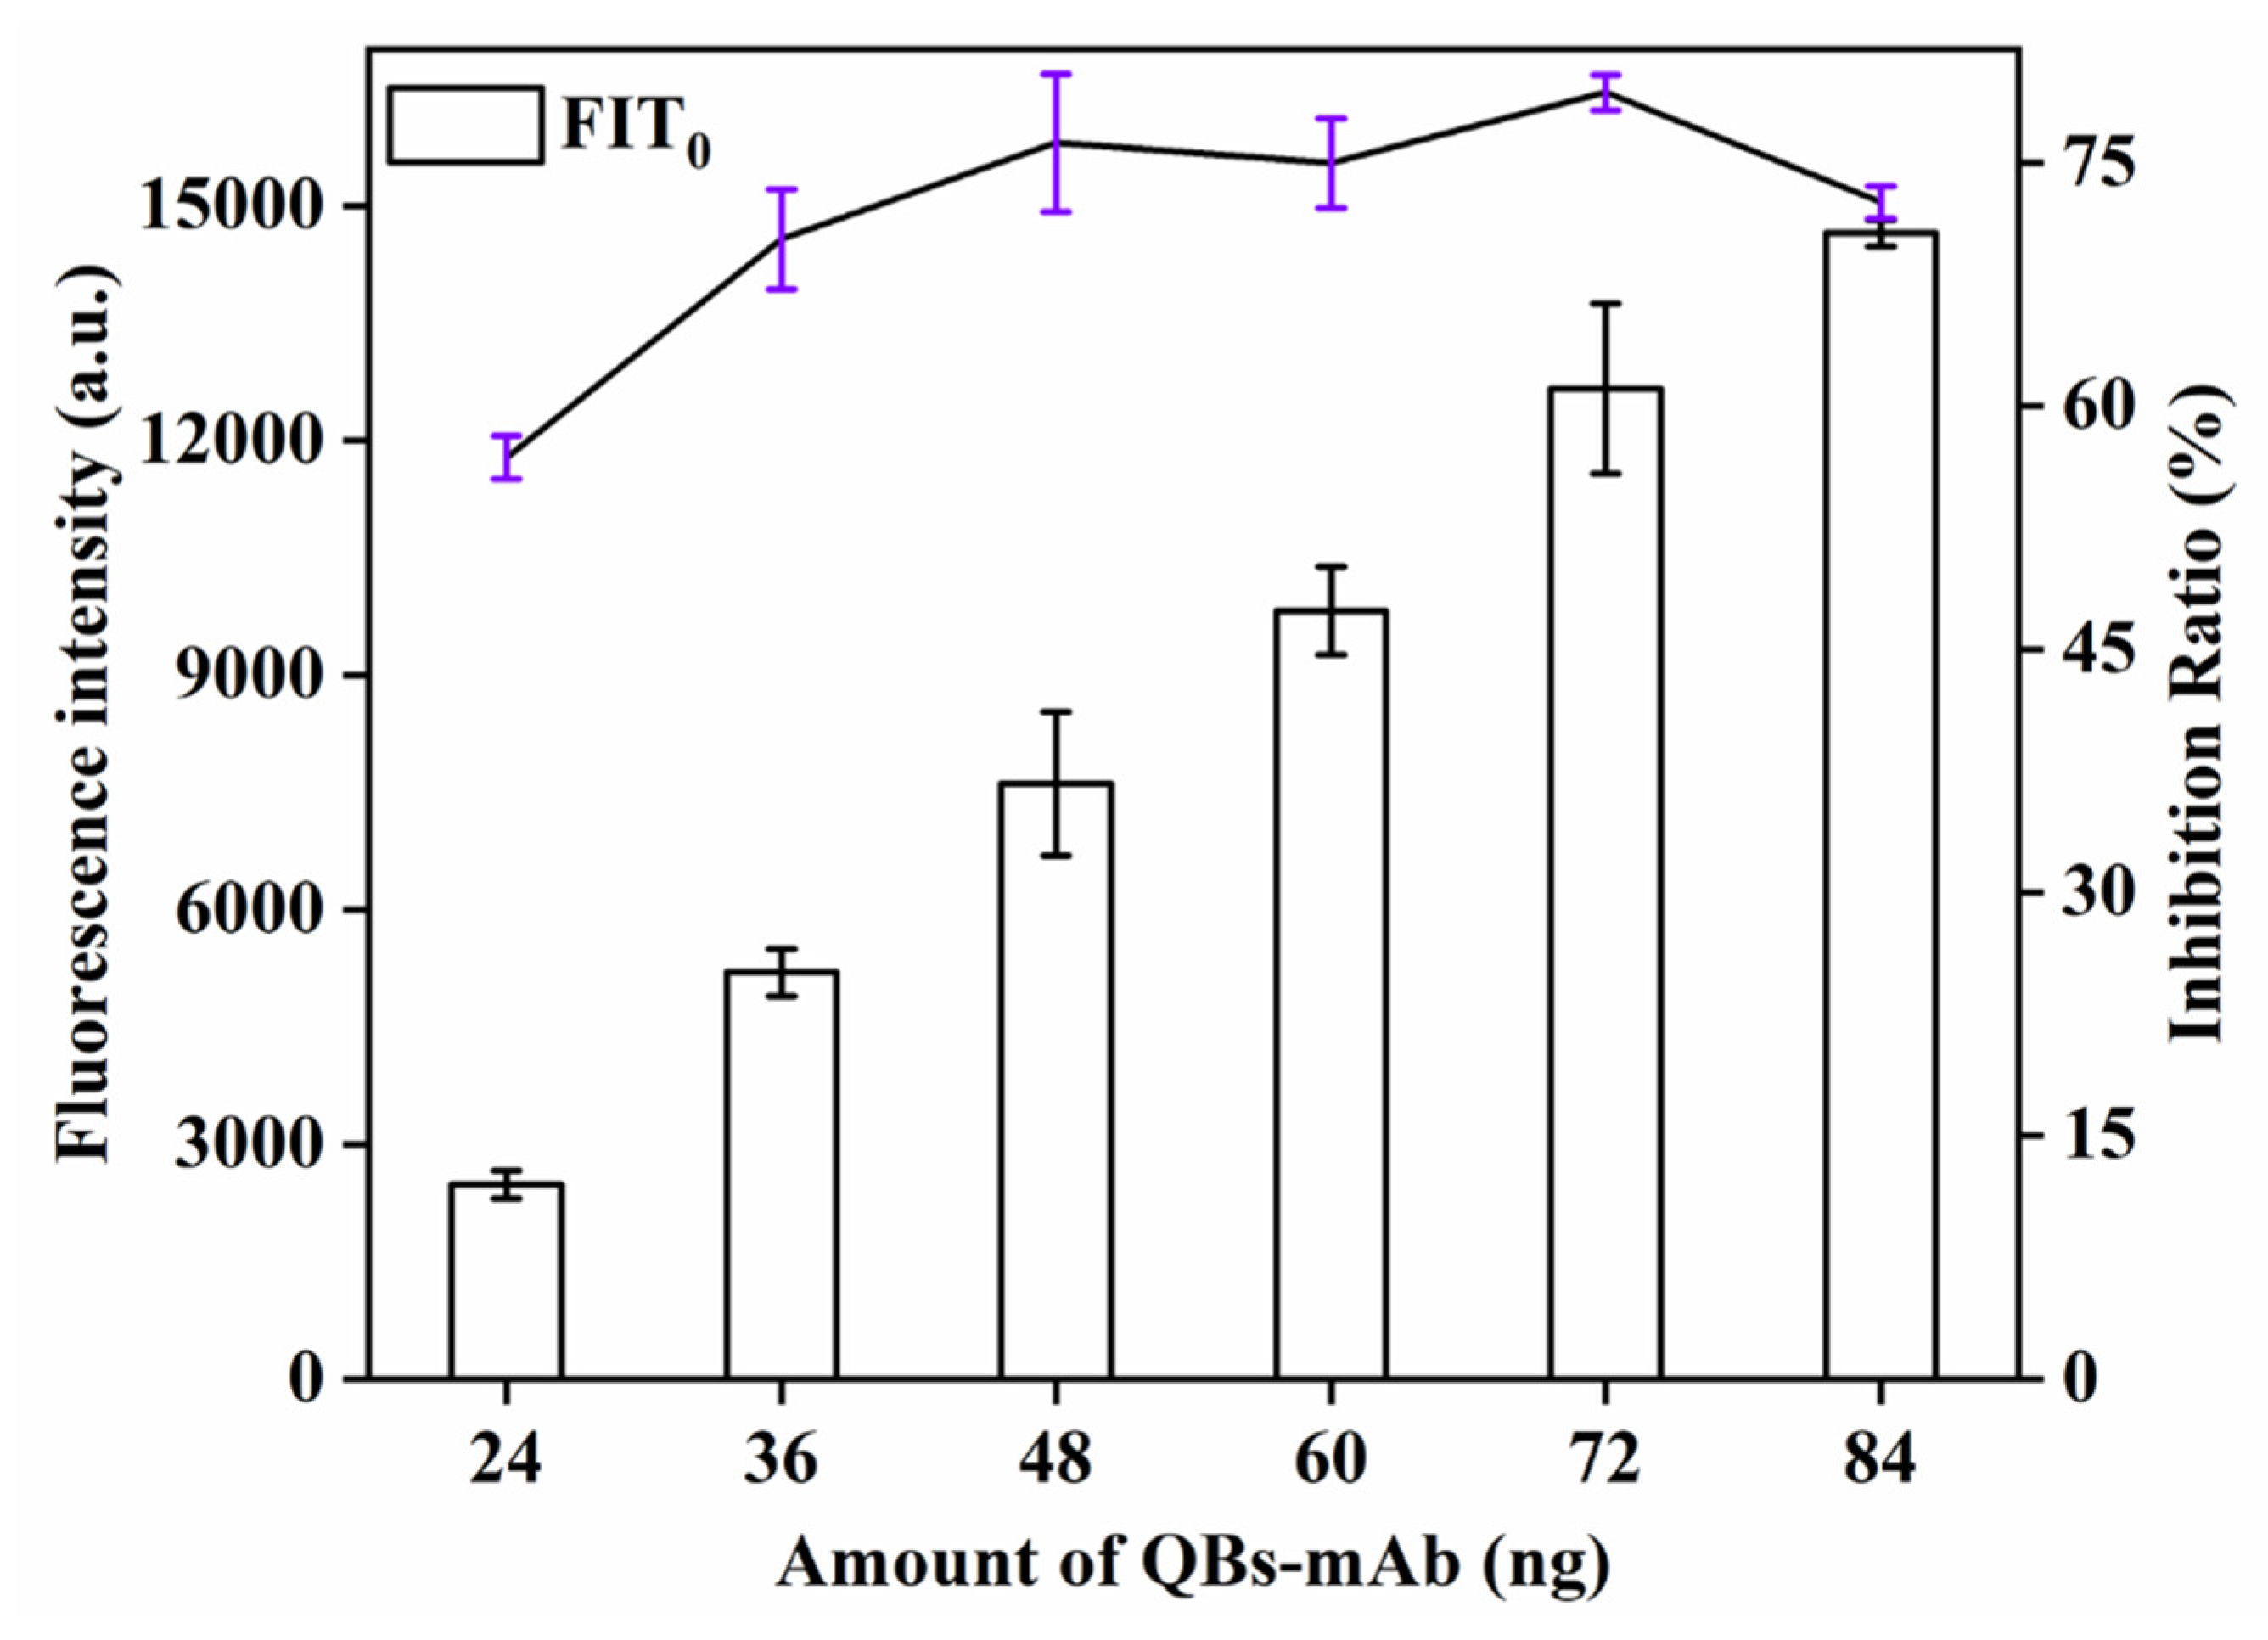
3.2.5. Optimization of the Amount of QBs-mAbs Probe
The effect of the amount of QBs-mAbs probe, an important factor influencing the F of the biosensor, on the sensitivity of QBs-LFIA was also investigated. This study explored the influence of the amount of QBs-mAbs probe (24, 36, 48, 60, 72, 84 μg) on detection signal strength and inhibition rate. As can be seen from Figure 6, the signal strength and inhibition rate (77.8%) increased with increasing amount of QBs-mAbs probe and reached the maximum value at 72 μg. When the amount of QBs-mAbs probe continued to increase, the signal strength and inhibition rate showed a downward trend. Therefore, the optimal amount of EDC was 72 μg.

Figure 6.
Optimization detection conditions of QBs-LFIA. Effects of amount of QBs-mAb.
3.2.6. Immune Dynamic Response Analysis of QBs-LFIA
In this study, the relationship between T-line signal and immune response time was monitored by recording the fluorescence intensity of the T line and C line every 1 min. FIT0 and FIT represent the change value of fluorescence intensity along the T line of negative and positive sample strips with time, respectively. The control negative and positive samples were PBS containing QBs-mAb and PBS containing SMZ and QBs-mAb, respectively. As can be seen from the trend in Figure 7, FIT0, FIT, and inhibition rate tend to be stable when the sample adding time exceeds 20 min. Therefore, 20 min was selected as the optimal detection time.
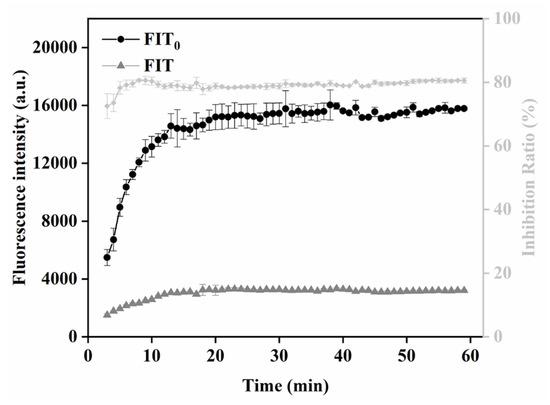
Figure 7.
Optimization detection conditions of QBs-LFIA. Immunoreaction dynamic of FIT of negative (0 ng/mL) and positive (5 ng/mL) samples on the fluorescence intensity of T line and inhibition ratios.
3.2.7. Evaluation of QBs-LFIA
Determination of Detection Limit and Linear Range
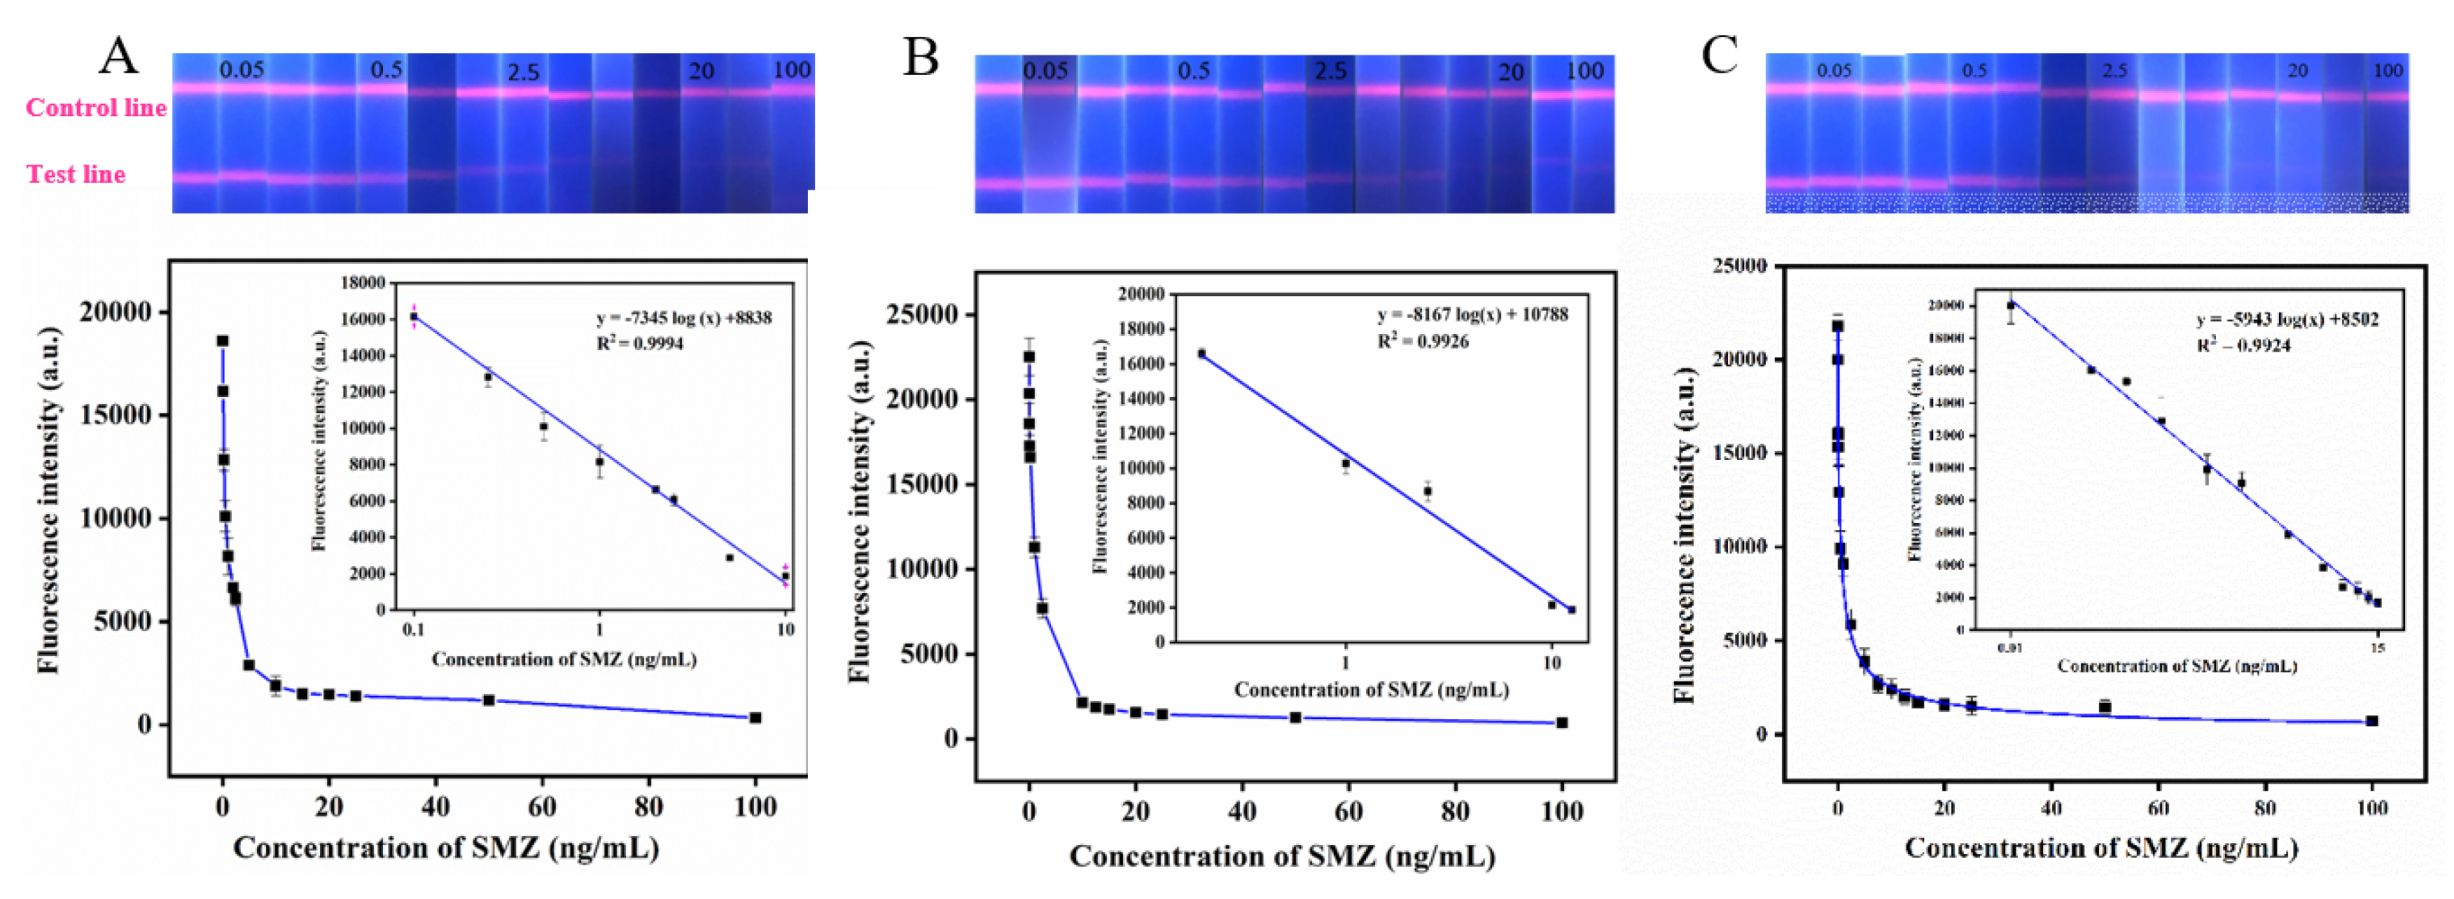
Under the optimal process parameters, the QBs-based immunochromatographic method established in this study was used to detect PBS solutions with different SMZ concentrations. The standard curve was drawn using the fluorescence intensity of the T line as the ordinate and the logarithm of the corresponding standard concentration as the abscissa. As shown in Figure 8A, the intensity gradually decreases with the increase of SMZ concentration. The equation of the standard curve is y = −7345 log (x) + 8838 (R2 = 0.9994), where y represents the fluorescence intensity, and x represents the logarithm value of SMZ concentration. By calculation, the LOD of SMZ detection in PBS buffer by QBs-based immunochromatography was 0.1074 ng/mL, and the corresponding linear detection range was 0.1–10 ng/mL. Notably, Table 1 also compares the LOD and the linear range of the QBs-LFIA in this study with others, and results indicate that QBs-LFIA have advantages in linear range and LOD.
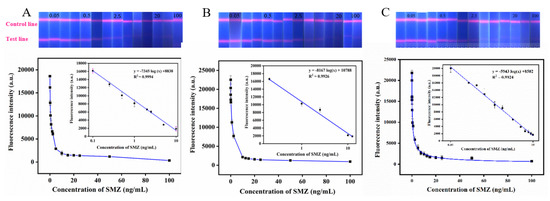
Figure 8.
The digital photos under UV light of the QBs-LFIA test strips and corresponding standard calibration curves for SMZ were constructed by plotting the fluorescence intensity against the logarithm of different concentrations of SMZ in (A) PBS, (B) chicken, and (C) milk samples.

Table 1.
Comparison of the linear range, LOD, and specificity of this method and others.
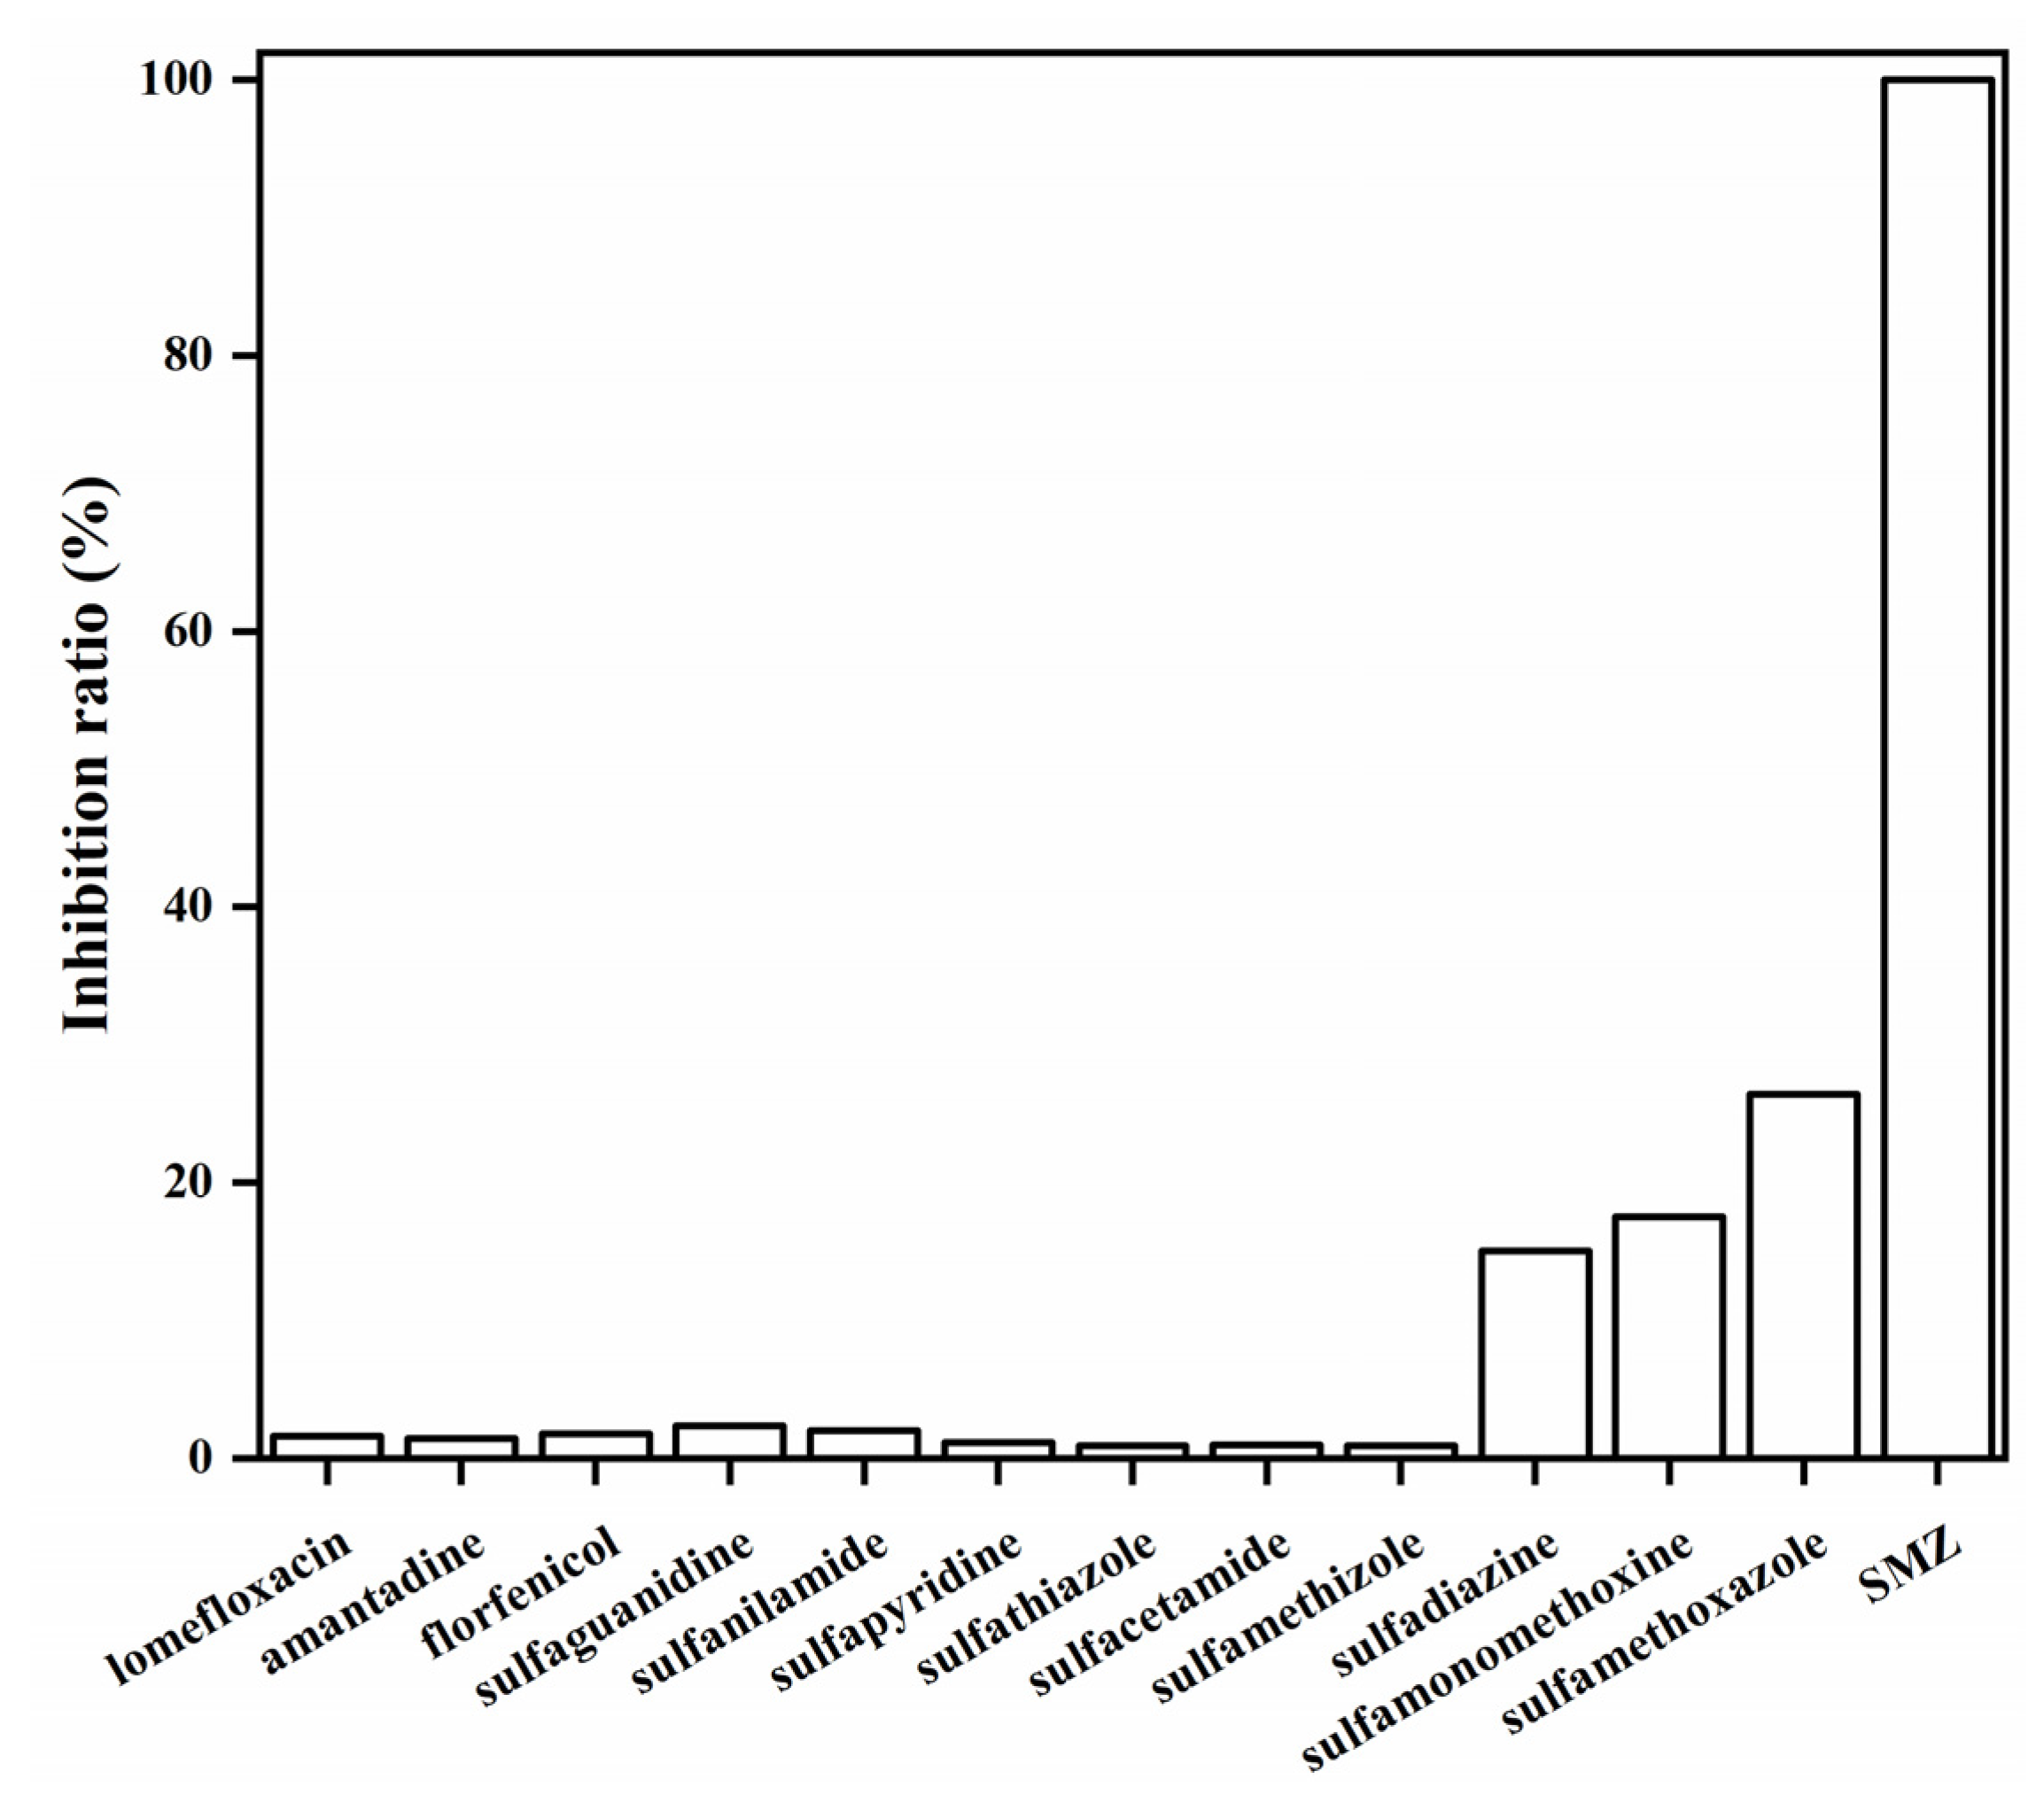
Specificity of the QBs-LFIA
The specificity of the QBs-LFIA was assessed by running ten other SA drugs and three non-SA antibiotic drugs. As shown in Figure 9, the inhibition ratio of the QBs-LFIA for the SMZ-spiked PBS sample was 100%, while those of sulfadiazine, sulfamonomethoxine, and sulfamethoxazole were 15.5, 17.5, and 26.4%, respectively. In addition, the inhibition ratio was less than 3% in ten other drugs. These results demonstrate that the QBs-LFIA is able to specifically detect SMZ.
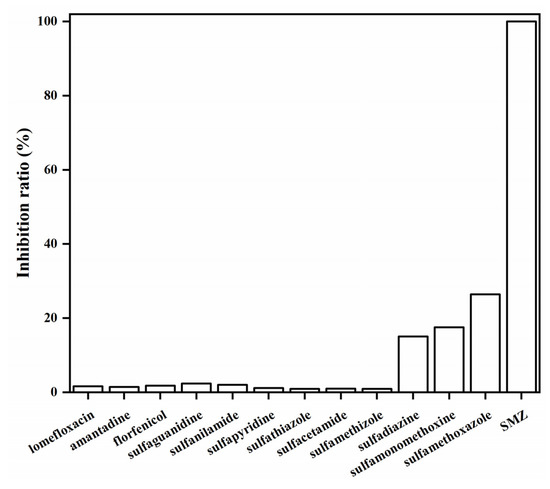
Figure 9.
The specificity of QBs-LFIA was tested at a concentration of 20.0 ng/mL with structurally similar analogs.
Recovery Experiment
Under the optimal process parameters, different SMZ concentrations were detected by the QBs-based immunochromatography method. The standard curve was drawn by using the fluorescence intensity of the T line as the ordinate and the logarithm of the corresponding standard concentration as the abscissa. As shown in Figure 8B,C, the fluorescence intensity gradually decreases with the increase of SMZ concentration. The equation of the standard curve is y = −8167 log (x) + 10,788 (R2 = 0.9926), y = −5943 log(x) + 8502 (R2 = 0.9924) where y represents the fluorescence intensity and x represents the logarithm value of SMZ concentration. By calculation, the LOD of SMZ in these samples detected by QBs-based immunochromatography was 0.1105 ng/mL, 0.0955 ng/mL and the corresponding linear detection range was 0.2–12.5 ng/mL, 0.1–15 ng/mL. The above results indicate that the QBs-LFIA method can realize the high-sensitivity detection of SMZ residue in chicken and milk samples.
The recovery of QBs-LFIA for the determination of 0.05, 0.5, and 5 ng/mL of SMZ in chicken and milk were examined using the test strips. Table 2 shows the average QBs-LFIA recoveries of 80.9–109.4% with CV of 4.88–5.39% in chicken sample and 84–101.6% with CV of 6.48–11.32% in milk sample. These data indicated that the QBs-LFIA could reliably and precisely determine SMZ in chicken and milk samples.
Table 2.
Recoveries and CVs of chicken and milk samples spiked with different concentrations of SMZ with QBs–LFIA.
3.3. Detection Results of Real Samples
Table 3 showed the detection results of 16 real samples using this method and HPLC. The detection result of the method was in good agreement with that of the HPLC method.
Table 3.
Detection of SMZ in real samples using this method and HPLC.
4. Conclusions
In this work, we established a rapid and sensitive methods based on QBs-LFIA for the detection of SMZ in chicken and milk samples. The QBs-LFIA had LODs of 0.1138, 0.0955 ng/mL and corresponding linear ranges of 0.2–12.5, 0.1–15 ng/mL in chicken and milk samples, respectively. The recovery experiment and HPLC validation manifested that the method endows with good accuracy and reliability. This type of LFIA have a promising application to promote the comprehensive development of LFIA.
Author Contributions
Conceptualization, D.W., J.L. and J.P.; methodology, D.W., J.L., Z.W., S.W. and W.T.; software, D.W., J.L., Z.W. and S.Z.; validation, S.W. and W.T.; data curation, D.W., J.L., Z.W. and S.Z.; writing—original draft preparation, D.W.; writing—review and editing, J.P.; supervision, J.P. All authors have read and agreed to the published version of the manuscript.
Funding
This work was supported by Key Research and Development Program of Jiangxi Province (20192BBF60046).
Institutional Review Board Statement
Not applicable.
Informed Consent Statement
Not applicable.
Data Availability Statement
Not applicable.
Conflicts of Interest
The authors declare no conflict of interest.
References
- Long, P.H. Introduction of Gerhard Domagk. Ann. N. Y. Acad. Sci. 2010, 69, 379. [Google Scholar] [CrossRef]
- Akocak, S.; Güzel-Akdemir, Ö.; Sanku, R.K.K.; Russom, S.S.; Iorga, B.I.; Supuran, C.T. Pyridinium derivatives of 3-aminobenzenesulfonamide are nanomolar-potent inhibitors of tu-mor-expressed carbonic anhydrase isozymes CA IX and CA XII. Bioorg. Chem. 2020, 103, 104204. [Google Scholar] [CrossRef] [PubMed]
- Lopez Flores, J.; Fernandez de Cordova, M.L.; Molina Diaz, A. Flow-through optosensor combined with pho-tochemically induced fluorescence for simultaneous determination of binary mixtures of sulfonamides in pharma-ceuticals, milk and urine. Anal. Chim. Acta 2007, 600, 164–171. [Google Scholar] [CrossRef] [PubMed]
- Wang, L.; Wang, J.; Wang, J.; Zhu, L.; Yang, L.; Yang, R. Distribution characteristics of antibiotic resistant bacteria and genes in fresh and composted manures of livestock farms. Sci. Total Environ. 2019, 695, 133781. [Google Scholar] [CrossRef]
- Huang, F.; An, Z.; Moran, M.J.; Liu, F. Recognition of typical antibiotic residues in environmental media related to groundwater in China (2009–2019). J. Hazard. Mater. 2020, 399, 122813. [Google Scholar] [CrossRef] [PubMed]
- Peng, D.; Li, Z.; Wang, Y.; Liu, Z.; Sheng, F.; Yuan, Z. Enzyme-linked immunoassay based on imprinted microspheres for the detection of sulfamethazine residue. J. Chromatogr. A 2017, 1506, 9–17. [Google Scholar] [CrossRef] [PubMed]
- Karageorgou, E.; Manousi, N.; Samanidou, V.; Kabir, A.; Furton, K.G. Fabric phase sorptive extraction for the fast isolation of sulfonamides residues from raw milk followed by high performance liquid chromatography with ultraviolet detection. Food Chem. 2016, 196, 428–436. [Google Scholar] [CrossRef]
- Hu, G.; Sheng, W.; Zhang, Y.; Wang, J.; Wu, X.; Wang, S. Upconversion Nanoparticles and Monodispersed Magnetic Polystyrene Microsphere Based Fluo-rescence Immunoassay for the Detection of Sulfaquinoxaline in Animal-Derived Foods. J. Agric. Food Chem. 2016, 64, 3908–3915. [Google Scholar] [CrossRef]
- Wang, Y.; Yan, X.; Kou, Q.; Sun, Q.; Wang, Y.; Wu, P.; Yang, L.; Tang, J.; Le, T. An Ultrasensitive Label-Free Fluorescent Aptasensor Platform for Detection of Sulfamethazine. Int. J. Nanomed. 2021, 16, 2751–2759. [Google Scholar] [CrossRef]
- European Economic Community. Commission Regulation (EC) no. 508/1999. Off. J. Eur. Commun. 1999, L60, 16–52. [Google Scholar]
- Animal Husbandry and Veterinary Bureau of Ministry of Agriculture. Announcement of Ministry of Agriculture maximum residue levels of veterinary drug in foodstuffs of animal origin. Chin. J. Vet. Drug 2003, 4, 15–20. [Google Scholar]
- Li, T.; Wang, C.; Xu, Z.; Chakraborty, A. A coupled method of on-line solid phase extraction with the UHPLC- MS/MS for detection of sulfona-mides antibiotics residues in aquaculture. Chemosphere 2020, 254, 126765. [Google Scholar] [CrossRef] [PubMed]
- Nebot, C.; Regal, P.; Martínez, B.; Miranda, J.; Cepeda, A.; Fente, C. Confirmatory method for nine sulfonamides in miniature bovine muscle samples using HPLC/MS/MS without using SPE. J. Food Drug Anal. 2010, 18, 1. [Google Scholar] [CrossRef]
- Bach, C.; Boiteux, V.; Hemard, J.; Colin, A.; Rosin, C.; Munoz, J.-F.; Dauchy, X. Simultaneous determination of perfluoroalkyl iodides, perfluoroalkane sulfonamides, fluorote-lomer alcohols, fluorotelomer iodides and fluorotelomer acrylates and methacrylates in water and sediments using solid-phase microextraction-gas chromatography/mass spectrometry. J. Chromatogr. A 2016, 1448, 98–106. [Google Scholar]
- Adrian, J.; Pasche, S.; Diserens, J.-M.; Sánchez-Baeza, F.; Gao, H.; Marco, M.-P.; Voirin, G. Waveguide interrogated optical immunosensor (WIOS) for detection of sulfonamide antibiotics in milk. Biosens. Bioelectron. 2009, 24, 3340–3346. [Google Scholar] [CrossRef]
- Xiao, X.; Hu, S.; Lai, X.; Peng, J.; Lai, W. Developmental trend of immunoassays for monitoring hazards in food samples: A review. Trends Food Sci. Technol. 2021, 111, 68–88. [Google Scholar] [CrossRef]
- Yano, K.; Iwasaki, A. Enhancement of Fluorescence-Based Sandwich Immunoassay Using Multilayered Micro-plates Modified with Plasma-Polymerized Films. Sensors 2017, 17, 37. [Google Scholar] [CrossRef] [Green Version]
- He, Z.-X.; Shi, L.-C.; Ran, X.-Y.; Li, W.; Wang, X.-L.; Wang, F.-K. Development of a Lateral Flow Immunoassay for the Rapid Diagnosis of Invasive Candidiasis. Front. Microbiol. 2016, 7, 1451. [Google Scholar] [CrossRef] [Green Version]
- Miočević, O.; Cole, C.R.; Laughlin, M.J.; Buck, R.L.; Slowey, P.D.; Shirtcliff, E.A. Quantitative Lateral Flow Assays for Salivary Biomarker Assessment: A Review. Front. Public Health 2017, 5, 133. [Google Scholar] [CrossRef] [Green Version]
- Hu, L.-M.; Luo, K.; Xia, J.; Xu, G.-M.; Wu, C.-H.; Han, J.-J.; Zhang, G.-G.; Liu, M.; Lai, W.-H. Advantages of time-resolved fluorescent nanobeads compared with fluorescent submicrospheres, quantum dots, and colloidal gold as label in lateral flow assays for detection of ractopamine. Biosens. Bioelectron. 2017, 91, 95–103. [Google Scholar] [CrossRef]
- Hu, G.; Gao, S.; Han, X.; Yang, L. Comparison of Immunochromatographic Strips Using Colloidal Gold, Quantum Dots, and Upcon-version Nanoparticles for Visual Detection of Norfloxacin in Milk Samples. Food Anal. Methods 2020, 13, 1069–1077. [Google Scholar] [CrossRef]
- Serebrennikova, K.; Samsonova, J.; Osipov, A. Hierarchical Nanogold Labels to Improve the Sensitivity of Lat-eral Flow Immunoassay. Nano-Micro Lett. 2018, 10, 24. [Google Scholar] [CrossRef] [Green Version]
- Liu, F.; Zhang, H.; Wu, Z.; Dong, H.; Zhou, L.; Yang, D.; Ge, Y.; Jia, C.; Liu, H.; Jin, Q.; et al. Highly sensitive and selective lateral flow immunoassay based on magnetic nanoparticles for quantitative detection of carcinoembryonic antigen. Talanta 2016, 161, 205–210. [Google Scholar] [CrossRef] [Green Version]
- Su, L.; Wang, L.; Yao, X.; Yin, X.; Zhang, H.; Zhao, M.; Liu, S.; Wang, Z.; Wang, J.; Zhang, D. Small size nanoparti-cles-Co3O4 based lateral flow immunoassay biosensor for highly sensitive and rapid detection of furazolidone. Talanta 2020, 211, 120729. [Google Scholar] [CrossRef] [PubMed]
- Shim, W.-B.; Kim, J.-S.; Kim, M.-G.; Chung, D.-H. Rapid and Sensitive Immunochromatographic Strip for On-site Detection of Sulfamethazine in Meats and Eggs. J. Food Sci. 2013, 78, M1575–M1581. [Google Scholar] [CrossRef]
- O’Keeffe, M.; Crabbe, P.; Salden, M.; Wichers, J.; Van Peteghem, C.; Kohen, F.; Pieraccini, G.; Moneti, G. Preliminary evaluation of a lateral flow immunoassay device for screening urine samples for the presence of sulphamethazine. J. Immunol. Methods 2003, 278, 117–126. [Google Scholar] [CrossRef]
- Wang, Z.; Xing, K.; Ding, N.; Wang, S.; Zhang, G.; Lai, W. Lateral flow immunoassay based on dual spectral-overlapped fluorescence quenching of polydopamine nanospheres for sensitive detection of sulfamethazine. J. Hazard. Mater. 2021, 423 Pt B, 127204. [Google Scholar] [CrossRef]
- Bai, Z.; Wei, H.; Yang, X.; Zhu, Y.; Peng, Y.; Yang, J.; Wang, C.; Rong, Z.; Wang, S. Rapid Enrichment and Ultrasensitive Detection of Influenza A Virus in Human Specimen using Magnetic Quantum Dot Nanobeads Based Test Strips. Sens. Actuators B Chem. 2020, 325, 128780. [Google Scholar] [CrossRef] [PubMed]
- Zhou, S.; Peng, Y.; Hu, J.; Duan, H.; Ma, T.; Hou, L.; Li, X.; Xiong, Y. Quantum dot nanobead-based immunochromatographic assay for the quantitative detection of the procalcitonin antigen in serum samples. Microchem. J. 2020, 159, 105533. [Google Scholar] [CrossRef]
- Duan, H.; Huang, X.; Shao, Y.; Zheng, L.; Guo, L.; Xiong, Y. Size-Dependent Immunochromatographic Assay with Quantum Dot Nanobeads for Sensitive and Quantitative Detection of Ochratoxin A in Corn. Anal. Chem. 2017, 89, 7062–7068. [Google Scholar] [CrossRef]
- Ren, M.; Xu, H.; Huang, X.; Kuang, M.; Xiong, Y.; Xu, H.; Xu, Y.; Chen, H.; Wang, A. Immunochromatographic Assay for Ultrasensitive Detection of Aflatoxin B1 in Maize by Highly Luminescent Quantum Dot Beads. ACS Appl. Mater. Interfaces 2014, 6, 14215–14222. [Google Scholar] [CrossRef] [Green Version]
- Zhang, Y.; Peng, J.; Guo, P.; Li, G.-Q.; Zhang, K.-Y.; Lv, X.; Lai, W.-H. Matrix effect of swine urine on time-resolved fluorescent nanobeads and colloidal gold immunochromatographic assay. Food Agric. Immunol. 2018, 29, 711–721. [Google Scholar] [CrossRef] [Green Version]
- Su, S.; Zhang, M.; Li, B.; Zhang, H.; Dong, X. HPLC determination of sulfamethazine in milk using surface-imprinted silica synthesized with ini-ferter technique. Talanta 2008, 76, 1141–1146. [Google Scholar] [CrossRef]
- Putri, L.K.; Ng, B.J.; Ong, W.J.; Lee, H.W.; Chang, W.S.; Mohamed, A.R.; Chai, S.P. Energy level tuning of CdSe colloidal quantum dots in ternary 0D-2D-2D CdSe QD/B-rGO/O-gC3N4 as photocatalysts for enhanced hydrogen generation. Appl. Catal. B Environ. 2020, 265, 118592. [Google Scholar] [CrossRef]
- Ratnesh, R.; Mehata, M.S. Investigation of biocompatible and protein sensitive highly luminescent quantum dots/nanocrystals of CdSe, CdSe/ZnS and CdSe/CdS. Spectrochim. Acta Part A Mol. Biomol. Spectrosc. 2017, 179, 201–210. [Google Scholar] [CrossRef]
- Feng, K.; Xue, W.; Hu, X.; Fan, J.; Liu, E. Z-scheme CdSe/ZnSe heterojunction for efficient photocatalytic hydrogen evolution. Colloids Surf. A Physicochem. Eng. Asp. 2021, 622, 126633. [Google Scholar] [CrossRef]
- Jin, B.; Kong, S.; Zhang, G.; Chen, X.; Ni, H.; Zhang, F.; Wang, D.; Zeng, J. Voltage-assisted SILAR deposition of CdSe quantum dots to construct a high performance of ZnS/CdSe/ZnS quantum dot-sensitized solar cells. J. Colloid Interface Sci. 2020, 586, 640–646. [Google Scholar] [CrossRef]
- Wang, Z.-H.; Zhang, S.-X.; Shen, J.-Z.; Sergei, A.E. Analysis of Sulfamethazine by Fluorescence Polarization Immunoassay. Chin. J. Anal. Chem. 2007, 35, 819–824. [Google Scholar] [CrossRef]


Publisher’s Note: MDPI stays neutral with regard to jurisdictional claims in published maps and institutional affiliations. |
© 2021 by the authors. Licensee MDPI, Basel, Switzerland. This article is an open access article distributed under the terms and conditions of the Creative Commons Attribution (CC BY) license (https://creativecommons.org/licenses/by/4.0/).