
Usability, User Experience, and Acceptance Evaluation of CAPACITY: A Technological Ecosystem for Remote Follow-Up of Frailty

 ,
,  , , ,
, , ,
Abstract
:1. Introduction
1.1. Research Context
1.2. Objective
2. Materials and Methods
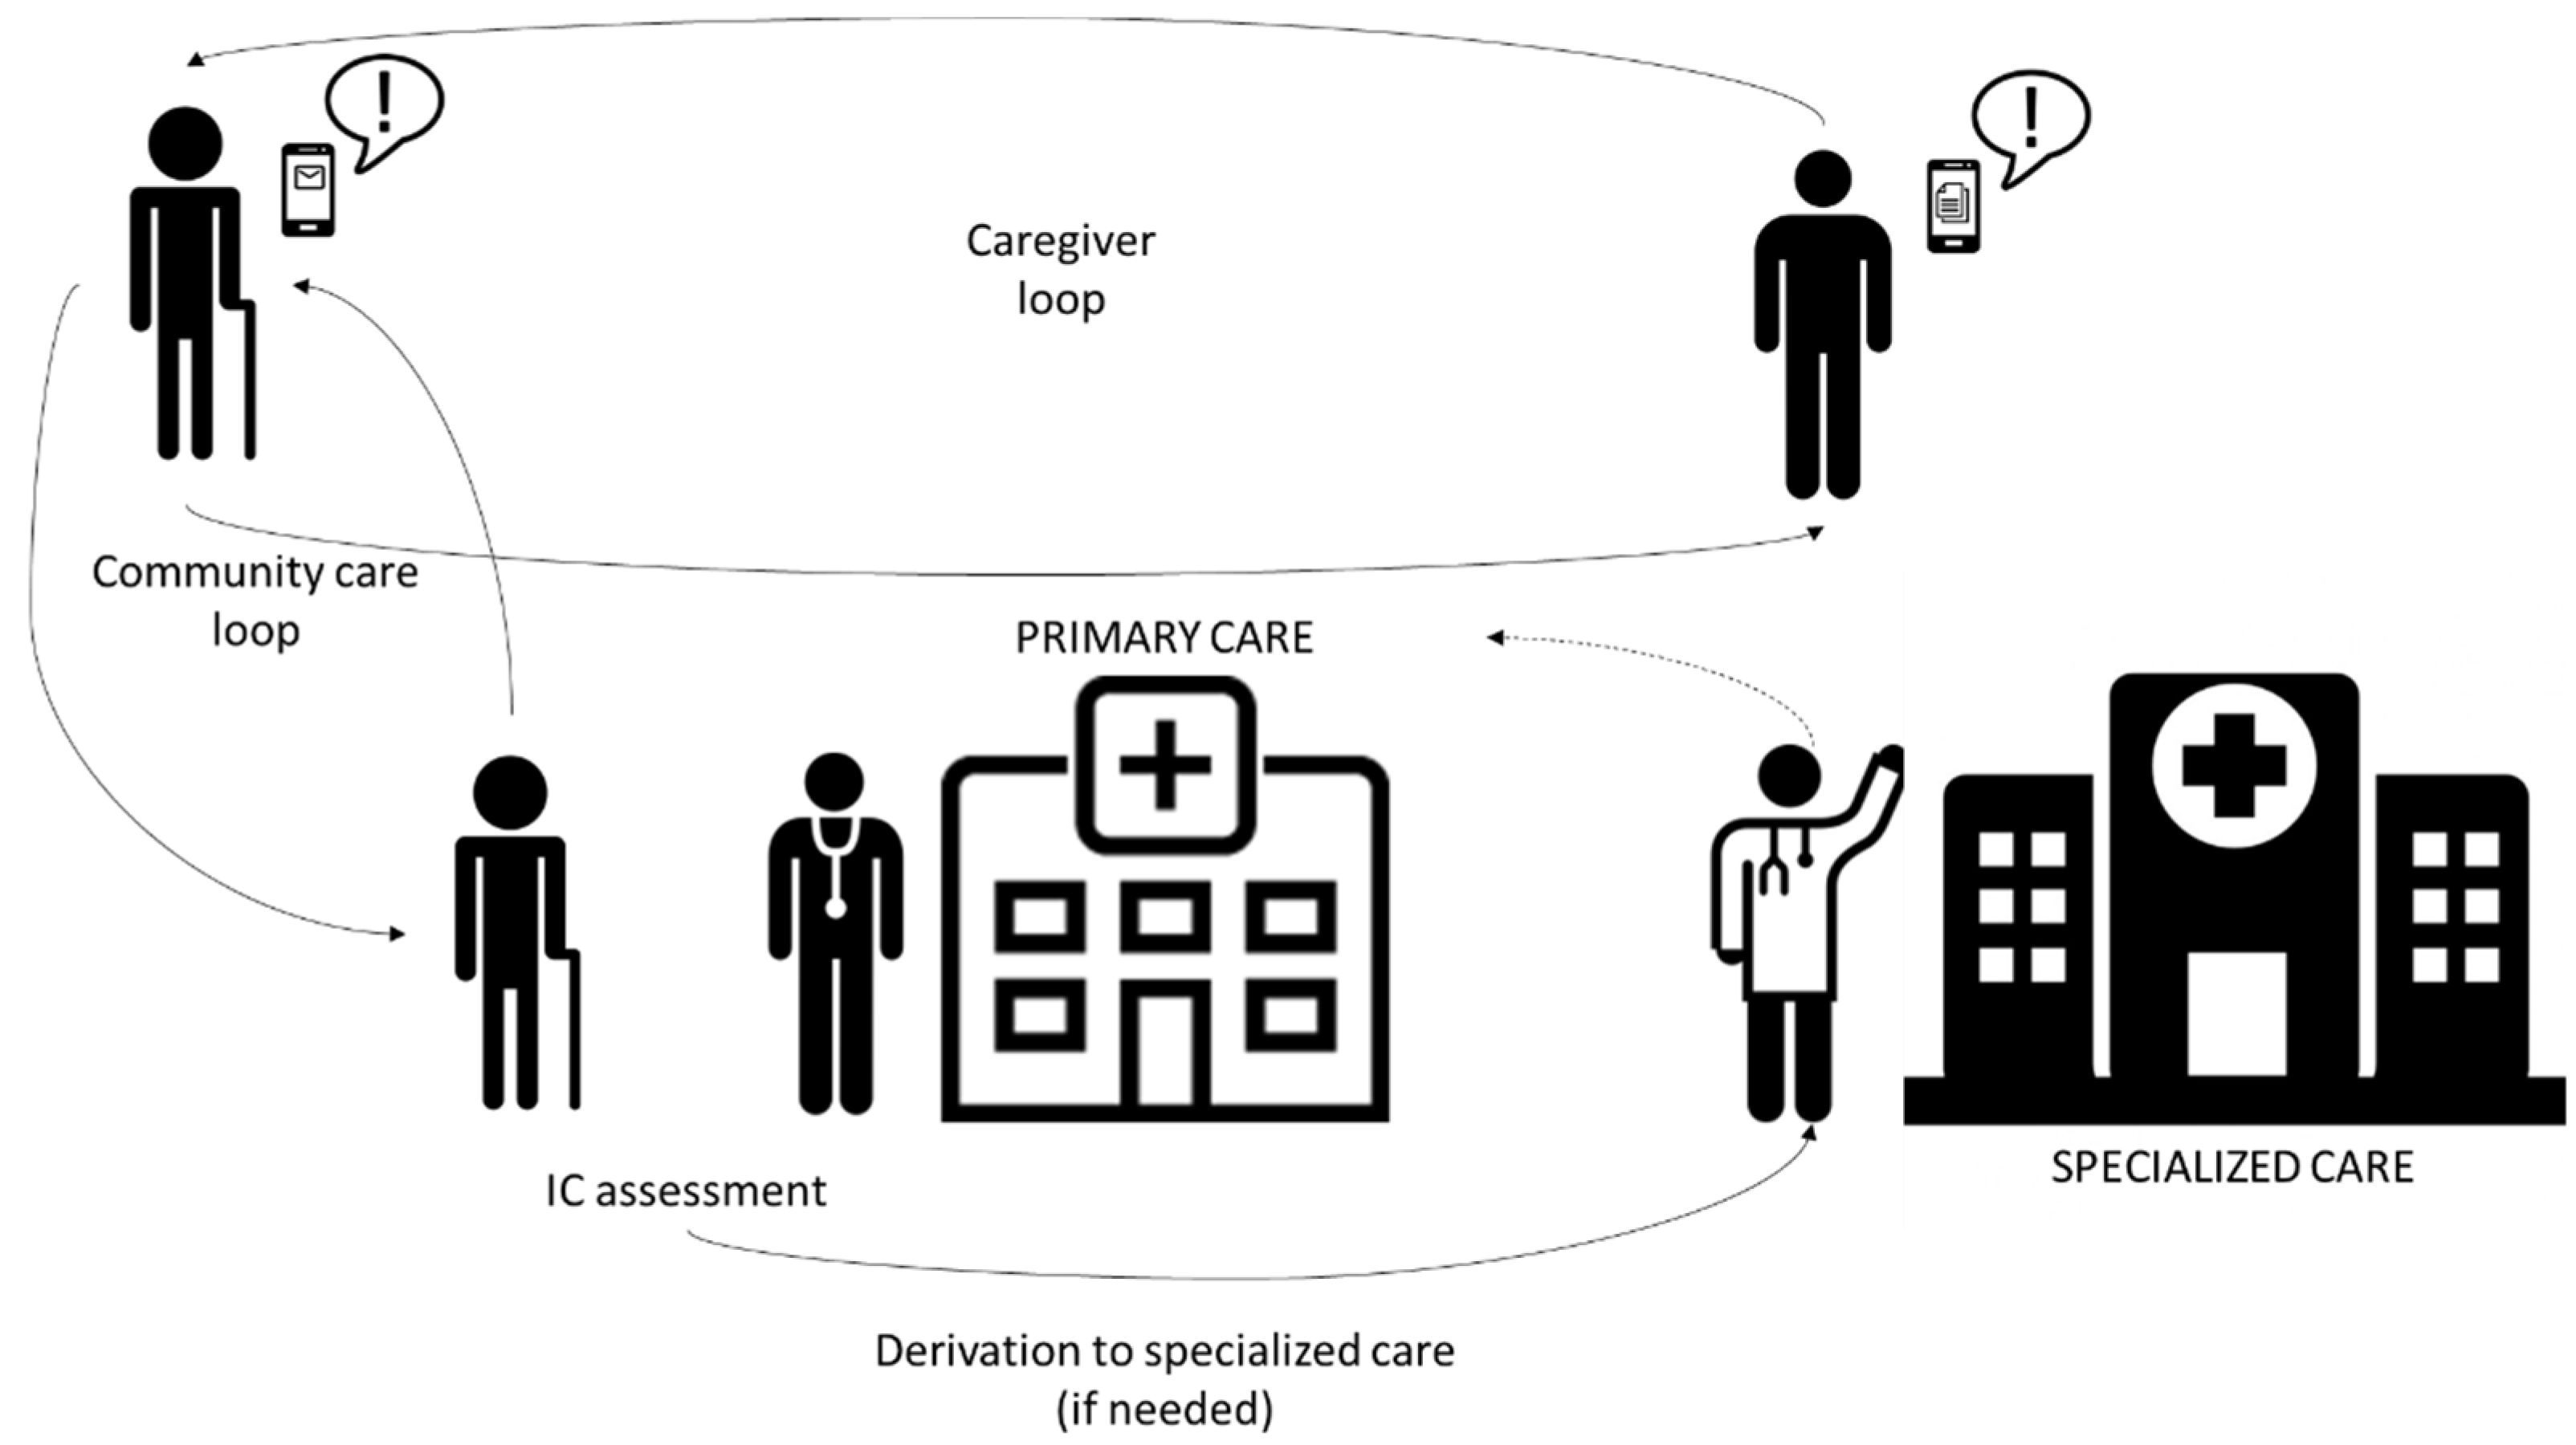
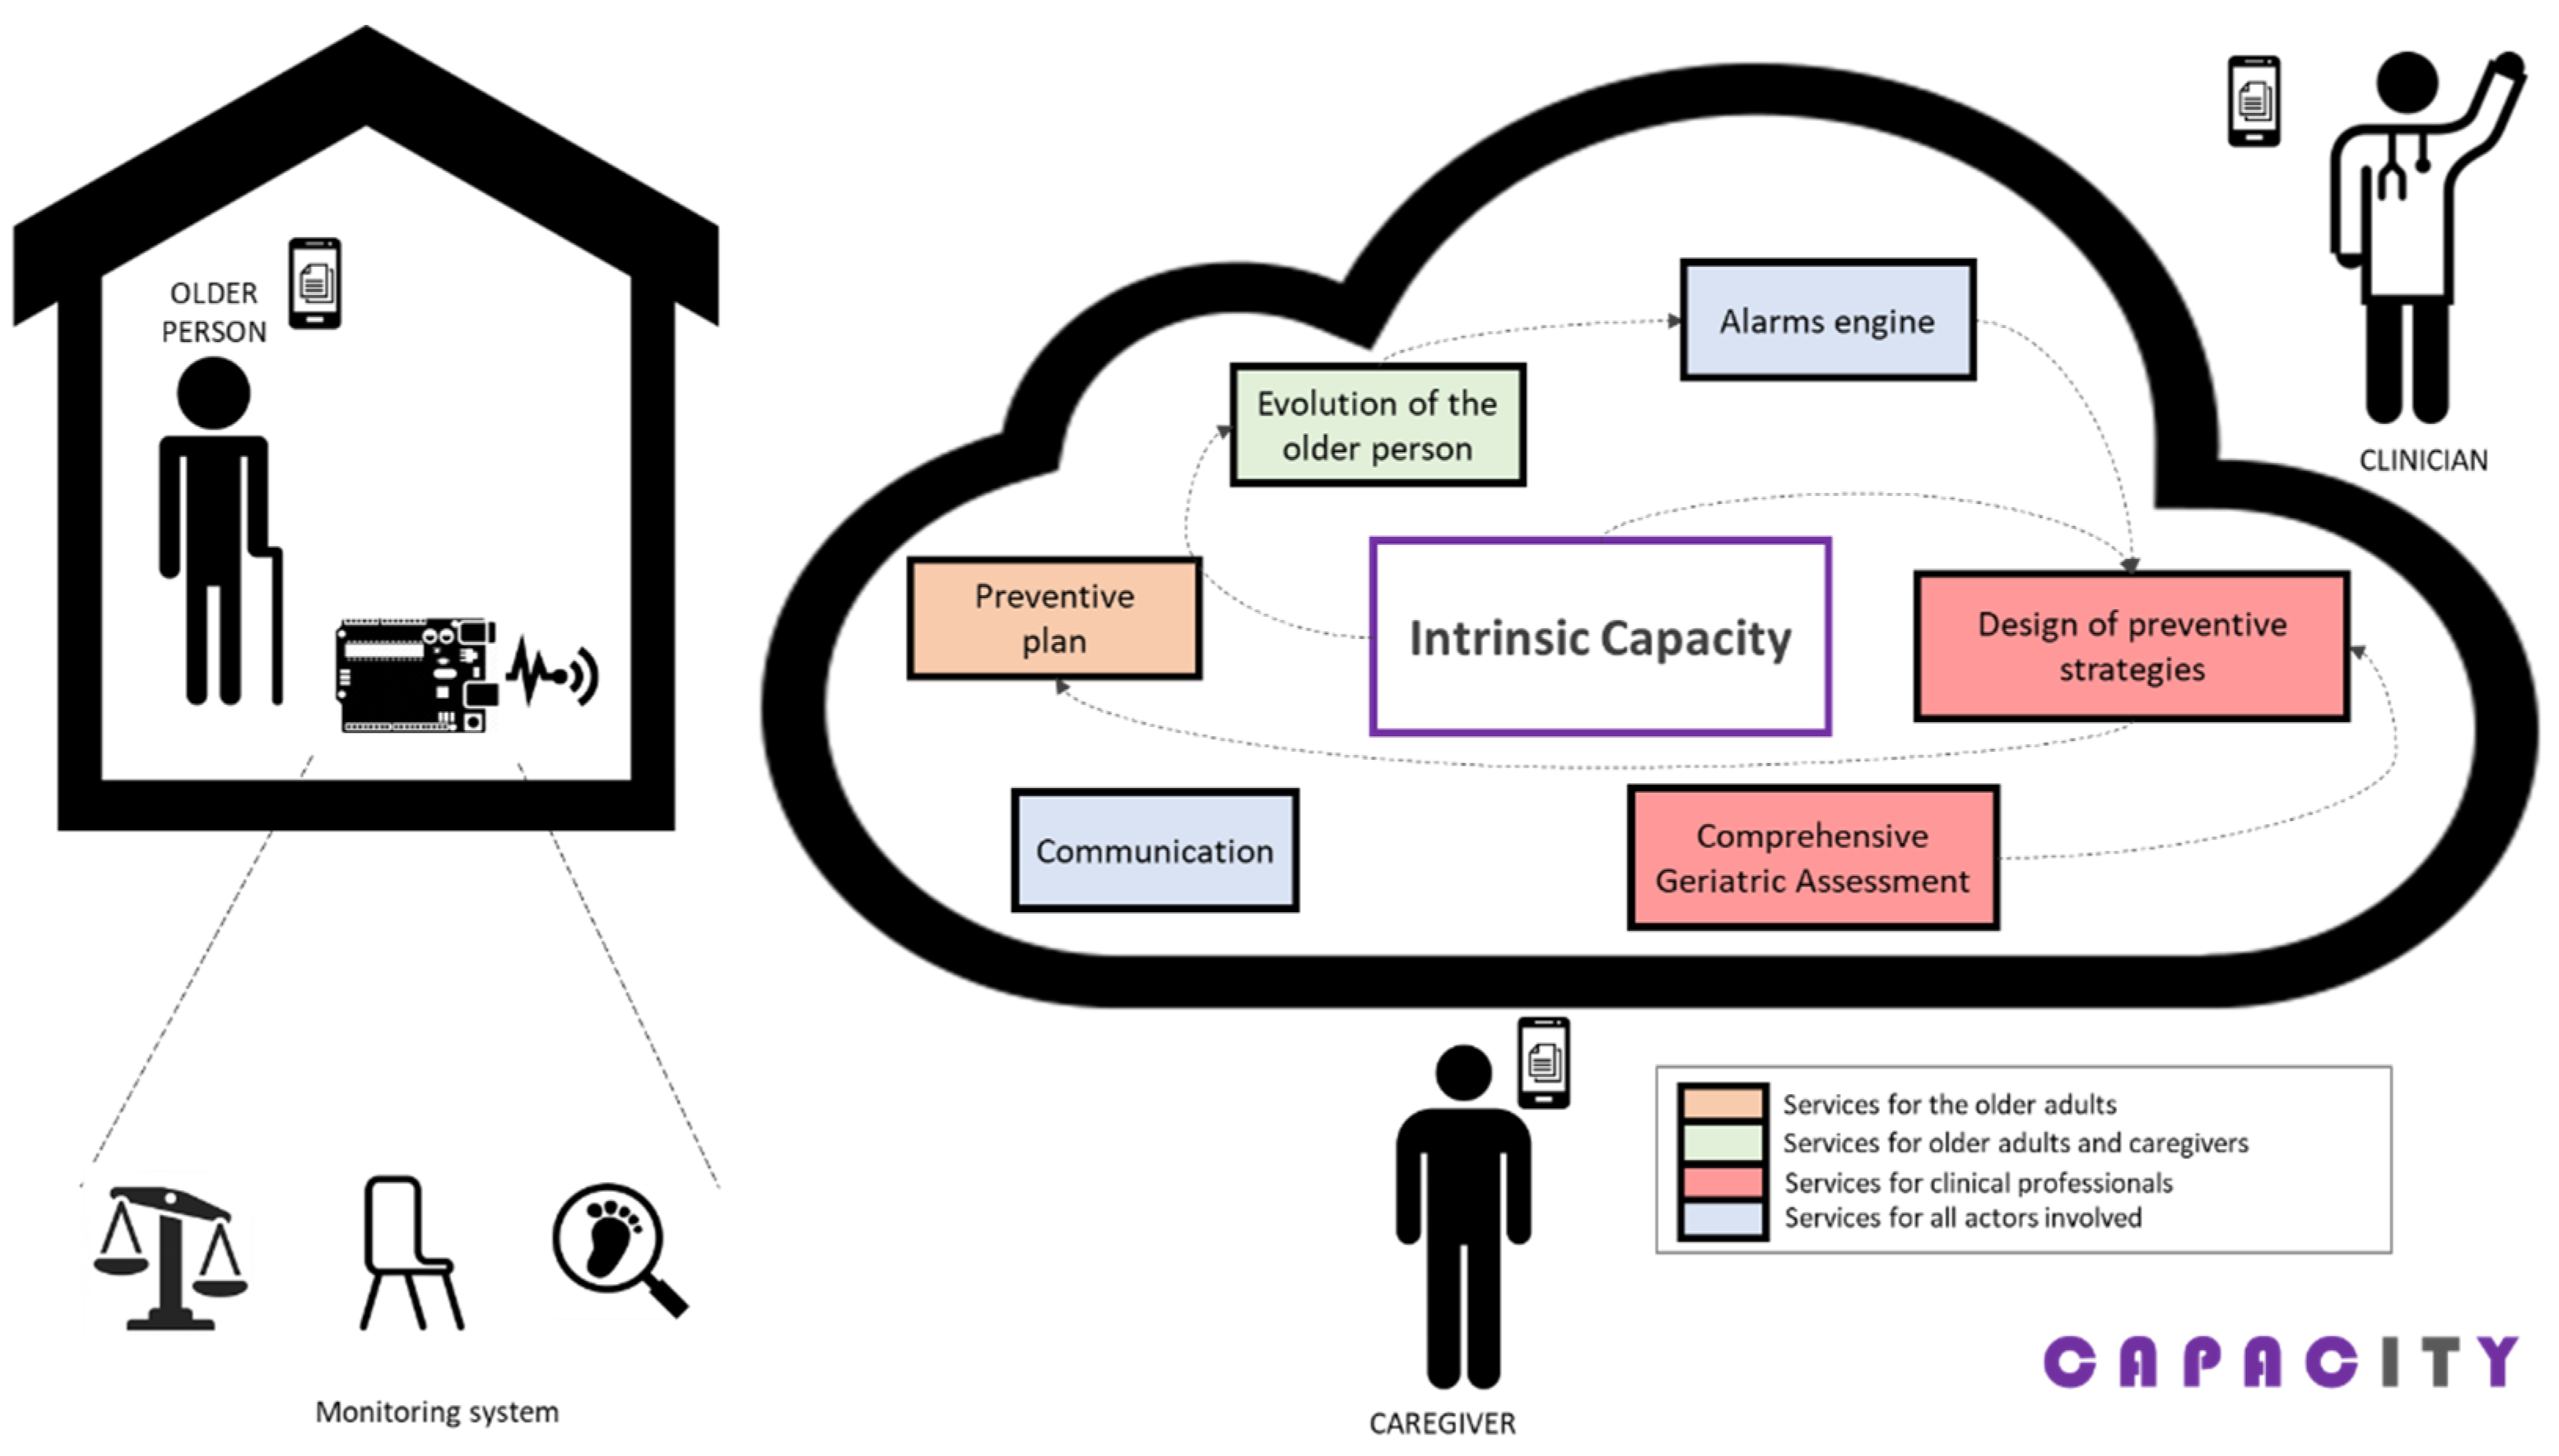
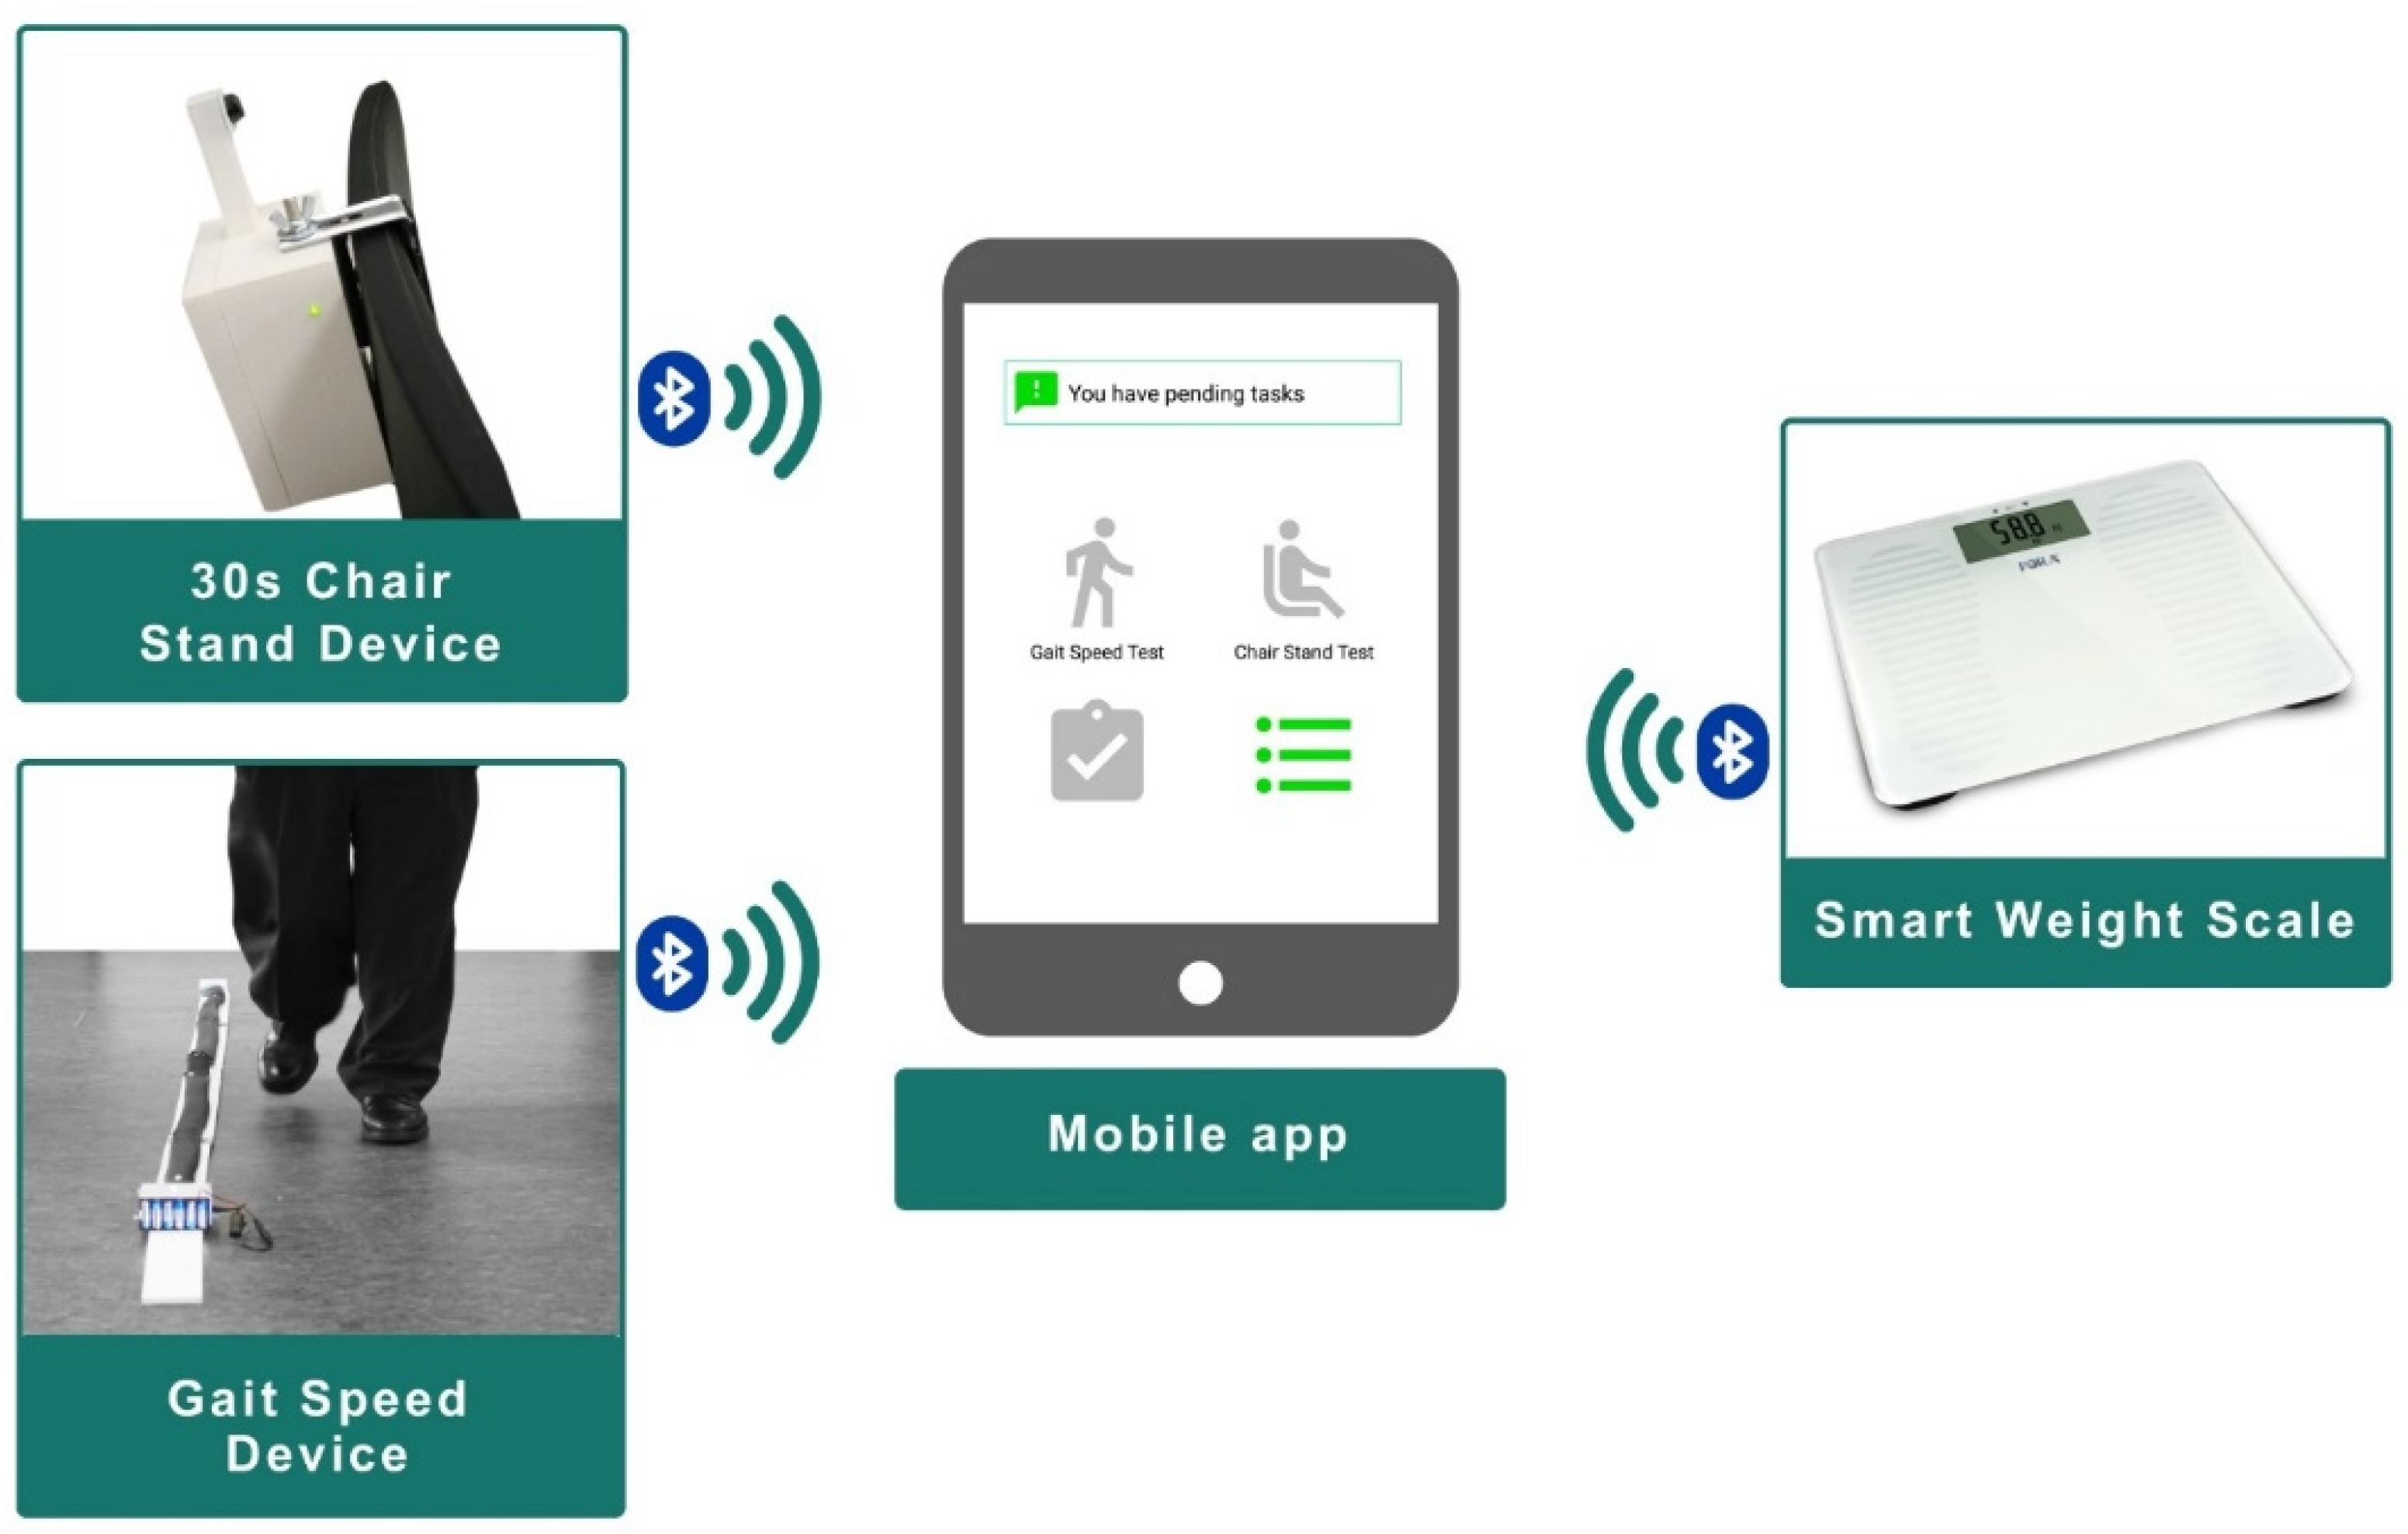
2.1. Overview of the CAPACITY Technological Ecosystem
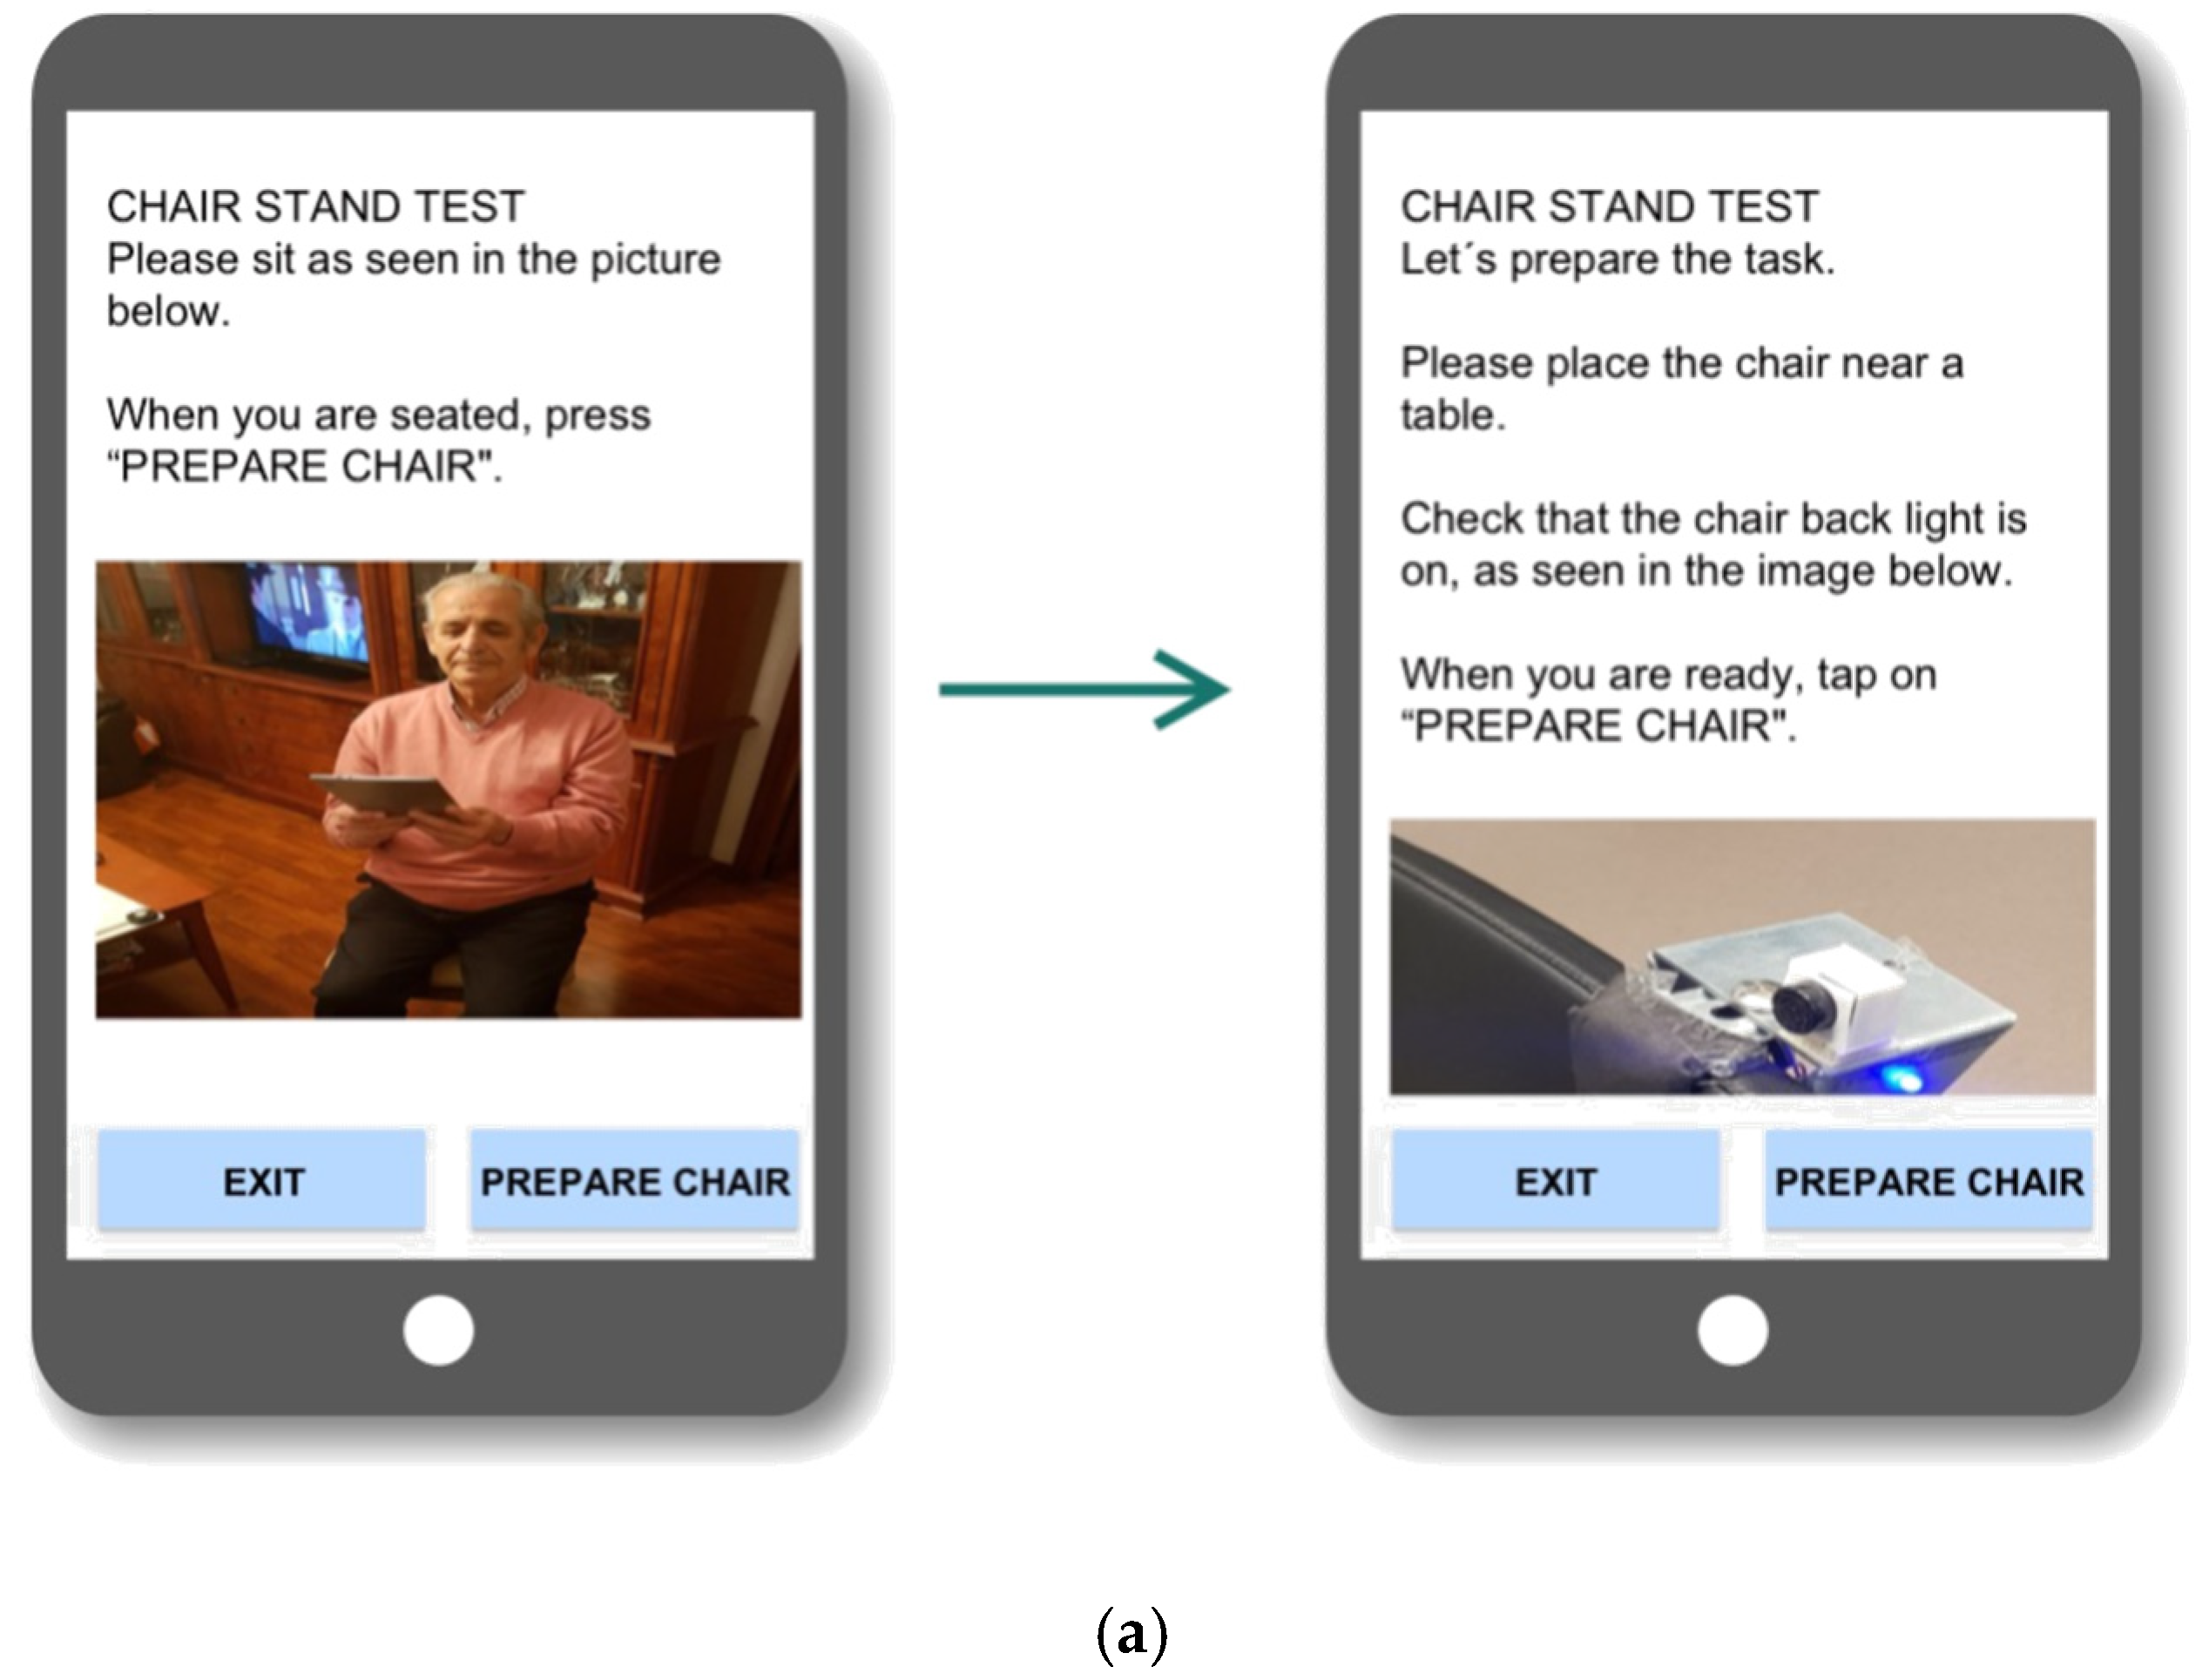
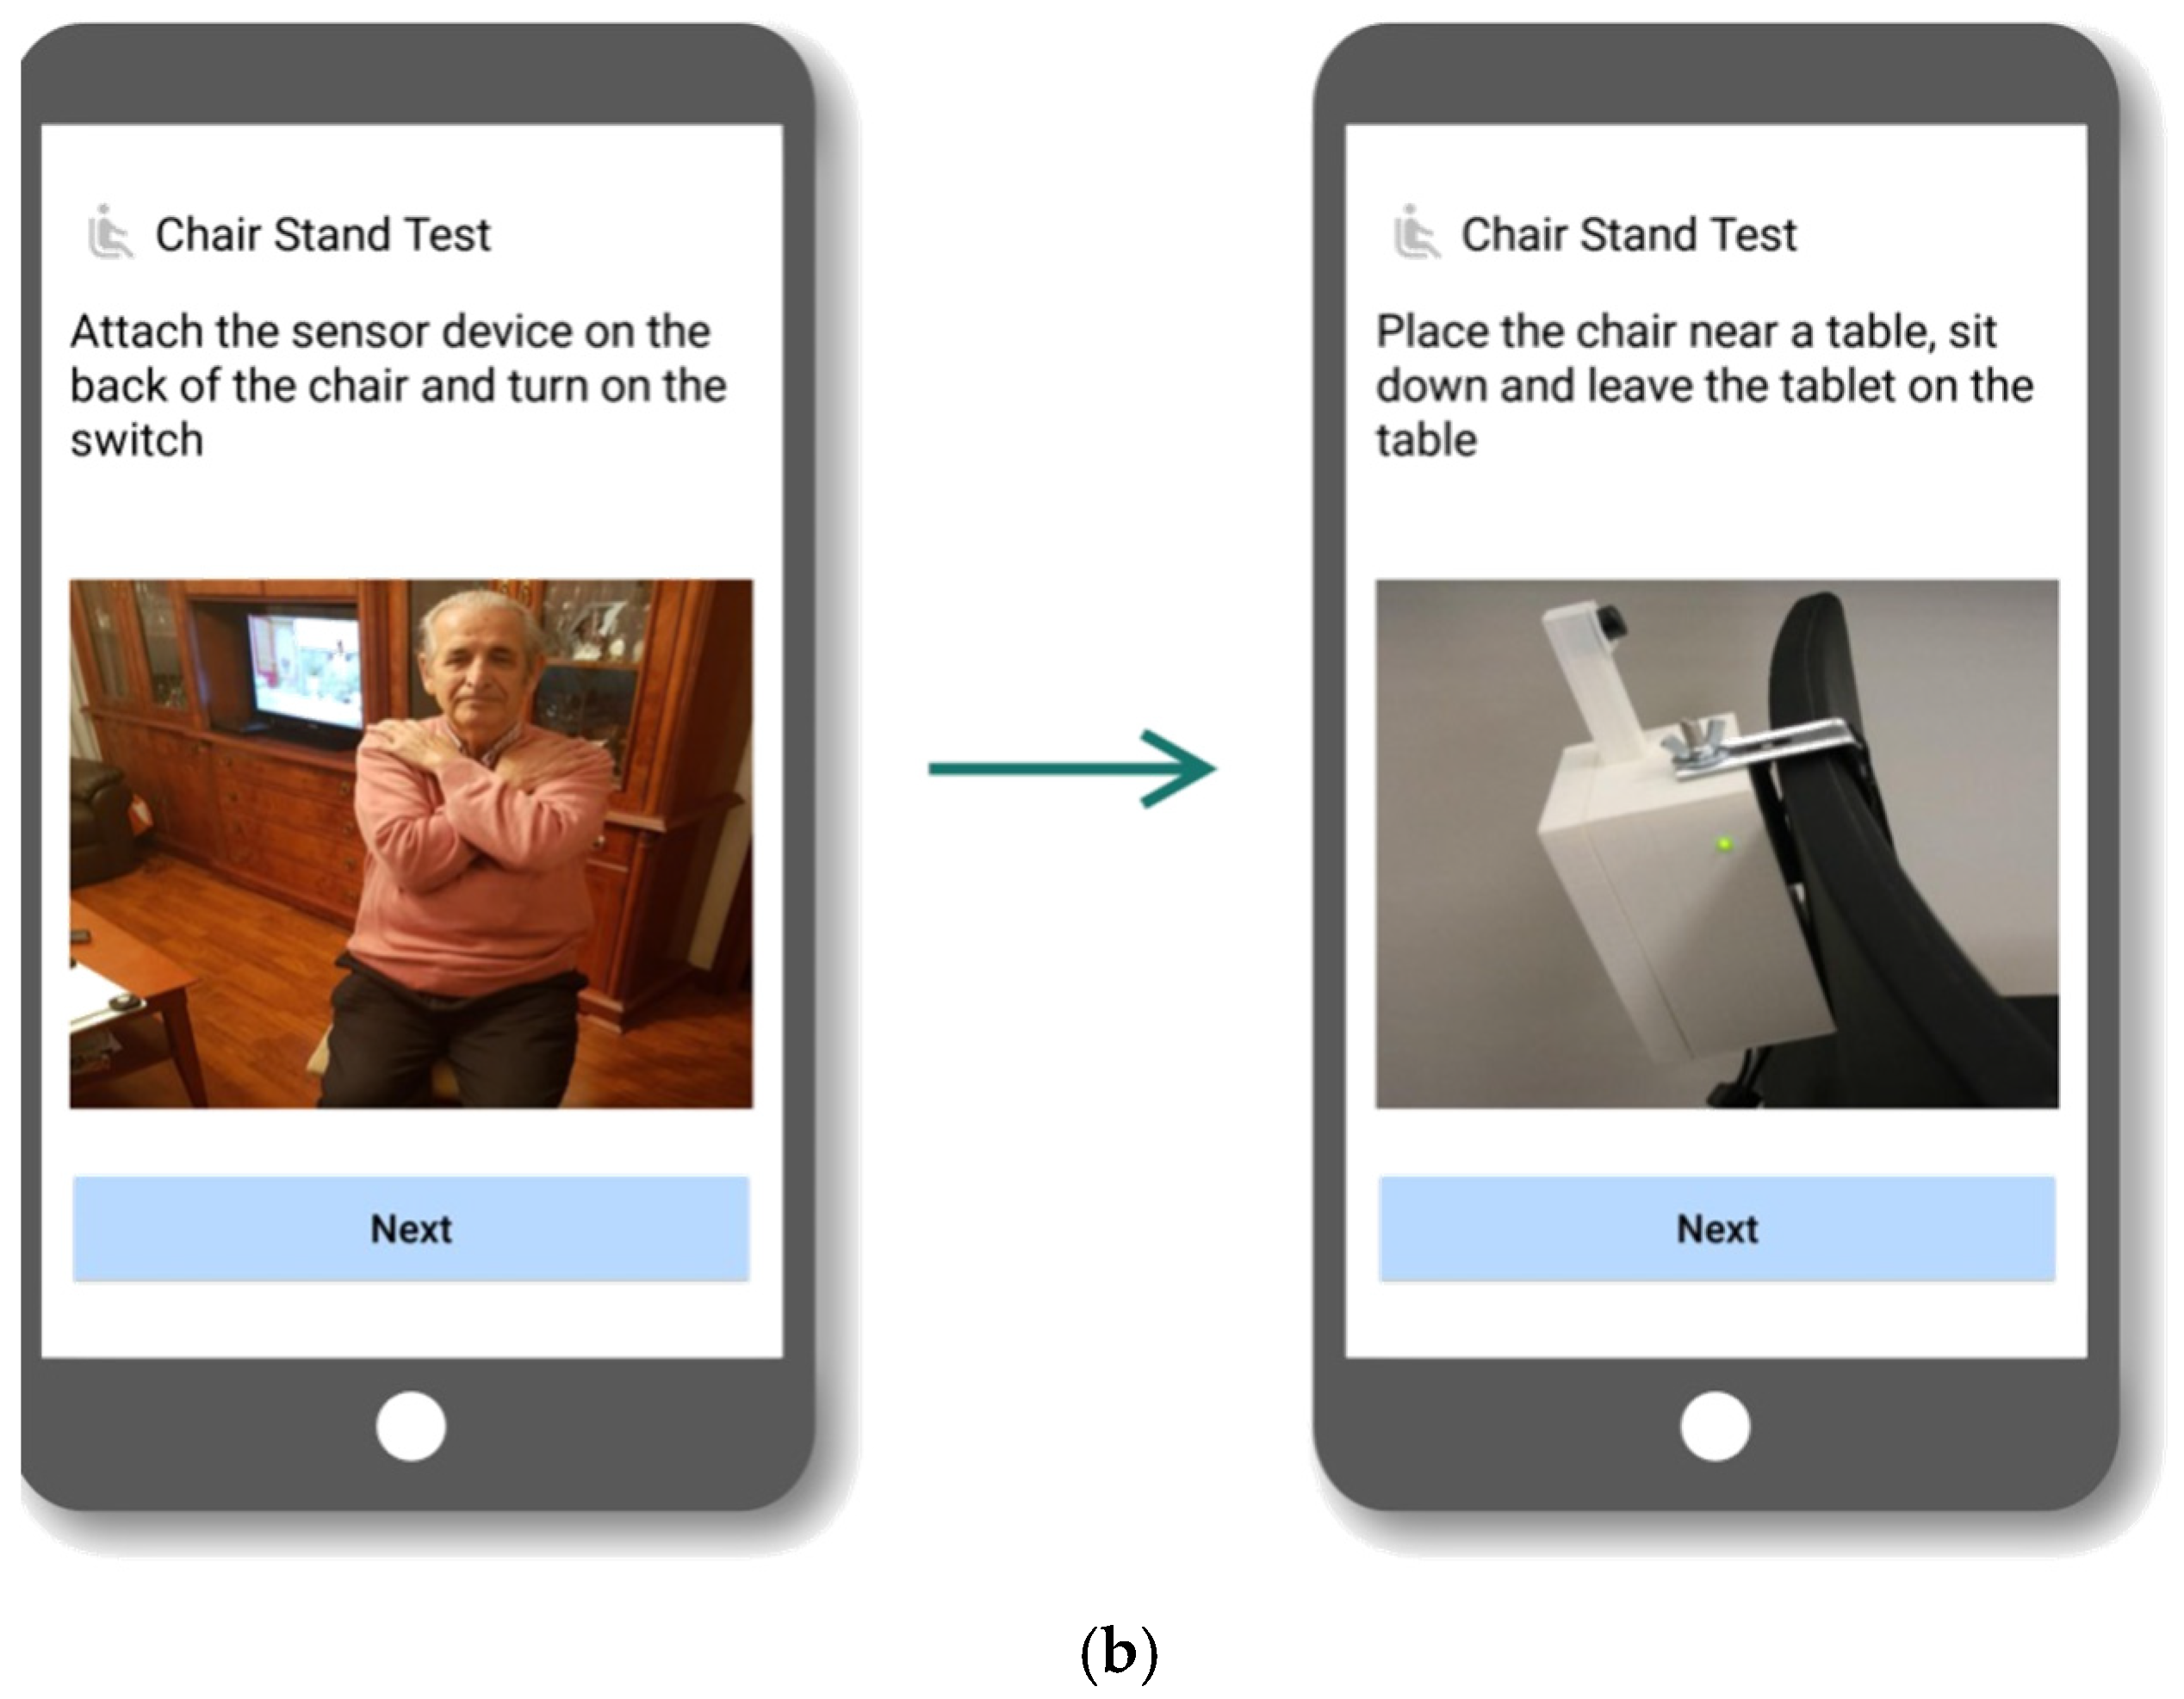
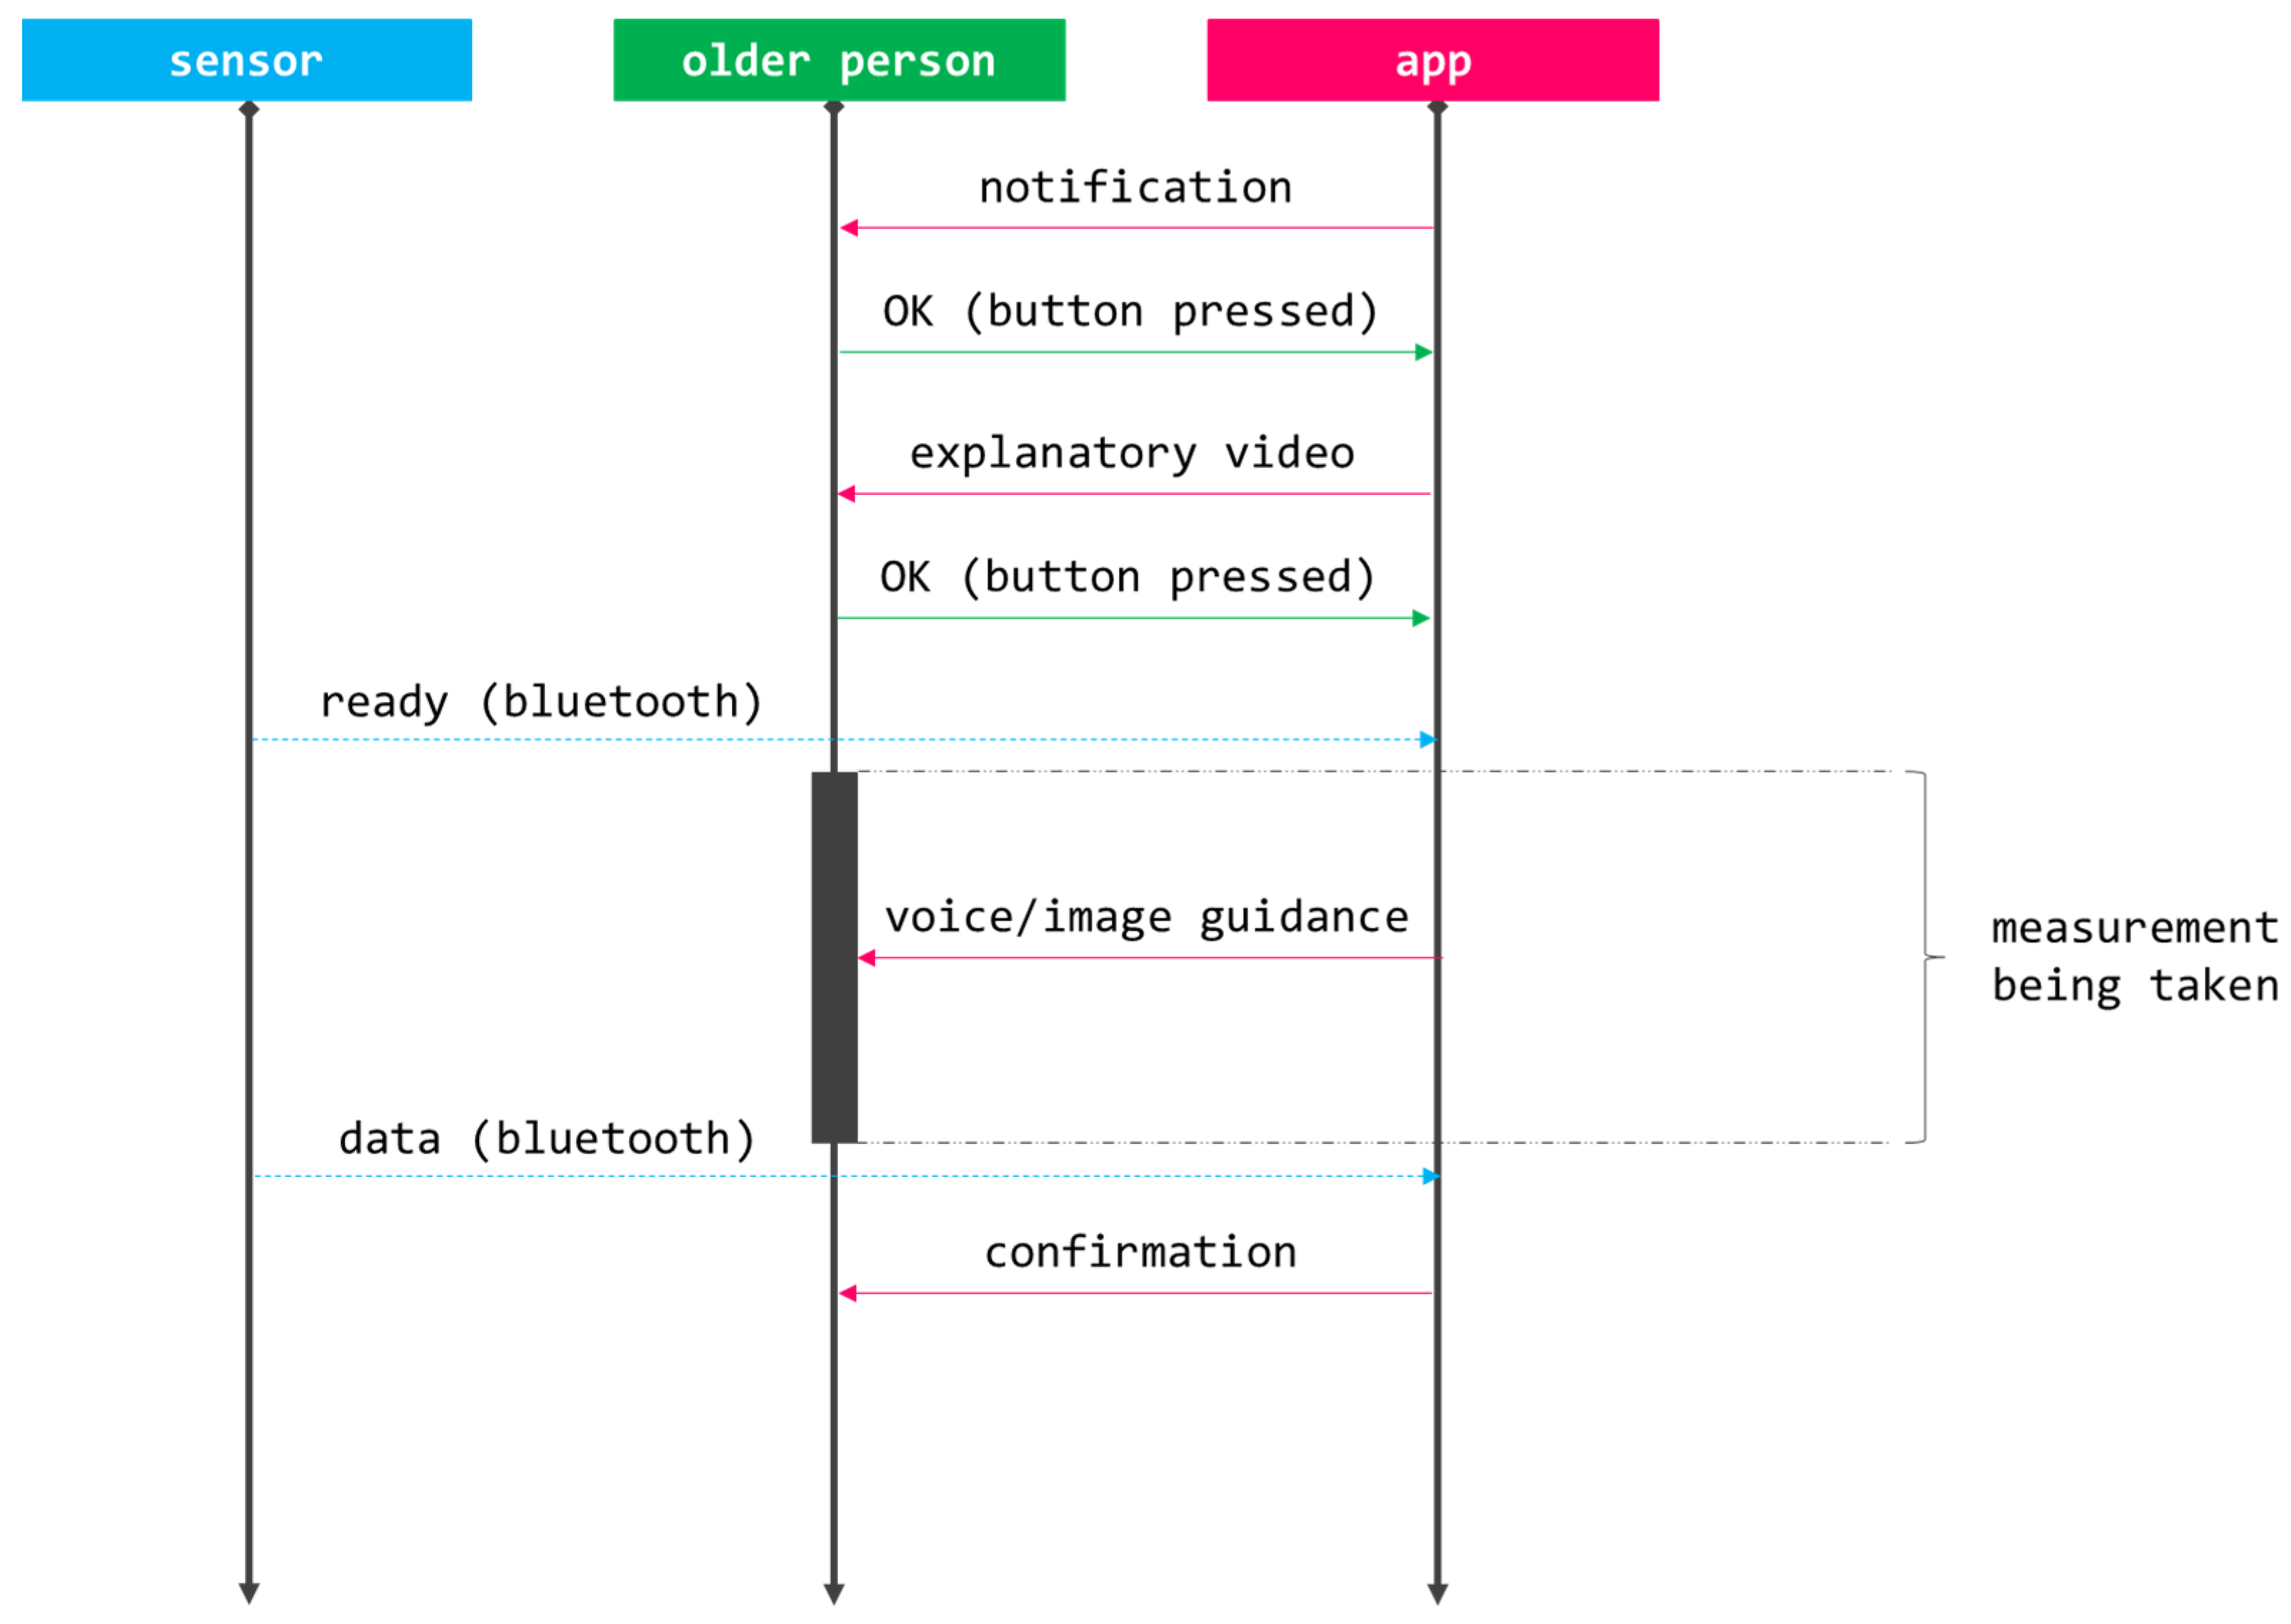
2.2. CAPACITY Interaction System
- Unceasing intrinsic capacity follow-up that enables triggering potential deterioration alarms;
- Access to a customized therapeutic plan (intervention), given the peculiarities and needs of the older person;
- Retrieving their own evolution;
- Communication with formal carers via asynchronous channels; and
- Notifications on pertinent alarms related to health.
2.3. Assessment Tools
- Q1: The information the device provides motivates me to have a healthier lifestyle;
- Q2: The device makes me feel cared for;
- Q3: Using the device is a burden for me;
- Q4: The device enables me to control my own health; and
- Q5: I would use it.
2.4. Recruitment and Data Collection
- Inclusion criteria:
- o
- +70 years old;
- o
- Living at home;
- o
- Barthel index [48] ≥90; and
- o
- Being pre-frail or frail.
- Exclusion criteria:
- o
- Inadequate home infrastructure impeding the installation of the technology;
- o
- Inability to understand how to use CAPACITY;
- o
- Medical condition incompatible with the VIVIFRAIL physical activity program;
- o
- History of drug/alcohol abuse;
- o
- Psychiatric disorders;
- o
- Living with a participant; and
- o
- Parti9cipating in another interventional clinical study.
- There were two different groups of interest (i.e., pre-frail and frail older persons);
- Given the usual standards, a recruitment objective of 20 subjects per interest group and research arm was set, for a total of 80; and
- Researchers assumed that a potential dropout rate of 10–15% over the previous calculation, so the target sample size was increased to 90.
3. Results
4. Discussion
- Q4: I think that I would need the support of a technical person to be able to use this system;
- Q7: I would imagine that most people would learn to use this system very quickly; and
- Q10: I needed to learn a lot of things before I could get going with this system.
5. Conclusions
Supplementary Materials
Author Contributions
Funding
Institutional Review Board Statement
Informed Consent Statement
Data Availability Statement
Acknowledgments
Conflicts of Interest
References
- WHO Integrated Care for Older People. Available online: https://www.who.int/publications/i/item/9789241550109 (accessed on 20 September 2021).
- Fulop, T.; Larbi, A.; Witkowski, J.M.; McElhaney, J.; Loeb, M.; Mitnitski, A.; Pawelec, G. Aging, frailty and age-related diseases. Biogerontology 2010, 11, 547–563. [Google Scholar] [CrossRef]
- Rodriguez-Mañas, L.; Fried, L.P. Frailty in the clinical scenario. Lancet 2015, 385, e7–e9. [Google Scholar] [CrossRef]
- O’Caoimh, R.; Galluzzo, L.; Rodriguez-Laso, A.; Van Der Heyden, J.; Ranhoff, A.H.; Lamprini-Koula, M.; Ciutan, M.; López-Samaniego, L.; Carcaillon-Bentata, L.; Kennelly, S.; et al. Prevalence of frailty at population level in European ADVANTAGE Joint Action Member States: A systematic review and meta-analysis. Ann. Ist. Super. Sanita 2018, 54, 226–238. [Google Scholar] [CrossRef]
- Rodriguez-Mañas, L.; Laosa, O.; Vellas, B.; Paolisso, G.; Topinkova, E.; Oliva-Moreno, J.; Bourdel-Marchasson, I.; Izquierdo, M.; Hood, K.; Zeyfang, A.; et al. Effectiveness of a multimodal intervention in functionally impaired older people with type 2 diabetes mellitus. J. Cachex- Sarcopenia Muscle 2019, 10, 721–733. [Google Scholar] [CrossRef] [Green Version]
- Izquierdo, M.; Casas-Herrero, A.; Martínez-Velilla, N.; Alonso-Bouzón, C.; Rodríguez-Mañas, L. An example of cooperation for implementing programs associated with the promotion of exercise in the frail elderly. European Erasmus+ Vivifrail program. Rev. Esp. Geriatr. Gerontol. 2017, 52, 110–111. [Google Scholar] [CrossRef]
- Izquierdo, M.; Vivifrail Investigators Group; Rodriguez-Mañas, L.; Sinclair, A.J. What is new in exercise regimes for frail older people—How does the Erasmus Vivifrail Project take us forward? J. Nutr. Heal. Aging 2016, 20, 736–737. [Google Scholar] [CrossRef]
- Seldeen, K.L.; Lasky, M.G.; Leiker, M.M.M.; Pang, M.; Personius, P.K.E.; Troen, B.R. High Intensity Interval Training Improves Physical Performance and Frailty in Aged Mice. J. Gerontol. Ser. A. Boil. Sci. Med. Sci. 2017, 73, 429–437. [Google Scholar] [CrossRef] [Green Version]
- Silva, R.B.; Aldoradin-Cabeza, H.; Eslick, G.D.; Phu, S.; Duque, G. The Effect of Physical Exercise on Frail Older Persons: A Systematic Review. J. Frailty Aging 2017, 6, 91–96. [Google Scholar] [CrossRef]
- Makizako, H.; Shimada, H.; Doi, T.; Tsutumimoto, K.; Yoshida, D.; Suzuki, T. Effects of a community disability prevention program for frail older adults at 48-month follow up. Geriatr. Gerontol. Int. 2017, 17, 2347–2353. [Google Scholar] [CrossRef]
- Dedeyne, L.; Deschodt, M.; Verschueren, S.; Tournoy, J.; Gielen, E. Effects of multi-domain interventions in (pre)frail elderly on frailty, functional, and cognitive status: A systematic review. Clin. Interv. Aging 2017, 12, 873–896. [Google Scholar] [CrossRef] [Green Version]
- Yannakoulia, M.; Ntanasi, E.; Anastasiou, C.A.; Scarmeas, N. Frailty and nutrition: From epidemiological and clinical evidence to potential mechanisms. Metabolism 2017, 68, 64–76. [Google Scholar] [CrossRef]
- Cruz-Jentoft, A.J.; Kiesswetter, E.; Drey, M.; Sieber, C.C. Nutrition, frailty, and sarcopenia. Aging Clin. Exp. Res. 2017, 29, 43–48. [Google Scholar] [CrossRef]
- Herr, M.; Sirven, N.; Grondin, H.; Pichetti, S.; Sermet, C. Frailty, polypharmacy, and potentially inappropriate medications in old people: Findings in a representative sample of the French population. Eur. J. Clin. Pharmacol. 2017, 73, 1165–1172. [Google Scholar] [CrossRef] [Green Version]
- Maclagan, L.C.; Maxwell, C.J.; Gandhi, S.; Guan, J.; Bell, C.M.; Hogan, D.B.; Daneman, N.; Gill, S.S.; Morris, A.M.; Jeffs, L.; et al. Frailty and Potentially Inappropriate Medication Use at Nursing Home Transition. J. Am. Geriatr Soc. 2017, 7, 2205–2212. [Google Scholar] [CrossRef]
- Veronese, N.; Stubbs, B.; Noale, M.; Solmi, M.; Pilotto, A.; Vaona, A.; Demurtas, J.; Mueller, C.; Huntley, J.; Crepaldi, G.; et al. Polypharmacy Is Associated with Higher Frailty Risk in Older People: An 8-Year Longitudinal Cohort Study. J. Am. Med. Dir. Assoc. 2017, 18, 624–628. [Google Scholar] [CrossRef]
- Suárez-Méndez, I.; Walter, S.; López-Sanz, D.; Pasquín, N.; Bernabé, R.; Gallo, E.C.; Valdés, M.; del Pozo, F.; Maestú, F.; Rodríguez-Mañas, L. Ongoing Oscillatory Electrophysiological Alterations in Frail Older Adults: A MEG Study. Front. Aging Neurosci. 2021, 13, 54. [Google Scholar] [CrossRef]
- Kinney, J.M. Nutritional frailty, sarcopenia and falls in the elderly. Curr. Opin. Clin. Nutr. Metab. Care 2004, 7, 15–20. [Google Scholar] [CrossRef]
- Binotto, M.A.; Lenardt, M.H.; Rodríguez-Martínez, M.D.C. Fragilidade física e velocidade da marcha em idosos da comunidade: Uma revisão sistemática. Rev. Esc. Enferm. USP 2018, 52, e03392. [Google Scholar] [CrossRef] [Green Version]
- Carnemolla, P. Ageing in place and the internet of things—How smart home technologies, the built environment and caregiving intersect. Vis. Eng. 2018, 6, 7. [Google Scholar] [CrossRef] [Green Version]
- WHO. Global Age-Friendly Cities: A Guide. Available online: https://www.who.int/ageing/publications/Global_age_friendly_cities_Guide_English.pdf (accessed on 20 September 2021).
- Pilotto, A.; Boi, R.; Petermans, J. Technology in geriatrics. Age Ageing 2018, 47, 771–774. [Google Scholar] [CrossRef] [Green Version]
- Alam, M.R.; Reaz, M.B.I.; Ali, M.A.M. A review of smart homes: Past, present, and future. IEEE Trans. Syst. Man Cybern. Part. C Appl. Rev. 2012, 42, 1190–1203. [Google Scholar] [CrossRef]
- Turjamaa, R.; Pehkonen, A.; Kangasniemi, M. How smart homes are used to support older people: An integrative review. Int. J. Older People Nurs. 2019, 14, e12260. [Google Scholar] [CrossRef]
- Majumder, S.; Aghayi, E.; Noferesti, M.; Memarzadeh-Tehran, H.; Mondal, T.; Pang, Z.; Deen, M.J. Smart Homes for Elderly Healthcare—Recent Advances and Research Challenges. Sensors 2017, 17, 2496. [Google Scholar] [CrossRef] [Green Version]
- Kon, B.; Lam, A.; Chan, J. Evolution of Smart Homes for the Elderly. In Proceedings of the 26th International Conference on World Wide Web Companion, Perth, Australia, 3–7 April 2017. [Google Scholar] [CrossRef] [Green Version]
- Kim, J.; Choi, H.S.; Wang, H.; Agoulmine, N.; Deen, M.J.; Hong, J.W.K. POSTECH’s U-health smart home for elderly monitoring and support. In Proceedings of the 2010 IEEE International Symposium on “A World of Wireless, Mobile and Multimedia Networks”, WoWMoM 2010—Digital Proceedings, Montreal, QC, Canada, 14–17 June 2010. [Google Scholar]
- Mohler, M.J.; Wendel, C.S.; Taylor-Piliae, R.E.; Toosizadeh, N.; Najafi, B. Motor Performance and Physical Activity as Predictors of Prospective Falls in Community-Dwelling Older Adults by Frailty Level: Application of Wearable Technology. Gerontology 2016, 62, 654–664. [Google Scholar] [CrossRef] [Green Version]
- Stavropoulos, T.G.; Papastergiou, A.; Mpaltadoros, L.; Nikolopoulos, S.; Kompatsiaris, I. IoT Wearable Sensors and Devices in Elderly Care: A Literature Review. Sensors 2020, 20, 2826. [Google Scholar] [CrossRef]
- Changizi, M.; Kaveh, M.H. Effectiveness of the mHealth technology in improvement of healthy behaviors in an elderly population—A systematic review. mHealth 2017, 3, 51. [Google Scholar] [CrossRef]
- Zaslavsky, O.; Thompson, H.; Demiris, G. The Role of Emerging Information Technologies in Frailty Assessment. Res. Gerontol. Nurs. 2012, 5, 216–228. [Google Scholar] [CrossRef]
- Lee, C.; Coughlin, J.F. PERSPECTIVE: Older Adults’ Adoption of Technology: An Integrated Approach to Identifying Determinants and Barriers. J. Prod. Innov. Manag. 2014, 32, 747–759. [Google Scholar] [CrossRef]
- Merkel, S.; Kucharski, A. Participatory Design in Gerontechnology: A Systematic Literature Review. Gerontol. 2018, 59, e16–e25. [Google Scholar] [CrossRef]
- Zhou, J.; Rau, P.-L.P.; Salvendy, G. Age-related difference in the use of mobile phones. Univers. Access Inf. Soc. 2013, 13, 401–413. [Google Scholar] [CrossRef]
- Keränen, N.S.; Kangas, M.; Immonen, M.; Similä, H.; Enwald, H.; Korpelainen, R.; Jämsä, T. Use of Information and Communication Technologies Among Older People with and without Frailty: A Population-Based Survey. J. Med. Internet Res. 2017, 19, e29. [Google Scholar] [CrossRef]
- Yazdani-Darki, M.; Rahemi, Z.; Adib-Hajbaghery, M.; Izadi, F.S. Older adults’ barriers to use technology in daily life: A qualitative study. Nurs. Midwifery Stud. 2020, 9, 229. [Google Scholar]
- Norman, D.A.; Draper, S.W. (Eds.) User Centered System Design; CRC Press: Boca Raton, FL, USA, 1986. [Google Scholar]
- Duque, E.; Fonseca, G.; Vieira, H.; Gontijo, G.; Ishitani, L. A systematic literature review on user centered design and participatory design with older people. In Proceedings of the IHC 2019—Proceedings of the 18th Brazilian Symposium on Human Factors in Computing Systems, Vitória, Espírito Santo, 21–25 October 2019. [Google Scholar]
- Wilkinson, C.; De Angeli, A. Applying user centred and participatory design approaches to commercial product development. Des. Stud. 2014, 35, 614–631. [Google Scholar] [CrossRef]
- Najafi, B.; Armstrong, D.G.; Mohler, J. Novel Wearable Technology for Assessing Spontaneous Daily Physical Activity and Risk of Falling in Older Adults with Diabetes. J. Diabetes Sci. Technol. 2013, 7, 1147–1160. [Google Scholar] [CrossRef] [Green Version]
- Gallucci, A.; Trimarchi, P.D.; Abbate, C.; Tuena, C.; Pedroli, E.; Lattanzio, F.; Stramba-Badiale, M.; Cesari, M.; Giunco, F. ICT technologies as new promising tools for the managing of frailty: A systematic review. Aging Clin. Exp. Res. 2020, 33, 1453–1464. [Google Scholar] [CrossRef]
- VIVIFRAIL Project. Available online: https://ec.europa.eu/programmes/erasmus-plus/projects/eplus-project-details/#project/556988-EPP-1-2014-1-ES-SPO-SCP (accessed on 20 September 2021).
- Pérez-Rodríguez, R.; Guevara-Guevara, T.; Moreno-Sánchez, P.A.; Villalba-Mora, E.; Valdés-Aragonés, M.; Oviedo-Briones, M.; Carnicero, J.A.; Rodríguez-Mañas, L. Monitoring and Intervention Technologies to Manage Diabetic Older Persons: The CAPACITY Case—A Pilot Study. Front. Endocrinol. 2020, 11, 300. [Google Scholar] [CrossRef]
- Ferre, X.; Villalba-Mora, E.; Caballero-Mora, M.-A.; Sanchez, A.; Aguilera, W.; Garcia-Grossocordon, N.; Nuñez-Jimenez, L.; Rodríguez-Mañas, L.; Liu, Q.; Del Pozo-Guerrero, F. Gait Speed Measurement for Elderly Patients with Risk of Frailty. Mob. Inf. Syst. 2017, 2017, 1310345. [Google Scholar] [CrossRef]
- Cobo, A.; Villalba-Mora, E.; Pérez-Rodríguez, R.; Ferre, X.; Escalante, W.; Moral, C.; Rodriguez-Mañas, L. Automatic and Real-Time Computation of the 30-Seconds Chair-Stand Test without Professional Supervision for Community-Dwelling Older Adults. Sensors 2020, 20, 5813. [Google Scholar] [CrossRef]
- Fried, L.P.; Tangen, C.M.; Walston, J.D.; Newman, A.B.; Hirsch, C.; Gottdiener, J.S.; Seeman, T.; Tracy, R.P.; Kop, W.J.; Burke, G.L.; et al. Frailty in Older Adults: Evidence for a Phenotype. J. Gerontol. 2001, 56, M146–M157. [Google Scholar] [CrossRef]
- Rubenstein, L.Z.; Harker, J.O.; Salvà, A.; Guigoz, Y.; Vellas, B. Screening for Undernutrition in Geriatric Practice: Developing the Short-Form Mini-Nutritional Assessment (MNA-SF). J. Gerontol. Ser. A Boil. Sci. Med Sci. 2001, 56, M366–M372. [Google Scholar] [CrossRef] [Green Version]
- Barthel, D.; Mahoney, F. Baltimore City Medical Society Functional Evaluation: The Barthel Index. Md. State Med. J. 1965, 14, 56–61. [Google Scholar]
- Morley, J.E.; Malmstrom, T.K.; Miller, D.K. A simple frailty questionnaire (FRAIL) predicts outcomes in middle aged African Americans. J. Nutr. Health Aging 2012, 16, 601–608. [Google Scholar] [CrossRef] [Green Version]
- Pfeffer, R.I.; Kurosaki, T.T.; Harrah, C.H., Jr.; Chance, J.M.; Filos, S. Measurement of Functional Activities in older adults in the community. J. Gerontol. 1982, 37, 323–329. [Google Scholar] [CrossRef]
- Villalba-Mora, E.; Ferre, X.; Pérez-Rodríguez, R.; Moral, C.; Valdés-Aragonés, M.; Sánchez-Sánchez, A.; Rodríguez-Mañas, L. Home Monitoring System for Comprehensive Geriatric Assessment in Patient’s Dwelling: System Design and UX Evaluation. Front. Digit. Heal. 2021, 3, 40. [Google Scholar] [CrossRef]
- International Organization for Standardization. ISO INTERNATIONAL STANDARD ISO 9241-11. Available online: https://www.iso.org/obp/ui/#iso:std:iso:9241:-11:ed-2:v1:en (accessed on 20 September 2021).
- Brooke, J. SUS: A quick and dirty usability scale. Usability Eval. Ind. 1996, 189, 4–7. [Google Scholar] [CrossRef]
- Brooke, J. SUS: A retrospective. J. Usability Stud. 2013, 8, 29–40. [Google Scholar]
- Lewis, J.R.; Sauro, J. The factor structure of the system usability scale. In International Conference on Human Centered Design; Springer: Berlin/Heidelberg, Germany, 2009. [Google Scholar]
- Tullis, T.S.; Stetson, J.N. A Comparison of Questionnaires for Assessing Website Usability ABSTRACT: Introduction. In Proceedings of the Usability Professionals Association (UPA) 2004 Conference, Minneapolis, MN, USA, 7–11 June 2004. [Google Scholar]
- Schrepp, M.; Hinderks, A.; Thomaschewski, J. User Experience Questionnaire. Mensch. Comput. 2017-Tag. Spiel. Einfach Interagieren 2018, 17, 355. [Google Scholar]
- Davis, F.D. Perceived Usefulness, Perceived Ease of Use, and User Acceptance of Information Technology. MIS Q. 1989, 13, 319. [Google Scholar] [CrossRef] [Green Version]
- Sauro, J. Measuring Usability with The System Usability Scale (SUS). Meas. Usability 2011, 2, 1–11. [Google Scholar]
- Lewis, J.R.; Sauro, J. Item Benchmarks for the System Usability Scale. J. Usability Stud. 2018, 13, 158–167. [Google Scholar]
- Bangor, A.; Kortum, P.; Miller, J. Determining what individual SUS scores mean. J. Usability Stud. 2009, 3, 114–128. [Google Scholar]
- Schrepp, D.M. User Experience Questionnaire Handbook. Procedia Comput. Sci. 2014. [Google Scholar]
- Rauschenberger, M.; Schrepp, M.; Olschner, S.; Thomaschewski, J.; Cota, M.P. Measurement of user experience: A Spanish Language Version of the User Experience Questionnaire (UEQ). In Proceedings of the 7th Iberian Conference on Information Systems and Technologies, Madrid, Spain, 20–23 June 2012; pp. 471–476. [Google Scholar] [CrossRef]
- Schrepp, M.; Hinderks, A.; Thomaschewski, J. Construction of a Benchmark for the User Experience Questionnaire (UEQ). Int. J. Interact. Multimedia Artif. Intell. 2017, 4, 40. [Google Scholar] [CrossRef] [Green Version]
- Cohen, J. Things I have learned (so far). Am. Psychol. 1990, 45, 1304–1312. [Google Scholar] [CrossRef]
- Rosenthal, R. Parametric measures of effect size. In the Handbook of Research Synthesis; Russel Sage Foundation: New York, NY, USA, 1994; ISBN 0871542269. [Google Scholar]
- Pérez-Rodríguez, R.; Moreno-Sánchez, P.A.; Valdés-Aragonés, M.; Oviedo-Briones, M.; Divan, S.; García-Grossocordón, N.; Rodríguez-Mañas, L. FriWalk robotic walker: Usability, acceptance and UX evaluation after a pilot study in a real environment. Disabil. Rehabil.: Assist. Technol. 2019, 15, 718–727. [Google Scholar] [CrossRef]
- Weering, M.D.-V.; Jansen-Kosterink, S.; Frazer, S.; Vollenbroek-Hutten, M. User Experience, Actual Use, and Effectiveness of an Information Communication Technology-Supported Home Exercise Program for Pre-Frail Older Adults. Front. Med. 2017, 4, 208. [Google Scholar] [CrossRef] [Green Version]
- Mehra, S.; Visser, B.; Cila, N.; Helder, J.V.D.; Engelbert, R.H.; Weijs, P.J.; Kröse, B.J. Supporting Older Adults in Exercising with a Tablet: A Usability Study. JMIR Hum. Factors 2019, 6, e11598. [Google Scholar] [CrossRef]
- Adcock, M.; Sonder, F.; Schättin, A.; Gennaro, F.; De Bruin, E.D. A usability study of a multicomponent video game-based training for older adults. Eur. Rev. Aging Phys. Act. 2020, 17, 1–15. [Google Scholar] [CrossRef] [Green Version]
- Cossu-Ergecer, F.; Dekker, M.; Van Beijnum, B.-J.F.; Tabak, M. Usability of a New eHealth Monitoring Technology That Reflects Health Care Needs for Older Adults with Cognitive Impairments and Their Informal and Formal Caregivers. Computer 2018, 5, 197–207. [Google Scholar] [CrossRef]
- Hsieh, K.L.; Fanning, J.T.; Rogers, W.A.; Wood, T.A.; Sosnoff, J.J. A Fall Risk mHealth App for Older Adults: Development and Usability Study. JMIR Aging 2018, 1, e11569. [Google Scholar] [CrossRef] [Green Version]
- Grindrod, K.A.; Li, M.; Gates, A. Evaluating User Perceptions of Mobile Medication Management Applications with Older Adults: A Usability Study. JMIR mHealth uHealth 2014, 2, e11. [Google Scholar] [CrossRef]


| N | Proportion (%) | ||
|---|---|---|---|
| Sex | Female | 32 | 69.57 |
| Male | 14 | 30.43 | |
| Educational level | No formal education | 20 | 43.48 |
| Secondary education | 20 | 43.48 | |
| Primary education | 5 | 10.87 | |
| Higher education | 1 | 2.17 | |
| Experience with technology | No experience | 30 | 65.22 |
| Once or twice | 4 | 8.70 | |
| Occasional use | 3 | 6.52 | |
| Daily experience | 9 | 19.56 |
| Chair Stand | Weight Scale | Gait Speed | Frailty Phenotype Criteria | Barthel Index | FAQ | FRAIL Scale | MNA | |
|---|---|---|---|---|---|---|---|---|
| Default measurement periodicity (weeks) | 2 | 2 | 2 | 4 | 4 | 4 | 4 | 8 |
| Average adherence (%) | 96.38 | 97.44 | 95.70 | 100 | 99.54 | 95.95 | 94.44 | 94.91 |
| SD | 0.12 | 0.07 | 0.08 | 0.00 | 0.03 | 0.08 | 0.23 | 0.19 |
| SUS Item | Baseline | Month 3 | Month 6 |
|---|---|---|---|
| Q1 | 4.32 | 4.43 | 4.32 |
| Q2 | 2.00 | 1.65 | 1.57 |
| Q3 | 4.48 | 4.46 | 4.49 |
| Q4 | 2.88 | 2.43 | 1.92 |
| Q5 | 4.76 | 4.38 | 4.24 |
| Q6 | 1.48 | 1.65 | 1.65 |
| Q7 | 4.04 | 3.95 | 4.00 |
| Q8 | 1.16 | 1.19 | 1.16 |
| Q9 | 4.84 | 4.84 | 4.76 |
| Q10 | 2.40 | 2.11 | 2.35 |
| Mean | 80.11 | 83.31 | 83.68 |
| SD | 13.66 | 15.07 | 11.62 |
| Pbaseline-m3 | 0.57 | ||
| Pbaseline-m6 | 0.49 | ||
| Pm3-m6 | 0.88 |
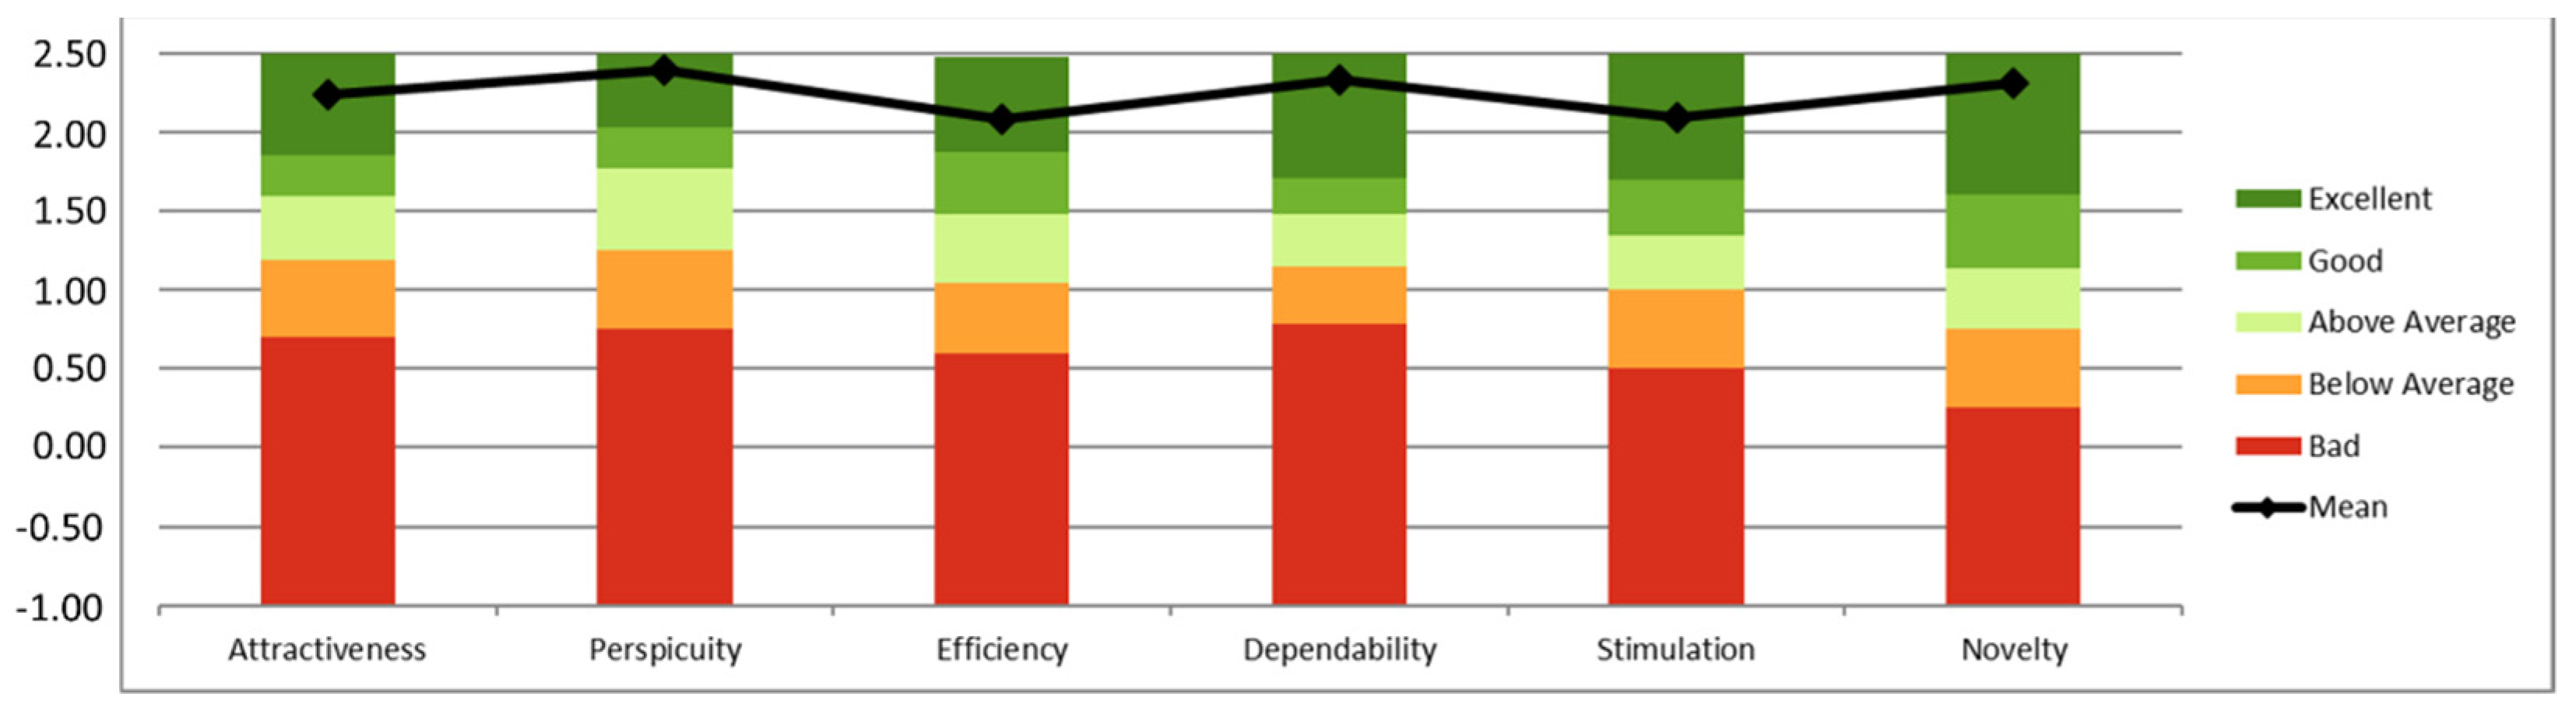
| UEQ Category | Mean | SD | Confidence | Conf. Interval (p = 0.05) | |
|---|---|---|---|---|---|
| Attractiveness | 2.20 | 0.64 | 0.21 | 1.99 | 2.40 |
| Perspicuity | 2.30 | 0.73 | 0.23 | 2.06 | 2.53 |
| Efficiency | 1.99 | 0.75 | 0.24 | 1.75 | 2.23 |
| Dependability | 2.16 | 0.66 | 0.21 | 1.95 | 2.38 |
| Stimulation | 2.05 | 0.72 | 0.23 | 1.82 | 2.28 |
| Novelty | 2.09 | 0.98 | 0.32 | 1.78 | 2.41 |
| TAM item | Baseline | Month 3 | Month 6 | |
|---|---|---|---|---|
| Perceived usefulness | Q1 | 4.16 | 4.35 | 4.16 |
| Q2 | 3.88 | 3.89 | 4.03 | |
| Q3 | 3.84 | 4.16 | 4.24 | |
| Q4 | 4.08 | 4.22 | 4.11 | |
| Q5 | 4.12 | 4.27 | 4.30 | |
| Q6 | 4.56 | 4.51 | 4.24 | |
| Mean | 24.64 | 25.41 | 25.08 | |
| SD | 4.79 | 3.68 | 4.48 | |
| Pbaseline-m3 | 0.64 | |||
| Pbaseline-m6 | 0.84 | |||
| Pm3-m6 | 0.40 | |||
| Perceived ease-of-use | Q1 | 3.72 | 4.30 | 4.24 |
| Q2 | 3.88 | 4.35 | 4.51 | |
| Q3 | 4.36 | 4.30 | 4.65 | |
| Q4 | 4.52 | 4.11 | 4.46 | |
| Q5 | 3.72 | 4.00 | 4.16 | |
| Q6 | 4.16 | 4.22 | 4.43 | |
| Mean | 24.36 | 25.27 | 26.46 | |
| SD | 4.86 | 5.16 | 3.77 | |
| Pbaseline-m3 | 0.25 | |||
| Pbaseline-m6 | 0.02 | |||
| Pm3-m6 | 0.36 | |||
| Mean | 49.00 | 50.68 | 51.54 | |
| SD | 8.24 | 6.68 | 6.97 | |
| Pbaseline-m3 | 0.26 | |||
| Pbaseline-m6 | 0.15 | |||
| Pm3-m6 | 0.83 |
| Sensor | Q1 | Q2 | Q3 | Q4 | Q5 | |
|---|---|---|---|---|---|---|
| Gait speed | Mean | 4.19 | 4.53 | 1.44 | 4.00 | 4.44 |
| Std. dev | 0.75 | 0.61 | 0.84 | 0.99 | 0.88 | |
| Chair stand | Mean | 4.61 | 4.64 | 1.08 | 4.53 | 4.69 |
| Std. dev | 0.64 | 0.68 | 0.37 | 0.70 | 0.79 | |
| Weight | Mean | 4.69 | 4.61 | 1.19 | 4.61 | 4.92 |
| Std. dev | 0.58 | 0.90 | 0.82 | 0.69 | 0.28 | |
| SUS at Baseline | SUS at M3 | SUS at M6 | TAM at Baseline | TAM at M3 | TAM at M6 | |
|---|---|---|---|---|---|---|
| Non-formal education | 75.75 | 80.16 | 82.33 | 46.55 | 48.56 | 50.40 |
| Primary education | 83.25 | 84.12 | 82.94 | 48.33 | 51.53 | 51.12 |
| Secondary education | 92.50 | 85.63 | 84.50 | 56.67 | 55.50 | 56.40 |
| Higher education | 80.00 | - | - | 53.00 | - | - |
| p | 0.31 | 0.69 | 0.94 | 0.24 | 0.14 | 0.24 |
| Living alone | 80.21 | 80.33 | 82.14 | 49.08 | 49.47 | 49.07 |
| Living with younger relatives | 90.00 | 88.75 | 90.63 | 50.50 | 54.50 | 54.75 |
| Living with other older person | 80.91 | 83.06 | 81.84 | 48.64 | 50.83 | 52.68 |
| p | 0.65 | 0.60 | 0.37 | 0.96 | 0.41 | 0.21 |
| Help from nobody | 84.04 | 87.61 | 84.89 | 48.77 | 52.05 | 51.50 |
| Help from a younger relative | 78.21 | 75.31 | 80.71 | 48.29 | 47.13 | 50.43 |
| Help from other older person | 78.13 | 77.50 | 79.64 | 50.75 | 50.50 | 53.29 |
| Help from social services | 80.00 | 60.00 | 77.50 | 50.00 | 50.00 | 48.00 |
| p | 0.79 | 0.052 | 0.66 | 0.97 | 0.37 | 0.84 |
| No previous experience with technology | 79.17 | 82.60 | 80.30 | 49.94 | 50.50 | 50.88 |
| Used technology once or twice | 92.50 | 85.83 | 94.17 | 52.00 | 52.67 | 56.33 |
| Occasional use of technology | 85.63 | 84.38 | 90.71 | 46.75 | 51.13 | 52.14 |
| Daily use of technology | 80.00 | 70.00 | 71.25 | 35.00 | 48.00 | 50.50 |
| p | 0.54 | 0.66 | 0.017 | 0.31 | 0.96 | 0.65 |
| Pre-frail | 80.00 | 84.50 | 83.89 | 49.69 | 51.40 | 53.00 |
| Frail | 82.71 | 82.27 | 82.59 | 48.25 | 50.56 | 51.07 |
| p | 0.62 | 0.66 | 0.57 | 0.67 | 0.86 | 0.87 |
Publisher’s Note: MDPI stays neutral with regard to jurisdictional claims in published maps and institutional affiliations. |
© 2021 by the authors. Licensee MDPI, Basel, Switzerland. This article is an open access article distributed under the terms and conditions of the Creative Commons Attribution (CC BY) license (https://creativecommons.org/licenses/by/4.0/).
Share and Cite
Pérez-Rodríguez, R.; Villalba-Mora, E.; Valdés-Aragonés, M.; Ferre, X.; Moral, C.; Mas-Romero, M.; Abizanda-Soler, P.; Rodríguez-Mañas, L. Usability, User Experience, and Acceptance Evaluation of CAPACITY: A Technological Ecosystem for Remote Follow-Up of Frailty. Sensors 2021, 21, 6458. https://doi.org/10.3390/s21196458
Pérez-Rodríguez R, Villalba-Mora E, Valdés-Aragonés M, Ferre X, Moral C, Mas-Romero M, Abizanda-Soler P, Rodríguez-Mañas L. Usability, User Experience, and Acceptance Evaluation of CAPACITY: A Technological Ecosystem for Remote Follow-Up of Frailty. Sensors. 2021; 21(19):6458. https://doi.org/10.3390/s21196458
Chicago/Turabian StylePérez-Rodríguez, Rodrigo, Elena Villalba-Mora, Myriam Valdés-Aragonés, Xavier Ferre, Cristian Moral, Marta Mas-Romero, Pedro Abizanda-Soler, and Leocadio Rodríguez-Mañas. 2021. "Usability, User Experience, and Acceptance Evaluation of CAPACITY: A Technological Ecosystem for Remote Follow-Up of Frailty" Sensors 21, no. 19: 6458. https://doi.org/10.3390/s21196458
APA StylePérez-Rodríguez, R., Villalba-Mora, E., Valdés-Aragonés, M., Ferre, X., Moral, C., Mas-Romero, M., Abizanda-Soler, P., & Rodríguez-Mañas, L. (2021). Usability, User Experience, and Acceptance Evaluation of CAPACITY: A Technological Ecosystem for Remote Follow-Up of Frailty. Sensors, 21(19), 6458. https://doi.org/10.3390/s21196458