
The Role of Surface Electromyography in Data Fusion with Inertial Sensors to Enhance Locomotion Recognition and Prediction


Abstract
:1. Introduction
2. Methods
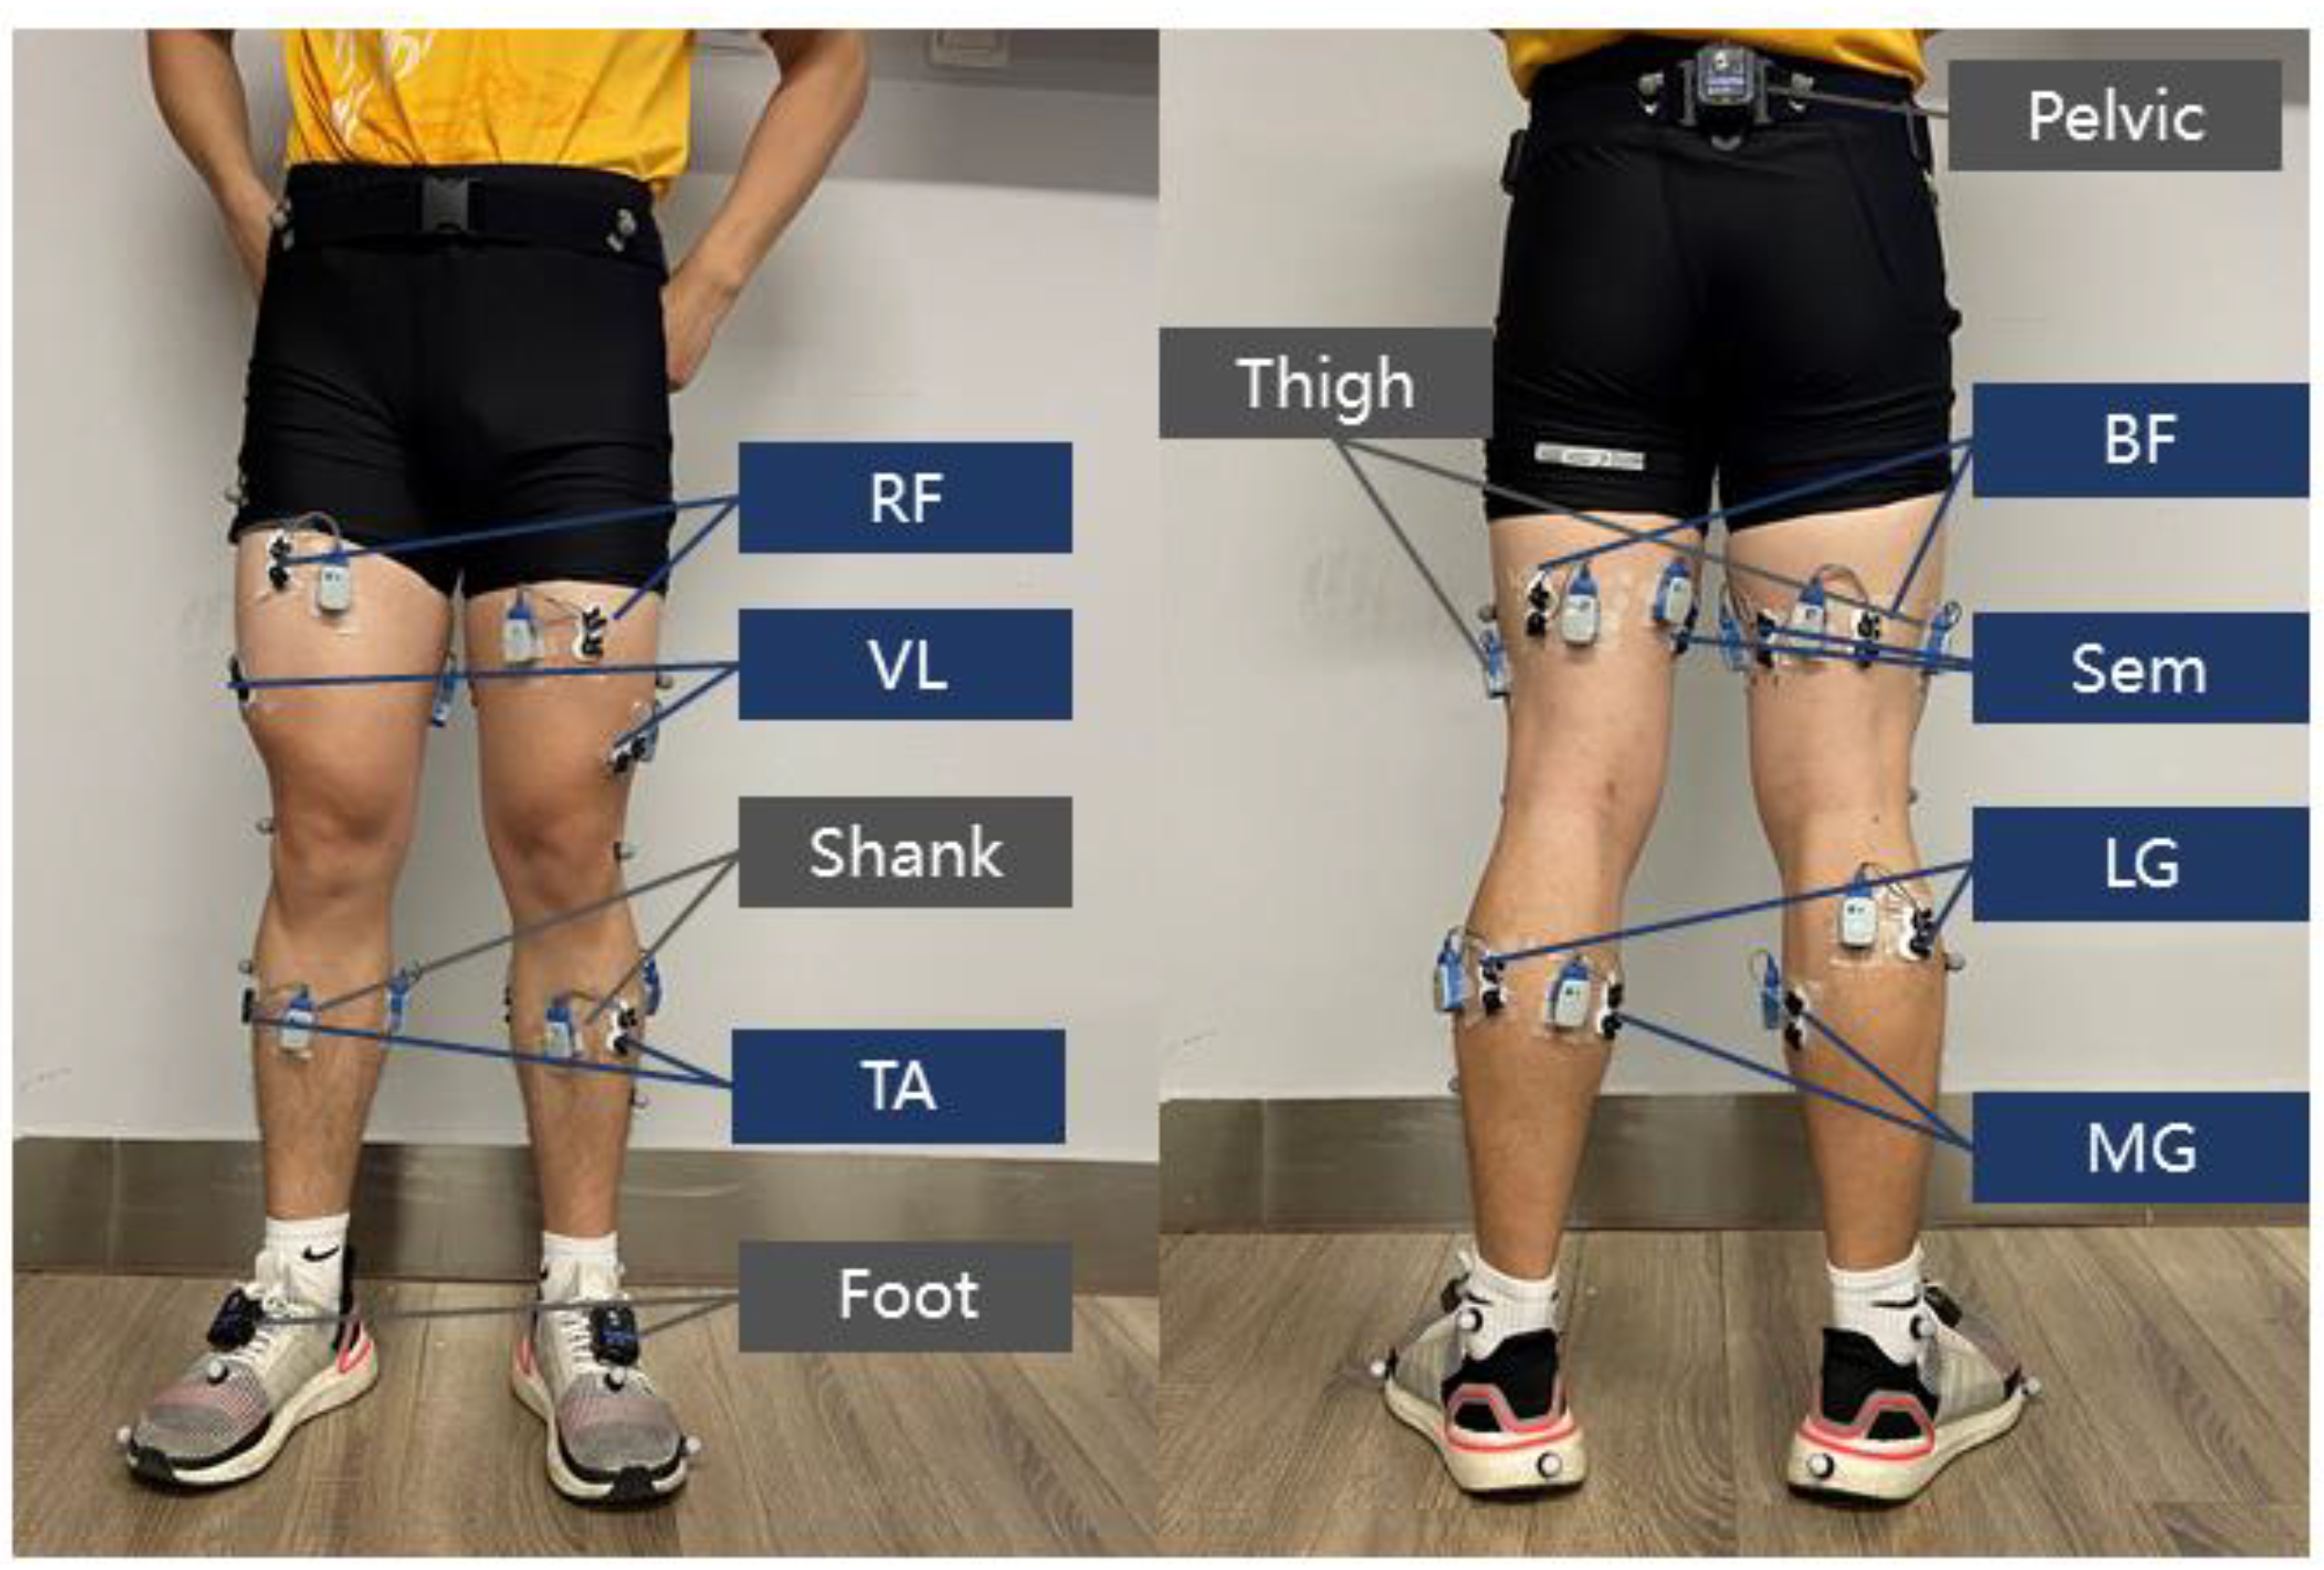
2.1. Experiment Setup
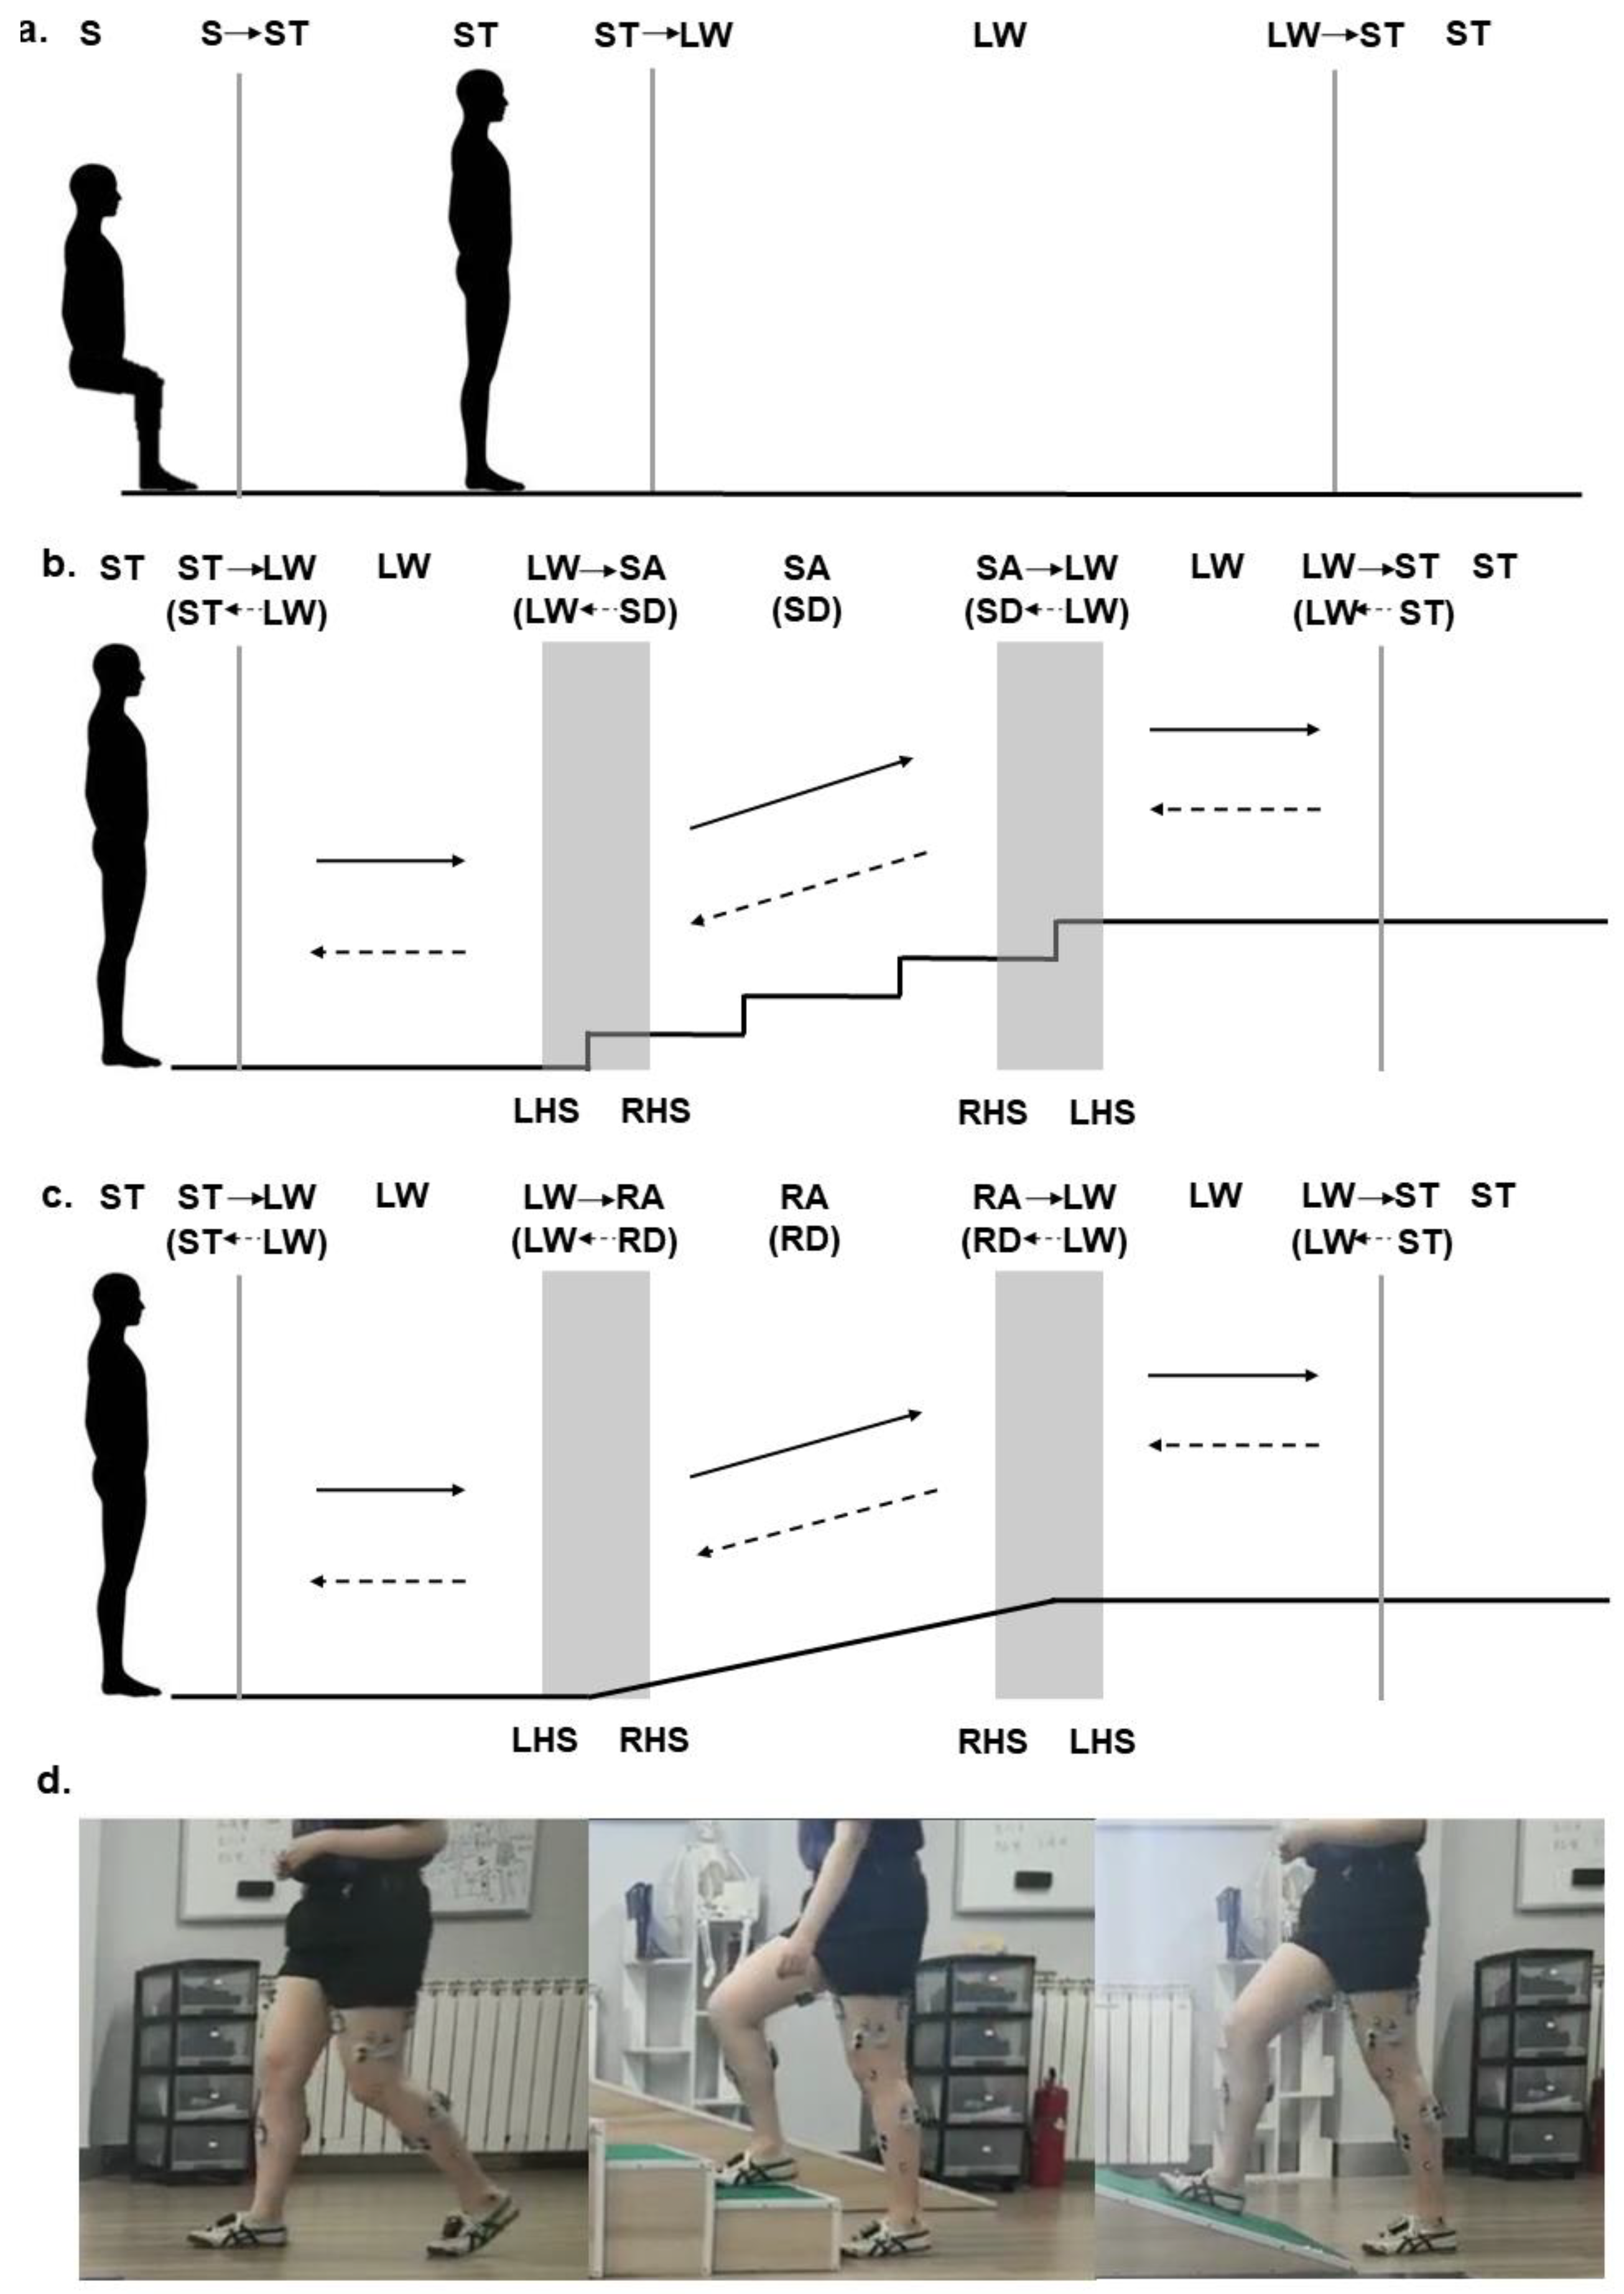
2.2. Experimental Protocol
2.3. Data Processing
2.4. Data Analysis
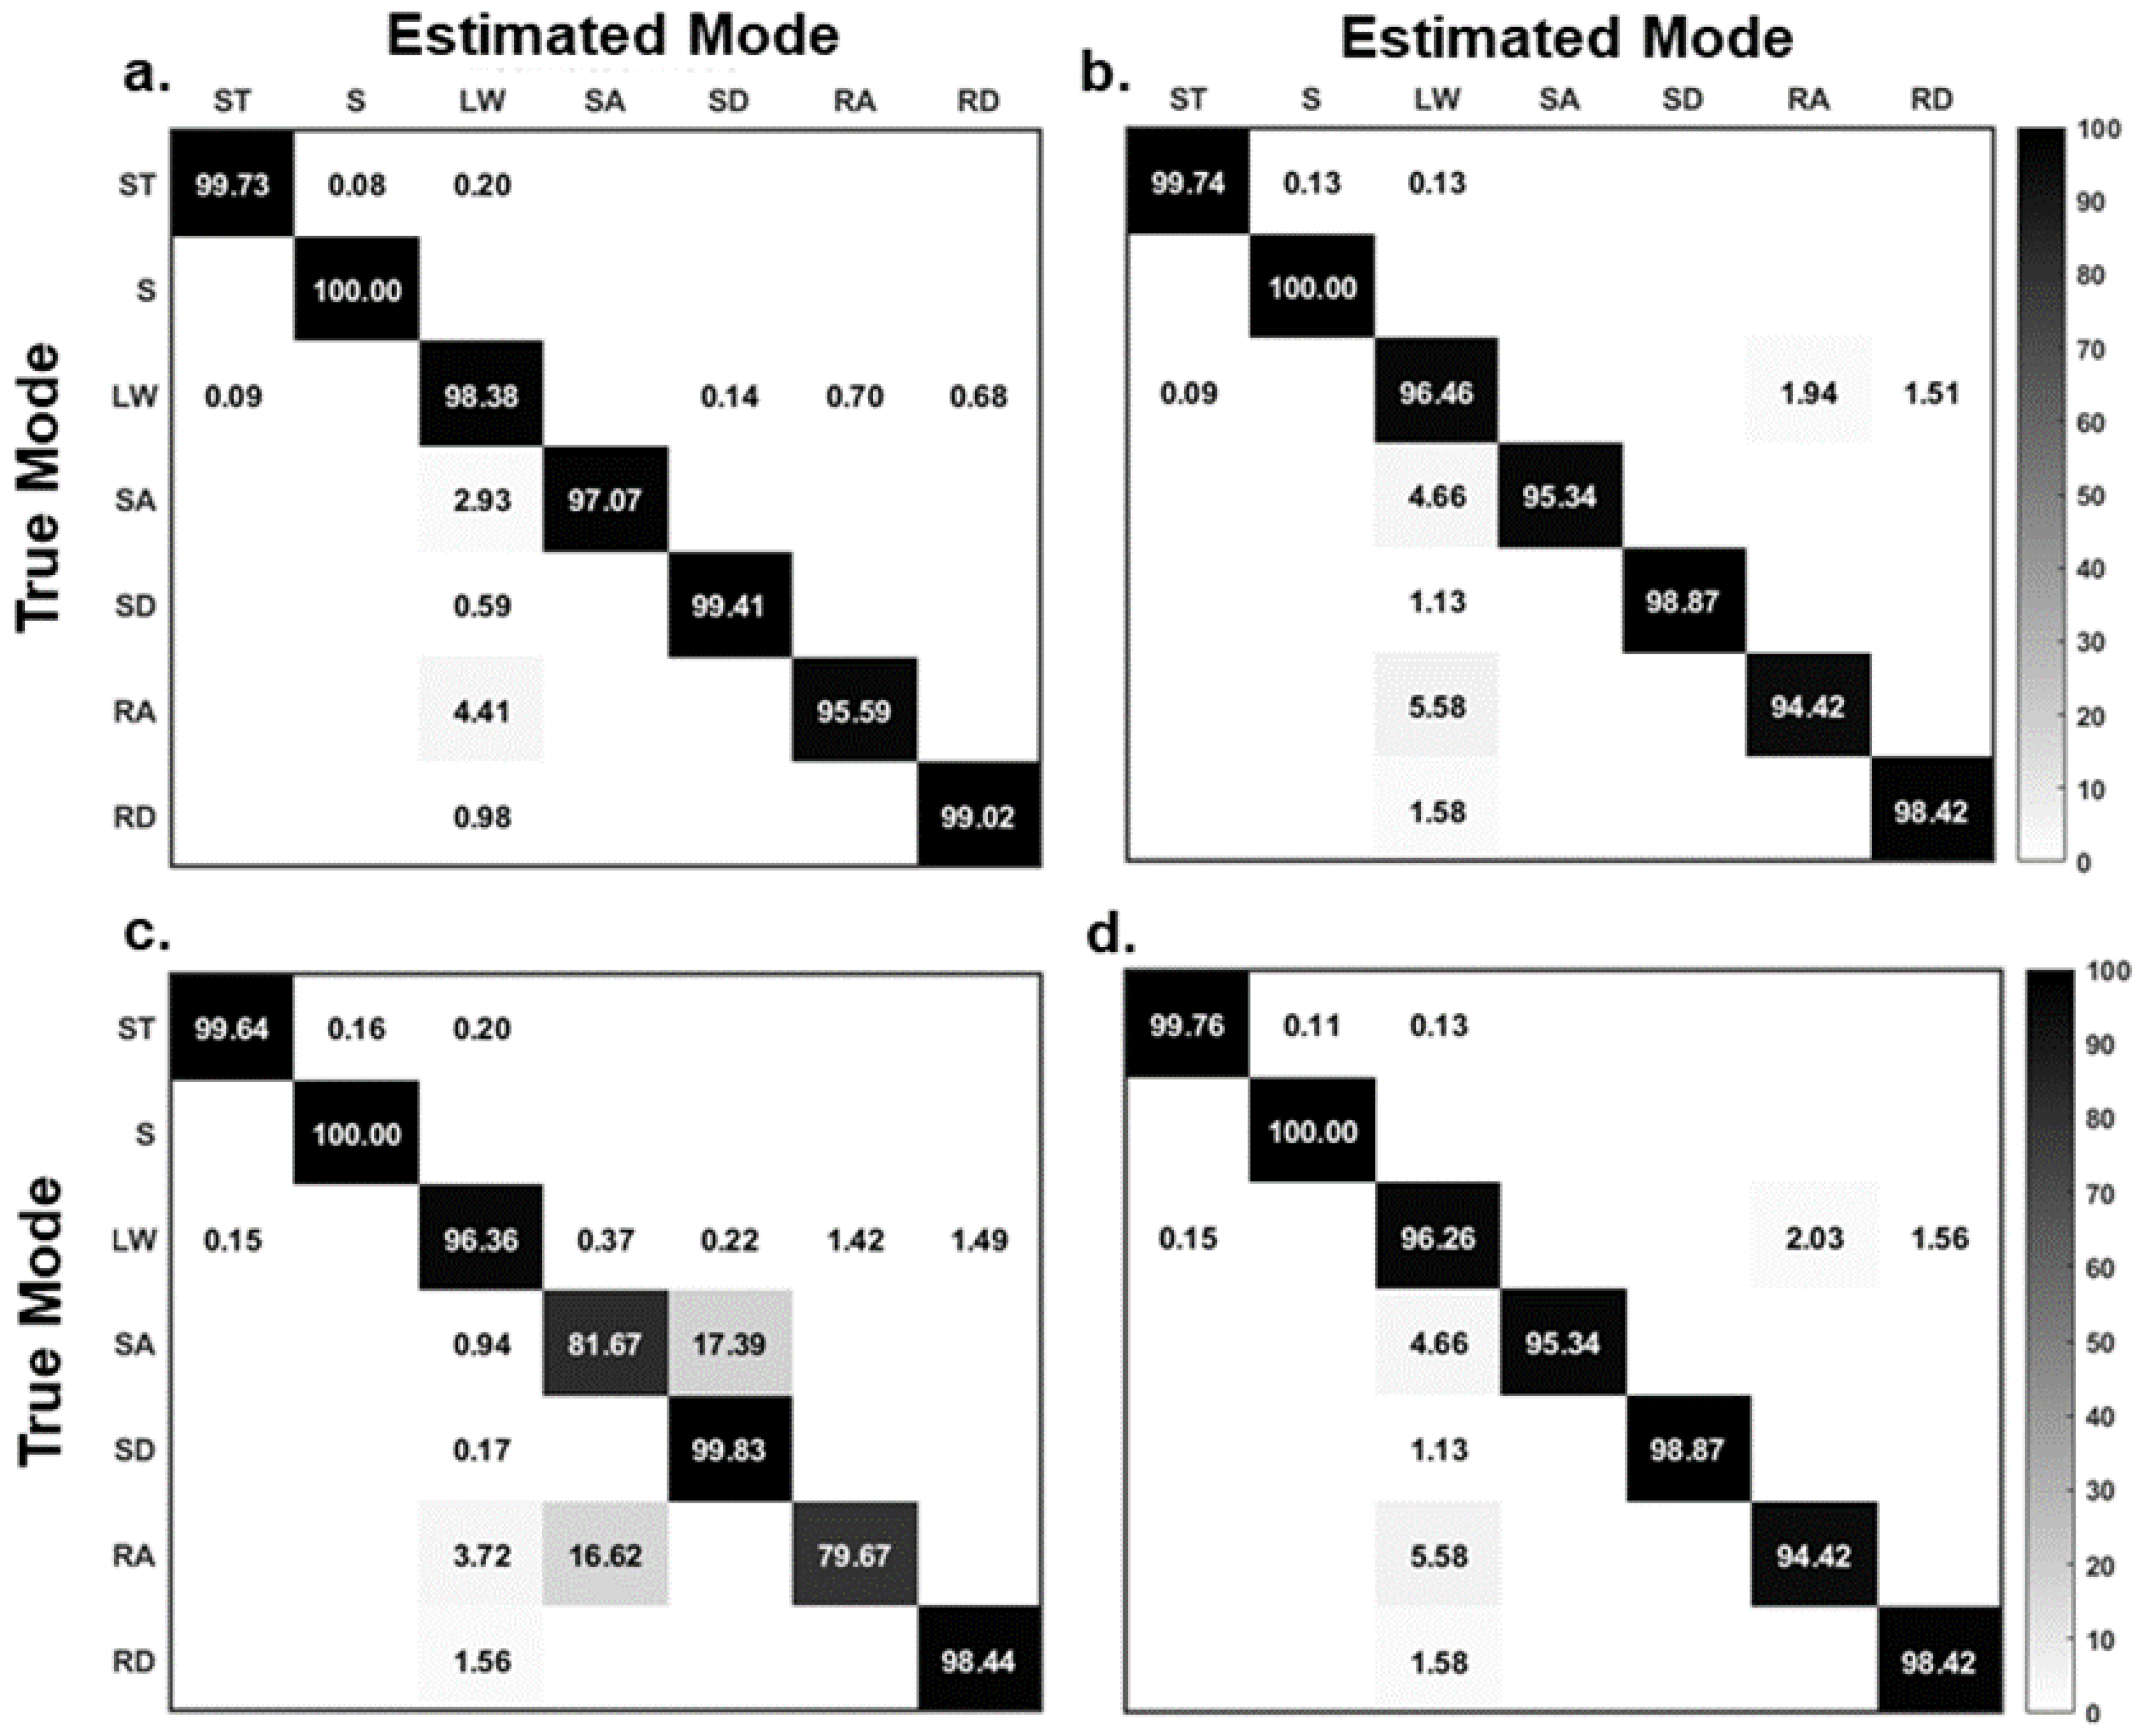
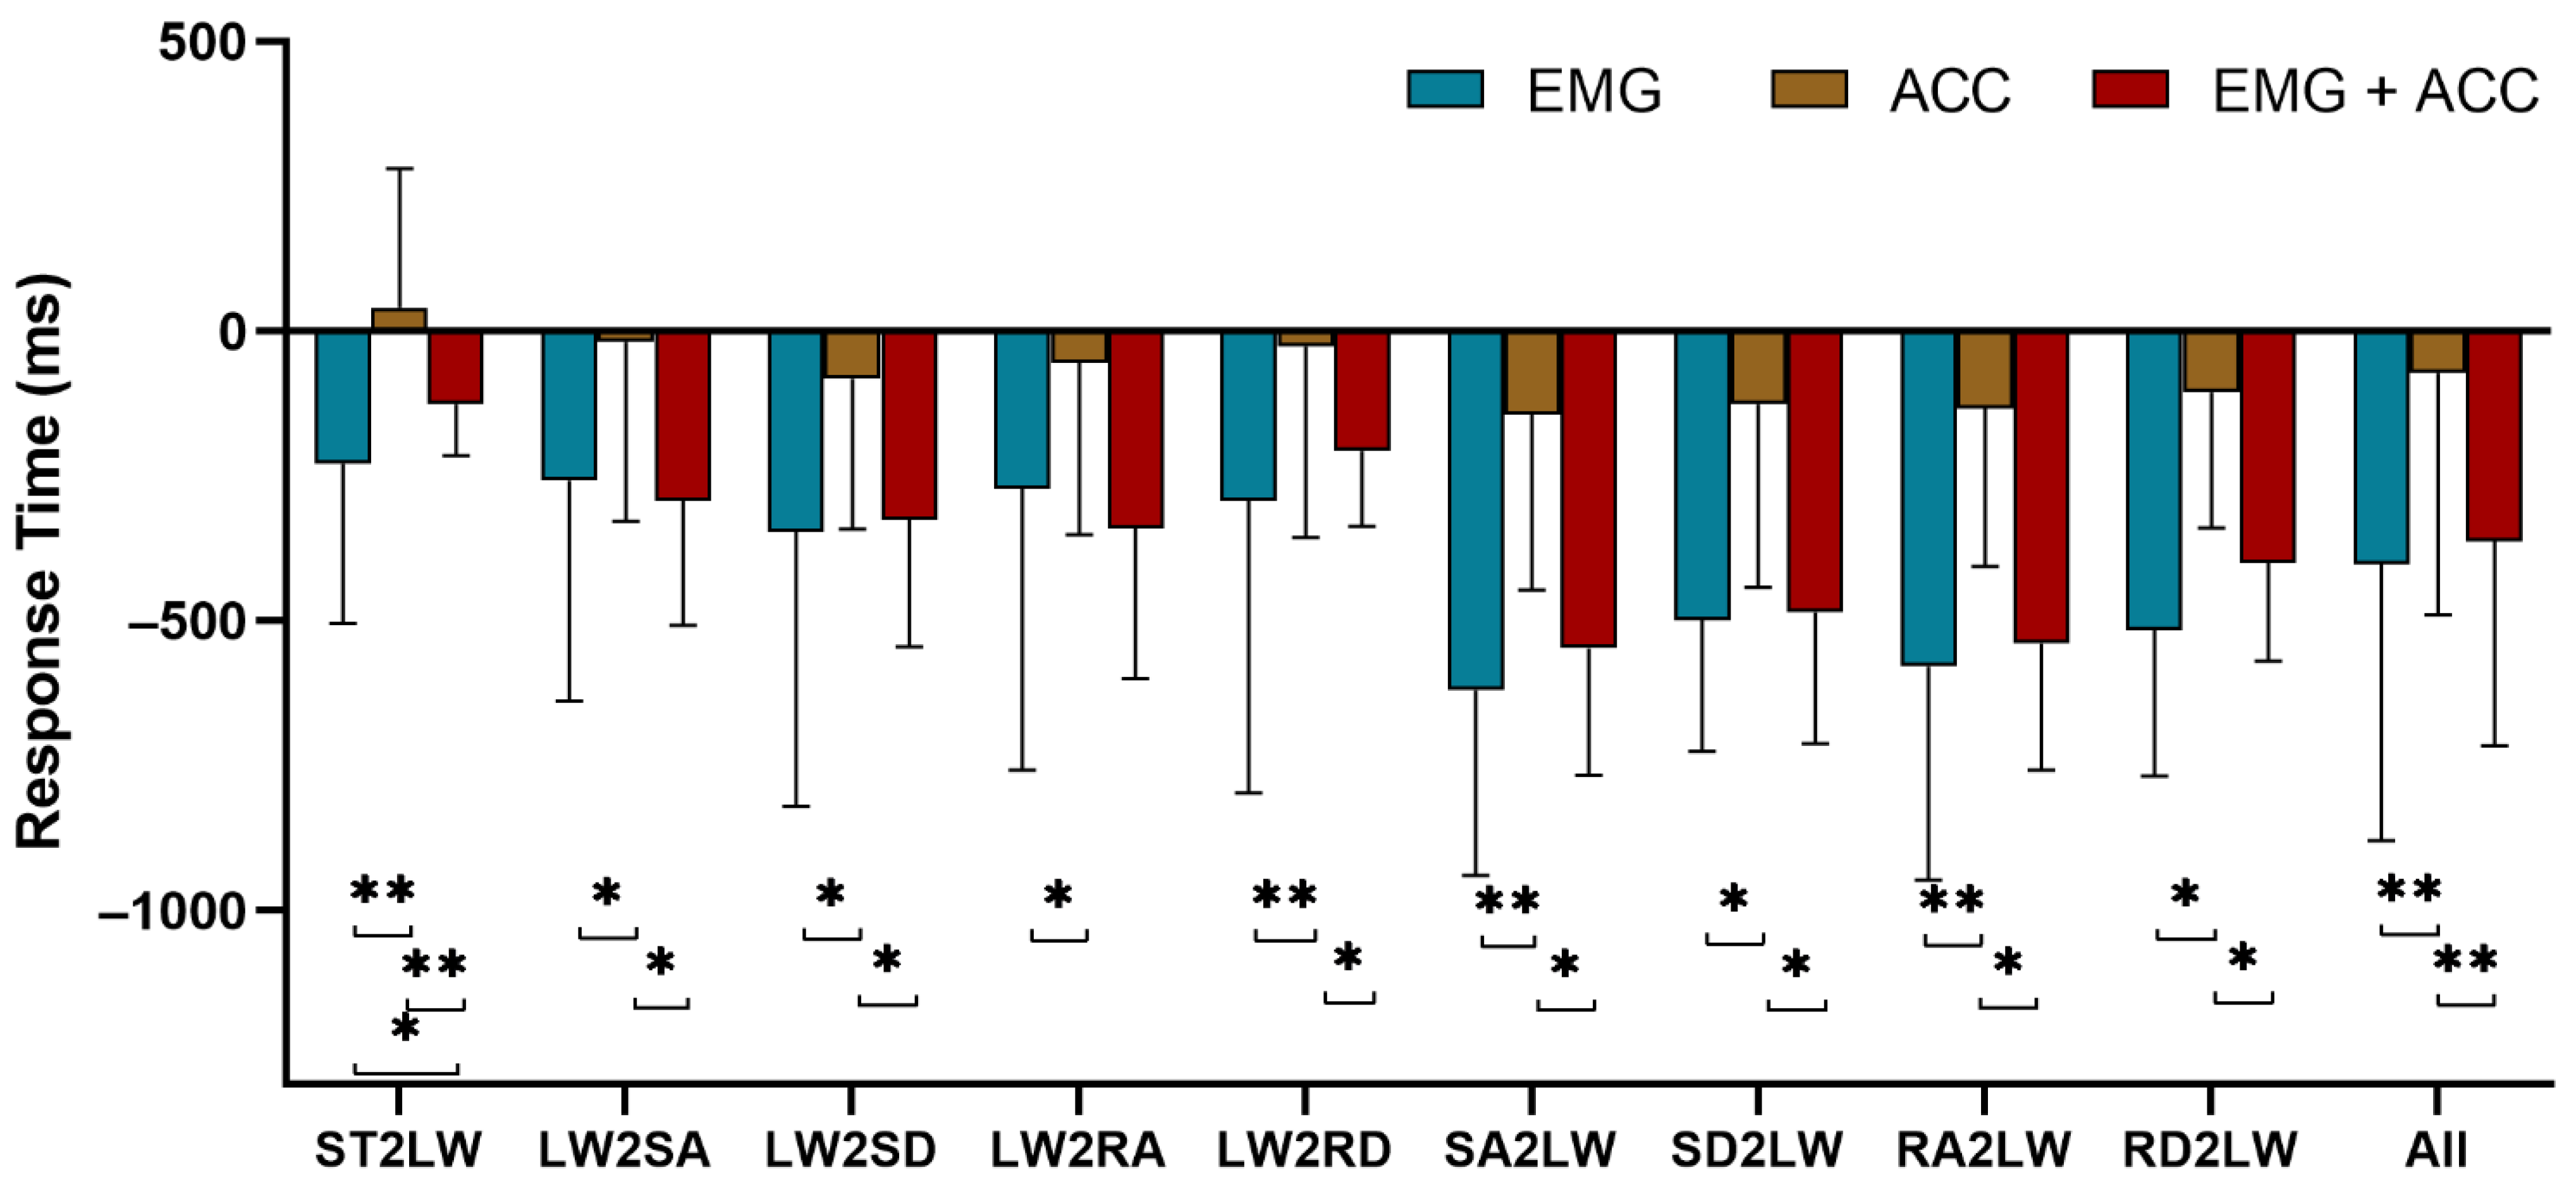
3. Results
4. Discussion
5. Conclusions
Author Contributions
Funding
Institutional Review Board Statement
Informed Consent Statement
Data Availability Statement
Acknowledgments
Conflicts of Interest
References
- Mayo, N.E.; Wood-Dauphinee, S.; Ahmed, S.; Gordon, C.; Higgins, J.; McEwen, S.; Salbach, N. Disablement following stroke. Disabil. Rehabil. 1999, 21, 258–268. [Google Scholar] [CrossRef]
- Dombovy, M.L.; A Sandok, B.; Basford, J.R. Rehabilitation for stroke: A review. Stroke 1986, 17, 363–369. [Google Scholar] [CrossRef] [Green Version]
- Jones, F.; Riazi, A. Self-efficacy and self-management after stroke: A systematic review. Disabil. Rehabil. 2010, 33, 797–810. [Google Scholar] [CrossRef]
- Li, H.; Derrode, S.; Pieczynski, W. An adaptive and on-line IMU-based locomotion activity classification method using a triplet Markov model. Neurocomputing 2019, 362, 94–105. [Google Scholar] [CrossRef]
- Martinez-Hernandez, U.; Dehghani-Sanij, A.A. Adaptive Bayesian inference system for recognition of walking activities and prediction of gait events using wearable sensors. Neural Netw. 2018, 102, 107–119. [Google Scholar] [CrossRef] [Green Version]
- San-Segundo, R.; Montero, J.M.; Barra-Chicote, R.; Fernández-Martínez, F.; Pardo, J.M. Feature extraction from smartphone inertial signals for human activity segmentation. Signal Process. 2016, 120, 359–372. [Google Scholar] [CrossRef]
- Ning, J.; Dosen, S.; Muller, K.R.; Farina, D. Myoelectric Control of Artificial Limbs—Is There a Need to Change Focus? IEEE Signal Process. Mag. 2012, 29, 152–150. [Google Scholar] [CrossRef]
- Xi, X.; Tang, M.; Miran, S.M.; Luo, Z. Evaluation of Feature Extraction and Recognition for Activity Monitoring and Fall Detection Based on Wearable sEMG Sensors. Sensors 2017, 17, 1229. [Google Scholar] [CrossRef] [PubMed]
- Zeng, Y.; Yang, J.; Peng, C.; Yin, Y. Evolving Gaussian Process Autoregression Based Learning of Human Motion Intent Using Improved Energy Kernel Method of EMG. IEEE Trans. Biomed. Eng. 2019, 66, 2556–2565. [Google Scholar] [CrossRef]
- Sorkhabadi, S.M.R.; Chinimilli, P.T.; Gaytan-Jenkins, D.; Zhang, W. Human locomotion activity and speed recognition using electromyography based features. In Proceedings of the 2019 Wearable Robotics Association Conference, Scottsdale, AZ, USA, 26–28 March 2019; pp. 80–85. [Google Scholar]
- Lin, C.-J.; Chuang, H.-C.; Hsu, C.-W.; Chen, C.-S. Pneumatic Artificial Muscle Actuated Robot for Lower Limb Rehabilitation Triggered by Electromyography Signals Using Discrete Wavelet Transformation and Support Vector Machines. Sens. Mater. 2017, 29, 1625–1636. [Google Scholar]
- Ceseracciu, E.; Reggiani, M.; Sawacha, Z.; Sartori, M.; Spolaor, F.; Cobelli, C.; Pagello, E. SVM classification of locomotion modes using surface electromyography for applications in rehabilitation robotics. In Proceedings of the 19th International Symposium in Robot and Human Interactive Communication, Viareggio, Italy, 13–15 September 2010; pp. 165–170. [Google Scholar]
- Huang, H.; Kuiken, T.A.; Lipschutz, R.D. A strategy for identifying locomotion modes using surface electromyography. IEEE Trans. Biomed. Eng. 2009, 56, 65–73. [Google Scholar] [CrossRef] [Green Version]
- Peng, F.; Zhang, C.; Xu, B.; Li, J.; Wang, Z.; Su, H. Locomotion Prediction for Lower Limb Prostheses in Complex Environments via sEMG and Inertial Sensors. Complexity 2020, 2020, 8810663. [Google Scholar] [CrossRef]
- Hu, F.; Wang, H.; Feng, N.; Zhou, B.; Wei, C.; Lu, Y.; Qi, Y.; Jia, X.; Tang, H.; Gouda, M.A. A novel fusion strategy for locomotion activity recognition based on multimodal signals. Biomed. Signal Process. Control 2021, 67, 102524. [Google Scholar] [CrossRef]
- Su, B.-Y.; Wang, J.; Liu, S.-Q.; Sheng, M.; Jiang, J.; Xiang, K. A CNN-Based Method for Intent Recognition Using Inertial Measurement Units and Intelligent Lower Limb Prosthesis. IEEE Trans. Neural Syst. Rehabil. Eng. 2019, 27, 1032–1042. [Google Scholar] [CrossRef] [PubMed]
- Zeni, J.; Richards, J.; Higginson, J. Two simple methods for determining gait events during treadmill and overground walking using kinematic data. Gait Posture 2008, 27, 710–714. [Google Scholar] [CrossRef] [Green Version]
- Challis, R.E.; Kitney, R.I. Biomedical signal processing (in four parts). Med. Biol. Comput. 1991, 29, 1–17. [Google Scholar] [CrossRef] [PubMed]
- Fang, C.; He, B.; Wang, Y.; Cao, J.; Gao, S. EMG-Centered Multisensory Based Technologies for Pattern Recognition in Rehabilitation: State of the Art and Challenges. Biosensors 2020, 10, 85. [Google Scholar] [CrossRef] [PubMed]
- Gao, S.; Wang, Y.; Fang, C.; Xu, L. A Smart Terrain Identification Technique Based on Electromyography, Ground Reaction Force, and Machine Learning for Lower Limb Rehabilitation. Appl. Sci. 2020, 10, 2638. [Google Scholar] [CrossRef] [Green Version]
- Ai, Q.; Zhang, Y.; Qi, W.; Liu, Q.; Chen, A.K. Research on Lower Limb Motion Recognition Based on Fusion of sEMG and Accelerometer Signals. Symmetry 2017, 9, 147. [Google Scholar] [CrossRef]
- Spanias, J.A.; Simon, A.M.; Finucane, S.B.; Perreault, E.; Hargrove, L.J. Online adaptive neural control of a robotic lower limb prosthesis. J. Neural Eng. 2017, 15, 016015. [Google Scholar] [CrossRef]
- Young, A.J.; Simon, A.M.; Fey, N.P.; Hargrove, L.J. Classifying the Intent of Novel Users during Human Locomotion using Powered Lower Limb Prostheses. In Proceedings of the 2013 6th International Ieee/Embs Conference on Neural Engineering (Ner), San Diego, CA, USA, 6–8 November 2013; pp. 311–314. [Google Scholar]
- Spanias, J.A.; Simon, A.M.; Ingraham, K.A.; Hargrove, L.J. Effect of Additional Mechanical Sensor Data on an EMG-based Pattern Recognition System for a Powered Leg Prosthesis. In Proceedings of the 2015 7th International Ieee/Embs Conference on Neural Engineering (Ner), Montpellier, France, 22–24 April 2015; pp. 639–642. [Google Scholar]
- Joshi, D.; Hahn, M.E. Terrain and Direction Classification of Locomotion Transitions Using Neuromuscular and Mechanical Input. Ann. Biomed. Eng. 2015, 44, 1275–1284. [Google Scholar] [CrossRef]
- Zhao, Y.; Wang, J.; Zhang, Y.; Liu, H. Flexible and Wearable EMG and PSD Sensors Enabled Locomotion Mode Recognition for IoHT Based In-home Rehabilitation. IEEE Sens. J. 2021. [Google Scholar]
- Hu, B.; Rouse, E.; Hargrove, L. Fusion of Bilateral Lower-Limb Neuromechanical Signals Improves Prediction of Locomotor Activities. Front. Robot. AI 2018, 5, 78. [Google Scholar] [CrossRef] [PubMed]
- Li, H.-T.; Han, S.-L.; Pan, M.-C. Lower-limb motion classification for hemiparetic patients through IMU and EMG signal processing. In Proceedings of the 2016 International Conference on Biomedical Engineering (BME-HUST), Hanoi, Vietnam, 4–6 October 2016; pp. 113–118. [Google Scholar]
- Zhou, B.; Wang, H.; Hu, F.; Feng, N.; Xi, H.; Zhang, Z.; Tang, H. Accurate recognition of lower limb ambulation mode based on surface electromyography and motion data using machine learning. Comput. Methods Programs Biomed. 2020, 193, 105486. [Google Scholar] [CrossRef]
- Xia, P.; Hu, J.; Peng, Y. EMG-Based Estimation of Limb Movement Using Deep Learning With Recurrent Convolutional Neural Networks. Artif. Organs 2017, 42, E67–E77. [Google Scholar] [CrossRef]
- Afzal, T.; White, G.; Wright, A.B.; Iqbal, K. Locomotion Mode Identification for Lower Limbs using Neuromuscular and Joint Kinematic Signals. In Proceedings of the 2014 36th Annual International Conference of the Ieee Engineering in Medicine and Biology Society, Chicago, IL, USA, 27–31 August 2014; pp. 4071–4074. [Google Scholar]
- Liu, M.; Zhang, F.; Huang, H. An Adaptive Classification Strategy for Reliable Locomotion Mode Recognition. Sensors 2017, 17, 2020. [Google Scholar] [CrossRef] [Green Version]
- Du, L.; Zhang, F.; Liu, M.; Huang, H. Toward design of an environment-aware adaptive locomotion-mode-recognition system. IEEE Trans. Biomed. Eng. 2012, 59, 2716–2725. [Google Scholar] [PubMed]
- Fan, Z.; He, H. Source selection for real-time user intent recognition toward volitional control of artificial legs. IEEE J. Biomed. Health Inform. 2013, 17, 907–914. [Google Scholar]
- Tkach, D.C.; Hargrove, L.J. Neuromechanical sensor fusion yields highest accuracies in predicting ambulation mode transitions for trans-tibial amputees. In Proceedings of the 2013 35th Annual International Conference of the IEEE Engineering in Medicine and Biology Society (EMBC), Osaka, Japan, 3–7 July 2013; pp. 3074–3077. [Google Scholar]


| Classifiers | Classifier Parameter Settings |
|---|---|
| SVM | The Radial Basis Function (RBF) kernel method and C-SVM were used to build a ‘one-to-one’ multiclassification model; the optimal penalty factor c and kernel function parameter g were obtained using a five-fold cross-validation. |
| KNN | The K value was obtained using a five-fold cross-validation. |
| LDA | The Gauss kernel function was used as the kernel function. |
| ANN | A two-layer network was constructed with 30 hidden nodes and a selected learning rate of 0.01 and optimized with a gradient descent algorithm. |
| Current Mode | ||||||||
|---|---|---|---|---|---|---|---|---|
| ST | S | LW | SA | SD | RA | RD | ||
| Previous Mode | ST | 1 | 0 | 1 | 0 | 0 | 0 | 0 |
| S | 1 | 1 | 0 | 0 | 0 | 0 | 0 | |
| LW | 1 | 0 | 1 | 1 | 1 | 1 | 1 | |
| SA | 0 | 0 | 1 | 1 | 0 | 0 | 0 | |
| SD | 0 | 0 | 1 | 0 | 1 | 0 | 0 | |
| RA | 0 | 0 | 1 | 0 | 0 | 1 | 0 | |
| RD | 0 | 0 | 1 | 0 | 0 | 0 | 1 | |
| SVM | KNN | LDA | ANN | p-Value | |
|---|---|---|---|---|---|
| CA (%) | 98.78 ± 1.04 | 97.84 ± 1.24 | 96.43 ± 1.57 | 97.74 ± 1.04 | 0.0097 |
| SE (%) | 98.46 ± 0.87 | 97.61 ± 1.16 | 93.66 ± 1.43 | 97.58 ± 1.09 | 0.0963 |
| SP (%) | 99.76 ± 0.04 | 99.62 ± 0.09 | 99.43 ± 0.21 | 99.60 ± 0.17 | 0.2691 |
| PA (%) | 97.69 ± 0.85 | 95.91 ± 1.27 | 93.99 ± 1.44 | 96.49 ± 0.96 | 0.0023 |
| RT (ms) | −372.63 ± 352.91 | −232.64 ± 325.60 | −213.37 ± 319.81 | −218.97 ± 318.13 | 0.0046 |
Publisher’s Note: MDPI stays neutral with regard to jurisdictional claims in published maps and institutional affiliations. |
© 2021 by the authors. Licensee MDPI, Basel, Switzerland. This article is an open access article distributed under the terms and conditions of the Creative Commons Attribution (CC BY) license (https://creativecommons.org/licenses/by/4.0/).
Share and Cite
Meng, L.; Pang, J.; Wang, Z.; Xu, R.; Ming, D. The Role of Surface Electromyography in Data Fusion with Inertial Sensors to Enhance Locomotion Recognition and Prediction. Sensors 2021, 21, 6291. https://doi.org/10.3390/s21186291
Meng L, Pang J, Wang Z, Xu R, Ming D. The Role of Surface Electromyography in Data Fusion with Inertial Sensors to Enhance Locomotion Recognition and Prediction. Sensors. 2021; 21(18):6291. https://doi.org/10.3390/s21186291
Chicago/Turabian StyleMeng, Lin, Jun Pang, Ziyao Wang, Rui Xu, and Dong Ming. 2021. "The Role of Surface Electromyography in Data Fusion with Inertial Sensors to Enhance Locomotion Recognition and Prediction" Sensors 21, no. 18: 6291. https://doi.org/10.3390/s21186291
APA StyleMeng, L., Pang, J., Wang, Z., Xu, R., & Ming, D. (2021). The Role of Surface Electromyography in Data Fusion with Inertial Sensors to Enhance Locomotion Recognition and Prediction. Sensors, 21(18), 6291. https://doi.org/10.3390/s21186291