Abstract
Measuring the diffuse attenuation coefficient () allows for monitoring the water body’s environmental status. This parameter is of particular interest in water quality monitoring programs because it quantifies the presence of light and the euphotic zone’s depth. Citizen scientists can meaningfully contribute by monitoring water quality, complementing traditional methods by reducing monitoring costs and significantly improving data coverage, empowering and supporting decision-making. However, the quality of the acquisition of in situ underwater irradiance measurements has some limitations, especially in areas where stratification phenomena occur in the first meters of depth. This vertical layering introduces a gradient of properties in the vertical direction, affecting the associated . To detect and characterize these variations of in the water column, it needs a system of optical sensors, ideally placed in a range of a few cm, improving the low vertical accuracy. Despite that, the problem of self-shading on the instrumentation becomes critical. Here, we introduce a new concept that aims to improve the vertical accuracy of the irradiance measurements: the underwater annular irradiance (). This new concept consists of measuring the irradiance in an annular-shaped distribution. We first compute the optimal annular angle that avoids self-shading and maximizes the light captured by the sensors. Second, we use different scenarios of water types, solar zenith angle, and cloud coverage to assess the robustness of the corresponding diffuse attenuation coefficient, . Finally, we derive empirical functions for computing from . This new concept opens the possibility to a new generation of optical sensors in an annular-shaped distribution which is expected to (a) increase the vertical resolution of the irradiance measurements and (b) be easy to deploy and maintain and thus to be more suitable for citizen scientists.
1. Introduction
The studies of light propagation and light field characteristics are crucial for understanding many physical and biological processes in the water bodies, driven by, or depending on, solar radiation [], such as phytoplankton dynamics and surface bloom [] or eutrophication []. This radiation at the sea surface is conventionally measured as spectrally resolved downward planar irradiance, , and the attenuation of this quantity with depth can be described by the diffuse attenuation coefficient []. This parameter is of particular interest in water quality monitoring programs because it represents a suitable proxy of water transparency [] and it is related to light penetration and availability in aquatic systems [,]. Monitoring water transparency provides an indicator of the environmental status of the water body by providing information about phytoplankton concentrations or levels of dissolved organic and inorganic compounds. This is especially relevant in coastal areas and lakes that are strongly affected by human activities and rivers, winds, and waves.
Satellite-based ocean color sensors have been used to map optical properties of the ocean such as on local and global scales. Approximately of the diffuse reflected light from a water body comes from a surface layer of water within a depth of 1/ []. Therefore, is an important parameter for remote sensing reflectance of ocean colour satellite. With an increase in the remote sensing data availability over the past decade, there has been a rise in the in situ data available for calibration and validation of the satellite measurements []. However, the current satellite measurements for monitoring coastal and inland waters are still evolving and remain challenging because of the spatial scales that satellite measurements represent [,]. To improve data coverage in these zones, in situ irradiance measurements are still required. Furthermore, growing worldwide requires exploring cost-effective data acquisition to generate knowledge for sustainable natural resource management.
This need to develop novel approaches for monitoring environmental data is reflected in the recent growing attention toward citizen science []. Citizen science is an expanding practice in which scientists and citizens actively collaborate to produce new knowledge for science and society []. Volunteers participate in a wide range of projects to monitor aquatic ecosystems. For example, a project called Urbamar collects observational data on marine species in the Barcelona coastal area and creates a participative guide made with and by the people. Another project called Surfing for Science [] assesses microplastic pollution in shoreline waters; the citizens participate in the project by collecting scientific samples while paddle surfing. Other citizen science projects involve monitoring environmental variables like water transparency and participants use optical instrumentation to do that. The Secchi Disk is a classical citizen science instrument used to measure the transparency of ocean and lake waters [,]. However, the quality of Secchi depth data varies from person to person as a function of vision, producing low-precision measurements. In addition, unlike electronic devices, this instrument lacks quality control of data and cannot set adjustment parameters. In recent years, electronic devices have appeared to monitoring water quality [,]. An example is the low-cost and DIY (Do-It-Yourself) moored system KdUINO, which allows measuring the diffuse attenuation coefficient parameter (), related to water transparency []. The participation of citizen scientists in water quality monitoring can complement traditional monitoring methods and has other potential advantages such as lowering monitoring costs, significantly increasing data coverage, increasing social capital, enhancing support for decision-making, and enhancing the potential for knowledge co-creation [].
There are some practical issues in acquiring in situ irradiance measurements, especially in areas where is not homogeneous. For example, in stratified water columns, the thin layers of phytoplankton can change across environmental gradients [,]. To detect and characterize these variations of [] requires a system of optical sensors, ideally placed in a range of a few cm, improving the low vertical accuracy. However, there are inherent issues in the acquisition of in situ irradiance measurements mainly introduced by the influence of the instrumentation on in-water light fields: self-shading caused by the upwelling irradiance meter itself [,,,,] and self-shading caused by a buoyed instrument [,]. Instrument self-shading can lead to an increase in the measurements’ uncertainty from a few percent to several tens of percent depending on the wavelength, the instrument radius, and the illumination conditions []. Moreover, there is an issue with instrument making. In the case of an instrument with multiple light sensors at different depths, these sensors must be attached to a structure that could also add a shadowing artifact to the integrated radiance value. This implies a limitation in the vertical distance of the sensors and thus a limitation of the accuracy of the measurements of , especially in strongly stratified waters.
Here, we propose a new approach to integrate radiance: annular irradiance (see Figure 1). Therefore, instead of integrating the light arriving at the full upper semi-sphere, we propose integrating only the light that arrives at a specific ring of the light sphere. The choice of the annular angle in which the ring of sensors is set will determine the quantity of light arriving at the sensor and the shadow affecting the measurements. This new approach aims to (i) simplify the instrumentation design: instruments may be designed with a “tubular” shape. This makes them much easier to assemble, deploy, manipulate, and maintain. This simplicity makes -based instruments ideal candidates to be used in citizen science-based water quality monitoring. (ii) Avoid self-shading: Sensors at a particular depth do not interfere with the rest of the sensors at different depths (this happens with based instruments). With this mechanism, the device works as a moored system, covering the spatial and temporal resolution of the water column. (iii) Provide very high vertical resolution measurements: As there are no potential self-shading effects, installing a large number of sensor units at different depths could be possible. This could be potentially useful for those observations that require concurrent high vertical resolution measurements.

Figure 1.
(a) Integrated radiances in the case of downward irradiance . (b) Integrated radiances in the case of annular irradiance .
The remainder of this paper is structured as follows. Section 2 presents the methods, numerical tools, and data sets used to develop and assess the radiance integration numerically in annular bands as annular irradiance () and its derived diffuse attenuation coefficient (). Section 3 presents the results corresponding to the performance analysis of the and in terms of (i) the optimal integration annular angle and (ii) comparison and assessment of concerning the standard values of . Section 4 provides a brief discussion on the results, by analyzing critical scenarios and finding possibles practical limitations and closes with the conclusions and outlooks.
2. Materials and Methods
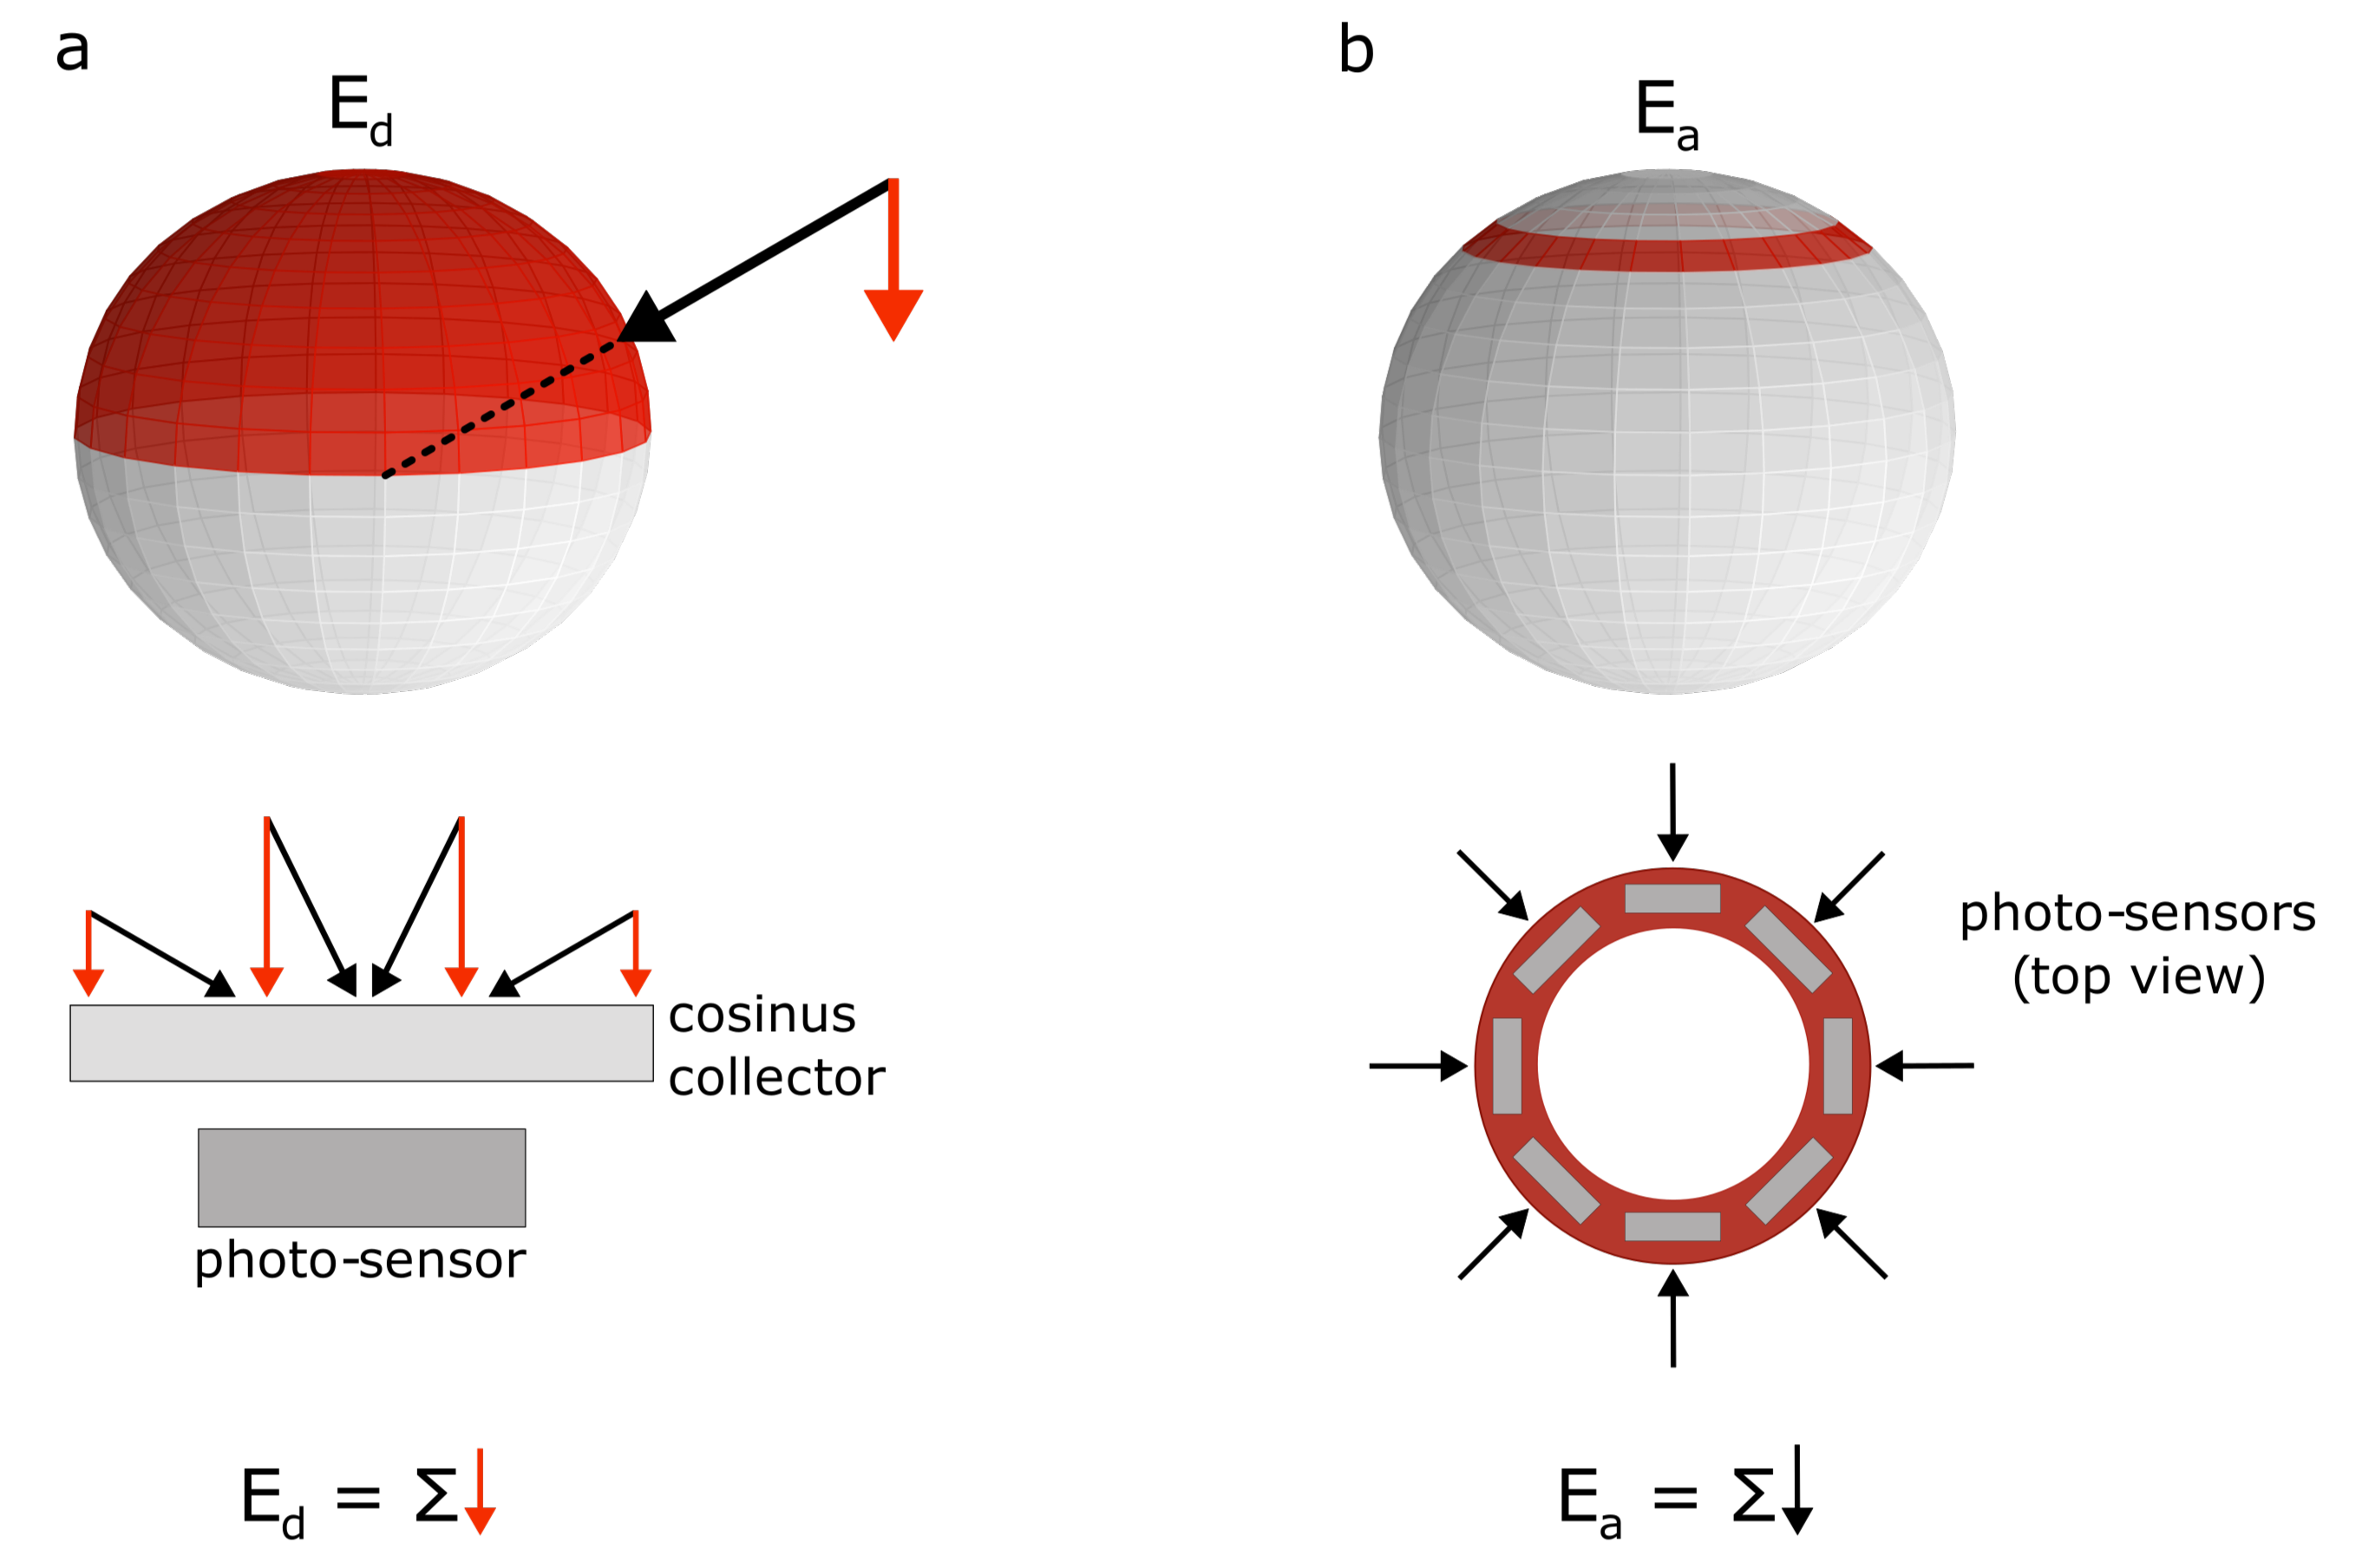
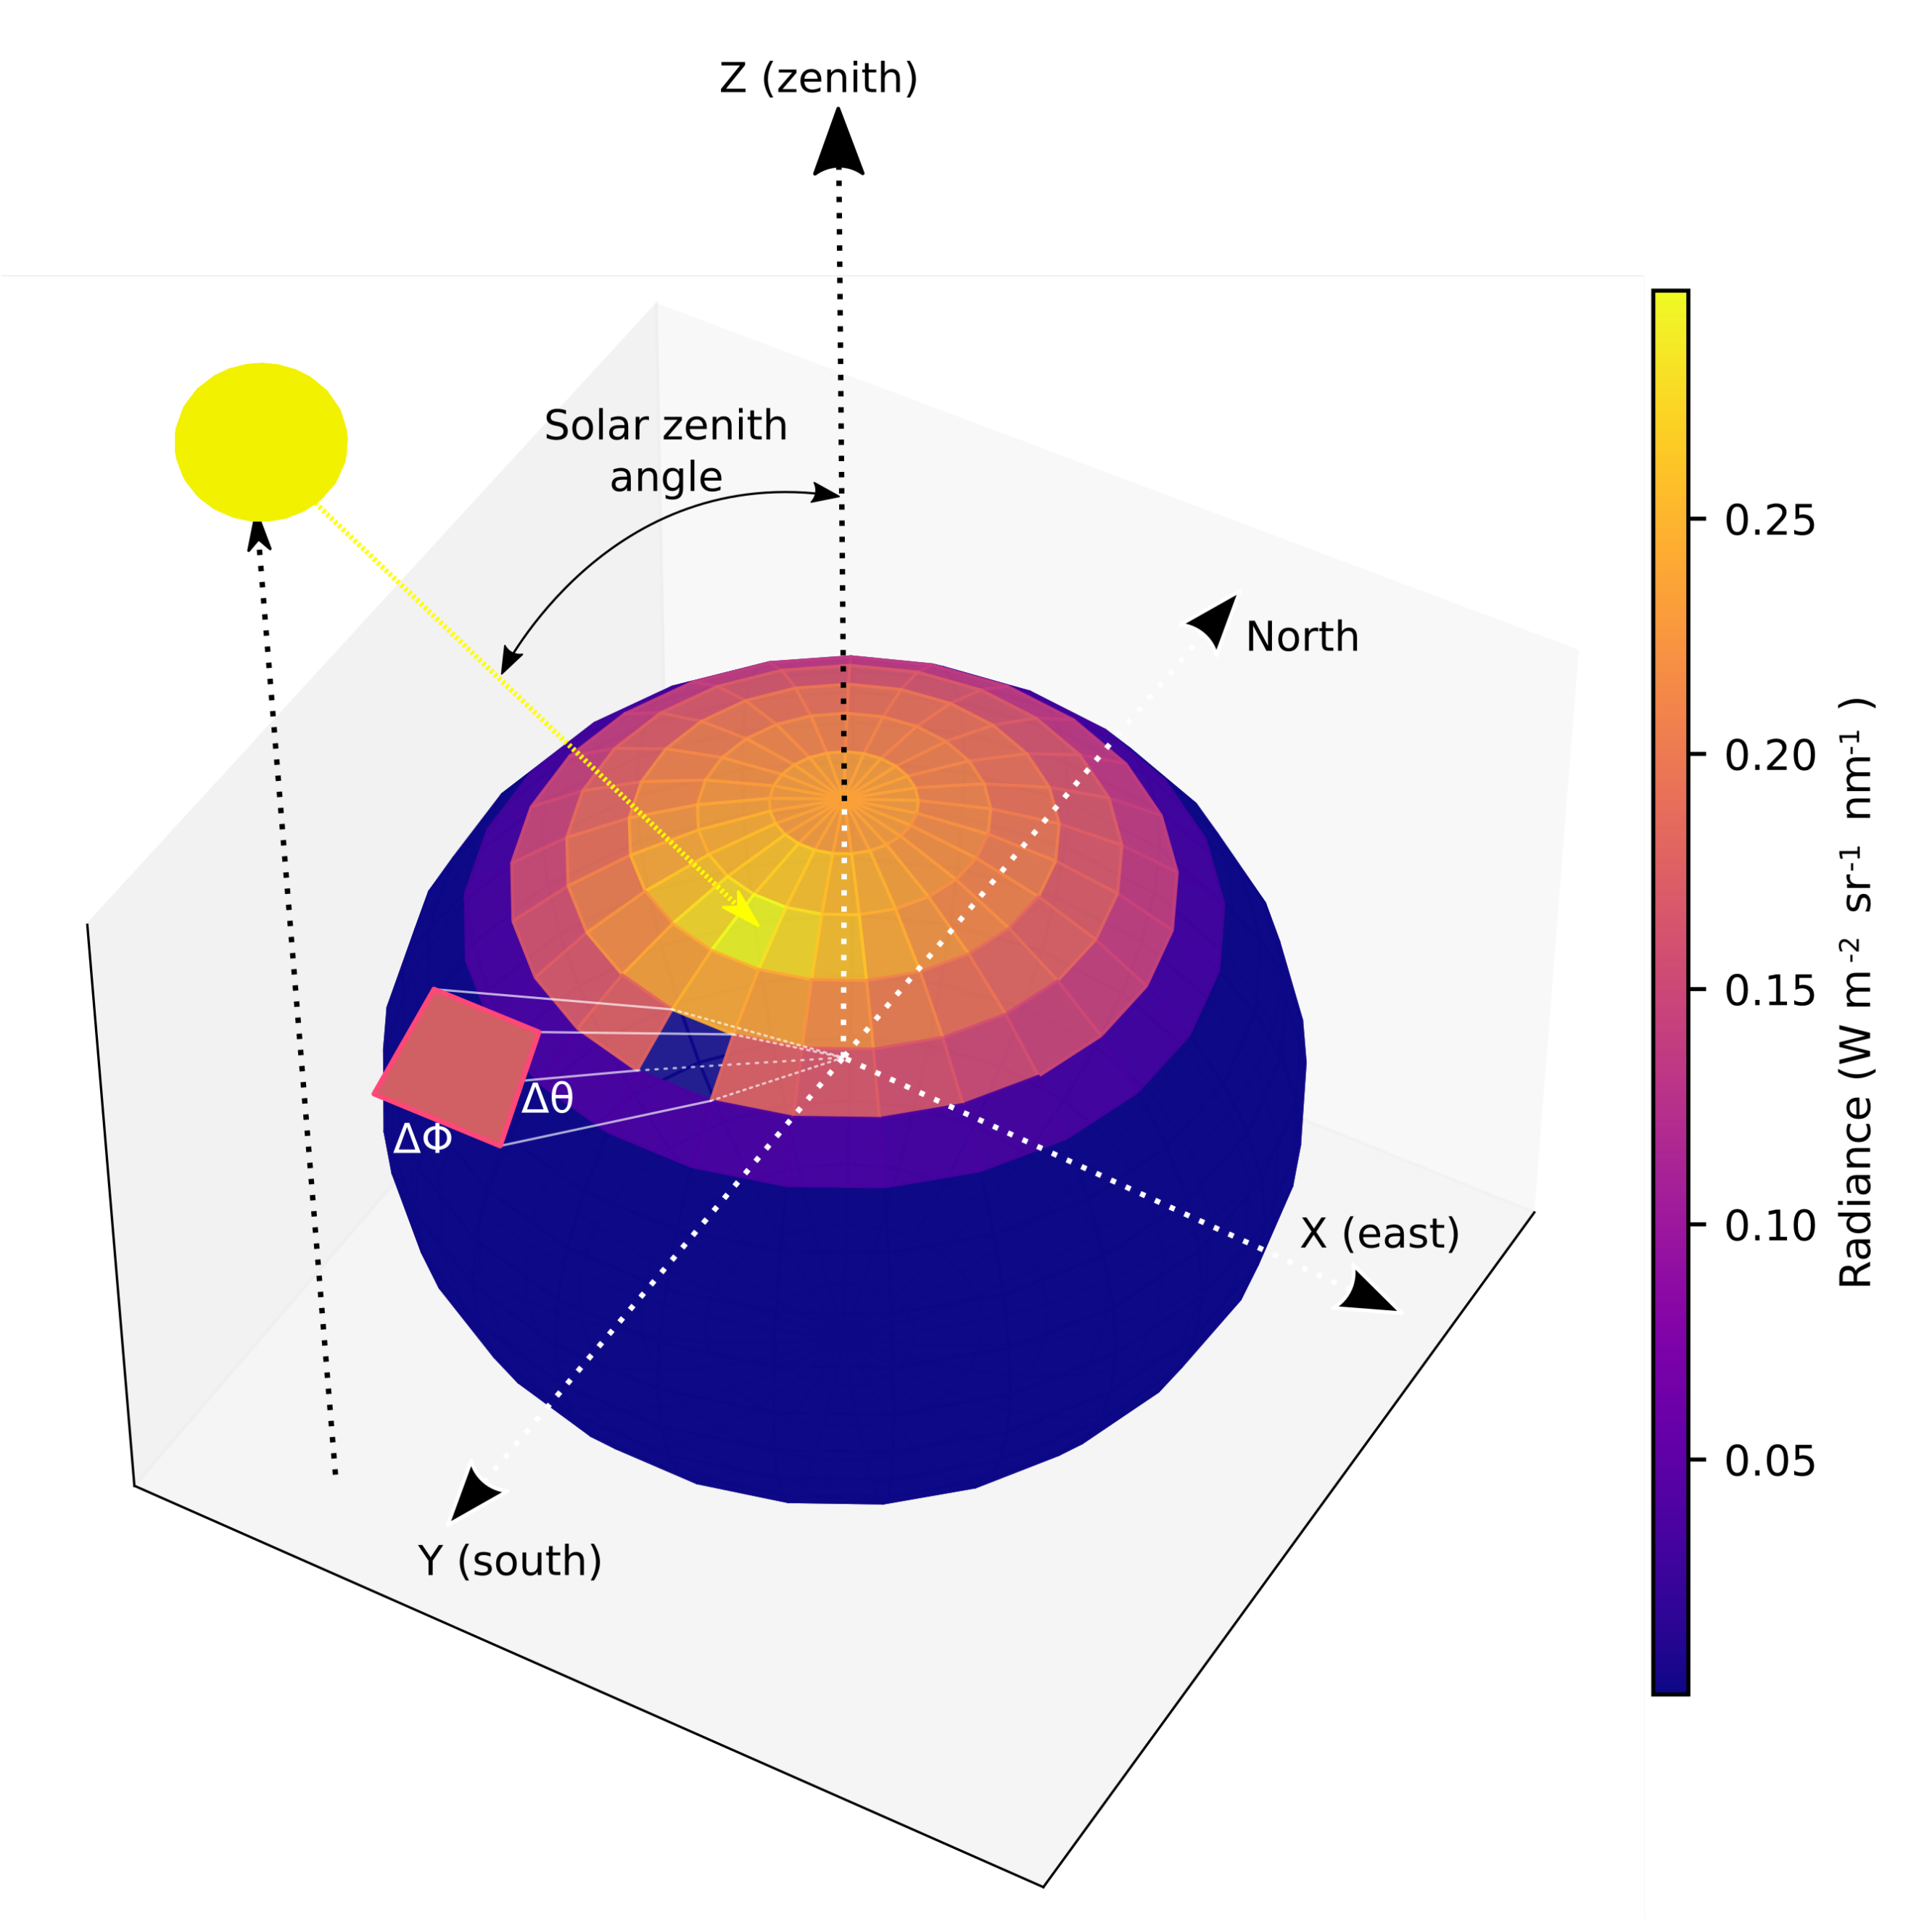
2.1. Theoretical Basis
The fundamental measure of light energy in an aquatic system is the spectral radiance L, which in horizontally homogeneous water bodies is a function of time, depth, direction, and wavelength [] that can be described by the following formula:
with being the amount of radiant energy incident in a time interval centered on time t, onto a surface of area located at position (), and arriving through a set of directions contained in a solid angle on the direction () normal to the area , as produced by photons in a wavelength interval centered on wavelength []. The units of radiance are W m nm sr. One of the most commonly measured radiometric quantities is irradiance. The irradiance E, or flux density of radiant energy, is the integrated radiance on a unit area and is usually expressed as W m. The spectral downward plane irradiance is related to the spectral radiance, which measures photons traveling in all downward directions, but with each photon’s contribution weighted by the cosine of the photon’s incident angle [].
In typical conditions, radiances and irradiances decrease approximately exponentially with depth. The downwelling diffuse attenuation coefficient , in m, explains the concept of light extinction with depth of spectral downwelling plane irradiance [].
To know the vertical variation of , needs to be measured within an infinitesimal range of depths. To overcome this obstacle, a common and useful practise is to calculate the diffuse attenuation coefficient between the irradiances measured over distant depths:
with and being different depths far apart to ensure reliable measurements of change. In addition, when there are vertical profiles of , is usually derived by linear regression analysis between and z [], obtained as the negative of the slope of this linear regression. In this case, we assume that is a constant value through the depth range, and it is valued simply as . We will use during the rest of this study.
2.2. Computational Fundamentals: HydoLight as a Numerical Tool
We use HydroLight (version 5.2) to define and assess the performance of the . HydroLight is an example of a radiative transfer numerical model which computes radiance distributions and derived quantities given water column inherent optical properties and other oceanographic environmental conditions []. The HydroLight code employs mathematically sophisticated invariant embedding techniques to solve the radiative transfer equation and offers the possibility of performing numerical simulations in controlled environments. HydroLight performs a discretization of the two directions of working ( and , see Figure 2) with quad averaged radiances from a sphere. Therefore, this discretization allows the computation of the standard by the integration of the radiances of all the solid angles over the downward hemisphere, but also it allows to select of some specific quads and to integrate the corresponding radiances to derive a radiance over a configurable-by-the-user solid angle.

Figure 2.
Radiance as a function of polar and azimuthal viewing directions, at 0.2 m depth and at wavelength 500 nm. Solar zenith angle is 30 degrees.
We will provide our results over the PAR (Photosynthetically Active Radiation), which is calculated by summing the contribution to the radiance of each of the bands which lie in the PAR range, that is, 400–700 nm. PAR is by definition a broadband quantity, expressed in mol quanta s m.
In this case, PAR is calculated from irradiance. To convert in W m in each band to mol quanta s m, the per-band contributions are simply added up with unit conversion factors by with h the Plank constant, c the speed of light in vacuum, and also Avagadro’s constant.
2.3. Definition and Computation of Annular Irradiance and
We define the annular irradiance as the contribution of a selected band (by integrating all from to ) to irradiance onto a perpendicular sensor to the direction. We use HydroLight to integrate the annular irradiance by summing over the correct quads radiances and multiplying by the solid angles of them. In this case, the planar irradiance, which is the sum of radiance multiplied by solid angle and the , will be the annular irradiance multiplied by a constant number.
We compute annular irradiance by using the following formula:
where is the radiance corresponding to the quad and factor is the solid angle of the quad. HydroLight provides a discretization of the angle in bins of from to , and two additional bins corresponding to the equator () and to the polar cap (). Then,
The bins of are spacing at for all quads, so each bin has the same value:
2.4. Data Sets Description
We use HydroLight to generate a total of 3024 different scenarios. We generate this wide variety of situations by changing:
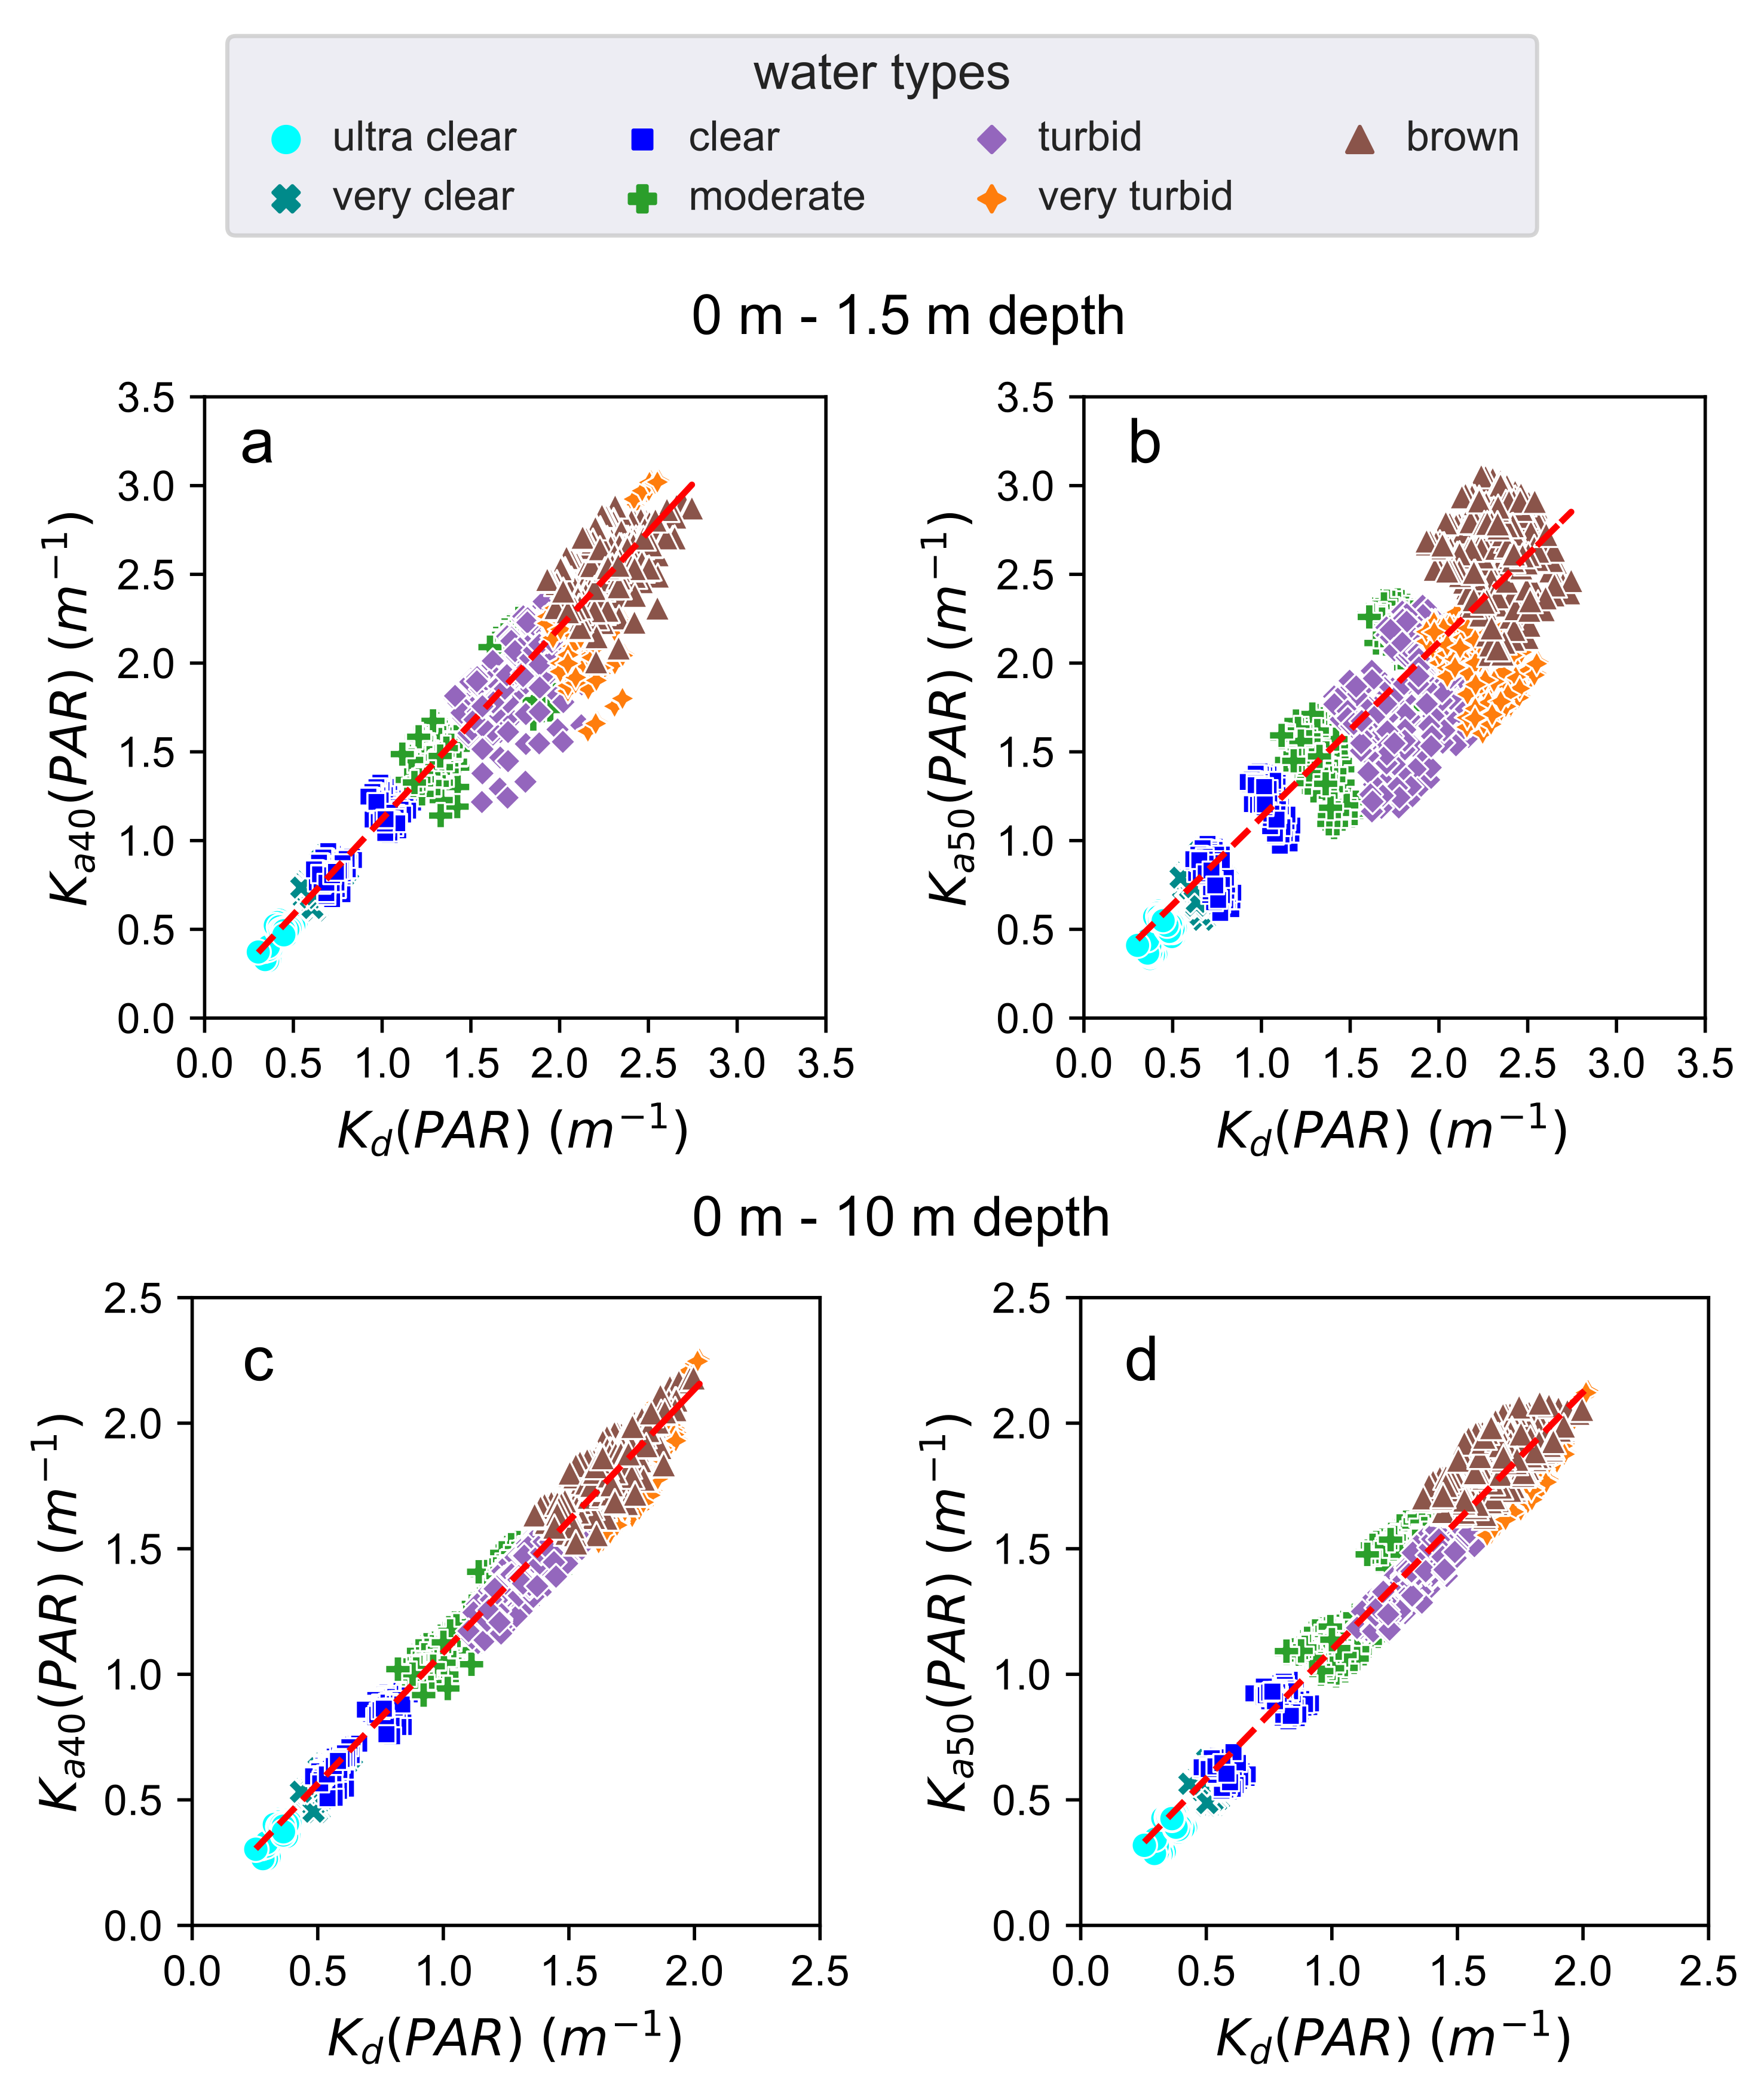
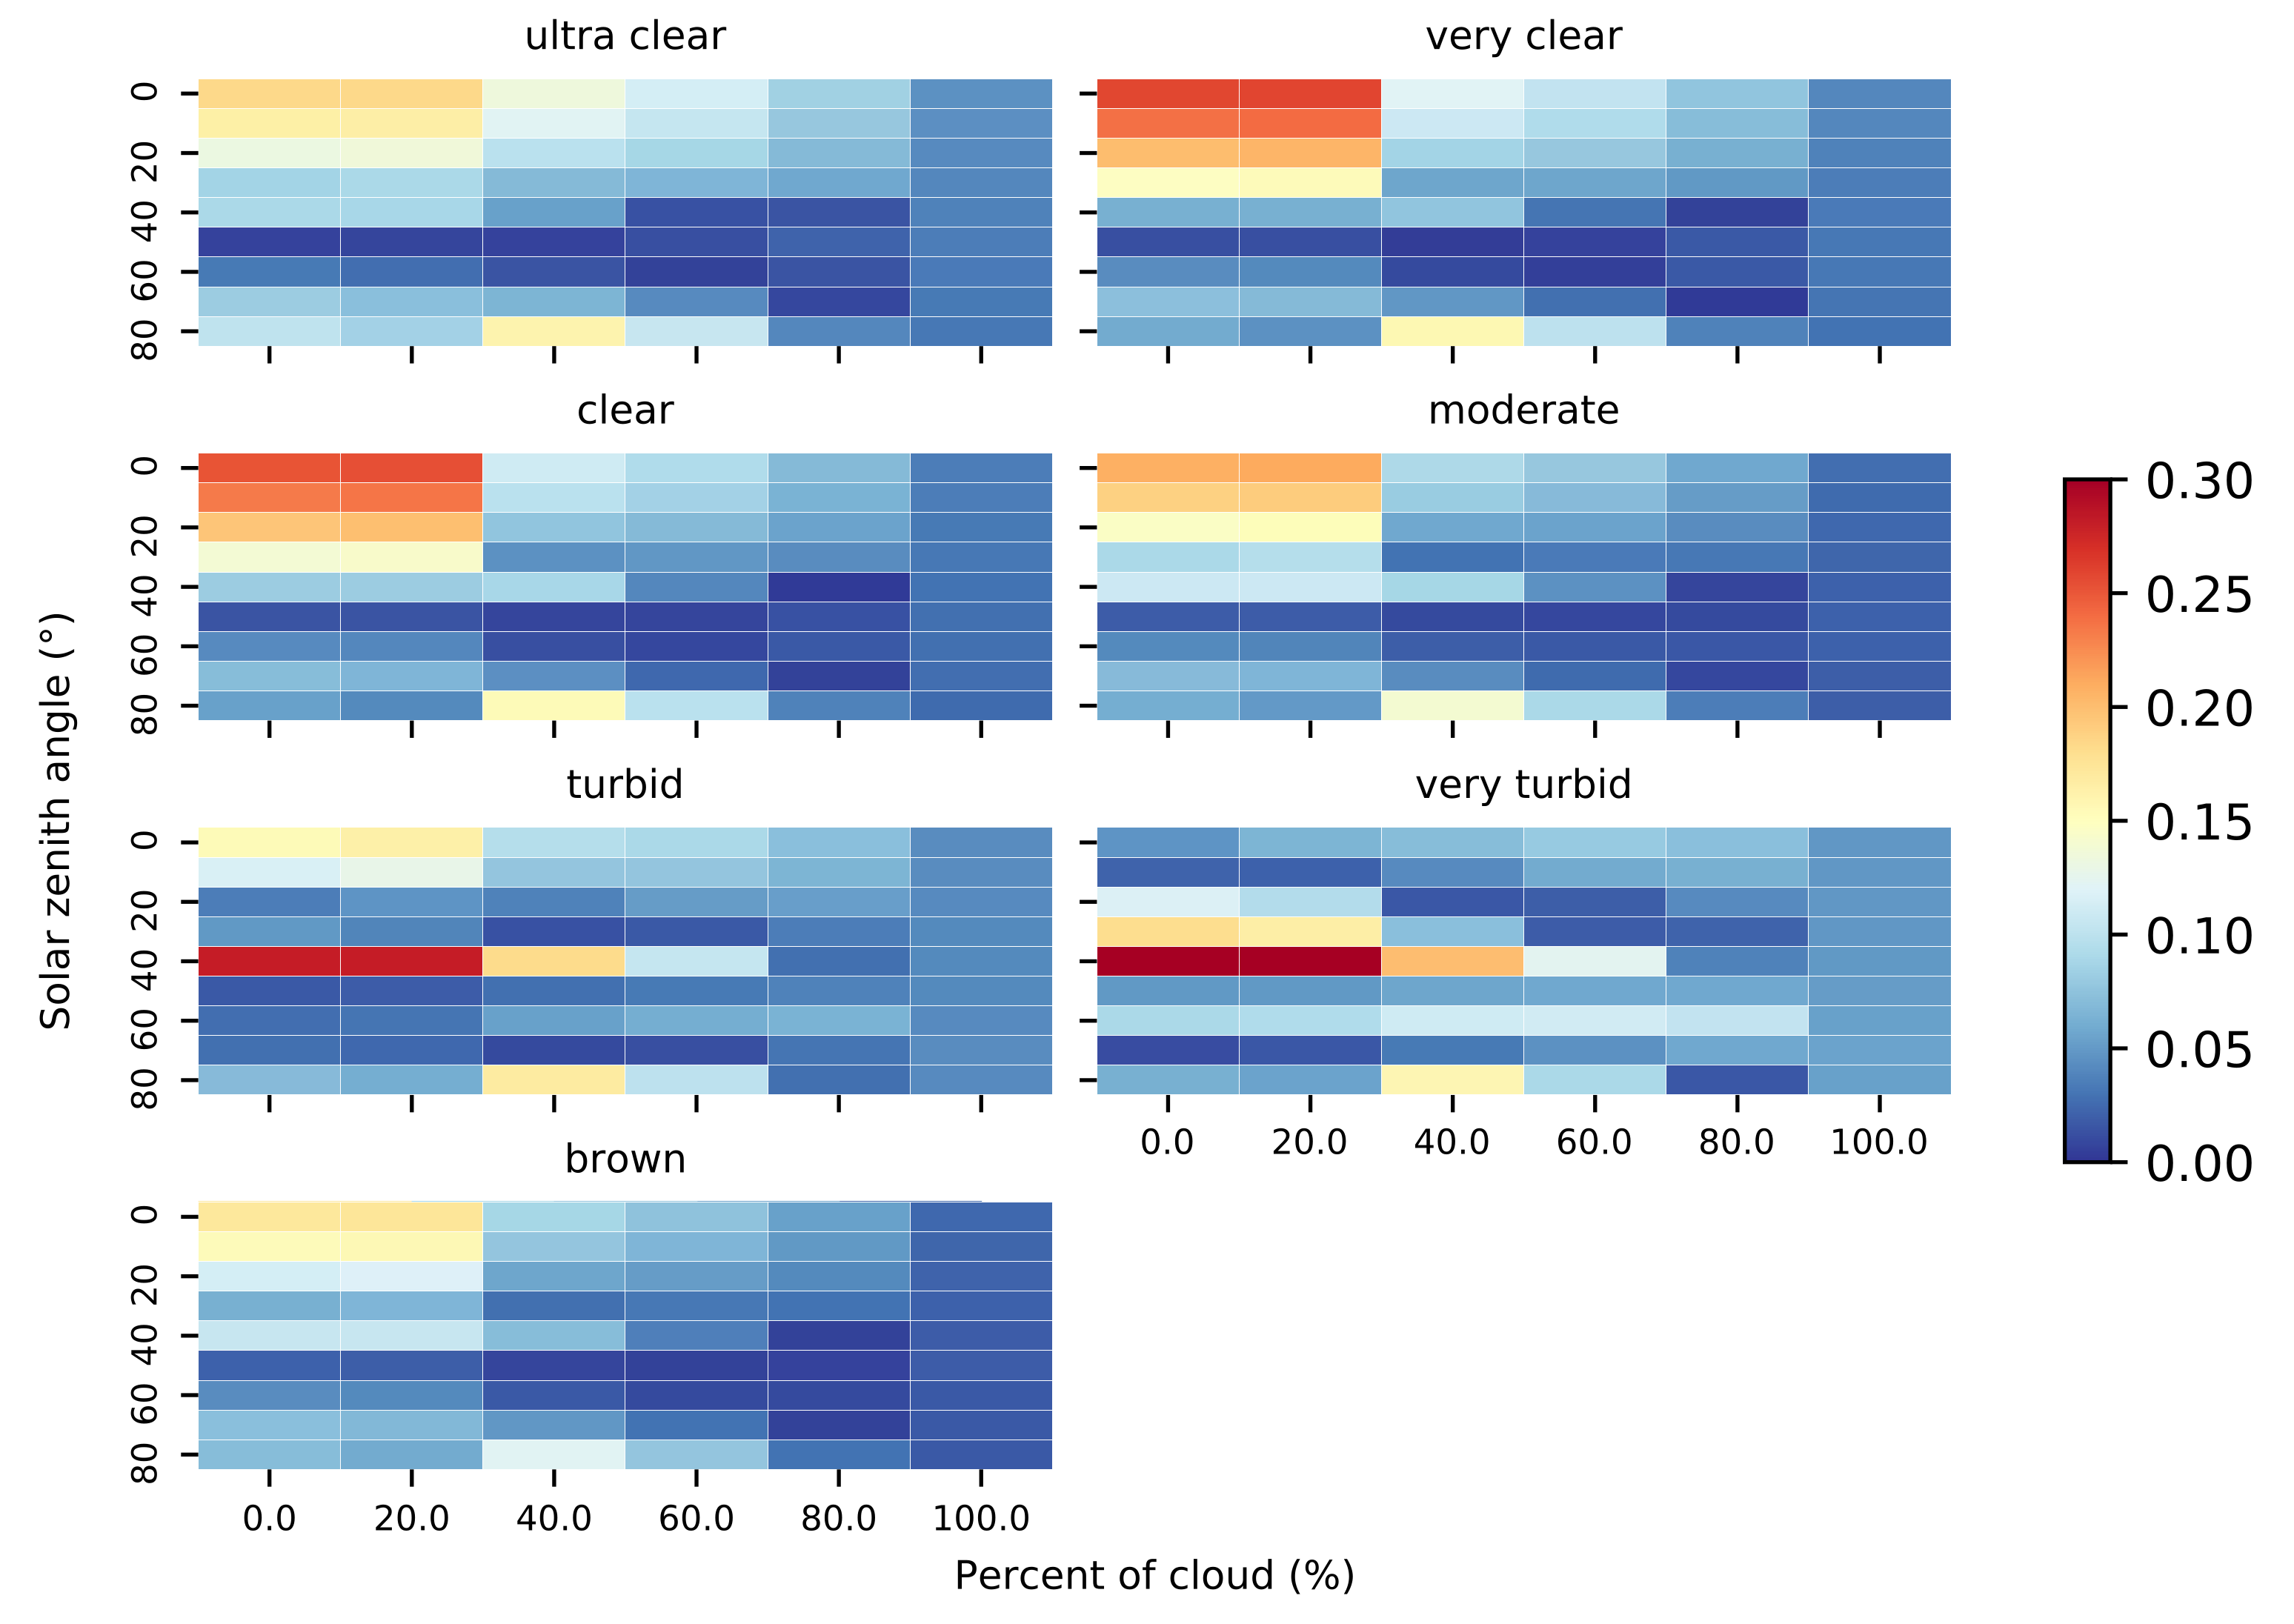
- Water types: we consider in our study from extremely clear to extremely turbid water situations, simulating the kind of waters that could be encountered in estuaries and inland water bodies.
- Wavelengths: We consider wavelengths in between 400 and 700 nm at 5 nm intervals.
- Illumination conditions: we consider a solar zenith angle ranging from to in steps of , and cloud coverage from 0% to 100% in steps of 20%.
- Depth resolution: we follow the depth resolution configurations described in Table 1.

Table 1.
Depth resolution configuration.
Regarding the other parameters, we fix the wind speed to 0 m/s and assume that the water is infinitely deep homogeneous. The direct and diffuse solar irradiance were simulated using a semi-empirical sky model (the Radtran atmospheric irradiance model, developed by Gregg and Carder []), with the annual average sun-earth distance and ozone content of 300 DU as input. Raman scattering and chlorophyll and CDOM fluorescence were also included in all simulations. The input data concentrations of phytoplankton, colored dissolved organic matter (CDOM), and detritus/minerals were taken from the optical classification of lakes and coastal waters in Estonia and south Finland [] (see Table 2).

Table 2.
Characteristics of different type of water classes. Clear, moderate, turbid, very turbid, and brown classes are from the work in []. Very clear and ultra-clear classes are generated manually.
From this configuration, the following data set were created:
- Data set 1: contains 3024 simulations, following the same parameters described above, with all the different water types (ultra clear, very clear, clear, moderate, turbid, very turbid, brown). Illumination conditions are considered as solar zenith angle range from to at intervals, and cloud coverage from 0% to 100% at 20% intervals. To optimize the number of simulations per water type and lighting conditions, it is considered two different values (maximum and minimum concentrations from Table 2) for each phytoplankton, CDOM, and minerals concentration.
From these data sets, we create different study cases depending on the analysis we want to address (see Table 3).

Table 3.
Description of all the case studies.
2.5. Methods to Analyze the Relations -, and -
A collection of methods is used to assess the correspondence between these variables, using the different scenarios described in Table 3. To assess the optimal that optimizes in terms of light acquisition and instrumental feasibility, we compute the ratio between and in logarithmic values at the following depths: 0.2, 0.5, 1.0, 1.5, 5.0, and 10.0 m. We represent the average ratio and the corresponding standard deviation at 1.5 m depth by using a bar plot. Once it is selected the optimal integration angle for annular irradiance (), a scatter analysis is used to compare and to analyze the functional relationship between both. Then, we analyse how the diffuse attenuation coefficients change with different light conditions by modifying solar zenith angle and per cent of cloud coverage. The main goal is to analyze how the performance degrades as a function as these light conditions also degrade.
The results are plotted as heat-maps between the solar zenith angle and percent of clouds, all of them fixed at 1.5 m depth.
Regression analysis is used to estimate the strength and direction of the and relationship. We compute the correlation coefficients (r) (which measures the degree of association, with 0.05 probability level of significance) and slopes (m) (which measure the rate of change) of the regression line at 1.5 m. Both of them are obtained by computing a linear least-squares regression for two sets of measurements. Finally, the relative error, expressed in %, is calculated by the following equation:
where is the estimated from values. We use the slope m resulting from the previous analysis to derive a from :
where m corresponds to the average of the slope of the regression line for each fixed depth.
3. Results
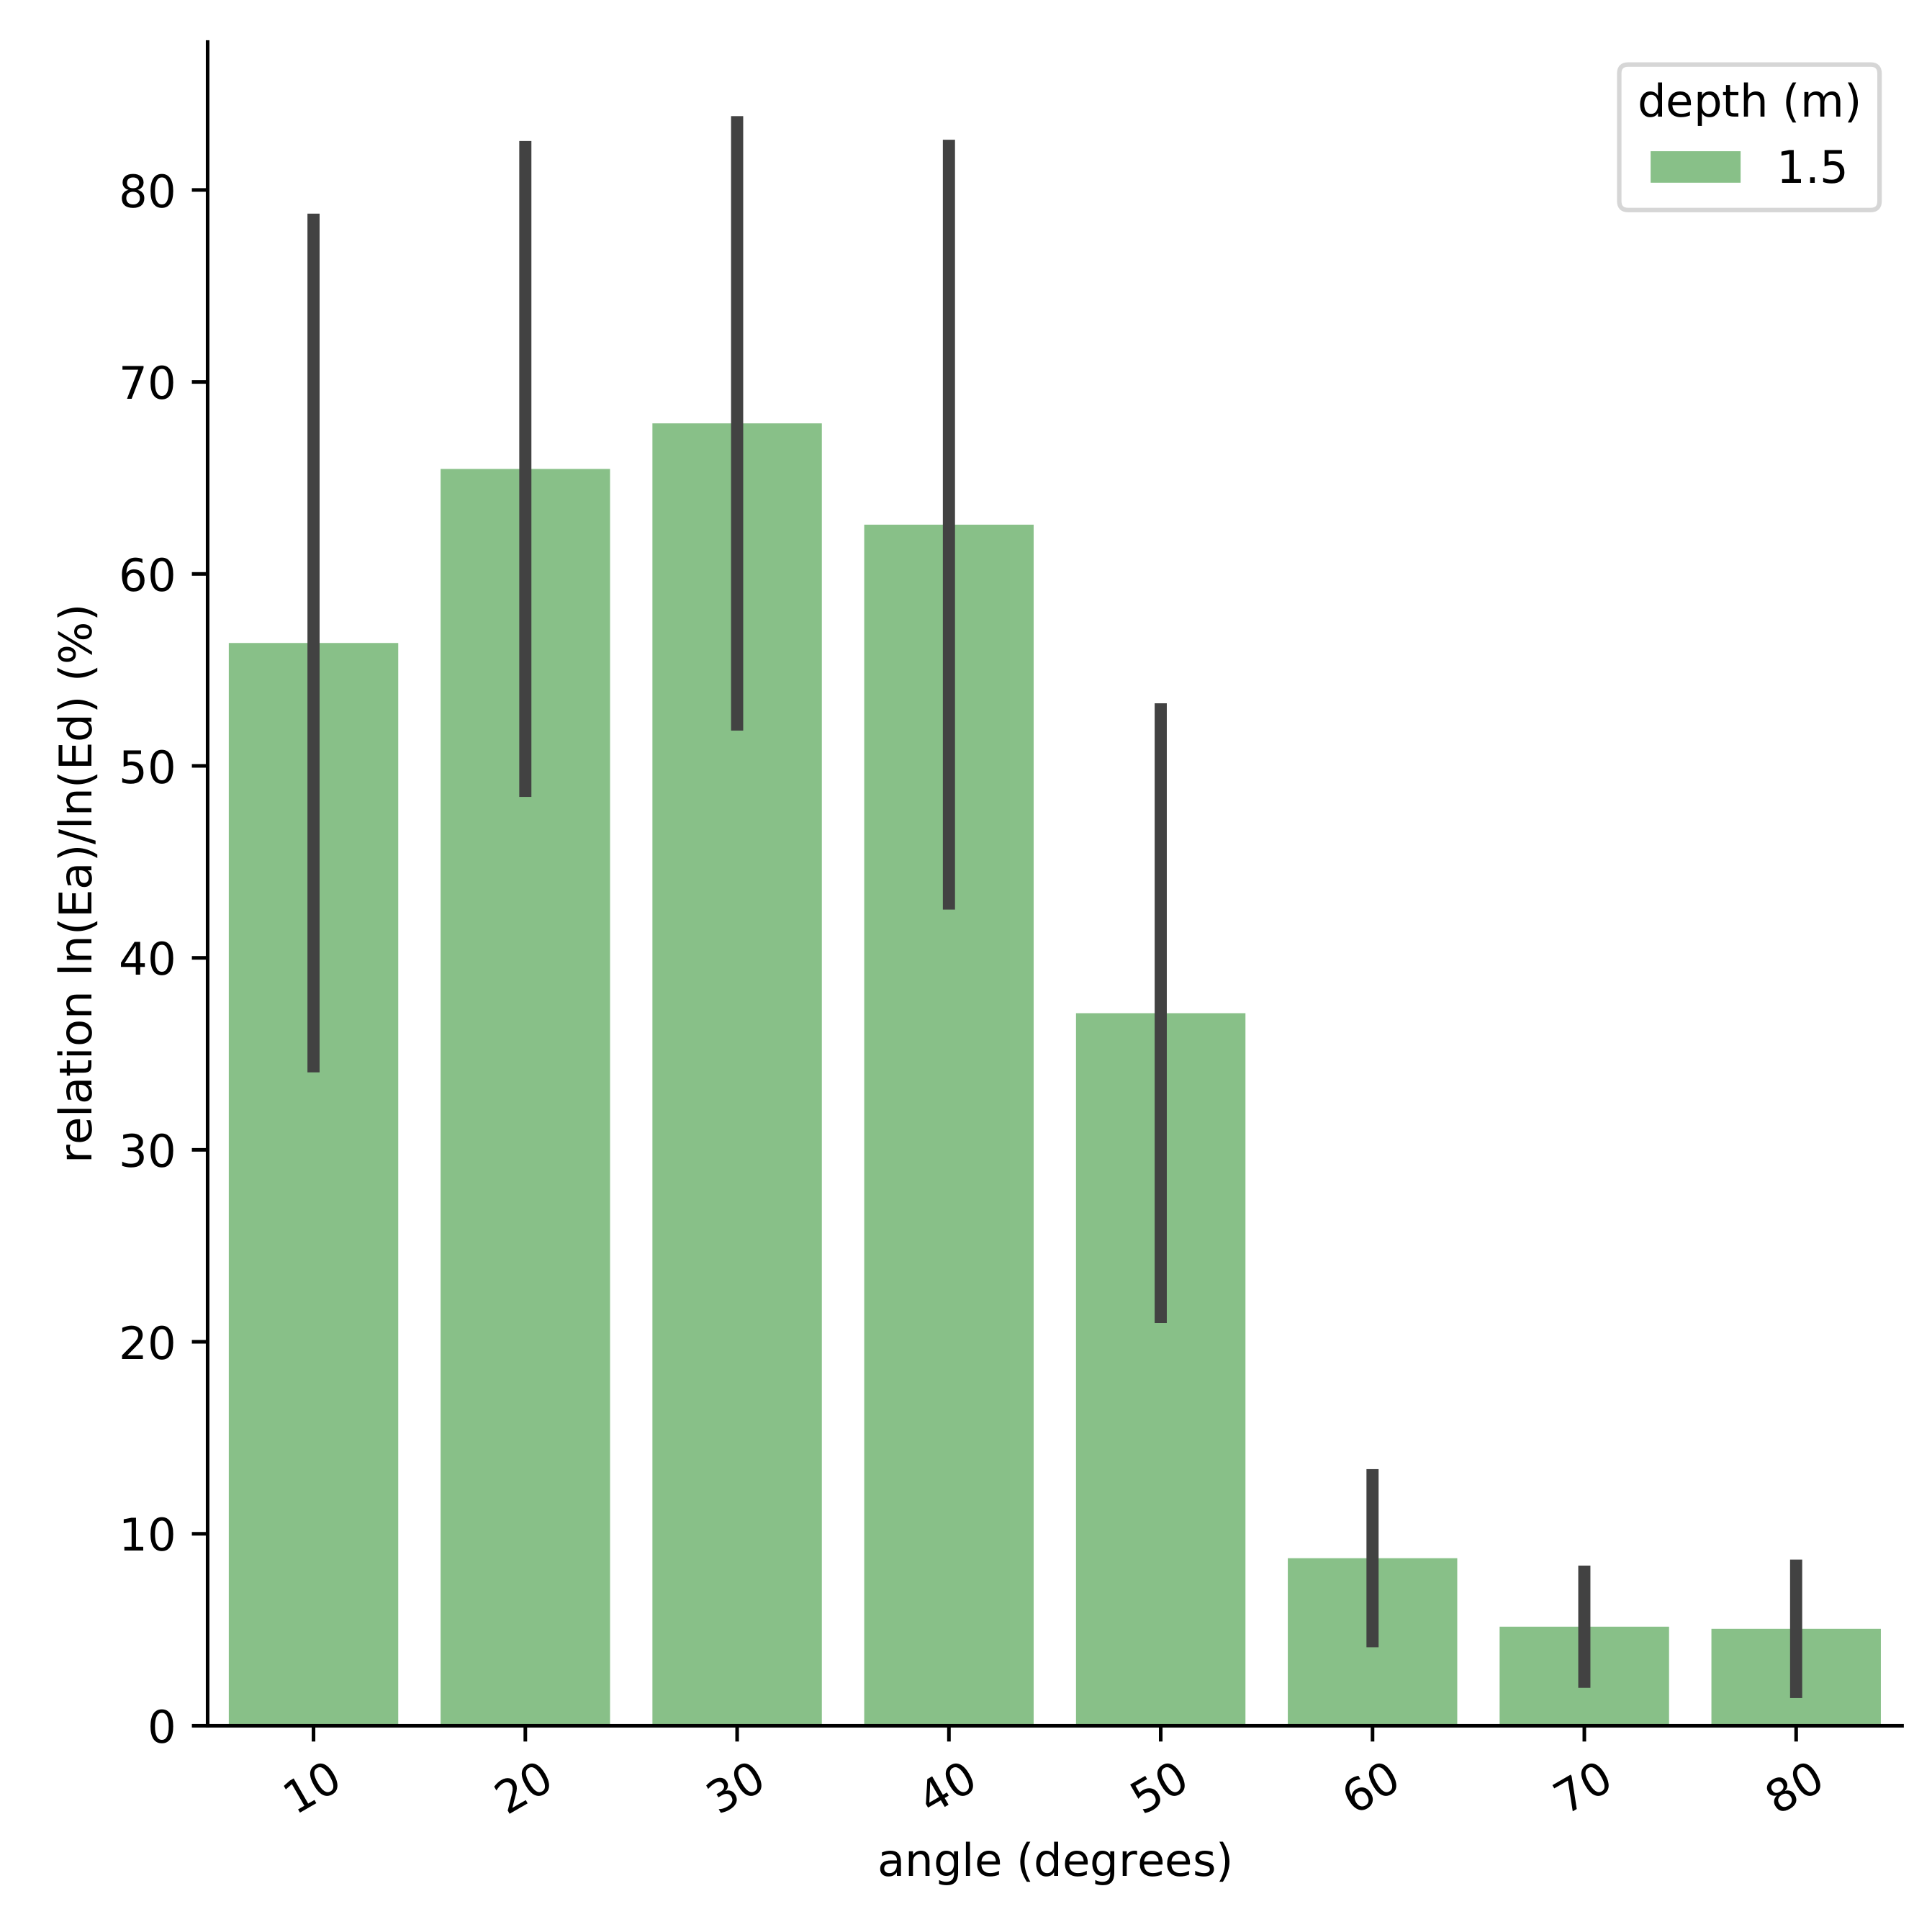
3.1. Optimal Integration Angle
We generate the annular irradiances from to from the data set described in the case study 1 (see Table 3).
As observed in Figure 3, in logarithmic values increases from to and then start to decrease at by reaching very low values in the range of to . This ratio has been tested at different depths (0.2, 0.5, 1.0, 1.5, 5.0, and 10.0 m depth), and the results are very similar. For this reason, we select the values only at one depth: 1.5 m.The standard deviation is widely distributed around the mean and indicates how wide it spreads out. Deep waters have a higher standard deviation in comparison with shallow waters.

Figure 3.
Comparison of the optimal integration annular angle in different water types, with solar zenith angle between and and cloud coverage between 0% and 100%.
To select the optimal annular angle, we need to take into account not only the optimization of /, but also that as closest the annular angle to the light sphere equator (), the best performance in terms of avoiding self-shading effects and better the potential vertical resolution. The / values at annular angles larger than are very low, indicating very low accuracy to the corresponding measurements. Therefore, we select as the optimal annular angle to measure . For the rest of our study, the entire analysis is performed with integration annular angle of 40 degrees. We also include in our analysis because although it presents a decrease of accuracy with respect to , we want to assess a potential range of error in the placement of the sensors in the instrument.
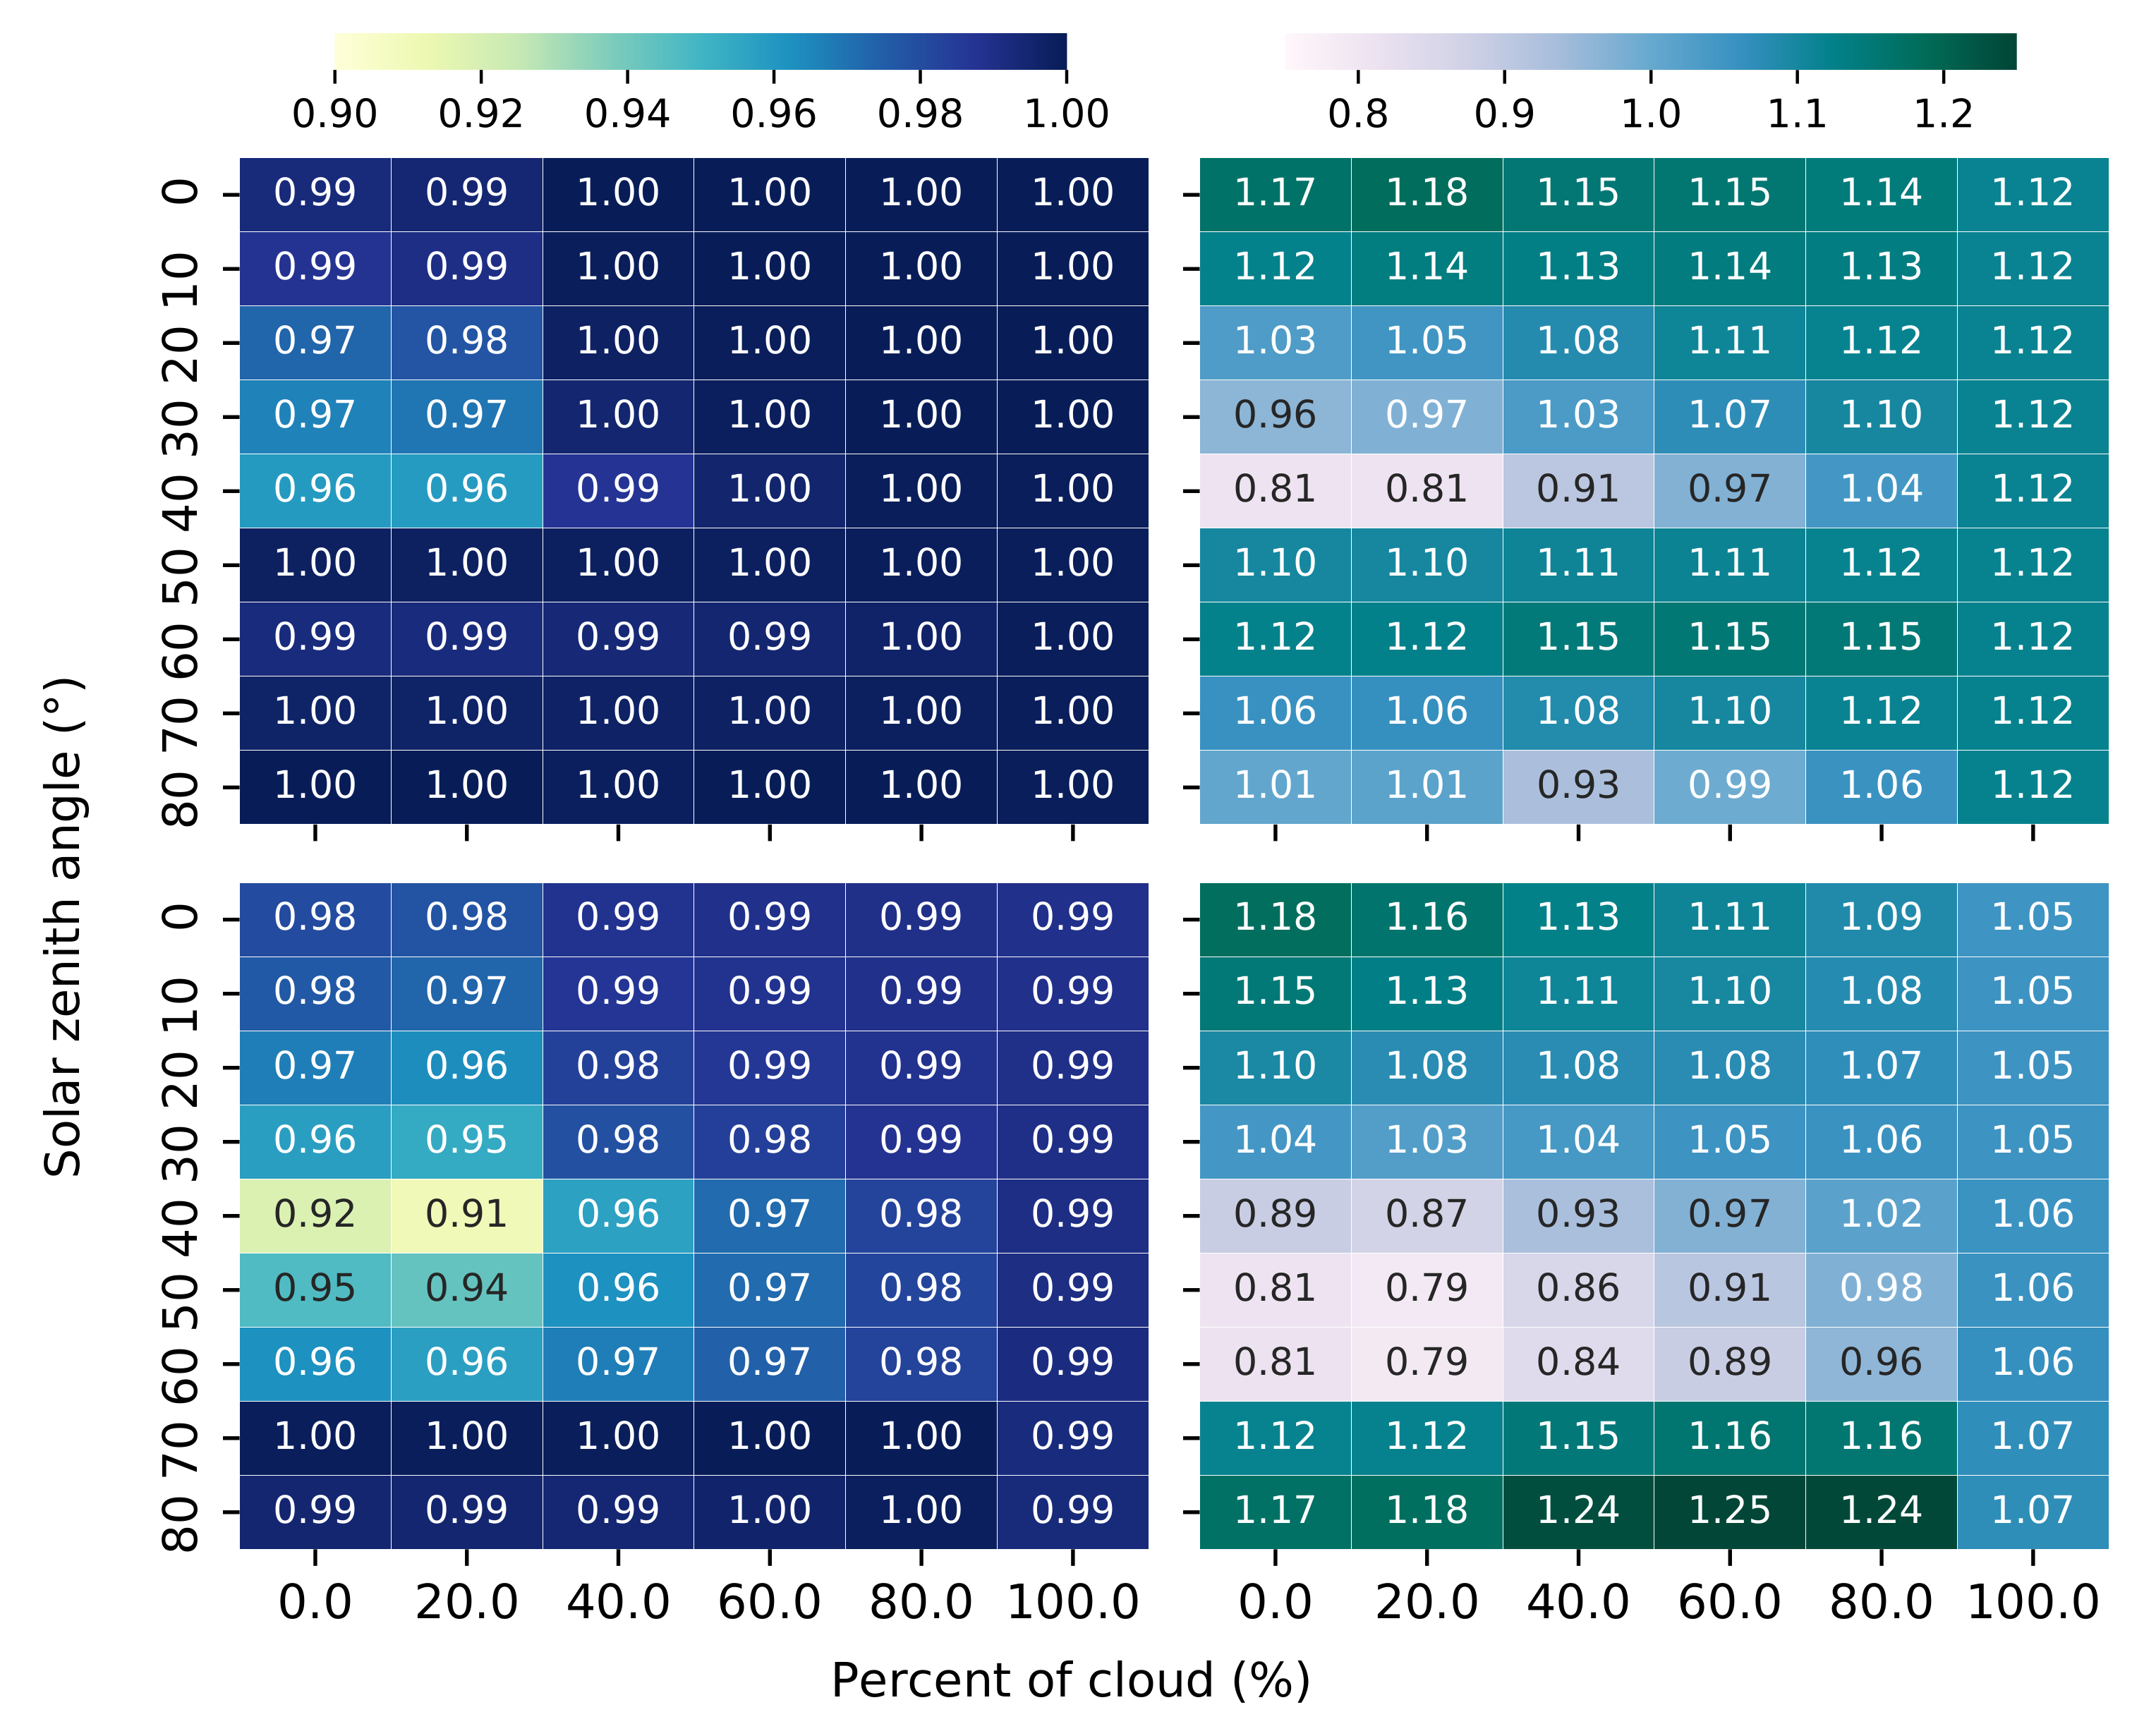
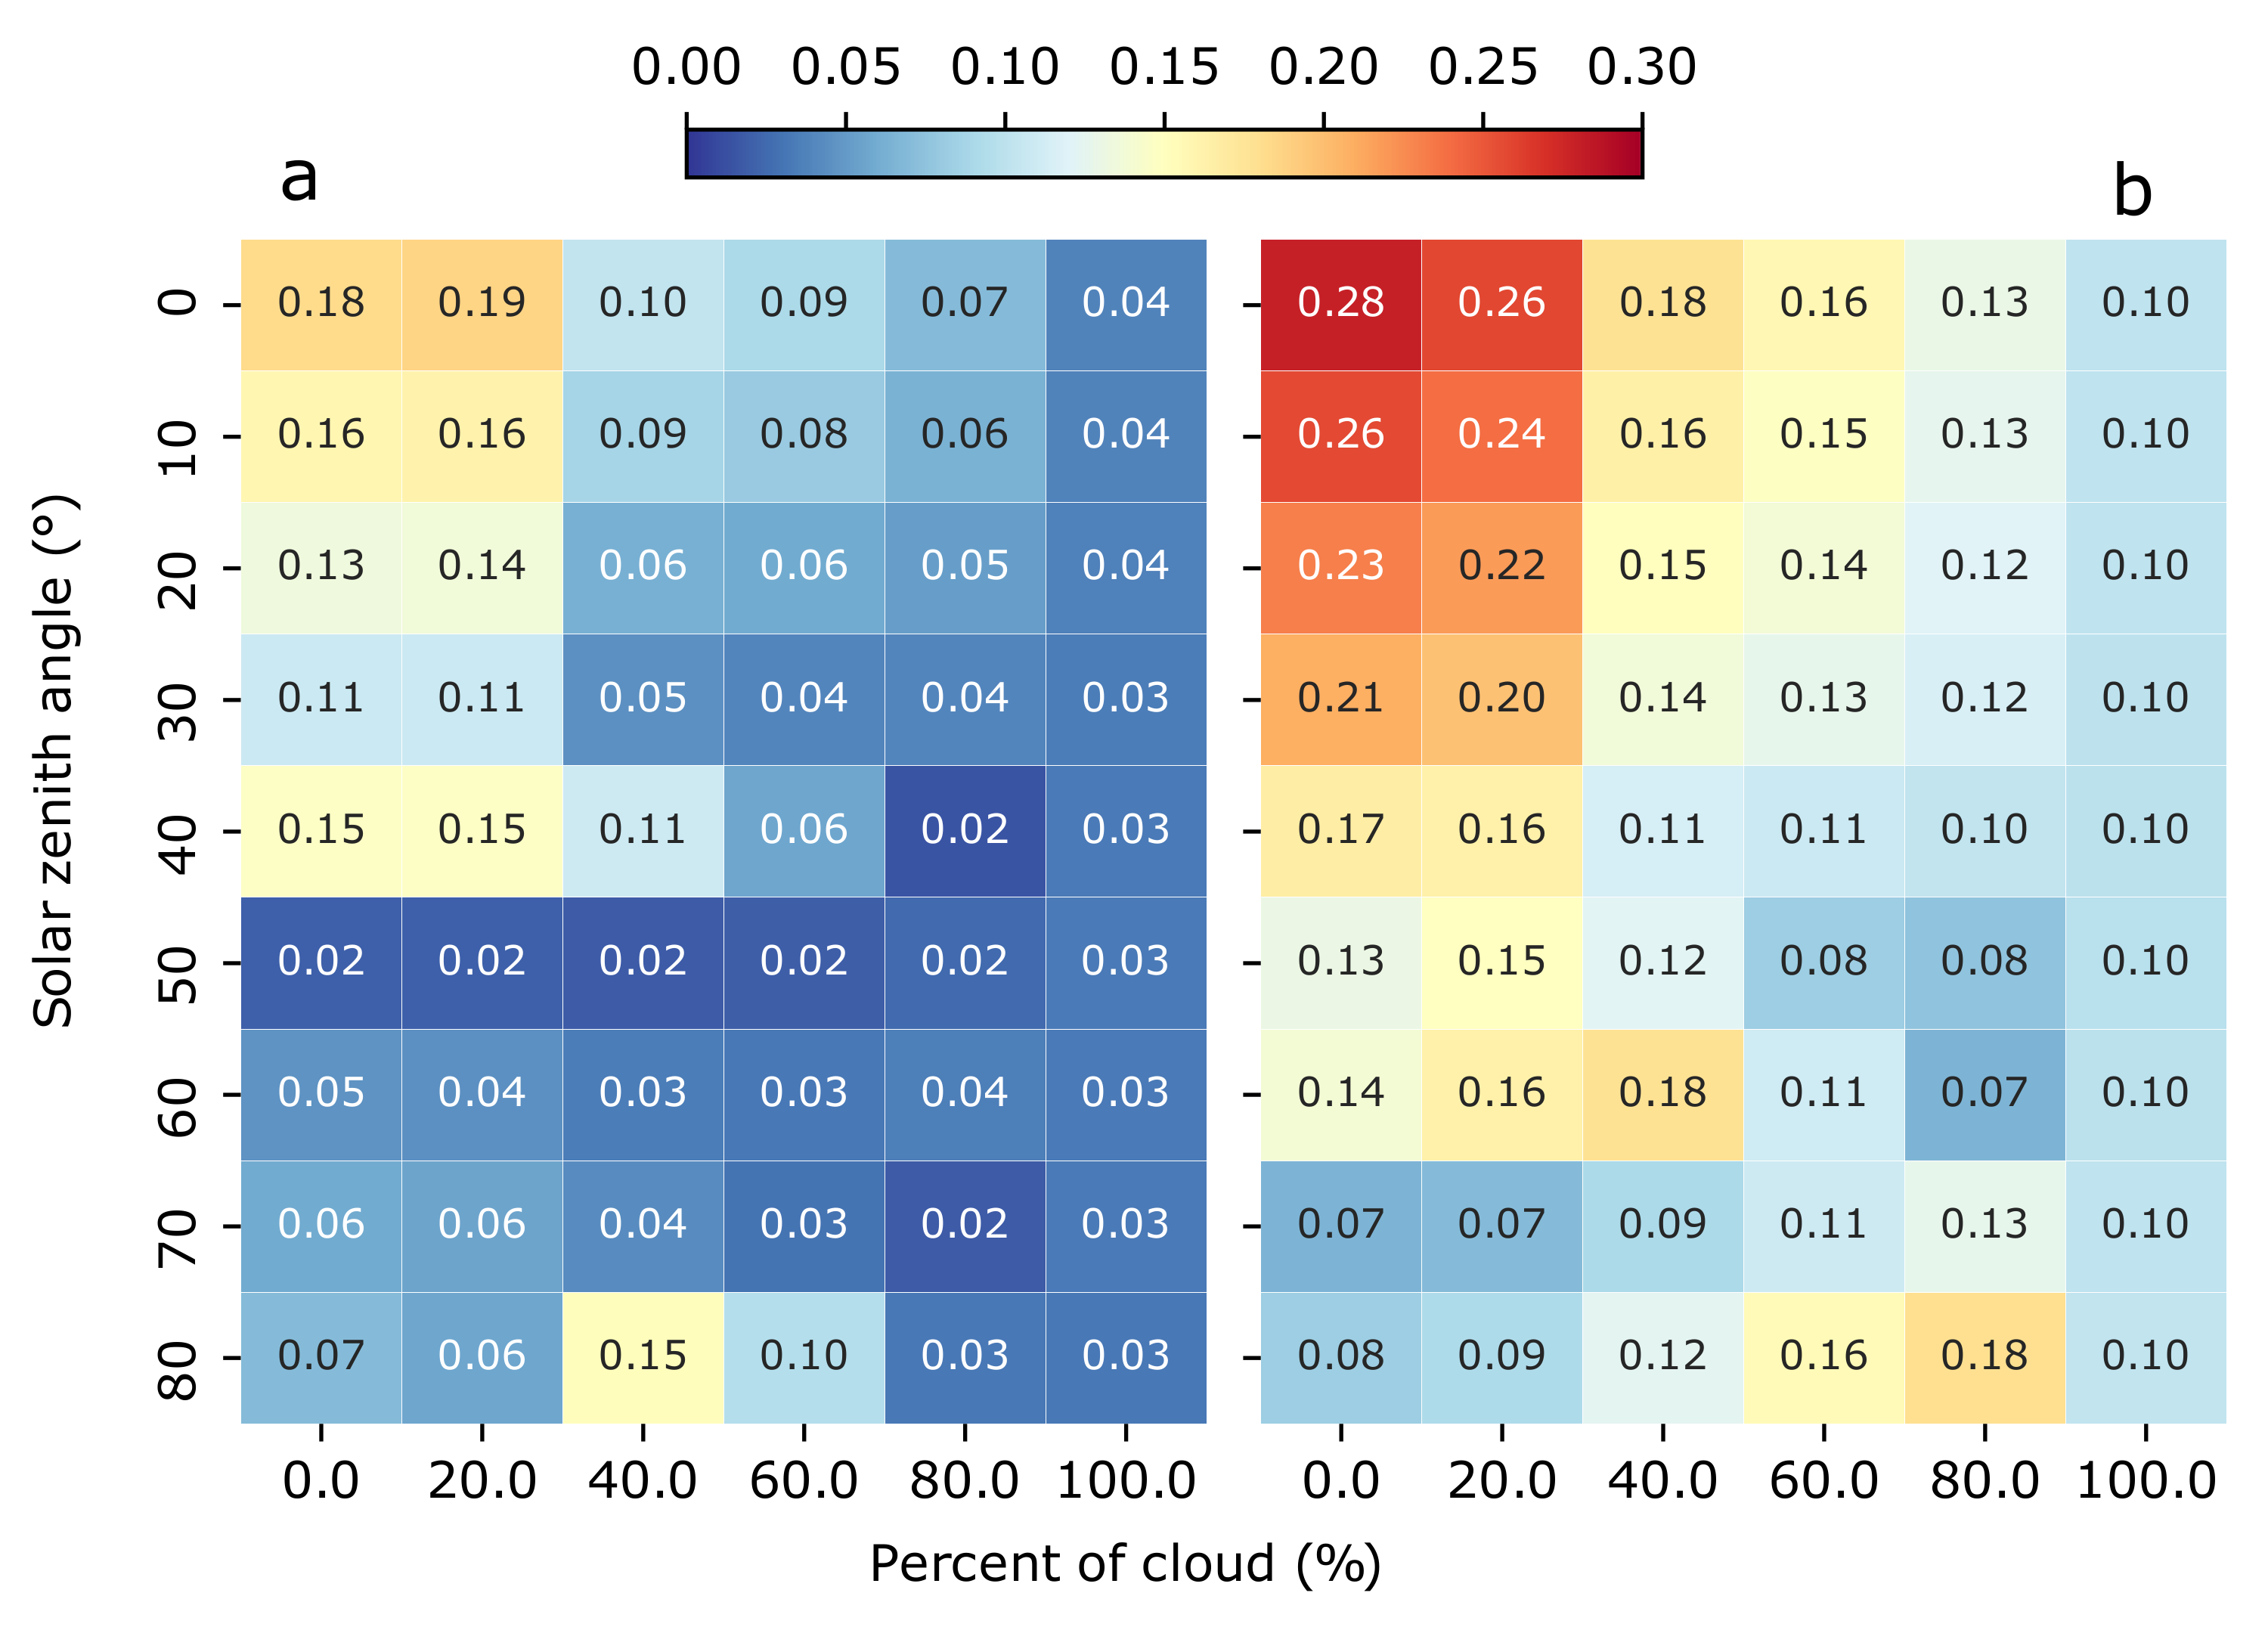
3.2. Comparisons between and
Figure 4 represents a scatter plot between and (left), and and (right), both at 1.5 m (top) and 10 m (bottom) depths using data from case study 1 (see Table 3). In this case, is strongly correlated with in all the water types, with a correlation coefficient value equal to 0.9828 at 1.5 m and 0.9919 at 10 m. The is less correlated with than , especially in water types more turbid, although the correlation coefficient is also higher than 0.9 (0.9460 at 1.5 m and 0.9865 at 10 m).

Figure 4.
(a) Scatter plot between the and computed in a range depth between 0 m and 1.5 m depth. (b) Scatter plot between the and computed in a range depth between 0 m and 1.5 m depth. (c) Scatter plot between the and computed in a range depth between 0 m and 10 m depth. (d) Scatter plot between the and computed in a range depth between 0 m and at 10 m depth. All plots are configured in the PAR region, with solar zenith angle between and , and cloud coverage between 0% and 100%.
3.3. Comparison between Different Lighting Scenarios
Figure 5 shows the correlation coefficient (left) and the regression line’s slope (right) between and (upper) and and (lower) as a function of the solar zenith angle and cloud coverage at 1.5 m depth. The correlation coefficient between and remains constant, equal to 1, for almost all the different lighting scenarios. For solar zenith angles in the range of the same integration angle, , the correlation coefficient decreases slightly, reaching values of 0.96. The correlation coefficient between and follows the same structure as , with lower values in solar zenith angles between and . In this case, all the correlation coefficient values are not as good as in the correlation.

Figure 5.
Correlation coefficient between and (upper left). Regression line’s slope between and (upper right). Correlation coefficient between and (lower left). Regression line’s slope between and (lower right). All the plots are configured modifying lighting scenarios as solar zenith angle and cloud coverage, at 1.5 m depth.
The regression line’s slope between and presents variability in the range from solar zenith angles at and cloud coverage at 0–, with values equal to 0.81, to solar zenith angles at and cloud coverage at 0–, with values equal to 1.18. For the rest of the lighting scenarios the regression line’s slope remains stable in values close to 1.1. The regression line’s slope between and presents variability in the range from solar zenith angles at – and cloud coverage at 0–, with values equal to 0.79, to solar zenith angle at and cloud coverage at 40–, with values equal to 1.25. The rest of lighting scenarios the regression line’s slope remains stable in values close to 1.05–1.12.
Figure 6 shows the relative error between and (left) and between and (right) as a function of the solar zenith angle and cloud coverage at 1.5 m depth. By using the Equation (11) and the values of the linear regression from Table 4, we estimate the values of from and , and we provide an estimation of the relative error by following Equation (10). In the case of the estimated from , for solar zenith angles from to , and cloud coverage from to , it has a relative error in the range of to . In the other lighting scenarios, the relative error decreases to lower values until almost . In the case of , the estimation of has relative errors higher than at solar zenith angles from to , and cloud coverage from to . In the rest of the lighting scenarios, the relative error is constant at approximately. We have focused our analysis in 1.5 m depth, but as shown in Table 4 and Table 5 similar results are obtained when we consider different depths.

Figure 6.
(a) Relative error between and . (b) Relative error between and . Both plots are configured modifying lighting scenarios as solar zenith angle and cloud coverage, at 1.5 m depth.

Table 4.
Average of slope for each depth range and for each diffuse attenuation coefficient used to calculate the relative error, from simulations generated in the case study 1.

Table 5.
Average of relative error for each depth range and for each diffuse attenuation coefficient, from simulations generated in the case study 1.
Finally, we analyze the relative error of as a function of the different types of water. Figure 7 shows that the estimated error of computed from at 1.5 m depth has variations depending on which water type is analyzed. Clear waters have larger errors when the solar zenith angle is close to the zenith; however, turbid waters have errors focused on solar zenith angles close to the incident angle of .

Figure 7.
Relative error between and depending on water types at 1.5 m depth, changing lighting scenarios as solar zenith angle and cloud coverage.
4. Discussion and Conclusions
This study presents the underwater annular irradiance as a new radiometric approach to compute underwater irradiances and its derived annular diffuse attenuation coefficient as an effective proxy to estimate the downwelling diffuse attenuation coefficient in the PAR region. We find that the optimal angle to measure underwater annular irradiance is at 40 degrees, which is the angle measured from the z-axis in spherical coordinates (see Figure 2). With this setup, light is captured by the sensor avoiding limitations due to instrument self-shading. The performances decrease with annular angles larger than 50 degrees, obtaining very poor performances with annular angles greater than 60 degrees. This degradation is probably caused by Snell’s law [,].
We observe a large correlation between and in different water types (see Figure 4). In the case of the correlation between and , there are still correlations greater than 0.9. In this study, we analyze with special detail the performance at 1.5 m to simulate an instrument measuring the diffuse attenuation coefficient near the surface, as in real field conditions. We know that measures very close to the near-surface are affected by large light fluctuations caused by the surface waves []. Besides, the diffuse attenuation coefficient presents variability in response to changing solar altitude []. For this reason, in this correlation the solar zenith angle is set until . The relationship between and is robust when the light conditions change (see Figure 5). The larger differences of the correlation coefficient and the slope between and occurs when the solar zenith angles directly affects the annular angle: the largest difference in the case of happens when the solar zenith angle is incident at , while the largest difference in the case of happens when the solar zenith angle is incident at the range of 40 to 50.
Therefore, we derive empirical functions to estimate from and measurements, obtaining a relative error from this estimation and for each simulation. After that, we group the simulations in this case by different lighting scenarios. The estimation provides accurate measurements of (see Figure 6), which has relative errors below the in the case of the estimations from and below the in the case of the estimations from . In both cases, the estimates of degrade for solar zenith angles close to the zenith. If we study this relative error grouping simulations by different water types, in the case of (see Figure 7), we observe the largest errors in clear waters on solar zenith angles focused on zenith, and in turbid waters on solar zenith angles focused on incident angles at .
As a result, the annular diffuse attenuation coefficient allows the design of instruments expected to be particularly useful in those underwater environments where high vertical resolution is required. This design, ideally as a moored system tube, facilitates the instrumentation’s clean, critical when sampling different water columns and avoiding act as a disease vector []. Furthermore, devices based on this light-sensing approach are much easier to deploy and maintain. With these characteristics, the proposed work advances the current state-of-the-art of Marine Citizen Science as a DIY and low-cost sensor for water quality monitoring programs [].
Author Contributions
Conceptualization, J.P.; methodology, C.R., E.O. and J.P.; software, C.R.; validation, J.P. and E.O.; formal analysis, E.O., R.B. and J.P.; investigation, C.R., E.O. and J.P.; resources, C.R.; data curation, R.B.; writing—original draft preparation, C.R., E.O. and J.P.; writing—review and editing, C.R., E.O., R.B. and J.P.; visualization, C.R., E.O., R.B. and J.P.; supervision, J.P. and E.O.; project administration, J.P.; funding acquisition, J.P. All authors have read and agreed to the published version of the manuscript.
Funding
This research was funded by Horizon 2020 Framework Programme (776480, MONOCLE).
Institutional Review Board Statement
Not applicable.
Informed Consent Statement
Not applicable.
Data Availability Statement
The work presented in this article is fully reproducible. The configuration files have been obtained with HidroLight (version 5.2) and the analysis of the data with Python (version 3.8.0). The following list shows the available links to the configurations, data and scripts used:
- The HydroLight configuration files: https://doi.org/10.5281/zenodo.5153536, accessed on 11 August 2021.
- The numerical results: https://doi.org/10.5281/zenodo.5041192, accessed on 11 August 2021.
- The code to generate, process and plot simulations: https://git.csic.es/36579996Z/pysimhydro/-/releases/v1.0.1, accessed on 11 August 2021.
The HydroLight configuration files and the numerical results are available under the terms
of the Creative Commons Attribution 4.0 International. The code to generate, process, and plot
simulations is licensed under the BSD-style license found in the LICENSE file in the root directory of
the source tree.
Acknowledgments
We thank Curtis Mobley (Sequoia Scientific, Inc.) and John Hedley (Numerical Optics Ltd.) for the useful helps about how to compute the irradiances and diffuse attenuation coefficients through HydroLight software.
Conflicts of Interest
The authors declare no conflict of interest.
References
- Mobley, C.D.; Chai, F.; Xiu, P.; Sundman, L.K. Impact of improved light calculations on predicted phytoplankton growth and heating in an idealized upwelling-downwelling channel geometry. J. Geophys. Res. Ocean. 2015, 120, 875–892. [Google Scholar] [CrossRef]
- Horion, S.; Bergamino, N.; Stenuite, S.; Descy, J.P.; Plisnier, P.D.; Loiselle, S.A.; Cornet, Y. Optimized extraction of daily bio-optical time series derived from MODIS/Aqua imagery for Lake Tanganyika, Africa. Remote Sens. Environ. 2010, 114, 781–791. [Google Scholar] [CrossRef]
- Cairo, C.T.; Barbosa, C.C.F.; de Moraes Novo, E.M.L.; do Carmo Calijuri, M. Spatial and seasonal variation in diffuse attenuation coefficients of downward irradiance at Ibitinga Reservoir, São Paulo, Brazil. Hydrobiologia 2017, 784, 265–282. [Google Scholar] [CrossRef]
- Mobley, C.D. Light and Water: Radiative Transfer in Natural Waters; Academic Press: Cambridge, MA, USA, 1994. [Google Scholar]
- Sarangi, R.; Chauhan, P.; Nayak, S. Vertical diffuse attenuation coefficient (K d) based optical classification of IRS-P3 MOS-B satellite ocean colour data. J. Earth Syst. Sci. 2002, 111, 237–245. [Google Scholar] [CrossRef][Green Version]
- Wang, M.; Son, S.; Harding, L.W., Jr. Retrieval of diffuse attenuation coefficient in the Chesapeake Bay and turbid ocean regions for satellite ocean color applications. J. Geophys. Res. Ocean. 2009, 114, C10011. [Google Scholar] [CrossRef]
- Lee, Z.; Carder, K.L.; Arnone, R.A. Deriving inherent optical properties from water color: A multiband quasi-analytical algorithm for optically deep waters. Appl. Opt. 2002, 41, 5755–5772. [Google Scholar] [CrossRef] [PubMed]
- Topp, S.N.; Pavelsky, T.M.; Jensen, D.; Simard, M.; Ross, M.R. Research trends in the use of remote sensing for inland water quality science: Moving towards multidisciplinary applications. Water 2020, 12, 169. [Google Scholar] [CrossRef]
- Tyler, A.N.; Hunter, P.D.; Spyrakos, E.; Groom, S.; Constantinescu, A.M.; Kitchen, J. Developments in Earth observation for the assessment and monitoring of inland, transitional, coastal and shelf-sea waters. Sci. Total Environ. 2016, 572, 1307–1321. [Google Scholar] [CrossRef]
- Kulshreshtha, A.; Shanmugam, P. Estimation of underwater visibility in coastal and inland waters using remote sensing data. Environ. Monit. Assess. 2017, 189, 199. [Google Scholar] [CrossRef]
- Njue, N.; Kroese, J.S.; Gräf, J.; Jacobs, S.; Weeser, B.; Breuer, L.; Rufino, M. Citizen science in hydrological monitoring and ecosystem services management: State of the art and future prospects. Sci. Total Environ. 2019, 693, 133531. [Google Scholar] [CrossRef]
- Vohland, K.; Land-Zandstra, A.; Ceccaroni, L.; Lemmens, R.; Perelló, J.; Ponti, M.; Samson, R.; Wagenknecht, K. The Science of Citizen Science; Springer Nature: Basingstoke, UK, 2021. [Google Scholar]
- Camins, E.; de Haan, W.P.; Salvo, V.S.; Canals, M.; Raffard, A.; Sanchez-Vidal, A. Paddle surfing for science on microplastic pollution. Sci. Total Environ. 2020, 709, 136178. [Google Scholar] [CrossRef]
- Tyler, J.E. The secchi disc. Limnol. Oceanogr. 1968, 13, 1–6. [Google Scholar] [CrossRef]
- Wernand, M.R. On the history of the Secchi disc. J. Eur. Opt. Soc. Rapid Publ. 2010, 5, 10013s. [Google Scholar] [CrossRef]
- Pham, T.N.; Ho, A.P.H.; Nguyen, T.V.; Nguyen, H.M.; Truong, N.H.; Huynh, N.D.; Nguyen, T.H. Development of a Solar-Powered IoT-Based Instrument for Automatic Measurement of Water Clarity. Sensors 2020, 20, 2051. [Google Scholar] [CrossRef]
- Matos, T.; Faria, C.L.; Martins, M.S.; Henriques, R.; Gomes, P.; Goncalves, L.M. Design of a multipoint cost-effective optical instrument for continuous in-situ monitoring of turbidity and sediment. Sensors 2020, 20, 3194. [Google Scholar] [CrossRef]
- Bardaji, R.; Sánchez, A.M.; Simon, C.; Wernand, M.R.; Piera, J. Estimating the underwater diffuse attenuation coefficient with a low-cost instrument: The KdUINO DIY buoy. Sensors 2016, 16, 373. [Google Scholar] [CrossRef] [PubMed]
- Ho, S.Y.F.; Xu, S.J.; Lee, F.W.F. Citizen science: An alternative way for water monitoring in Hong Kong. PLoS ONE 2020, 15, e0238349. [Google Scholar] [CrossRef] [PubMed]
- Mellard, J.P.; Yoshiyama, K.; Litchman, E.; Klausmeier, C.A. The vertical distribution of phytoplankton in stratified water columns. J. Theor. Biol. 2011, 269, 16–30. [Google Scholar] [CrossRef] [PubMed]
- Yoshiyama, K.; Mellard, J.; Litchman, E.; Klausmeier, C. Phytoplankton Competition for Nutrients and Light in a Stratified Water Column. Am. Nat. 2009, 174, 190–203. [Google Scholar] [CrossRef] [PubMed]
- Terzić, E.; Salon, S.; Cossarini, G.; Solidoro, C.; Teruzzi, A.; Miró, A.; Lazzari, P. Impact of interannually variable diffuse attenuation coefficients for downwelling irradiance on biogeochemical modelling. Ocean Model. 2021, 161, 101793. [Google Scholar] [CrossRef]
- Gordon, H.R.; Ding, K. Self-shading of in-water optical instruments. Limnol. Oceanogr. 1992, 37, 491–500. [Google Scholar] [CrossRef]
- Piskozub, J. Effects of surface waves and sea bottom on self-shading of in-water optical instruments. In Ocean Optics XII; International Society for Optics and Photonics: Bellingham, WA, USA, 1994; Volume 2258, pp. 300–308. [Google Scholar]
- Piskozub, J. Influence of instrument casing shape on self-shading of in-water radiation. In Proceedings of the 14th Conference Ocean Optics, Kailua-Kona, HI, USA, November 1998; pp. 10–13. [Google Scholar]
- Aas, E.; Korsbø, B. Self-shading effect by radiance meters on upward radiance observed in coastal waters. Limnol. Oceanogr. 1997, 42, 968–974. [Google Scholar] [CrossRef]
- Piskozub, J.; Weeks, A.R.; Schwarz, J.N.; Robinson, I.S. Self-shading of upwelling irradiance for an instrument with sensors on a sidearm. Appl. Opt. 2000, 39, 1872–1878. [Google Scholar] [CrossRef]
- Leathers, R.A.; Downes, T.V.; Mobley, C.D. Self-shading correction for upwelling sea-surface radiance measurements made with buoyed instruments. Opt. Express 2001, 8, 561–570. [Google Scholar] [CrossRef] [PubMed]
- Piskozub, J. Effect of ship shadow on in-water irradiance measurements. Oceanologia 2004, 46, 103–112. [Google Scholar]
- Silveira, N.; Suresh, T.; Talaulikar, M.; Desa, E.; Prabhu Matondkar, S.; Lotlikar, A. Sources of errors in the measurements of underwater profiling radiometer. Indian J. Mar. Sci. 2014, 43, 88–95. [Google Scholar]
- Mobley, C.D. Radiative transfer in the ocean. Encycl. Ocean. Sci. 2001, 2321–2330. [Google Scholar] [CrossRef]
- Lee, Z.P.; Du, K.P.; Arnone, R. A model for the diffuse attenuation coefficient of downwelling irradiance. J. Geophys. Res. Ocean. 2005, 110, C02016. [Google Scholar] [CrossRef]
- Mobley, C.; Sundman, L. HydroLight 5.2 User’s Guide; Sequoia Scientific: Bellevue, DC, USA, 2013. [Google Scholar]
- Gregg, W.W.; Carder, K.L. A simple spectral solar irradiance model for cloudless maritime atmospheres. Limnol. Oceanogr. 1990, 35, 1657–1675. [Google Scholar] [CrossRef]
- Reinart, A.; Herlevi, A.; Arst, H.; Sipelgas, L. Preliminary optical classification of lakes and coastal waters in Estonia and south Finland. J. Sea Res. 2003, 49, 357–366. [Google Scholar] [CrossRef]
- Lythgoe, J.N. The Ecology of Vision; Oxford Science Publications; Clarendon Press: Wotton-under-Edge, UK, 1979. [Google Scholar]
- Lynch, D.K. Snell’s window in wavy water. Appl. Opt. 2015, 54, B8–B11. [Google Scholar] [CrossRef] [PubMed]
- Darecki, M.; Stramski, D.; Sokólski, M. Measurements of high-frequency light fluctuations induced by sea surface waves with an Underwater Porcupine Radiometer System. J. Geophys. Res. Ocean. 2011, 116, C00H09. [Google Scholar] [CrossRef]
- Stramska, M.; Frye, D. Dependence of apparent optical properties on solar altitude: Experimental results based on mooring data collected in the Sargasso Sea. J. Geophys. Res. Ocean. 1997, 102, 15679–15691. [Google Scholar] [CrossRef]
- Drake, J.M.; Lodge, D.M. Hull fouling is a risk factor for intercontinental species exchange in aquatic ecosystems. Aquat. Invasions 2007, 2, 121–131. [Google Scholar] [CrossRef]
- Garcia-Soto, C.; Seys, J.J.C.; Zielinski, O.; Busch, J.A.; Luna, S.I.; Baez, J.C.; Domegan, C.; Dubsky, K.; Kotynska-Zielinska, I.; Loubat, P.; et al. Marine Citizen Science: Current State in Europe and New Technological Developments. Front. Mar. Sci. 2021, 8, 241. [Google Scholar] [CrossRef]
Publisher’s Note: MDPI stays neutral with regard to jurisdictional claims in published maps and institutional affiliations. |
© 2021 by the authors. Licensee MDPI, Basel, Switzerland. This article is an open access article distributed under the terms and conditions of the Creative Commons Attribution (CC BY) license (https://creativecommons.org/licenses/by/4.0/).