1. Introduction
One of the most important risk factors for non-melanoma skin cancer is ultraviolet light (UV) exposure [
1,
2]. However, avoiding overexposure to UV remains difficult because UV does not correlate with visible brightness, its damage is wavelength dependent, and the harm is delayed by both hours (sunburns) and years (skin cancer). As a result, wearable UV monitors have the potential to help people assess their risk of UV overexposure in real-time. There are, however, currently no available sensors that are both sufficiently accurate and inexpensive for individual use [
3,
4]. In more recent reviews of wearable UV monitors, accuracy was not discussed [
5,
6]. To be accurate, UV sensors must replicate the wavelength-dependent skin sensitivity to UV, also called the “erythema action spectrum” [
7]. When the erythema action spectrum is multiplied by the ambient ultraviolet spectrum, one obtains the UV Index (UVI), a unit adopted by the World Health Organization [
8,
9]. Here, we present a novel way to estimate the UVI. It was developed by analyzing over 400,000 UV spectra collected over 10 years at multiple sites [
10]. We find that a narrow band irradiance detector at 310 nm is sufficient to measure the UVI [
11]. Using a simple atmospheric model [
12] to explore the range over which the result is applicable, we find that the strategy is likely to apply across essentially all terrestrial atmospheric conditions. This feasible, accurate, and wearable approach to UV-monitor design has promise for use in data-driven UV exposure management.
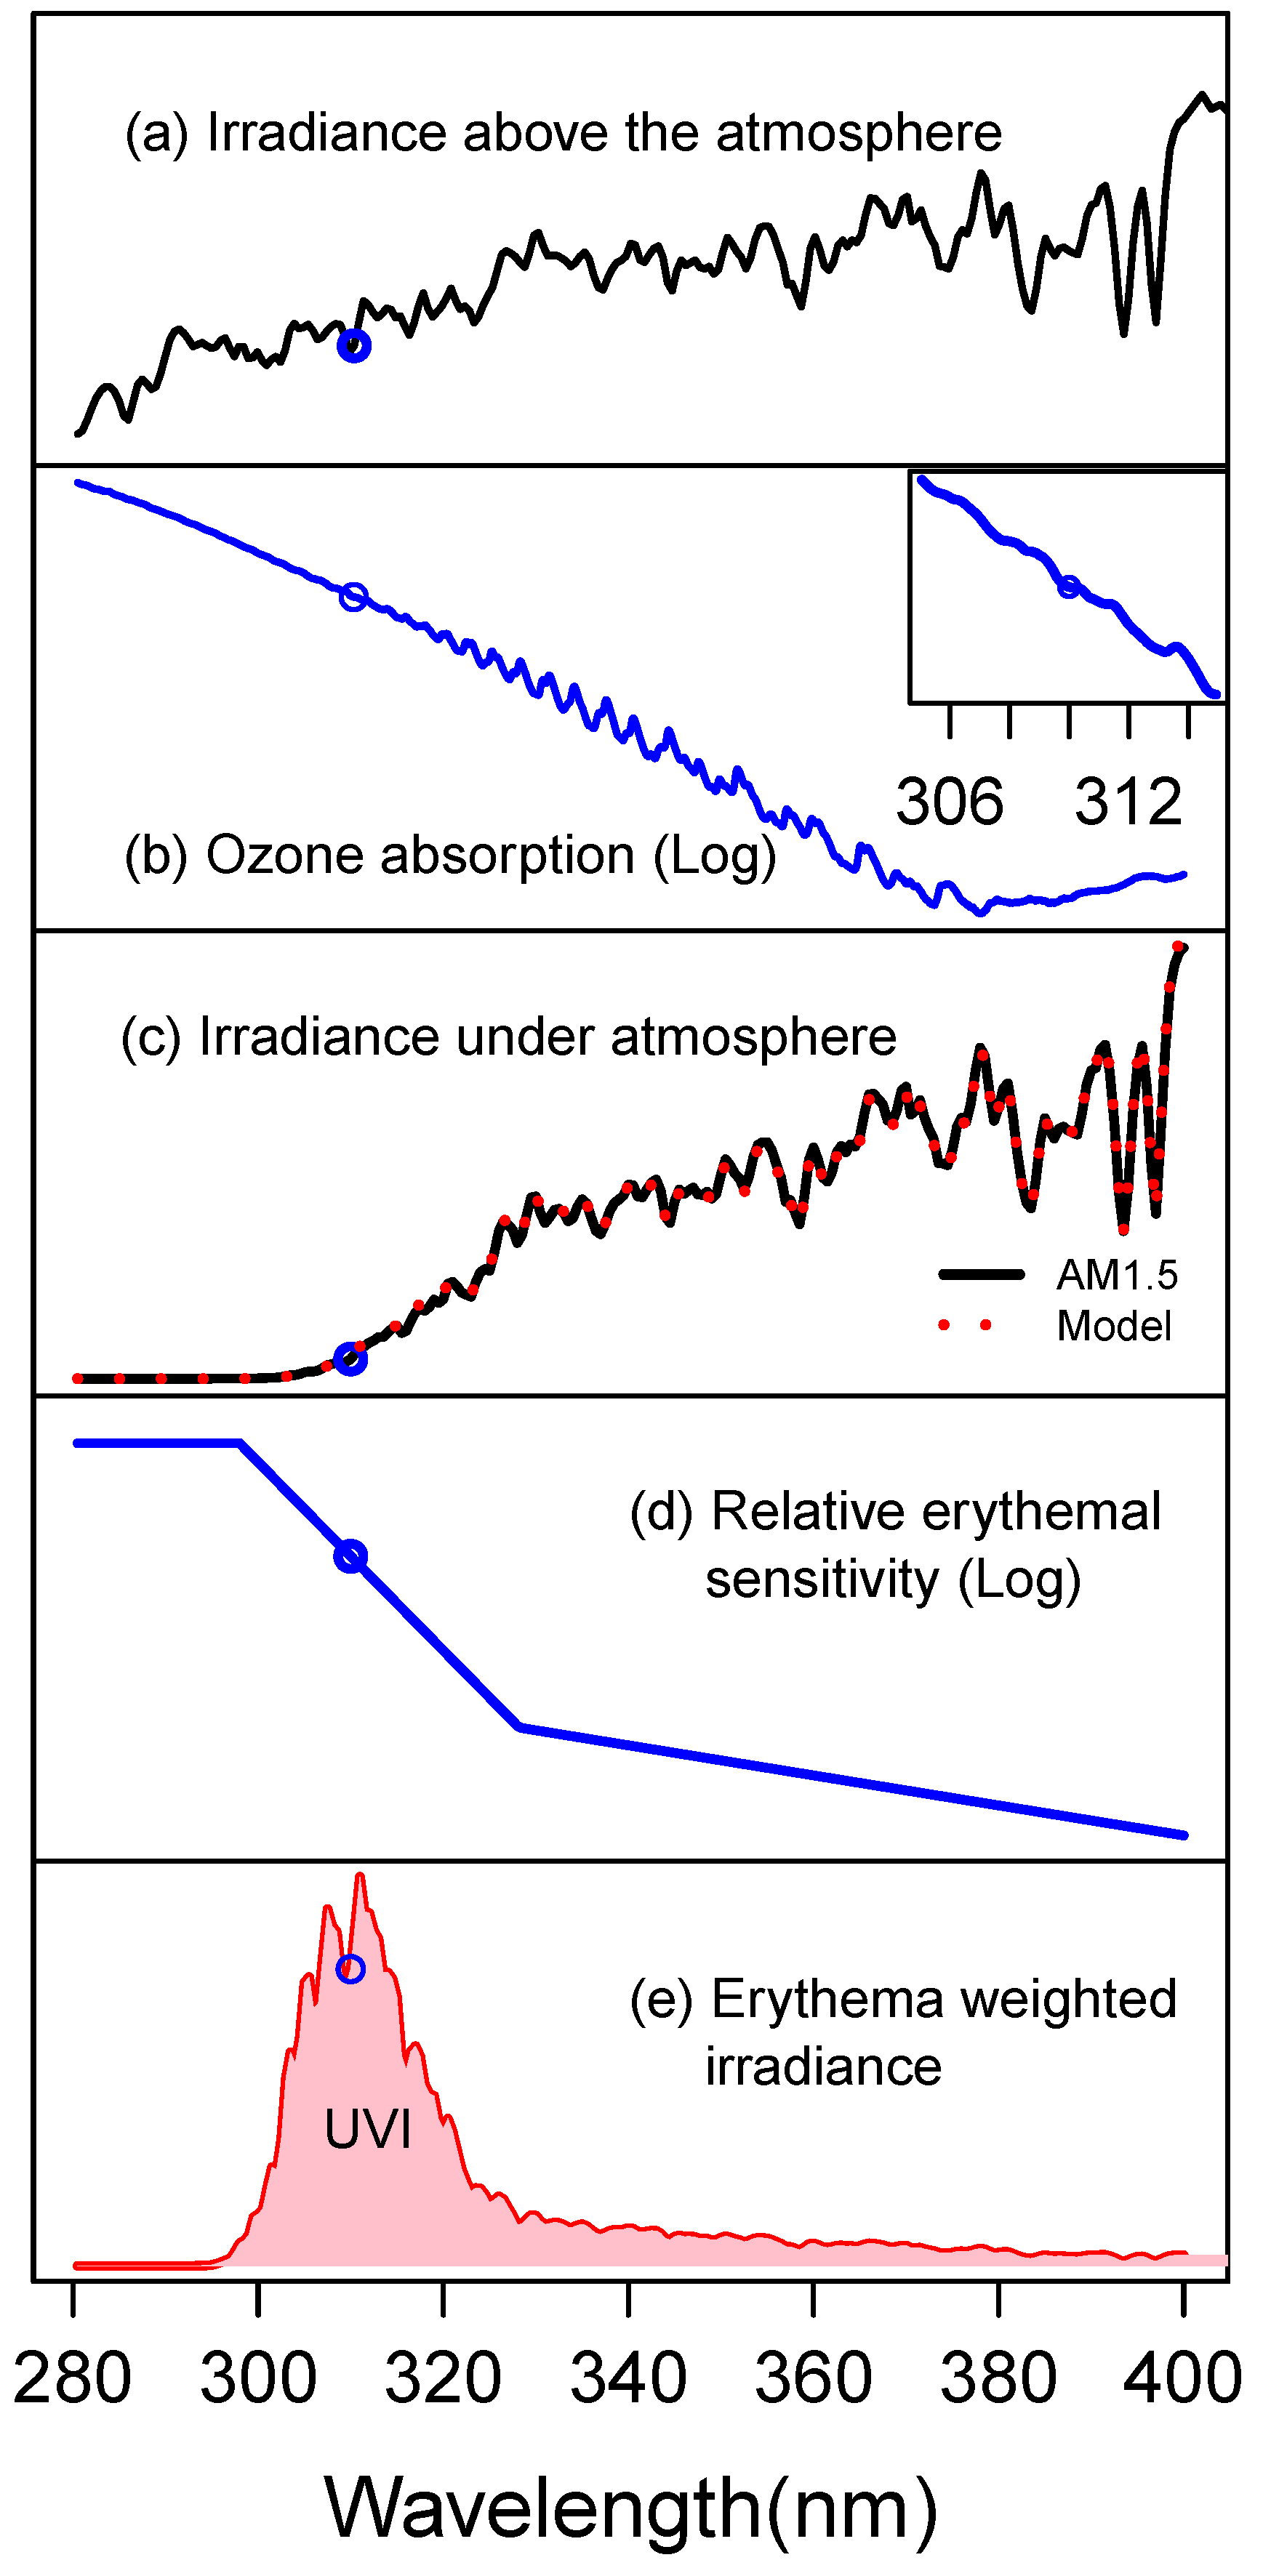
The UVI is calculated (
Figure 1) by adding the erythema-weighted sun irradiance at each wavelength and dividing the total by a reference value of 25 mW/m
2 [
13]. By design, the UV Index is dependent on the local solar spectrum, which in turn is determined by instantaneous cloud cover and other environmental details. It is common to publish the UVI by day and by geographical region, for example, by zip code [
14]. However, this approach fails to account for local and transient changes. Additionally, because skin damage is proportional to both the UVI and the duration of exposure, communicating the UVI without tracking actual exposure time may be misleading [
8,
15]. There have been many attempts to develop commercial, hand-held, or wearable low-cost UV dosimeters [
6]. These detectors, however, have been largely inaccurate [
4] as there is a significant mismatch between their spectral sensitivity and the erythema action spectrum (
Figure 1d). Indeed, because there is much spectral variation by the latitude, altitude, time of day, season, local weather, and hyper-local environment, it is generally understood that any detector whose spectral sensitivity is not exactly the erythema action spectrum will not be able to accurately estimate the UVI [
16]. In this report, we present a novel sensor design to reliably determine the UVI that is widely applicable across geographies, seasons, and atmospheric conditions. We find that an accurate detector can be designed using only irradiance near 310 nm. The result emerges from an analysis of a large database of spectral measurements of sunlight in several US locations across many years and is further validated by an atmospheric model.
The value of the UVI depends on four wavelength-dependent quantities: the solar spectrum above the atmosphere, the loss during transit due to aerosol scattering and the loss during transit due to ozone absorption, and, finally, the erythema action spectrum (
Figure 1). The spectrum of solar light impinging on the atmosphere is relatively stable and well documented [
17]. Loss of UV in the atmosphere is mostly due to ozone absorption and aerosol scattering primarily from water droplets, including clouds. The erythema action spectrum weights each wavelength according to its potential to damage skin [
7,
18].
Technical designs for UVI detectors have taken two routes. The first, pioneered by Robertson and Berger in 1976, uses a meter that responds to each wavelength according to the erythema action spectrum [
19]. This approach is both expensive and bulky as it requires careful combinations of filters and detectors. The second, used by most consumer-grade detectors, is to use a UV-sensitive photodiode with the hope that, although spectrally mismatched, it can be accurate enough. The nature of UV spectral fluctuations, which we will discuss in detail below, has defeated this approach. To look for a new approach, we analyzed the US Environmental Protection Agency’s UV-Net database [
20]. This database includes 400,000 UV irradiance spectra collected by atmospheric scientists across nine sites between 1996 and 2004, using Brewer spectrometers that collect data in 0.5 nm bandwidth channels from 286 to 363 nm. Sites range from near sea level to mountainous elevations and from urban to rural. UV-Net data have been integral to both atmospheric and clinical research [
20,
21].
2. Materials and Methods
The definition of UVI is
where
w(
λ) is the erythema action spectrum (EAS,
Figure 1d) and
I(
λ) the local spectral irradiance in mW/m
2/nm. To calculate the UVI numerically from the UV-Net solar spectra, we applied Equation (1) to each solar spectrum. The UVI is defined using the global (direct + diffuse) spectral irradiance.The output of a given sensor with a wavelength-dependent sensitivity
s(
λ) can be modeled as
M = ∫ s(
λ)I(
λ)d
λ. In use, detector current is fed into a calibration function
C(
M) to estimate
Um, the UVI. In this paper, for simplicity, we use linear calibration models of
Um =
C0 +
C1 M.
The accuracy of a detector is determined by calculating, in turn, its output M, the calibration function C(M) from a linear regression on U~C(M), and then using the coefficients of the regression to calculate the percent error for each measurement . The accuracy, A, as a function of the tolerance, t, is , the empirical cumulative distribution function, that is, the percentage of spectra with error less than a tolerance t as a function of that tolerance.
In the discussion, we develop an atmospheric model which includes the ozone content of the atmosphere in Dobson Units. One Dobson Unit corresponds to an ozone column height of 0.001 cm at standard temperature (272 °K) and pressure (1 atm):
where
NA is Avagadro’s Number and
z is the concentration of ozone that appears in Equation (2). Fits to the model were performed using nls.lm() in the package “stats” of the R project for Statistical Computation.
3. Results
To investigate the role of each wavelength to UVI, for each spectrum, we calculated the UVI and, using the irradiance
I at each wavelength
λ, we performed a linear regression of
U ~
Iλ. To compare wavelengths, we used
, the relative difference between the spectrum’s UVI and the UVI predicted by the linear fits. This metric was introduced by Correa et al. in the first study comparing the performance of hand-held UV sensors [
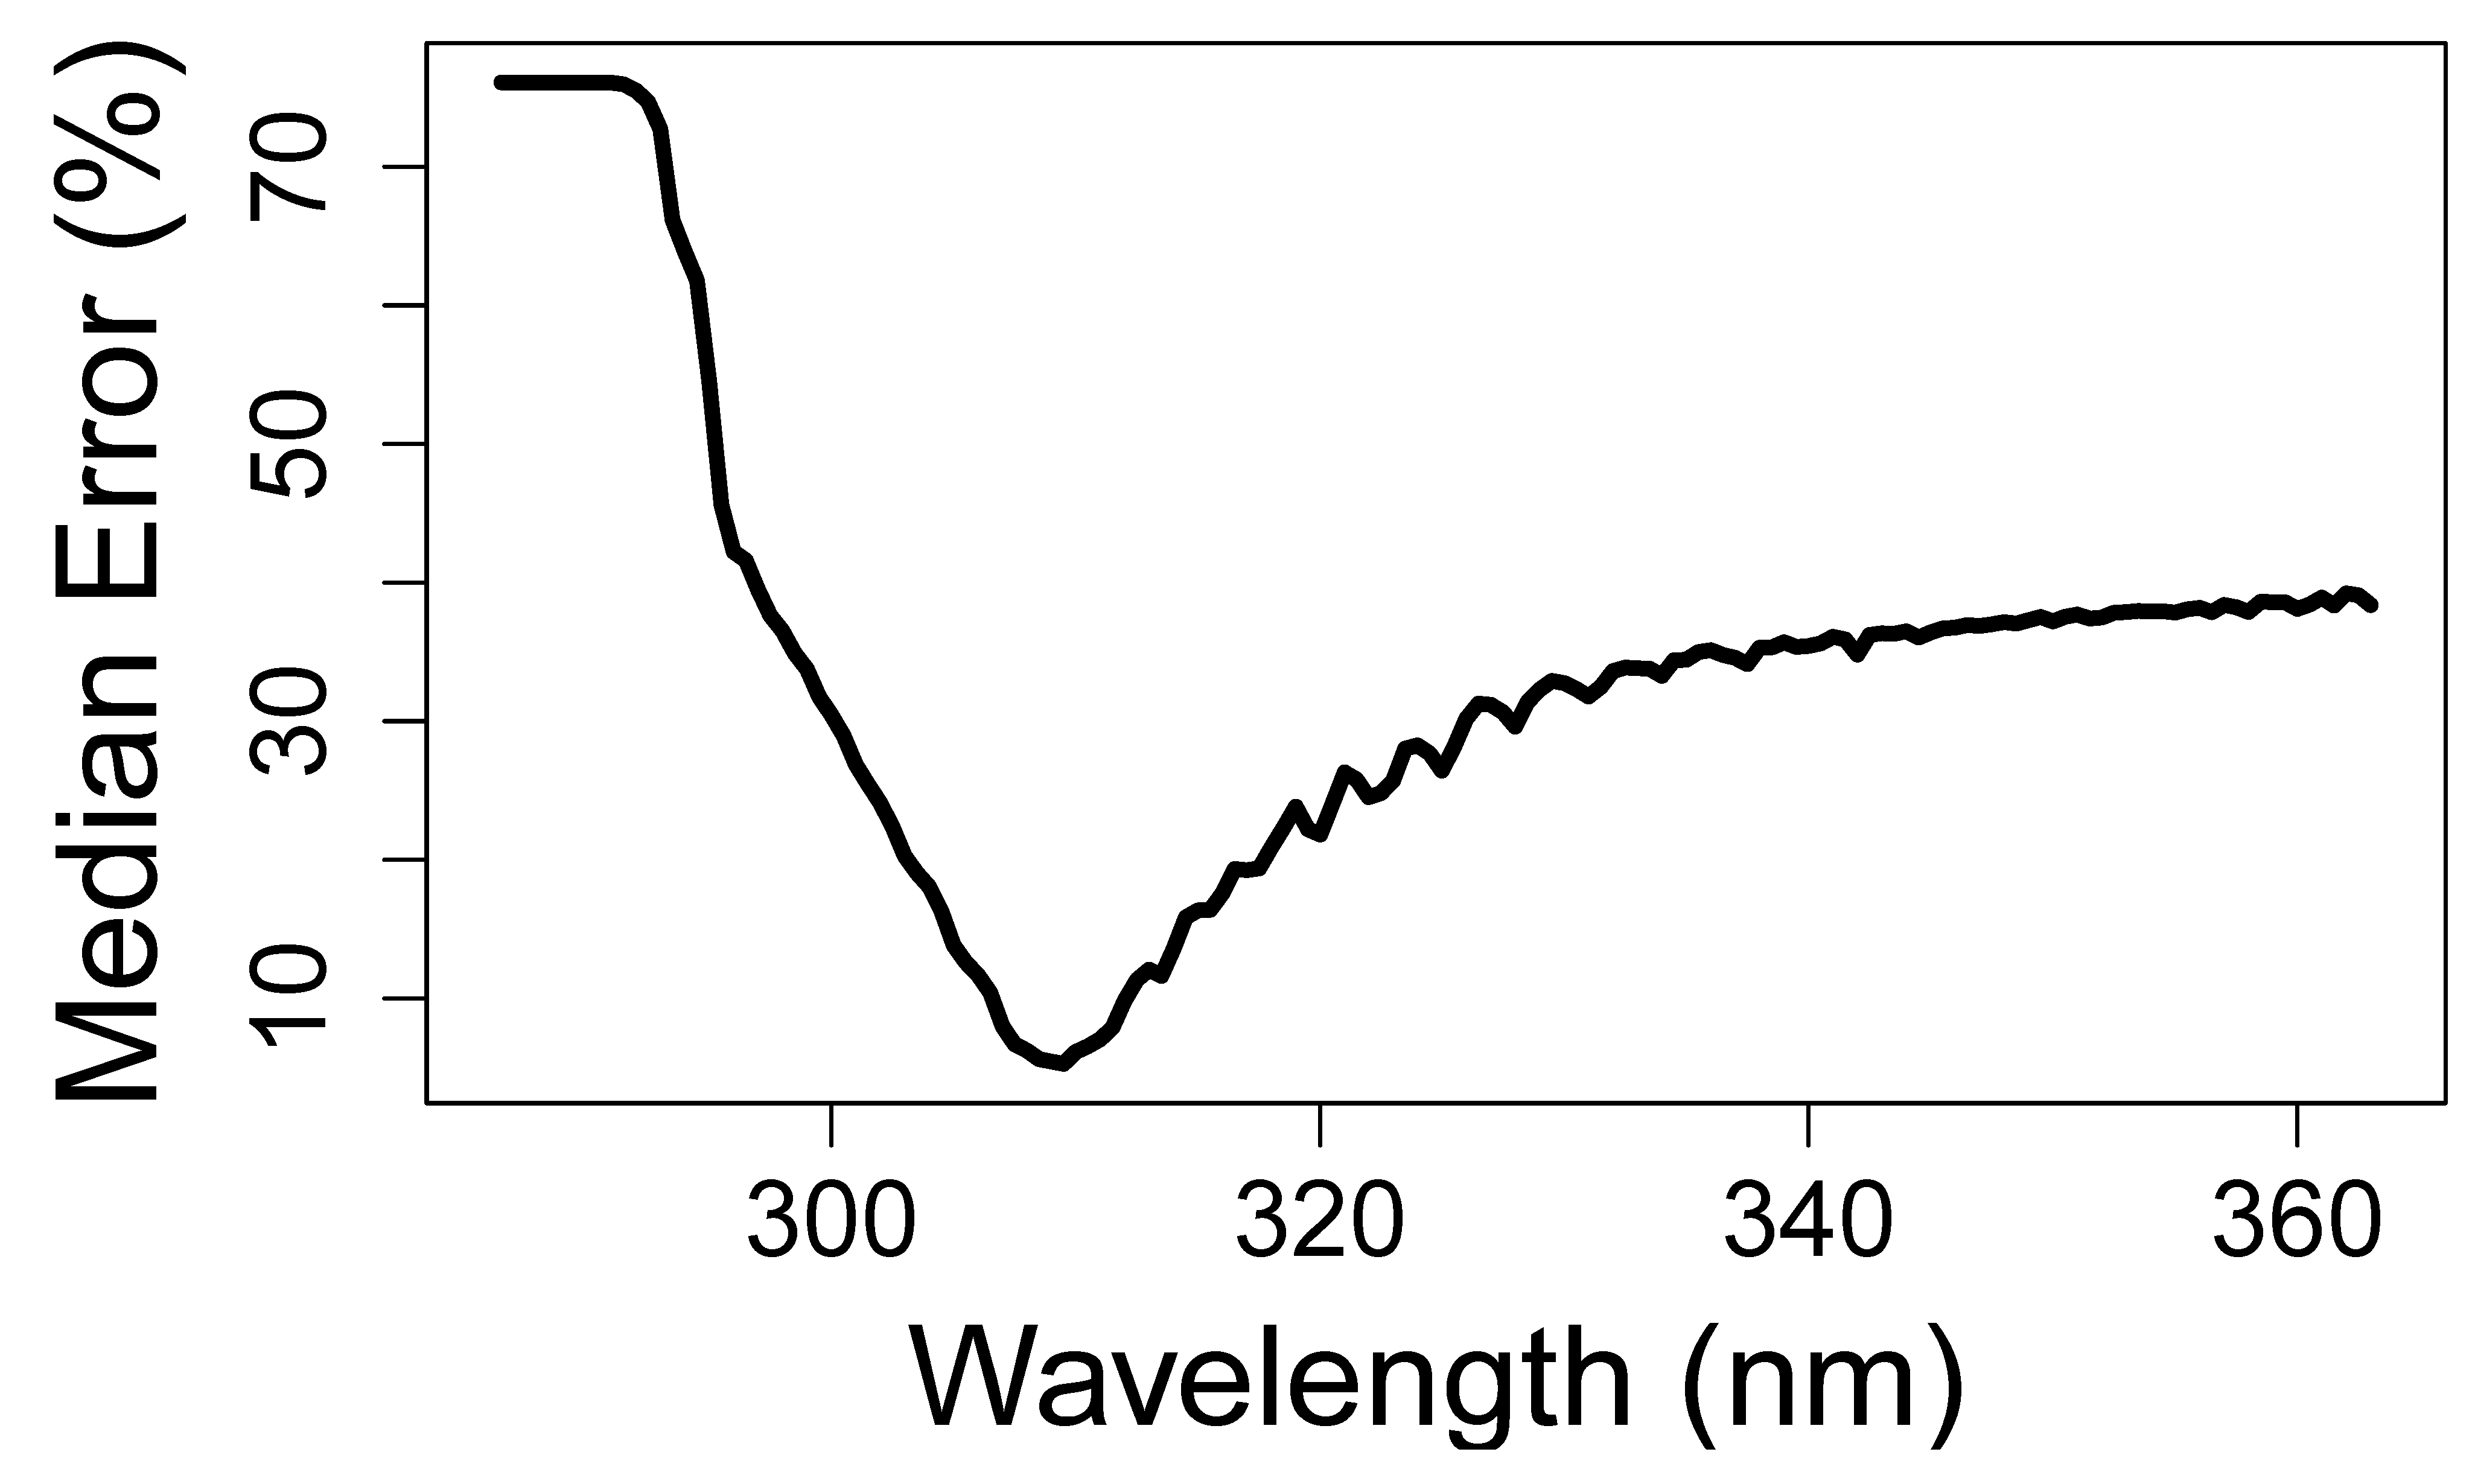
4]. As a measure of accuracy, we calculated the percentage of measurements that the linear regressions predicted to within a given tolerance (%) of the ground-truth value. The variation of accuracy with wavelength is plotted in
Figure 2. The model most commonly yielding both the lowest relative error and the highest overall accuracy is
U =
, 95% confidence intervals (76.62, 76.66) in units of inverse Irradiance or nm-m
2/W and (−0.0166, −0.0145) UVI; R
2 = 0.99. This result is surprising because it survives across all spectra in the database which include those with different ratios of UV-A to UV-B, across ozone fluctuations, and with all observed cloud and aerosol conditions. We know of no physical or optical argument that would lead to the conclusion that such a narrow-band indicator wavelength should exist.
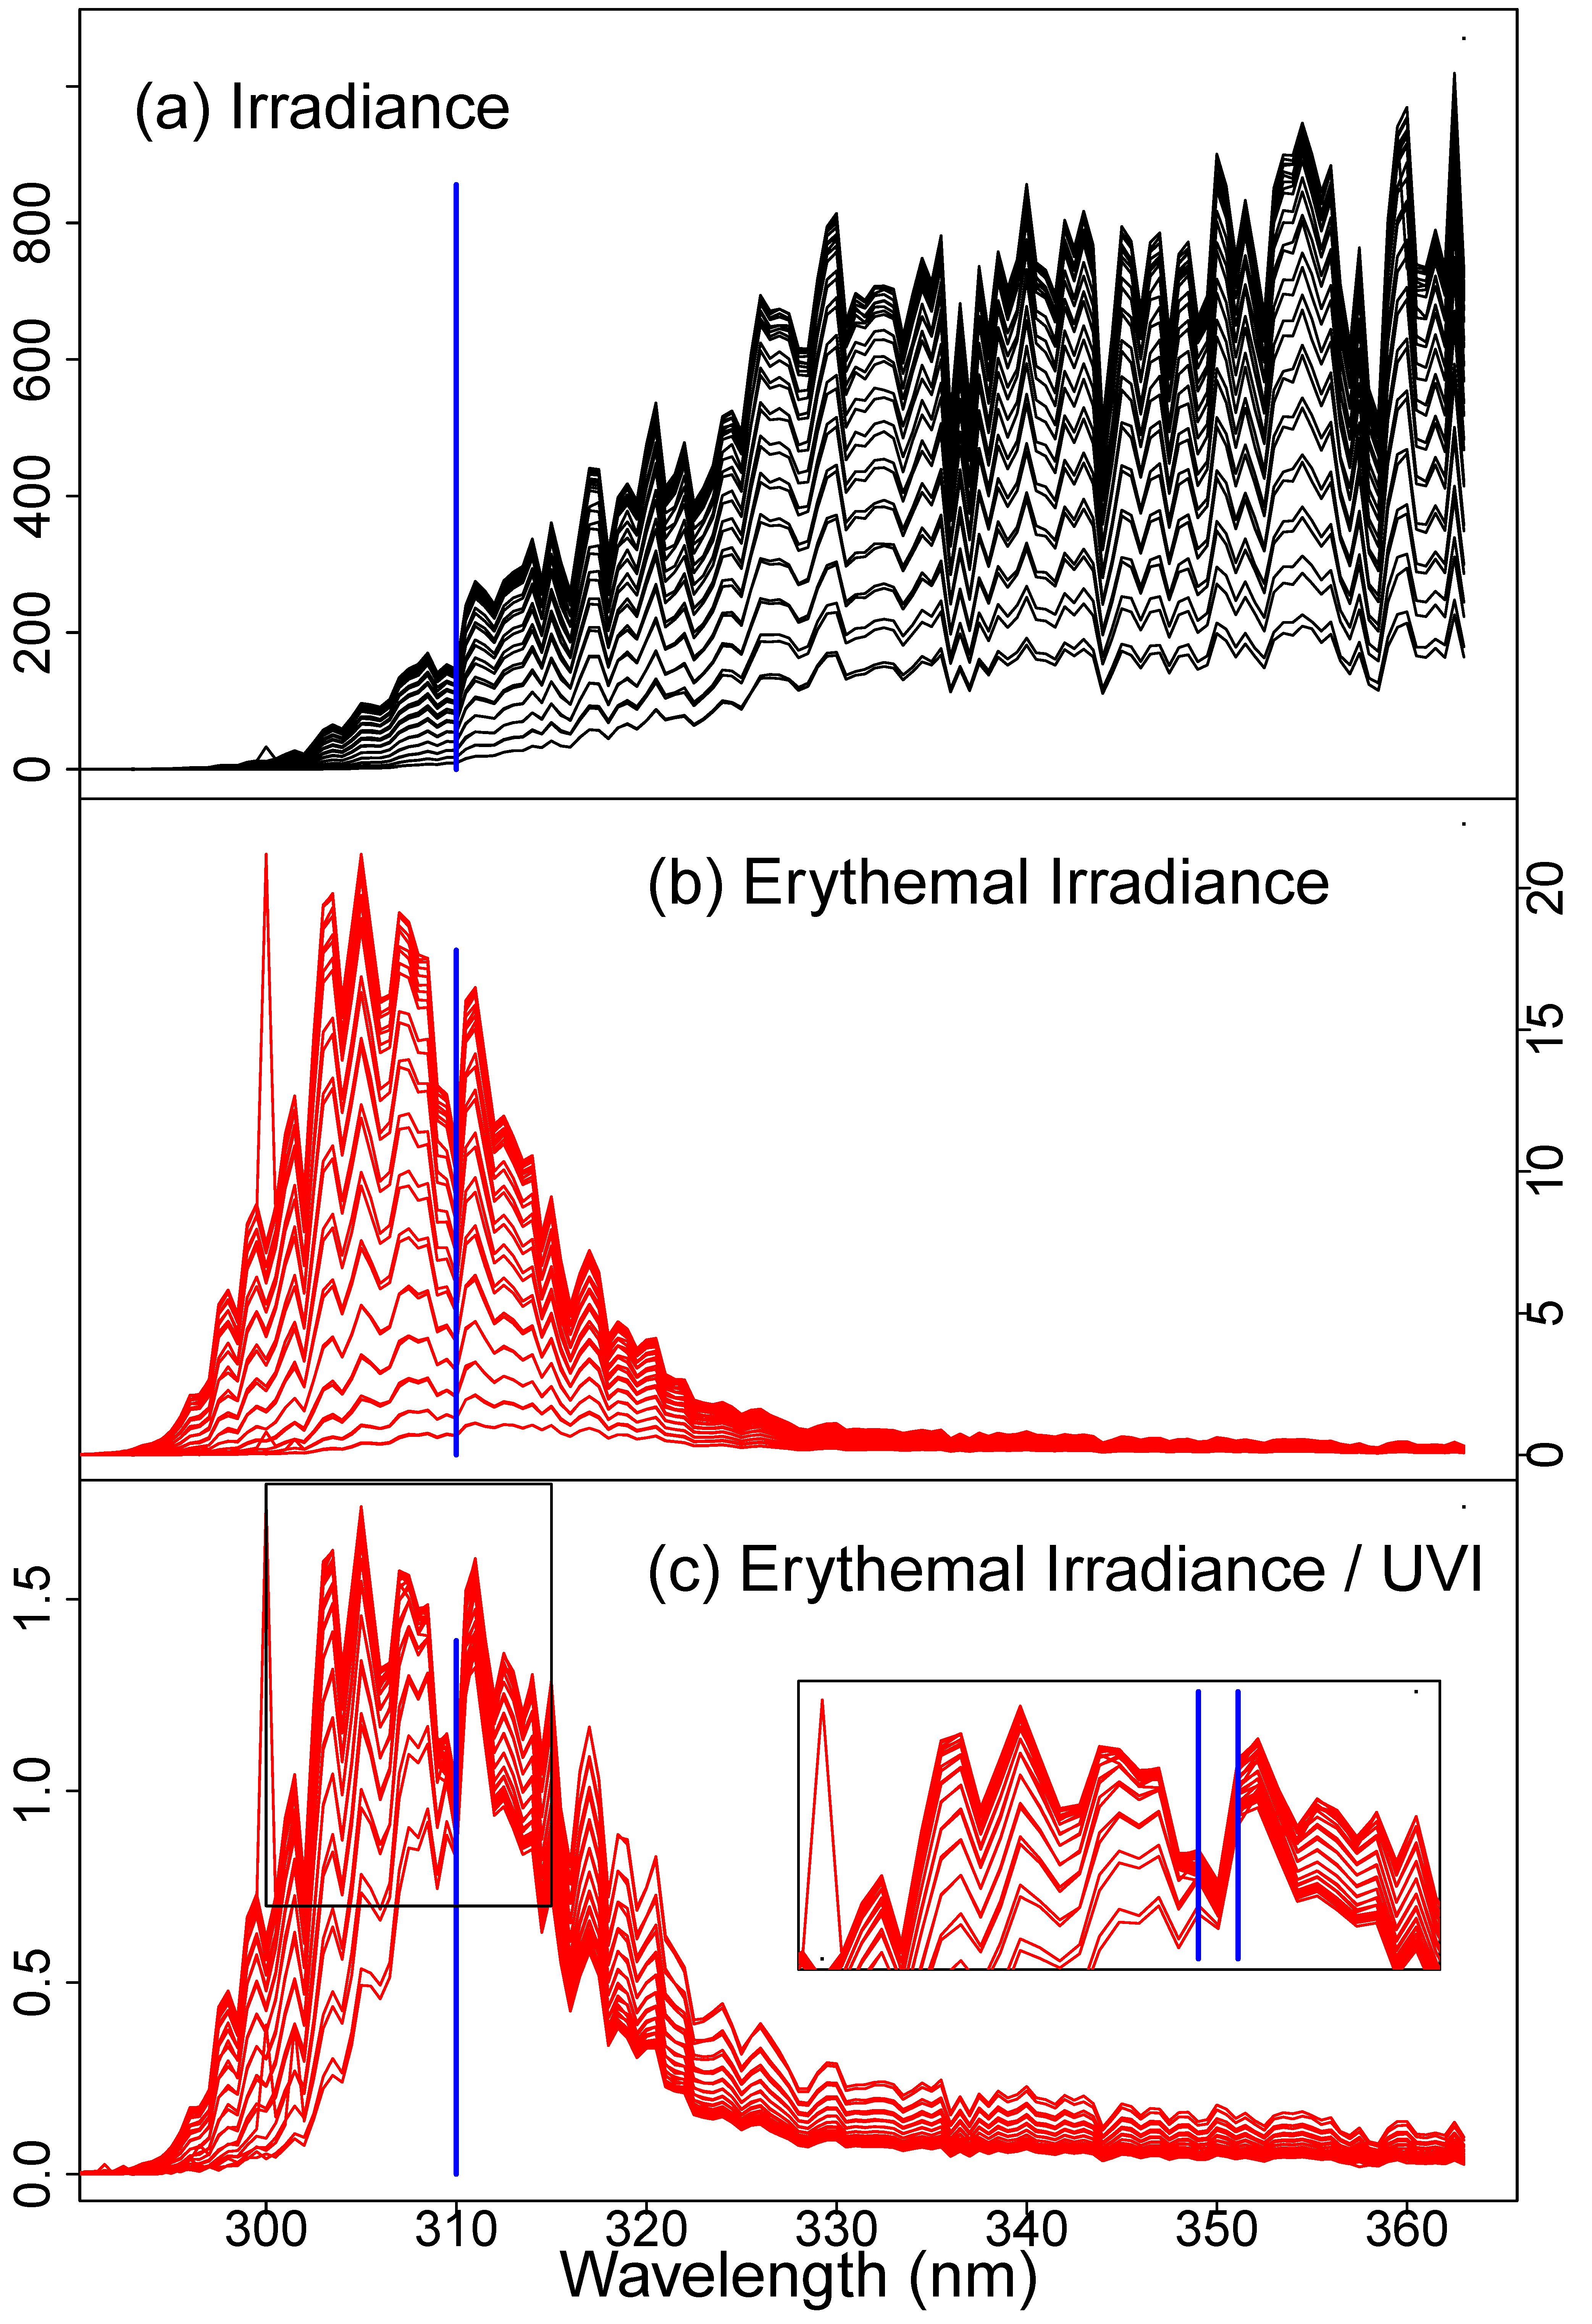
To illustrate this observation, we present a simple graphical derivation in
Figure 3. We first plot (
Figure 3a) all spectra from a single a UV-Net site over a single day for which the UVI exceeded 0.5. The spectra are complex, even after erythemal weighting (
Figure 3b). This complexity is the underlying reason why there are so many discussions of the need to consider both UV–A and UV–B when considering skin risk and protection. However, when each weighted irradiance spectrum is divided by the UVI (
Figure 3c), they converge at 310 nm, and only at 310 nm. The code in the supplementary material enables the reader to re-render
Figure 3 using data from any day at any of the UV–Net sites. The importance of considering actual solar spectra is highlighted by the fact that these spectra vary through the day and do not, in any simple way, resemble any spectrum with fixed ratios of intensities at various wavelengths. Compare the spectra in
Figure 3, for example, to the standard AM1.5 solar spectra (
Figure 1c).
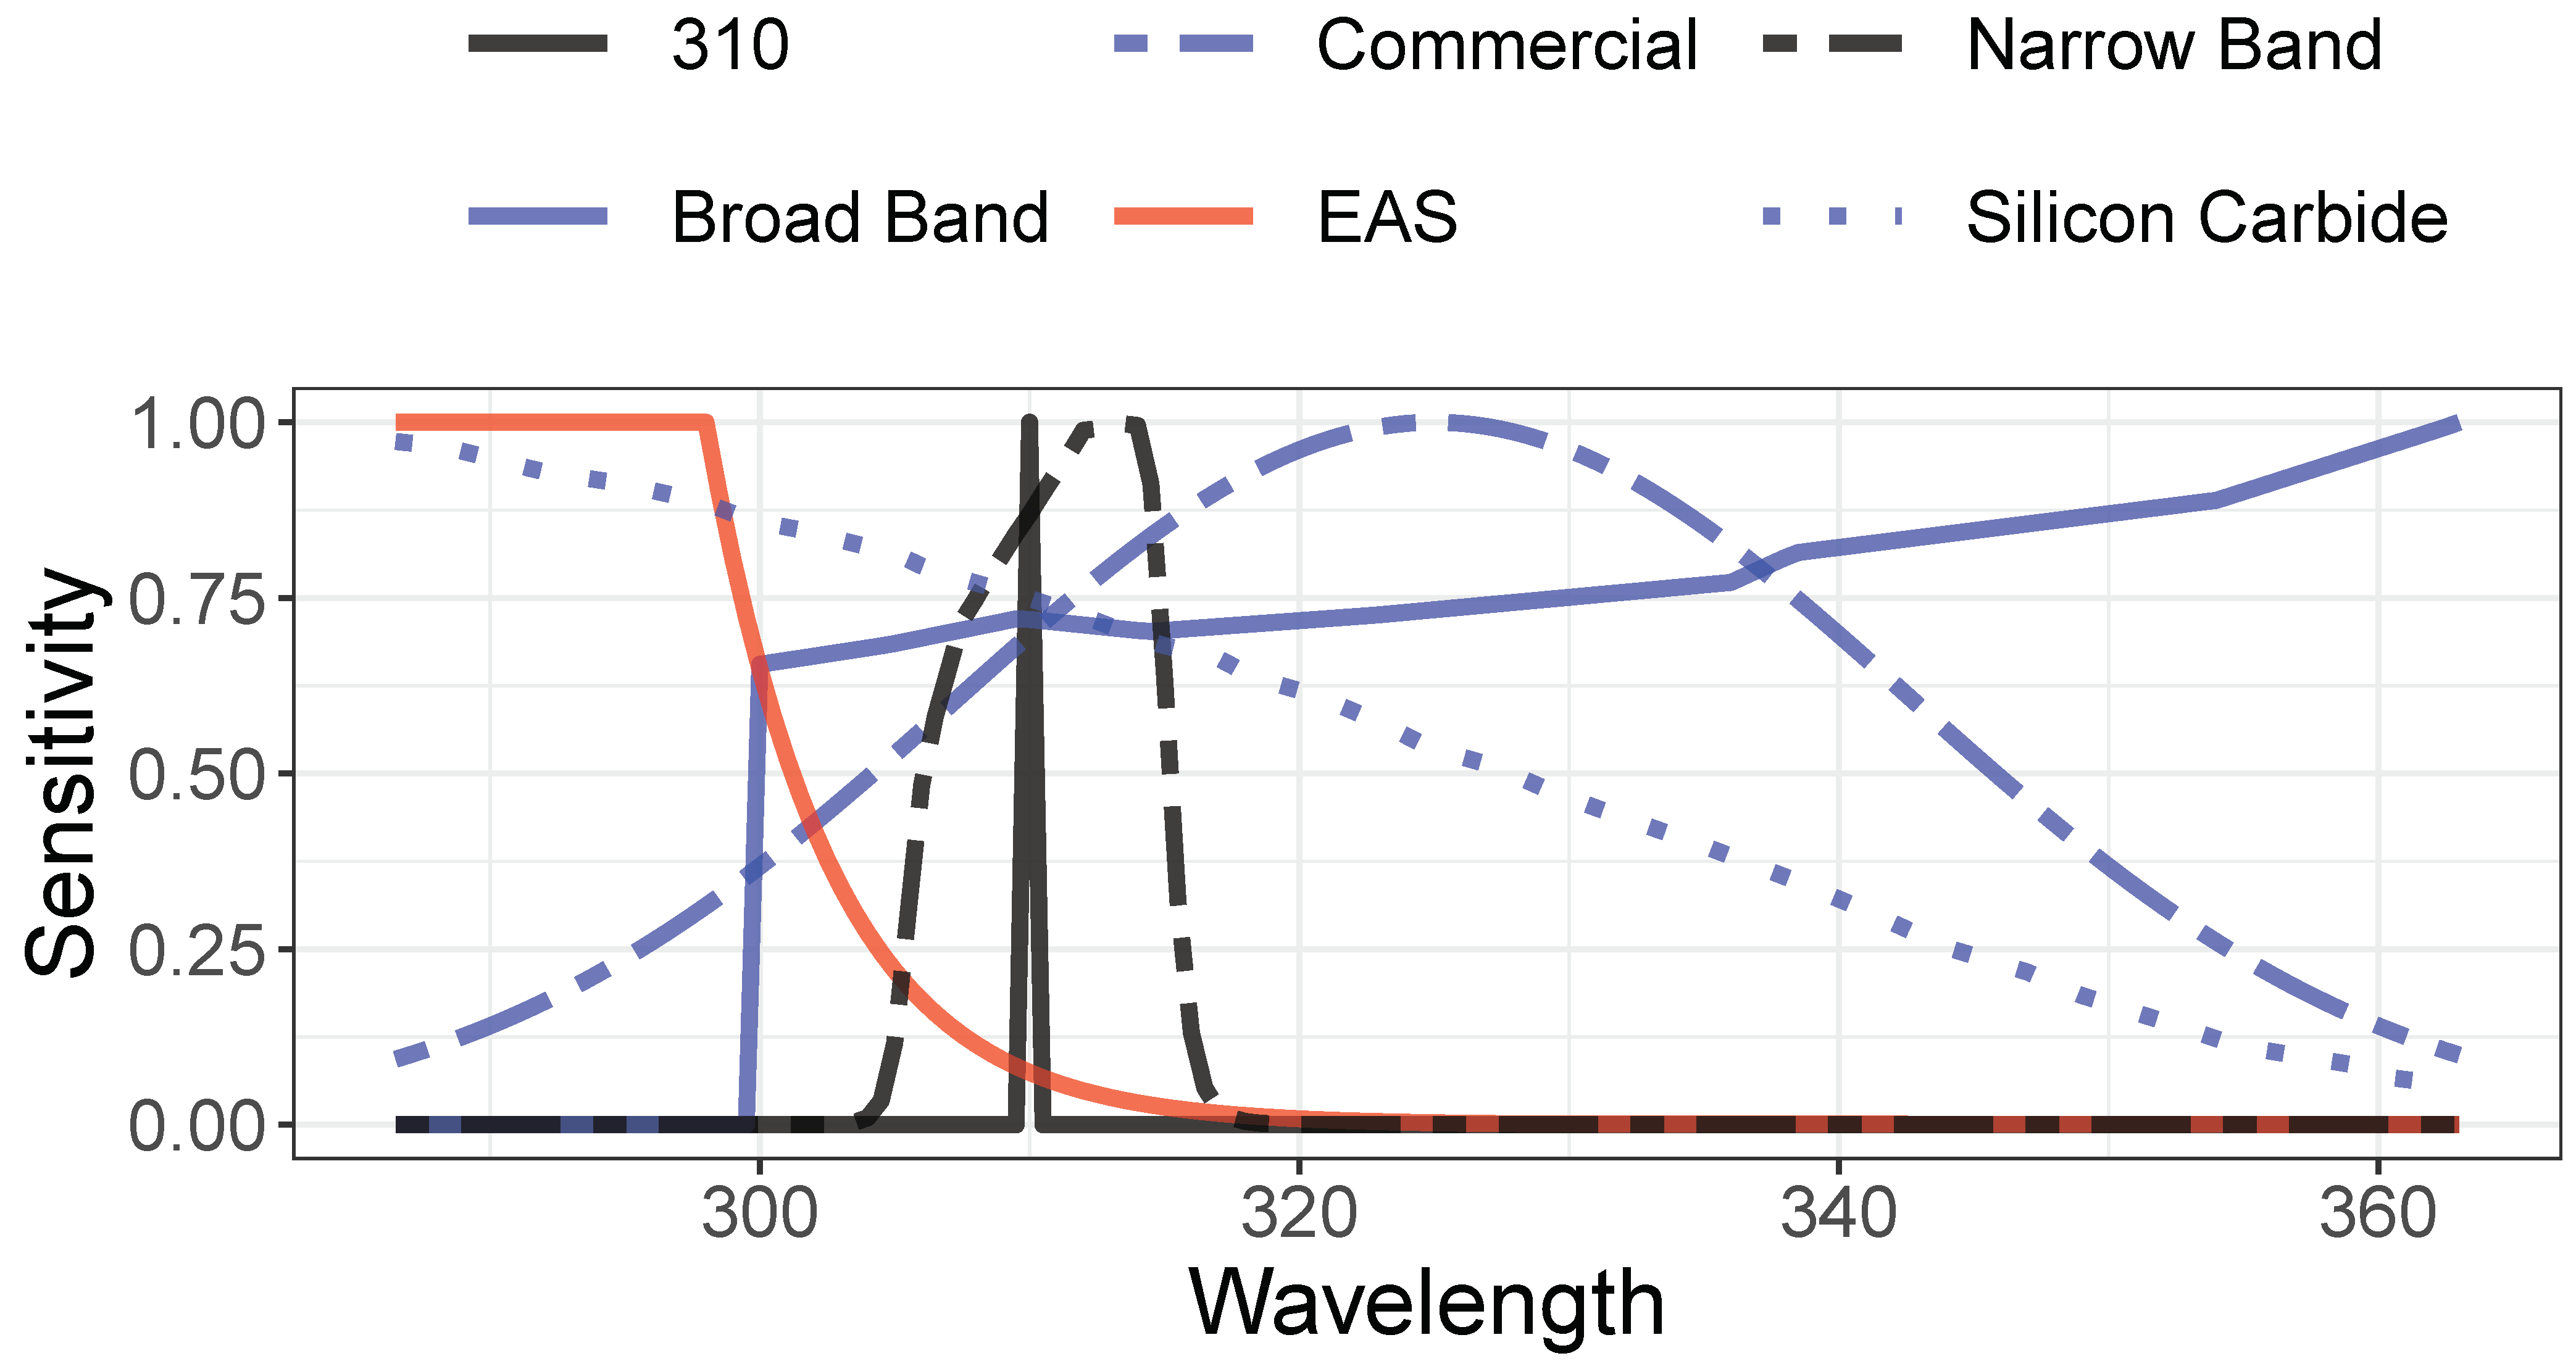
To put this performance in the context of the accuracy of other detector designs, we modeled the performance of several designs. Their spectral sensitivity functions are displayed in
Figure 4. The filters include 310 ± 0.5 nm, a more practical narrow band (NB) design consisting of a spectrally flat detector beneath a commercially available 310 nm bandpass (Alluxa 7365), a bare silicon carbide photodiode (SGS01S–18, SGLux, Berlin, Germany), a commercially packaged detector sold for measuring UVI (VEML6075, Vishay, Malvern, PA, USA), and a broad band (BB) UV detector which we model as a combination of a flat bandpass filter from 300 to 400 nm over a commercial detector (OPT3002, Texas Instruments, Dallas, TX, USA). The wavelength-dependent sensitivity for each commercial device is extracted from its publicly available data. For each detector
d and each UV–Net spectrum
i, we calculated
Mdi, the current expected under each of the UV–Net spectra, built a linear model
U~
Md, and tabulated the expected median detector current, error, and accuracy at 10% tolerance, as described in Methods above. The results, in
Table 1, include the comparative signal strength, mean error, and percentage of measurements accurate to within 10% for each detector.
4. Discussion
Any practical implementation of the 310 nm detector will require considerations of engineering realities. Detector output current, the product of detector sensitivity, filter transmission, and spectral irradiance, is a critical design factor. To explore the reduction in performance for using a real-world detector based on commercially available bandpass filters, we modeled the signal levels and accuracy and expected that implementations designed using the 310 nm insight would perform well. Notably, the detector current achievable with a narrow band filter is 30% of the current expected from a perfect EAS filter due to the exponential cut-off in sensitivity for wavelengths > 298 nm. A complete commercial design is beyond the scope of this paper.
To understand the limitations and applicability of a 310 nm detector, as well as to illustrate the reasons that such a filter might work, we use a simple model for surface UV irradiance. The model, based on a simple single-layer atmosphere, was published by Huber and collaborators [
12]. In the Huber Model, the surface irradiance
depends on only three adjustable parameters,
A,
B, and
z:
A (>0) is the aerosol loss,
B (in nm
−1) grossly captures the wavelength dependence of Rayleigh scattering from water droplet size of various sizes, and
(>0, in molecules/cm
2) is the amount of atmospheric ozone. The model in Equation (2) uses several known quantities including σ, the ozone cross-section (
Figure 1b), an adjustment to the optical path through the ozone layer
where
(between 0 and π/2) is the solar zenith angle, and
, the air mass zero (AM0) solar irradiance spectrum above the atmosphere (
Figure 1a). The model has a remarkable ability to capture the detailed spectral variation of solar UV light. In
Figure 1c, we show the overlap of this model’s predictions on a reference irradiance spectrum. We fit each of the 405,000 UV-Net spectra to Equation (2). The resulting distribution was used to estimate the naturally occurring range of parameters
A,
B, and
z. We then generated a sample of points in the three-dimensional parameter space
A,
B, and
z covering the range centered on the observed values and extending along each axis by two standard deviations. For each set of parameters (
Aj,
Bj,
zj) we calculated the full spectrum, calculated the UVI, and extracted the intensity at 310 nm
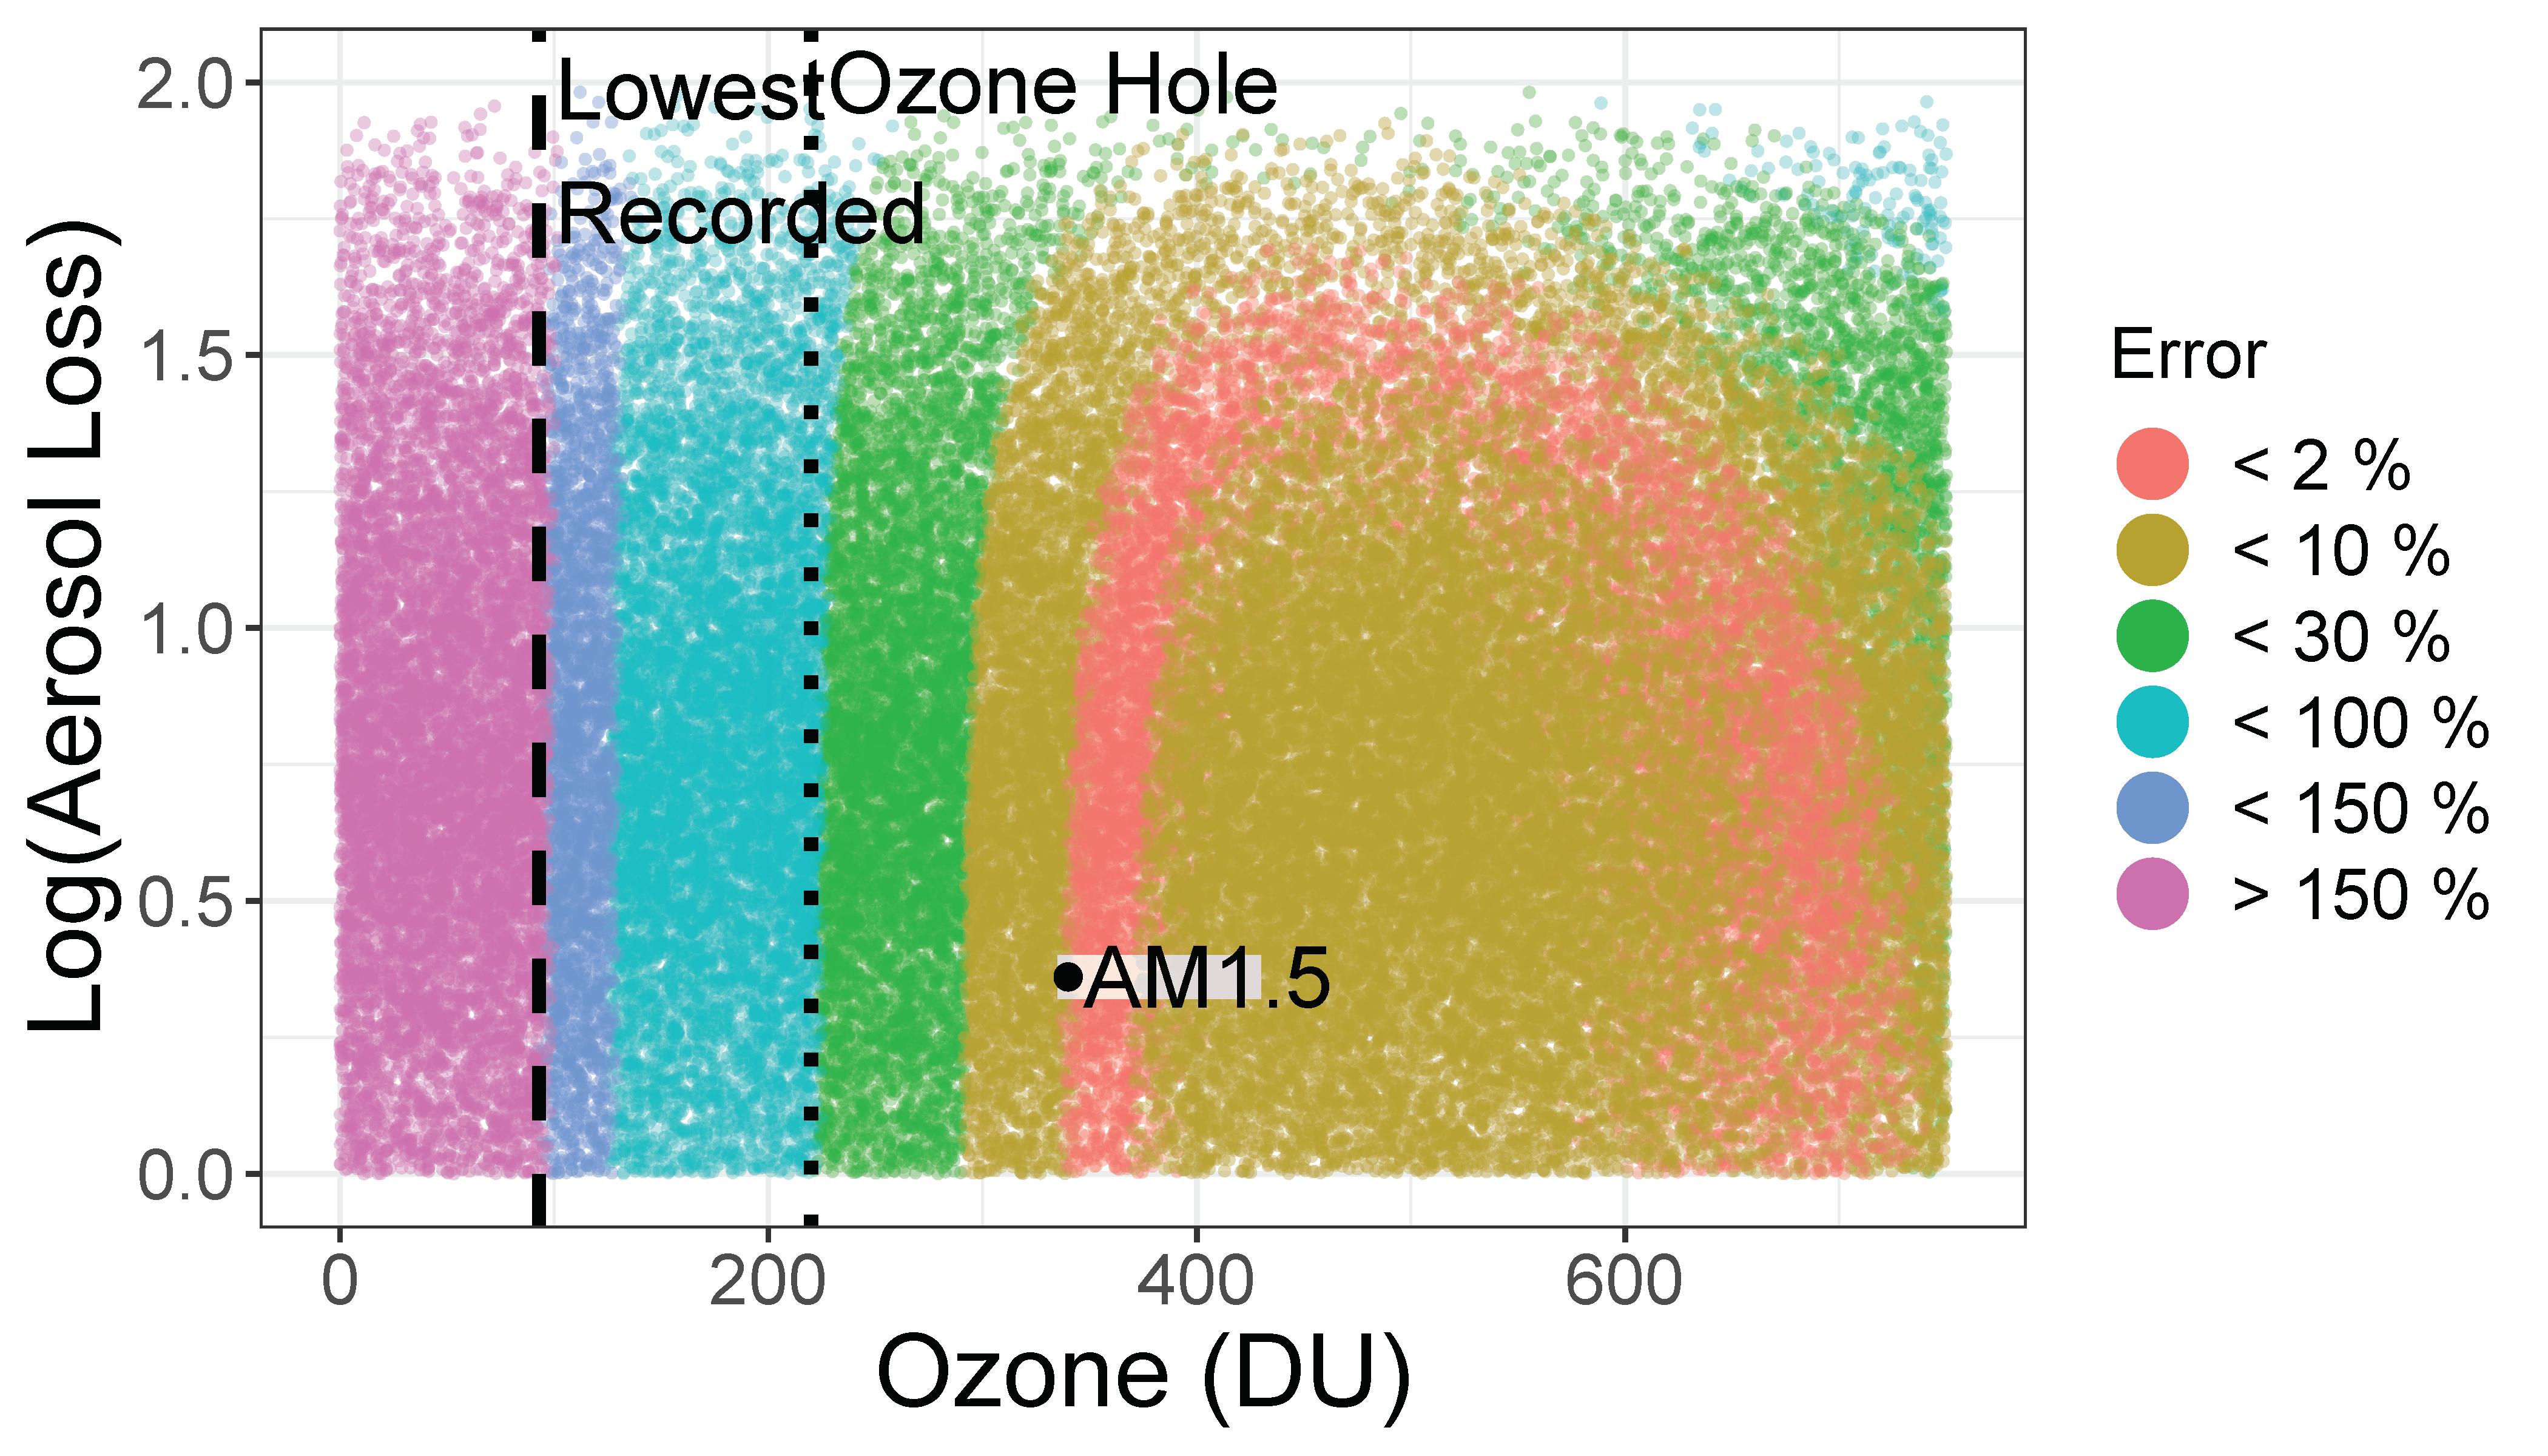
Ij. In
Figure 5, we show the error in the
A–
z projection of this parameter space by coloring each point according to its engineering accuracy,
. Similar projections in the (
A,
B), and (
B,
z) planes show no additional clear boundaries for the model. This diagram can form the basis of an expected range of accuracy for a 310 nm design. Naturally occurring ozone levels are generally in the range of 250–500 Dobson Units (DU) and average 300, the equivalent of a 3 mm thick layer of ozone gas at zero degrees celsius and 1 atmosphere. For reference, at ozone levels below 220 DU (ozone holes), the model begins to underestimate the UVI. The lowest observed ozone level is 93 DU. We expect that using solar irradiance at 310 nm to estimate the UVI should be a valid approach over a wide range of clear and cloudy skies. The Huber Model predicts that the conditions under which the relationship
U =
is off by more than a factor of 1.5 rarely occur.
5. Conclusions
We propose a design for a simple linear detector for the measurement of the UV Index. The detector design is only the first step in building a useful sensor. Limitations of this paper include limiting our analysis to linear models and single-sensor measurement approaches. Geometric factors, including the need to orient the detector and the correct angular sampling of input light, have not been considered. In practice, real-world detector sensitivities may slightly degrade performance (
Figure 4). On the other hand, it is likely that the simple linear estimate based on a single diode can be improved by introducing more complex functional forms and supplementary detectors. From the point of view of sensor engineering, however, starting with the most accurate achievable linear detector is desirable.
The goal of UVI measurement including wearable UVI measurement is to support improved healthy UV behavior. The UVI is a risk communication tool. Most explanations of UV risk are complex as they include the discussion of risk from UV-A and UV-B as well as the duration of exposure. This complex messaging is required, in part, because of the need to highlight that UV-A presents continuing risk even when UV-B is attenuated, for example when the sun is low in the sky and under cloud cover. This work highlights the fact that natural variations in UV-A and UV-B are captured by the UV Index. It remains proportional to
I310 even as the ratio of UV-A to UV-B varies through the day (
Figure 3). It may be that simpler and more meaningful risk communication could be made with just one number, the personal UVI.
Reducing any spectral analysis to one or a few wavelengths is a considerable practical simplification. For example, low-cost blood oxygen measurements depend on the ability to operate with two wavelengths. Here, we have described a simple relationship between the irradiance of the sun at 310 nm and the response of human skin to UV. We have also described a useful method to evaluate the design performance of UV sensors using their spectral sensitivity and a large database of publicly available spectra. We confirmed that our result is sensible in that it is consistent with the existing understanding of UV irradiance using a simple atmospheric model applied to a wide range of conditions. The use of this model provides additional confidence that a detector designed around a detector with peak sensitivity at 310 nm will produce valid results over weather conditions and geographies not surveyed by UV Net.


