Abstract
Accelerometer-based inclinometers have dominated kinematic measurements in previous field studies, while the use of inertial measurement units that additionally include gyroscopes is rapidly increasing. Recent laboratory studies suggest that these two sensor types and the two commonly used angular velocity computational methods may produce substantially different results. The aim of this study was, therefore, to evaluate the effects of sensor types and angular velocity computational methods on the measures of work postures and movements in a real occupational setting. Half-workday recordings of arm and trunk postures, and movements from 38 warehouse workers were compared using two sensor types: accelerometers versus accelerometers with gyroscopes—and using two angular velocity computational methods, i.e., inclination velocity versus generalized velocity. The results showed an overall small difference (<2° and value independent) for posture percentiles between the two sensor types, but substantial differences in movement percentiles both between the sensor types and between the angular computational methods. For example, the group mean of the 50th percentiles were for accelerometers: 71°/s (generalized velocity) and 33°/s (inclination velocity)—and for accelerometers with gyroscopes: 31°/s (generalized velocity) and 16°/s (inclination velocity). The significant effects of sensor types and angular computational methods on angular velocity measures in field work are important in inter-study comparisons and in comparisons to recommended threshold limit values.
1. Introduction
Work-related diseases and disorders are a global concern that effect societies, organizations, and individuals. Pain and disorders in the musculoskeletal system are one of the leading causes of quality-adjusted life-years lost due to ill health and disability [1]. On the society level, the attributed costs of occupational injuries and diseases have been estimated to be 3.9% of the gross domestic product globally, and 3.3% within the EU [2]. The major work-related risk factors for musculoskeletal disorders (MSDs) include awkward postures, frequent movements, forceful exertion postures, heavy manual handling [3,4,5,6,7] and psychosocial factors such as job strain [8]. A large proportion of workers are frequently exposed to these risk factors [9]. The specific risk factors associated with shoulder disorders include extended time with arms in elevated postures [4,10,11,12] and high arm movement velocities [13,14]. For the low back, peak- and cumulative spinal load [15,16], cumulative rest time [17], and high trunk movement velocities [18,19,20] have been associated with low back pain (LBP) or a decline in low back function. While several studies have reported an association between prolonged time in trunk flexion or in trunk axial rotation, and LBP or low back disorders [3,21], others report no significant associations or conflicting results [22,23,24], or negative associations [25]. To compare different studies, and to possibly find the reasons for the different results, it is important to know how the different technologies and methods that are used to measure and analyze the exposures may be compared.
In the last few decades, assessments of biomechanical exposures have predominantly relied on measurements obtained by self-reports and observation-based tools. While both can collect a large range of exposures, they often provide crude estimations of biomechanical exposures. They also often have low reliability and validity for ratings of movements and for upper-limb postures [26,27,28,29,30]. Therefore, technical instruments, such as accelerometer-based inclinometers, may be used to improve the accuracy and precision of these measurements [31]. Accelerometer-based inclinometers are increasingly becoming more accessible, easy-to-use, and less expensive [32], and are thus a feasible option for non-research applications. Consequently, during the last two decades (see Table 1), an increasing number of studies have utilized tri-axial accelerometers to monitor work postures, movements, and physical activity. Threshold limits for upper arm postures and velocities to minimize the risks of developing MSDs have also been drawn from a pool of such studies [14,33].
While accelerometers can produce accurate and precise measurements of inclination angles and angular velocities at low velocities [34,35], they are susceptible to the introduction of errors at high movement velocities [36,37,38,39,40]. Laboratory-based studies with standard movements and simulated work tasks have indicated that these errors can be substantially reduced by additionally utilizing gyroscopes in inertial measurement units (IMUs) [37,40,41]. Specifically, by using linear Kalman filter to integrate accelerometers and gyroscopes, the root mean square of error (RMSE) of inclination angles during simple movements can be maintained under 2° (versus less than 11° by using only accelerometers), and that of angular velocities can be under 10°/s (versus less than 80°/s by using only accelerometers) [37]. The extent to which the differences between accelerometer-based measurement and IMU-based measurement have an impact on measurements in a working population have, according to the best of our knowledge, not previously been investigated. This information is needed to ensure correct comparisons of exposure estimates obtained in studies where different sensor types have been used. The number of studies using integrated sensors in IMUs increased after 2016 (Table 1). Given the increase in the use of IMUs, this information is also needed when comparing new IMU-based measurements as in, e.g., Lind et al. [42], Lind et al. [43], to the recommended threshold limit values based on accelerometer-based measurements [14]. Moreover, this information can also be used for merging results from older and more recent studies to increase the precision on the associations between inclinations and angular velocities of arms and trunk, and MSDs.
Among studies with technical instruments, postural angles and movement velocities have been defined differently in body parts for practical reasons. For the trunk, it can be expressed as sagittal inclination angle and lateral inclination angle. The sagittal inclination angle (i.e., forward angle or flexion angle) is usually of higher amplitude than the side-way ditto [44,45], and it is normally the only angle reported for the trunk [46]. The angular velocity for the trunk movement has commonly been computed as the absolute value of the derivative of the sagittal inclination angle, namely sagittal inclination velocity.
For the arms, the posture is normally described as inclination or elevation angle; that is, “the angle between the upper arm vector and the vertical line” [47]. Two different angular velocity computational methods have been used to estimate arm movements. The first method is the inclination (or elevation) velocity, which is computed using the derivative of the inclination angle. The second, i.e., the generalized velocity [34], includes the sensor rotation around all its axes to compute the angular velocity and is calculated as the angle travelled on the unit sphere per time unit. Contrary to the inclination velocity, the generalized velocity also includes axial arm rotation, which in theory should produce higher velocity values. This difference complicates comparisons between studies that have different angular velocity computational methods (Table 1). The ratio between these two velocities has, according to the best of our knowledge, not previously been examined in field studies. Without this information, it is difficult to conduct inter-study comparisons. It is also difficult to conduct comparisons of study results with recommended threshold limit values that are based on certain computational procedures, such as Balogh et al. [14] and Arvidsson et al. [48], who recommended that the full workday median arm (generalized) velocity should be below 60°/s.
As shown in Table 1, many studies have been carried out that have only measured generalized arm velocity with accelerometers. However, recent studies have begun to use accelerometers with gyroscopes and inclination velocity. Therefore, both sensor type and angular velocity computational method comparisons with field data are needed.

Table 1.
Summary (non-exhaustive) of articles from 2000 to date regarding the measurements of kinematics of arm and trunk by accelerometers or IMUs. Bold reference numbers indicate that the study, in addition of arm posture, also includes trunk posture (and/or velocity).
Table 1.
Summary (non-exhaustive) of articles from 2000 to date regarding the measurements of kinematics of arm and trunk by accelerometers or IMUs. Bold reference numbers indicate that the study, in addition of arm posture, also includes trunk posture (and/or velocity).
| References | Sensor Type | Angular Velocity Computational Method | Posture | Type of Work | Publishing Year | Country of Data Collection |
|---|---|---|---|---|---|---|
| [12,31,38,49,50,51,52,53,54,55,56,57,58] | accelerometers only | - | arm, arm and trunk [31,52,54,56,58] | field | 2004–2020 | Sweden, Denmark, Norway, Brazil, North America, Australia |
| [59,60,61,62] | accelerometers only | arm (inclination velocity) | arm | field | 2008–2013 | Norway, USA |
| [13,14,35,46,63,64,65,66,67,68,69,70,71,72,73,74,75,76,77,78,79,80,81,82,83] | accelerometers only | arm (generalized velocity), arm (generalized velocity) and trunk [46,74,75,76,80,82,83] | arm, arm and trunk [46,74,75,76,80,82,83] | field | 2002–2018 | Sweden, Denmark, Brazil |
| [39,84,85,86,87,88] | accelerometers only | - | arm, arm and trunk [88] | simulated | 2001–2015 | Sweden, Brazil, USA |
| [32,89] | accelerometers only | arm (generalized velocity) | arm | simulated | 2013, 2016 | Sweden |
| [90,91,92,93,94] | accelerometers with gyroscopes | - | arm and trunk | field | 2014–2020 | Sweden, France, Italy, Canada, USA |
| [44,45,95,96,97] | accelerometers with gyroscopes | arm (inclination velocity), arm and trunk [44,95] | arm, arm and trunk [44,45,95,97] | field | 2016–2021 | USA |
| [98,99,100,101,102,103,104] | accelerometers with gyroscopes | - | trunk | field | 2007–2018 | Germany |
| [105,106,107,108] | accelerometers with gyroscopes [106,107,108] or magnetometers [105] | - | arm, arm and trunk [106,107,108] | simulated | 2009–2017 | France, USA |
| [37,109,110] | accelerometers with gyroscopes | arm (inclination velocity), trunk [110] | arm | simulated | 2016–2020 | Italy, USA |
| [40] | accelerometers with gyroscopes | arm (generalized velocity) | arm | simulated | 2017 | Sweden |
The first aim of this study was to investigate the effects of sensor types (using accelerometers only versus using accelerometers with gyroscopes) on measures of postures and movements of the arm and of the trunk in a field study. The second aim was to investigate the effects of angular velocity computational methods, i.e., inclination velocity and generalized velocity, on measures of movements of the arm.
2. Materials and Methods
The computations in this study were carried out on data collected in the field, hence there were no standardized experimental movements, and instead real work movements were included.
2.1. Participants
This study included half-workday recordings of 38 (13 females and 25 males, 35 right-handed and 3 left-handed) warehouse workers (N = 38) performing their normal work. The demographics of the participants are shown in Table 2. All the participants gave their written informed consent prior participation into the study, which was approved by the Regional Ethics Committee in Stockholm, Sweden (2017/1586-31/4).
Table 2.
The demographics of the 38 participants. In self-rated work ability, “0” indicates not being able to work and “10” corresponds to having a work ability at its best [111].
2.2. Work Tasks
The workers performed one of two manual handling tasks: order picking or palletizing (Figure 1). Both tasks involved frequent arm movements, such as grasping, lifting and moving of items with one or two hands.
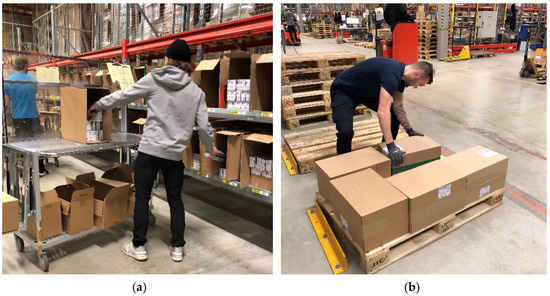
Figure 1.
Samples of work tasks for (a) order picking and (b) palletizing.
The order-picking tasks were performed in separate work areas of about 40–50 m2 that were enclosed by shelves, where single packages and bundles of packages (0.22–11 kg) containing consumer products were stored from ankle to above shoulder level. The packages were picked following a picking order containing information of item names, quantity, and storage location. The packages were manually picked from the shelves into cardboard boxes (dimensions from 20 × 20 × 15 cm to 45 × 30 × 20 cm) that were placed on hand-pushed carts at about waist level. It took about 5–10 min to complete one order, which included about 50–60 packages. During a normal workday, each order picker completed about 45–50 orders, which corresponded to about 2250–3000 packages. The order pickers worked in a standing position or walking, with no possibility for sitting.
When the orders were completed, the cardboard boxes were manually lifted onto a conveyor belt line, which transferred the boxes to the palletizing stations. At the palletizing station, the cardboard boxes (0.40–12 kg) were manually lifted onto a pallet. The pallet was placed on the floor, about 1 m from the line. There, the cardboard boxes were stacked on top of each other up to a level of 180–190 cm. Each palletizer handled the orders of 3–4 order pickers, which summed up to about 135–200 orders per workday.
2.3. Measurements
The postures and movements of the subjects’ trunk and dominant arm were recorded with two six-axis inertial measurement units (IMUs) (AX6, Axivity Ltd., Newcastle, UK, dimensions: 23 × 32.5 × 8.9 mm, mass 11 g). The AX6 (Figure 2e) builds on the triaxial accelerometer AX3 (Axivity Ltd., Newcastle, UK), which has previously been validated for recordings of physical activity [112,113]—and has previously been used for field measurements of arm postures [53]. Both the AX3 and the AX6 are equipped with a triaxial accelerometer, but the AX6 also has a triaxial gyroscope. For this study, the accelerometer range was set to ±8 g, the gyroscope range to ±1000°/s, and the sampling frequency to 25 Hz. This sampling frequency was chosen since it has been shown that there is very little signal power in work–life movements, in frequency bands above 5 Hz [34], and to avoid unnecessarily large data files. The AX6 has an on-board memory. During the measurements, the data was sampled and stored on the unit. After the measurements, the data was transferred via a USB cable to a computer, where digital filtering and analyses were carried out. The IMU on the dominant arm was positioned with its superior edge just distal to the insertion of the medial deltoid muscle [35], while the IMU on the trunk was placed slightly to the right-hand side of the cervico-thoracic spine at the level of the thoracic vertebrae 1–2 [114]. The IMUs were attached using double-sided adhesive tape (VIP3SC) and fixed with a polyurethane film (Opsite Flexifix) [115]. Four reference postures were performed once by each participant and were used in the calibration procedures for the arm and the trunk (Figure 2a–d). The data for these postures were measured before the collection of actual work postures and movements.
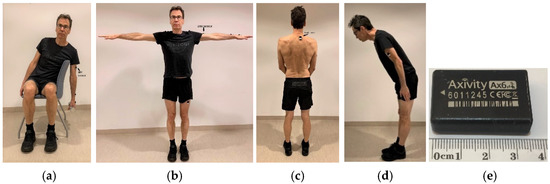
Figure 2.
Calibration procedures for the arm and the trunk showing (a) the reference posture for the arm, (b) the posture for determining the direction of the sensor on the arm, (c) the reference posture for the trunk, (d) the posture for determining the direction of the sensor on the trunk, and (e) the AX6 inertial measurement unit.
For the arm, the reference position (0° arm elevation) was calculated as the median value of a 3-s window when the subjects were seated, leaning with the trunk laterally over the backrest of the chair, and hanging and relaxing the arm vertically while holding a 2 kg dumbbell in the hand (Figure 2a) [35]. To denote the upward direction of the arm, the subjects were told to abduct both arms 90° and to hold the posture for 10 s (Figure 2b). The median value of a stable 3-s window of this posture was used [35]. For the trunk, the subjects were asked to stand up straight looking forward at eye level, to rise up on their toes and slowly return down to a posture with the full shoe sole on the floor, and then stand still in full balance in an upright position (Figure 2c) [35]. The coordinates of this reference position (0° inclination) were computed as the mean value of a 3-s window. To denote the forward orientation of the trunk, the median value of a 3-s window of a forward bow of the trunk at an arbitrary angle was used (Figure 2d) [35].
2.4. Data Processing
Figure 3 shows the data processing steps that were used to calculate the desired angles and angular velocities. Comparisons in this study were conducted between the sensor fusion approaches, i.e., using single data source from accelerometers (acc), and using dual data sources from accelerometers and gyroscopes (acc+gyro), and/or between the angular velocity computational methods, namely inclination velocity and generalized velocity.
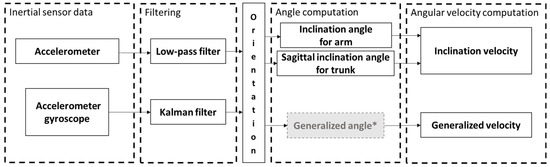
Figure 3.
Flowchart of the data processing procedures. * The generalized angles were not included in this study.
2.4.1. Inertial Sensor Data
The inclination angles and the angular velocities of the arm and the trunk were defined in the coordinates of the corresponding body parts. As the IMUs were configured with an intrinsic coordinate system, readings from the IMUs were first transformed to the body part coordinates, as follows:
where R is defined by the rotation angles needed for this transformation:
After the transformation, the outcomes were used as an input for the further steps.
2.4.2. Filtering
The postures of the arm and trunk were derived from the orientation of the sensor in relation to the accelerometer signal, caused by gravity, that were acquired from the IMUs. The orientations were calculated by two approaches: (1) using only accelerometers without sensor fusion (acc), and (2) using a Kalman filter algorithm with bias compensation to integrate gyroscopes with accelerometers (acc+gyro) [109].
For the acc approach, the readings from the accelerometers were filtered by a 5-Hz low-pass Blackman window-based filter [34]. For the acc+gyro approach, a complementary or a Kalman filter is normally chosen. In this study, we chose, in accordance with recommendations by Chen et al. [109], a Kalman filter with the coefficients used by Chen et al. [109], namely (at a sampling frequency of 128 Hz as used by Chen et al., which we obtained after resampling), 0.005 rad/s for the gyroscope white noise, 0.0005 rad/s2 for the gyroscope bias noise and 0.1 m/s2 for the accelerometer white noise [109]. After the Kalman filter, the angle signal was again resampled, to the original frequency of 25 Hz.
The results of this step were orientations of the corresponding body part, which were further used to calculate angles and angular velocities (Figure 3).
2.4.3. Angle Computation
The calculation of the arm inclination angle was adapted from Yang et al. [40], and was based on the angular displacement from the reference position (Figure 2a):
where is the gravitation vector at any given time as and is the gravitation vector at the reference position as . Both vectors are normalized to the unit sphere.
The sagittal inclination angle of the trunk was calculated as the forward/backward projections in Hansson et al. [34].
2.4.4. Angular Velocity Computation
For the arm, both the inclination velocity and generalized velocity were calculated. The inclination velocity of each body part was determined as the derivative of the inclination angle with respect to time.
To derive the generalized velocity, the generalized angle was first calculated by using an equation equivalent to the one used by Hansson et al. [34]:
where is the gravitation vector at any given time as , and is the gravitation vector of the previous sample as . Both vectors were normalized to the unit sphere. The generalized velocity was, then, calculated as the derivative of the generalized angle with respect to time. For the trunk, only the sagittal inclination velocity was calculated. It was calculated as the derivative of the sagittal inclination angle. All velocity values were finally converted to their absolute value.
2.4.5. Statistical Analysis
Postural angles and angular velocities were first computed as individual measures including mean values, percentiles, percentile ranges, and proportions of time meeting specific criteria. Those individual measures were then averaged and presented on group level as group measures. The effects of the sensor types and the angular velocity computational methods were evaluated by comparing the group measures that were obtained by the corresponding methods, such as using accelerometers only (acc) versus using accelerometers with gyroscopes (acc+gyro). The Shapiro–Wilk test was used for examining normality of data. Additionally, since t-test is robust to slightly skewed and kurtotic distributions, distributions having a skewness below 2.0 and kurtosis below 6.0 were considered (sufficiently) normally distributed as well [116]. For sufficiently normally distributed data, paired t-test were applied, while the Wilcoxon signed-rank test was used for non-normally distributed data. A p-value of 0.01 was used to denote statistically significance due to the multiple comparisons among the measures. Additionally, a correlation analysis was performed to compare the angles and the velocities (10th, 50th and 90th percentile) between acc and acc+gyro. The Pearson correlation coefficient was calculated after the confirmation of the normality of the data. A linear model was used to fit the inclination data, and a zero-intercept linear model was used for the angular velocity data. The distribution of the differences over the average values of each compared pair was further plotted in a Bland–Altman plot. The statistical analysis was performed in MATLAB R2019b (MathWorks, Inc., Natick, MA, USA).
3. Results
Both the inclination angles and the angular velocities differed between the sensor types; that is, accelerometers alone (acc) and accelerometers with gyroscopes (acc+gyro) (Figure 4).
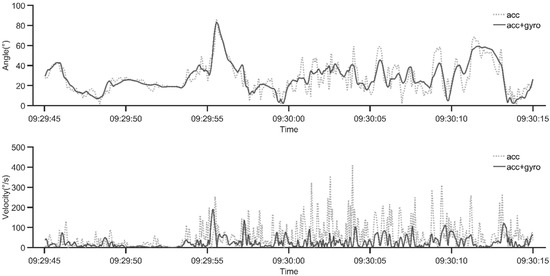
Figure 4.
A sample illustrating the differences of the inclination angle (above) and the inclination velocity (below) of the arm, using measurements based on only accelerometers (acc), and using accelerometers with gyroscopes (acc+gyro).
3.1. Comparison of Inclination Angles
For the arm, Table 3 shows the group mean values and standard deviations (SD) of all measures. The mean value and the 1st–90th percentiles of the inclination angle measured by acc were significantly lower (p < 0.0001) than the corresponding values by acc+gyro. However, all differences were less than 2°. There was no significant difference in the 99th percentile arm inclination angle or in the percentile range between acc and acc+gyro. As for the distribution of the inclination angles in time, the proportion of time of arm inclination <20° was significantly higher for acc (p < 0.0001) than by acc+gyro, while the proportion of time of the arm inclination angles >30°, >45°, >60° (p < 0.0001) and >90° (p < 0.001) were lower by acc than by acc+gyro. Again, the differences were small (all < 3%).
Table 3.
Group mean values and standard deviations (SD) of measures for the arm inclination angles and the trunk sagittal inclination angles measured using only accelerometers (acc) and by using accelerometers with gyroscopes (acc+gyro), and the group mean differences (SD) of the comparison between those two sensor types (N = 38).
For the trunk sagittal inclination (Table 3), no significant differences were observed in either the mean or median trunk inclination angles between acc and acc+gyro, while the 1st–25th percentiles of the trunk sagittal inclination angles (forward bending) were significantly lower for acc than for acc+gyro (p < 0.0001), and the 75th–99th percentile angles were significantly higher (p < 0.0001) for acc than for acc+gyro. These differences were all less than 2°. The percentile range was 2.7° higher for acc than for acc+gyro (p < 0.001). The proportion of time of trunk inclination <20° was significantly lower for acc than for acc+gyro, and the proportion of time of trunk inclination angles >30°, >45° and >60° were higher for acc than for acc+gyro (p < 0.001). Again, the differences were all small (<1.5%).
As shown in Figure 5a,c, the two sensor types (acc and acc+gyro) were strongly correlated (r > 0.98) for the 10th, 50th and 90th percentiles of both the arm inclination angles and the trunk sagittal inclination angles. As illustrated by the Bland–Altman plots in Figure 5b,d, the average differences in inclination angles between acc and acc+gyro were the smallest at the 50th percentile for both the arm and the trunk. For the arm, these average differences also showed a tendency to increase with increased percentile angles (Figure 5b). For the trunk, this tendency was not prominent (Figure 5d).
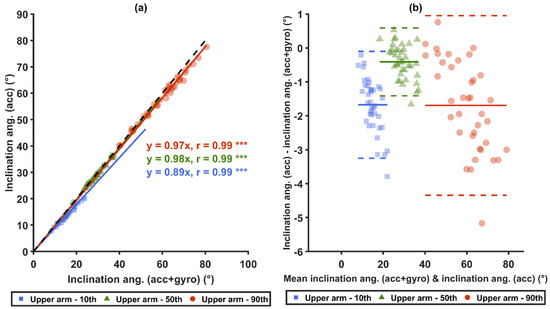
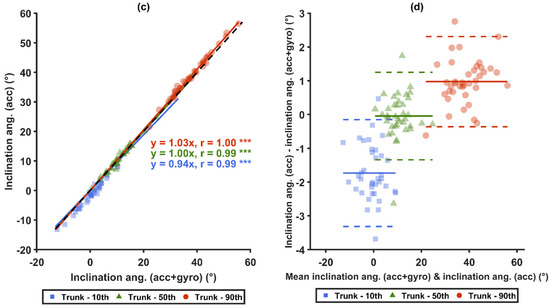
Figure 5.
Comparisons of inclination angles measured between the two sensor types (acc versus acc+gyro) for the arm and for the trunk. Graphs (a,b) show the arm inclination angles of acc and acc+gyro, while (c,d) show the trunk sagittal inclination angles between acc and acc+gyro. In (a,c), the black-dashed lines represent unity, and the colored-solid lines represent the zero-intercept linear prediction models of the corresponding percentiles. In (b,d), Bland–Altman plots are shown: the colored-solid lines mark the mean values of the differences of the corresponding percentiles, and the dashed lines represent ±1.96 SD. *** denotes p < 0.0001.
3.2. Comparisons of Angular Velocities
Statistically significant differences were found among all the measures from both arm angular velocity computational methods and from both sensor types in all three comparison pairs: (1) acc versus acc+gyro, (2) generalized velocity versus inclination velocity, and (3) generalized velocity with acc versus inclination velocity with acc+gyro (Table 4).
Table 4.
Group mean values and standard deviations (SD) of inclination velocity and the generalized velocity of the arm measured by accelerometers only (acc) and accelerometers with gyroscopes (acc+gyro), and the group mean differences (SD) of the comparisons between the two angular velocity computational methods and the two sensor types (N = 38).
When comparing the two sensor types (Table 4), the mean values and the 5th–99th percentiles of both angular velocities from acc were between 60% and 207% higher than the corresponding measures from acc+gyro (p < 0.0001). The differences increased with increased velocity. For both angular velocity computational methods, the proportion of time at slow movements (<5°/s) in all angles and in neutral arm inclination angles (<15° and <20°) were significantly lower from acc+gyro than from acc (p < 0.0001), and the proportion of time at fast motion (>90°/s) from acc was significantly higher than from acc+gyro (p < 0.0001).
When comparing the two angular velocity types (Table 4), the mean values and the 5th–99th percentiles of the generalized velocity were between 26% and 267% higher than those of the inclination velocity for both sensor types (p < 0.0001). The differences increased with the increase of the angular velocity. Within both sensor types, the proportion of time at slow movements (<5°/s) in all angles and in neutral arm inclination angles (<15° and <20°) were all significantly lower for the generalized velocity than for the inclination velocity (p < 0.0001). The proportion of time at fast movements (>90°/s) of the generalized velocity was significantly higher than of the inclination velocity (p < 0.0001).
When comparing the generalized velocity from acc, which was used in recommendations from Balogh et al. [14] and Arvidsson et al. [48], to the inclination velocity from acc+gyro, the mean values and all the 5th–99th percentiles of generalized velocity from acc were between 167% and 780% higher than the latter (p < 0.0001). The differences were from 3.9°/s for the 5th percentile up to 259.9°/s for the 99th percentile. The proportion of time at slow movements (<5°/s) in all angles and in neutral arm inclination angles (<15° and <20°) for the generalized velocity from acc were significantly lower than for the inclination velocity from acc+gyro (p < 0.0001), and the proportion of time at fast motion (>90°/s) for the generalized velocity from acc was significantly higher than ditto from acc+gyro (p < 0.0001).
Strong correlations (r ≥ 0.85) were found for the 10th, 50th and 90th percentiles between the two sensor types, i.e., acc and acc+gyro (Figure 6a,c), and between the two angular velocity computational methods (Figure 7a,c). Significant correlations were also found between the generalized velocity for acc and the inclination velocity for acc+gyro (Figure 8a). As illustrated by the Bland–Altman plots in Figure 6b,d, Figure 7b,d and Figure 8b, the differences in the three mentioned comparisons showed a tendency to increase with increased velocities.
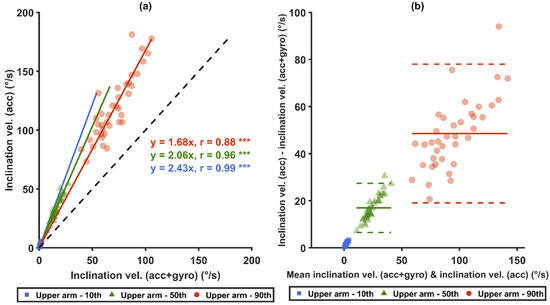
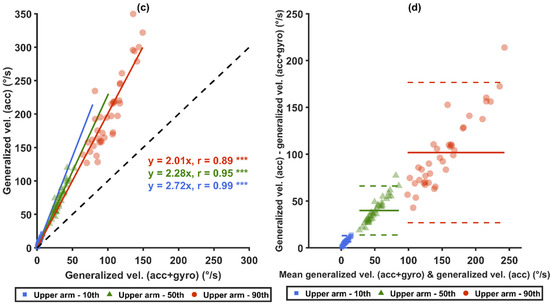
Figure 6.
Comparisons between arm angular velocities measured from different sensor types. Graphs (a,b) show the inclination velocities of acc and acc+gyro, while (c,d) show the generalized velocities of acc and acc+gyro. Correlation plots are shown in (a,c): the black-dashed lines represent unity, and the colored-solid lines represent the zero-intercept linear prediction models of the corresponding percentiles. In (b,d), Bland–Altman plots are shown: the colored-solid lines mark the mean value of the differences, and the dashed lines represent ±1.96 SD. *** denotes p < 0.0001.
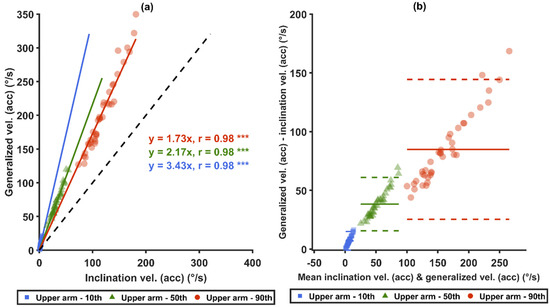
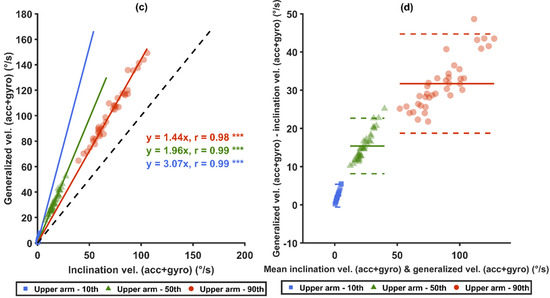
Figure 7.
Comparisons between the different arm angular velocity computational methods. Graphs (a,b) present the generalized velocities and the inclination velocities from acc, while (c,d) present the generalized velocities and the inclination velocities from acc+gyro. Correlation plots are shown in (a,c): the black-dashed lines represent unity, and the colored-solid lines represent the zero-intercept linear prediction models of the corresponding percentiles. In (b,d), Bland–Altman plots are shown: the colored-solid lines mark the mean value of the differences, and the dashed lines represent ±1.96 SD. *** denotes p < 0.0001.
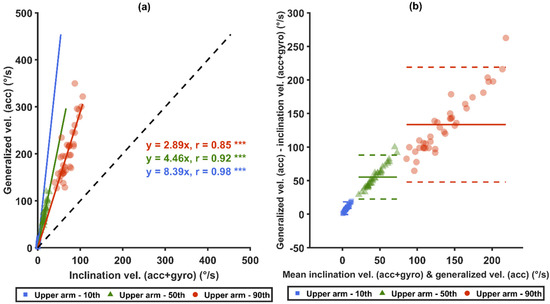
Figure 8.
Comparisons between the generalized velocities from acc and the inclination velocities from acc+gyro. Correlation plots are shown in (a): the black-dashed lines represent unity, and the colored-solid lines represent the zero-intercept linear prediction models of the corresponding percentiles. In (b), Bland–Altman plots are shown: the colored-solid lines mark the mean value of the differences, and the dashed lines represent ±1.96 SD. *** denotes p < 0.0001.
When comparing the two sensor types for the trunk (Table 5), the mean values, the 5th–99th percentiles and the percentile range of the sagittal inclination velocities from acc were between 117% and 200% (relative differences calculated from Table 5) higher than from acc+gyro (p < 0.0001). The proportion of time at slow movements (<5°/s) in all angles and in neutral trunk inclination angles (between −10° and 20°, <15°, and <20°) from acc were all less than half than those from acc+gyro (p < 0.0001), and the proportion of time at fast motion (>90°/s) from acc was about 17 times higher than from acc+gyro (p < 0.0001).
Table 5.
The group means (SD) for the trunk sagittal inclination velocity measured by using only accelerometers (acc) and by using accelerometers with gyroscopes (acc+gyro), and the group mean differences (SD) between those two sensor types (N = 38).
As illustrated in Figure 9a, the two sensor types (acc and acc+gyro) were correlated (r > 0.86) for the 10th, 50th, 90th percentiles of the sagittal inclination velocities. The Bland–Altman plots (Figure 9b) show that differences between the sensor types increased with the increase of the measured values.
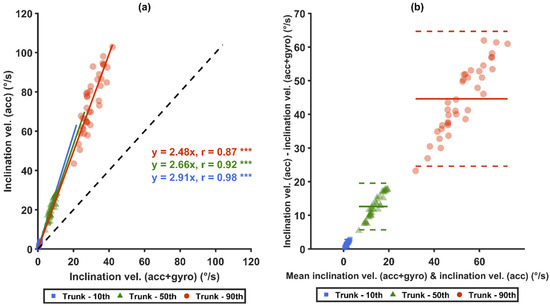
Figure 9.
Comparisons of trunk sagittal inclination velocities measured between two sensor types (acc and acc+gyro): (a) shows the correlation plot: the black-dashed lines represent unity, and the colored-solid lines are the zero-intercept linear prediction model of the corresponding percentile; (b) shows the Bland–Altman plot: the colored-solid lines mark the mean value of the differences, and the dashed lines represent ±1.96SD. *** denotes p < 0.0001.
4. Discussion
This field study included half-workday measurements of 38 warehouse workers. When compared to using accelerometers with gyroscopes—using accelerometers alone had a significant but generally small effect (<2°) on the measures of inclination angles. However, the effects of sensor types on the measures of both angular velocity computational methods were significant and substantial. Angular velocities from acc were about twice as high as those from acc+gyro for the two angular velocity computational methods. Furthermore, the arm generalized velocity, which included arm axial rotation, showed significantly higher values (26–267%) in measures of arm movements than those of the inclination velocity.
4.1. Methodological Considerations
One strength of this study was that it comprised measurements of trained warehouse workers performing their normal occupational work tasks, as opposed to the simulated work tasks or movements as those used in previous studies that compared the effects of sensor types on measurements of angles and velocities. In comparison to simulated work, real occupational work likely includes a broader range of complexity of movements. As shown by Yang et al. [40], the increased complexity in tasks (simulated/real work versus simple arm swing) may amplify the errors introduced by sensor types and angular velocity computational methods even when the velocity range is similar (see Section 4.2 and Section 4.3). However, future studies are required to further investigate the extent to which the differences observed in this study also exist at a similar level in a broad range of occupations.
Another strength of this study is the sample population: both male and female workers were included. Although a balanced gender-sample could have been argued for, the female proportion in this study (34%), is relatively high when compared to the 22% among warehouse (and terminal) workers in Sweden [117]. The sample size (N = 38) was substantially larger than those in the previous laboratory-based studies that included simulated work; that is, 10 participants [40] and 11 participants [109]. As always in workplace exposure assessments, there were variances between workers (see Table 3, Table 4 and Table 5). The studied work was of repetitive nature, so per worker the half workday data collection should be sufficient. Considering the very low p-values in the comparisons, the sample size was likely to be sufficiently high for the sensor and computational comparisons that were performed. Other methodological procedures may also contribute to differences in results between studies, such as the reference positions [32,68], the placement of the sensors [85,118], and possibly soft-tissue artifacts [119,120]. In the current study, such variances were overcome by the use of paired comparisons.
Optical systems with multiple cameras are usually considered as the gold standard for motion tracking. However, this study targeted to evaluate the difference between commonly used sensor types and angular computational methods. Therefore, an optical motion tracking system was not suitable given the aims of this study. Additionally, several studies have demonstrated that inclination velocities from IMUs that applies a fusion of accelerometer and gyroscopes are close to those of optical systems [37,40,91,109]. Third, since the study was carried out in a real occupational setting of ambulatory work, the feasibility of using optical systems is restricted.
4.2. The Effects of Sensor Types: acc Versus acc+gyro
For postures, the result of acc showed similar percentile values of arm inclination angles (<2°) as those based on the accelerometers with gyroscopes, acc+gyro, and the differences of the angles in percentiles between the two sensor types did not exhibit a dependency on the measured value. This result is consistent with that of Chen et al. [37], who reported differences <1.8° in all percentiles between acc and acc+gyro during movements of slow arm swings.
In contrast, there were large relative differences in arm velocity between the two sensor types. For example, the mean inclination velocities from acc were 2–3 times higher than those from acc+gyro, i.e., 1.8°/s higher for the 10th percentile, 16.9°/s higher for the 50th percentile and 48.5°/s higher for the 90th percentile. These differences were larger when compared to those of both Yang et al. [40] and Chen et al. [37]. Yang et al. [40] reported differences in inclination velocity attributed to the sensor type of <4°/s at the 50th percentile and <12°/s at the 90th percentile during arm swings for inclination velocities that were similar to those in this study. Chen et al. [37] reported differences in inclination velocity attributed to the sensor type of <30°/s at the 90th percentile during arm swings of inclination velocities that were similar or faster than those in this study. One reason for these differences could be that Chen et al. [37] used a 3-Hz low-pass filter for acc while in this study a 5-Hz low-pass filter [34] was used. Another reason, although probably less important, could be hardware differences given that the parameters for the Kalman filter were the same as Chen et al. [109] (after resampling to the same frequency), but the accelerometers and gyroscopes in this study were not identical to those in Chen et al. [37], Chen et al. [109]. A third reason could be the higher complexity of movements in the real work. As explained by Bernmark and Wiktorin [39], centripetal acceleration is a major source of errors for accelerometer-based measurement. The more complex the work task becomes, the more and higher centripetal acceleration is involved; hence, the larger the errors become.
The differences in the angular velocities between the sensor types increase from lower percentile rank to the higher percentile rank, which was also observed by both Yang et al. [40] and Chen et al. [37]. This may be explained by two reasons: velocity and percentile rank. For velocity, it was demonstrated by Bernmark and Wiktorin [39] that centripetal acceleration is a major source of errors for accelerometers, and it is proportional to the square of angular velocity. The higher the percentile rank is, the higher the velocity value is; ergo, the higher the centripetal acceleration becomes, which leads to higher differences between the two sensor types. Another result in this study that likely resonates this explanation is that although a strong correlation (r > 0.85) was found between the two sensor types within the 10th, 50th and 90th percentiles for both inclination angles and angular velocities, the differences were also non-linearly dependent on the velocities. Only one brand of sensors was used in this study. However, systematic difference in angular velocities between accelerometers only and accelerometers fused with gyroscopes are in agreement with previous laboratory-based studies where other brands of sensors have been used [37,40]. Current sensors on the market are in general of low noise and high precision. Therefore, the large differences observed in the current study is unlikely due to the choice of brands of sensors, but due to the errors from using only accelerometers.
In summary, this study clearly shows that velocities from studies that have used different sensor types should not be compared directly, but may be compared after a conversion. In this study, the acc velocities were found to be approximately twice as high as the acc+gyro velocities (Figure 6a,c). However, further studies are needed to establish a more detailed conversion model.
4.3. The Type of Angular Velocity: Generalized Velocity versus Inclination Velocity
Our results show that the two angular velocity computational methods resulted in substantially different values. When using the same sensor type, the 50th and the 90th percentiles of the generalized velocity for acc were 116.4% and 71.3% higher than those of inclination velocity, respectively. The corresponding comparison for acc+gyro was 97% and 45%, respectively. These substantial velocity differences are consistent to the findings in Yang et al. [40].
The velocity differences between two sensor types were larger for the generalized velocities than for the inclination velocities, which agrees with the results by Yang et al. [40]. It is suggested that the generalized velocity is more sensitive to errors introduced by the sensor type. The generalized velocity consists of the inclination velocity and the velocity of the axial rotation, and it must be equal to or larger than the inclination velocity. This addition of a velocity component introduces an additional component of centripetal acceleration, which likely explains why generalized velocity has a higher sensitivity to measurement errors than inclination velocity does.
4.4. Velocity Conversions
As shown in Figure 8a, the median acc+gyro inclination velocity can, in this study with the present median velocities, approximately be converted to median acc generalized velocity by a conversion factor of 4.46. Alternatively, one can first convert the median acc+gyro inclination velocity to the median acc inclination velocity by a factor of 2.06 (Figure 6a), and then convert that result to the median acc generalized velocity by a factor of 2.17 (Figure 7a). This gives a total factor of 4.47, which is close to the measured factor of 4.46 for the one-step conversion in Figure 8a.
4.5. Practical Implications
Laboratory studies on this issue have been performed previously, but, to the best of our knowledge, this is the first study that has evaluated the effects of sensor types on assessments of postural loads and movements, and the effects of angular velocity computational methods, in a real occupational work.
For postures, there were only minor differences between the percentiles from different sensor types, which indicates that acc and acc+gyro studies can be directly compared. Meanwhile, for velocities, the sensor types and the angular velocity computational methods have substantial effects on the values: the average median acc inclination velocity was about twice as high as that from acc+gyro, and the median acc+gyro generalized velocity was about twice as high as that of inclination velocity. When combining the two factors, the median generalized velocity from acc was about 4.5 times as high as the median inclination velocity from acc+gyro. Thus, angular velocities measured with different methods should not be compared without a conversion. In some of the arm velocity studies in Table 1 [45,96,97], results of inclination velocity from acc+gyro have been compared with studies using the generalized velocity from acc. Hence, in the future, such comparisons should be done after conversions, either by using the factors above or using more detailed models.
Additionally, action levels and threshold limit values for wrist and arm velocities have been recommended [14,48]. The recommended threshold limit value for arm velocity is 60°/s and is based on generalized velocity and acc measurements in many different occupational groups [14,48]. If the results of acc+gyro and/or inclination velocity should be compared with that threshold limit value, then the level needs to be lowered in accordance with the previous paragraph. By matching the individual distributions of the other velocities to the acc generalized velocities, more accurate thresholds could be acquired for each of the other velocities—for instance, if an acc generalized velocity of 60°/s was at one subject’s 56th percentile, the equivalent thresholds for the other three velocities can for this subject be found at the 56th percentile of the corresponding velocity. According to this transformation, using the average of all subjects, the threshold level of 60°/s should be lowered to 26.6°/s for acc inclination velocity, to 26.4°/s for acc+gyro generalized velocity, and to 12.9°/s for acc+gyro inclination velocity. The results showing that conversion is needed have practical implications for both researchers and, e.g., occupational health services aiming to use the recommended threshold limit values or comparing results to those obtained using different sensor types or angular velocity computational methods.
As shown in Figure 6, Figure 7 and Figure 8, the factors mentioned above (i.e., 2 and 4.5) are approximate, and the relative differences increase with the velocity. As the current study includes only one occupational group, the converted recommended threshold limit values may not be generalized to other occupations. Therefore, further studies are required to explore optimal nonlinear conversion models, and to determine if specific conversion models are needed in different occupations.
5. Conclusions
Previously, inclination and velocity results of different sensors and of different computational methods have been compared as if they were fully comparable. In the present results both the sensor types and the angular velocity computational methods showed significant effects on the measures of postures and movements in warehouse work. For the posture angle percentiles, the differences were below clinical relevance (<2°), which indicates that the 10th, 50th and 90th percentiles from accelerometers (acc) can be compared with percentiles from accelerometers with gyroscopes (acc+gyro). For movements, the differences of the velocity percentiles were substantial, for instance, at the 50th percentile: acc was about double as high as acc+gyro, e.g., 33°/s versus 16°/s for inclination velocity, and for the angular velocity computational methods, the generalized velocity was about double as high as the inclination velocity, e.g., 31°/s versus 16°/s for acc+gyro. The generalized velocities from acc were about 4.5 times as high as the inclination velocities from acc+gyro, e.g., 71°/s versus 16°/s at the 50th percentile. Hence, movement velocities of different computational methods and from different sensor types should not be directly compared. Both researchers and practitioners, who aim to compare velocities with recommended threshold limits, should check if they can compare directly or if a conversion is needed.
This study included only one occupational group. Future studies are needed to investigate the effects of sensor types and angular computational methods on kinematic measurements among other occupational groups. There is a need for conversion models between data obtained by different sensor types and angular velocity computational methods.
Author Contributions
Conceptualization, X.F., C.M.L. and M.F.; methodology, X.F., C.M.L. and M.F.; software, X.F. and M.F.; validation, X.F. and M.F.; formal analysis, X.F., C.M.L. and M.F.; investigation, X.F., C.M.L., I.-M.R. and M.F.; resources, X.F., C.M.L., I.-M.R. and M.F.; data curation, X.F., C.M.L., I.-M.R. and M.F.; writing—original draft preparation, X.F., C.M.L., I.-M.R. and M.F.; writing—review and editing, X.F., C.M.L., I.-M.R. and M.F.; visualization, X.F., C.M.L., I.-M.R. and M.F.; supervision, C.M.L. and M.F.; project administration, C.M.L.; funding acquisition, X.F., C.M.L., I.-M.R. and M.F. All authors have read and agreed to the published version of the manuscript.
Funding
This research was funded by the AFA Insurance (Afa Försäkring), grant numbers 180098 and 180254. X.F. was partially funded by China Scholarship Council, grant number 201600160060.
Institutional Review Board Statement
The study was conducted according to the guidelines of the Declaration of Helsinki, and approved by the Regional Ethics Committee in Stockholm, Sweden (2017/1586−31/4).
Informed Consent Statement
Informed consent was obtained from all subjects involved in the study.
Data Availability Statement
The data that support the findings of this study are available on reasonable request from the corresponding author C.M.L. The data are not publicly available due to them containing information that could compromise research participant consent.
Acknowledgments
The authors want to thank the participants and the company where the data was collected. The authors also want to thank Howard Chen at Auburn University for his consultation and support of the Kalman filter that we used in this study.
Conflicts of Interest
The authors declare no conflict of interest. The funders had no role in the design of the study; in the collection, analyses, or interpretation of data; in the writing of the manuscript, or in the decision to publish the results.
References
- Murray, C.J.L. Global, regional, and national disability-adjusted life-years (DALYs) for 359 diseases and injuries and healthy life expectancy (HALE) for 195 countries and territories, 1990–2017: A systematic analysis for the Global Burden of Disease Study 2017. Lancet 2018, 392, 1859–1922. [Google Scholar] [CrossRef]
- Tompa, E.; Mofidi, A.; van den Heuvel, S.; van Bree, T.; Michaelsen, F.; Jung, Y.; Porsch, L.; van Emmerik, M. The Value of Occupational Safety and Health and the Societal Costs of Work-Related Injuries and Diseases; Publications Office of the European Union: Luxembourg, 2019. [Google Scholar]
- Lotters, F.; Burdorf, A.; Kuiper, J.; Miedema, H. Model for the work-relatedness of low-back pain. Scand. J. Work. Environ. Health 2003, 29, 431–440. [Google Scholar] [CrossRef]
- Van Rijn, R.M.; Huisstede, B.M.; Koes, B.W.; Burdorf, A. Associations between work-related factors and specific disorders of the shoulder--a systematic review of the literature. Scand. J. Work. Environ. Health 2010, 36, 189–201. [Google Scholar] [CrossRef] [PubMed]
- Sluiter, J.K.; Rest, K.M.; Frings-Dresen, M.H. Criteria document for evaluating the work-relatedness of upper-extremity musculoskeletal disorders. Scand. J. Work. Environ. Health 2001, 27 (Suppl. S1), 1–102. [Google Scholar] [CrossRef] [PubMed]
- NRC. Musculoskeletal Disorders and the Workplace: Low Back and Upper Extremities; National Research Council and Institute of Medicine: Washington, DC, USA, 2001. [Google Scholar]
- Punnett, L. Musculoskeletal disorders and occupational exposures: How should we judge the evidence concerning the causal association? Scand. J. Public Health 2014, 42, 49–58. [Google Scholar] [CrossRef]
- Hauke, A.; Flintrop, J.; Brun, E.; Rugulies, R. The impact of work-related psychosocial stressors on the onset of musculoskeletal disorders in specific body regions: A review and meta-analysis of 54 longitudinal studies. Work Stress 2011, 25, 243–256. [Google Scholar] [CrossRef]
- Eurofound. Sixth European Working Conditions Survey; Publications Office of the European Union: Luxembourg, 2016. [Google Scholar]
- Van der Molen, H.F.; Foresti, C.; Daams, J.G.; Frings-Dresen, M.H.W.; Kuijer, P. Work-related risk factors for specific shoulder disorders: A systematic review and meta-analysis. Occup. Environ. Med. 2017, 74, 745–755. [Google Scholar] [CrossRef] [PubMed]
- Mayer, J.; Kraus, T.; Ochsmann, E. Longitudinal evidence for the association between work-related physical exposures and neck and/or shoulder complaints: A systematic review. Int. Arch. Occup. Environ. Health 2012, 85, 587–603. [Google Scholar] [CrossRef]
- Hanvold, T.N.; Waersted, M.; Mengshoel, A.M.; Bjertness, E.; Veiersted, K.B. Work with prolonged arm elevation as a risk factor for shoulder pain: A longitudinal study among young adults. Appl. Ergon. 2015, 47, 43–51. [Google Scholar] [CrossRef]
- Nordander, C.; Hansson, G.A.; Ohlsson, K.; Arvidsson, I.; Balogh, I.; Stromberg, U.; Rittner, R.; Skerfving, S. Exposure-response relationships for work-related neck and shoulder musculoskeletal disorders—Analyses of pooled uniform data sets. Appl. Ergon. 2016, 55, 70–84. [Google Scholar] [CrossRef]
- Balogh, I.; Arvidsson, I.; Bjork, J.; Hansson, G.A.; Ohlsson, K.; Skerfving, S.; Nordander, C. Work-related neck and upper limb disorders—Quantitative exposure-response relationships adjusted for personal characteristics and psychosocial conditions. BMC Musculoskelet. Disord. 2019, 20, 139. [Google Scholar] [CrossRef]
- Seidler, A.; Euler, U.; Bolm-Audorff, U.; Ellegast, R.; Grifka, J.; Haerting, J.; Jager, M.; Michaelis, M.; Kuss, O. Physical workload and accelerated occurrence of lumbar spine diseases: Risk and rate advancement periods in a German multicenter case-control study. Scand. J. Work. Environ. Health 2011, 37, 30–36. [Google Scholar] [CrossRef]
- Coenen, P.; Kingma, I.; Boot, C.R.; Bongers, P.M.; van Dieen, J.H. Cumulative mechanical low-back load at work is a determinant of low-back pain. Occup. Environ. Med. 2014, 71, 332–337. [Google Scholar] [CrossRef] [PubMed]
- Marras, W.S.; Ferguson, S.A.; Lavender, S.A.; Splittstoesser, R.E.; Yang, G. Cumulative spine loading and clinically meaningful declines in low-back function. Hum. Factors 2014, 56, 29–43. [Google Scholar] [CrossRef] [PubMed]
- Norman, R.; Wells, R.; Neumann, P.; Frank, J.; Shannon, H.; Kerr, M. A comparison of peak vs cumulative physical work exposure risk factors for the reporting of low back pain in the automotive industry. Clin. Biomech. 1998, 13, 561–573. [Google Scholar] [CrossRef]
- Davis, K.G.; Marras, W.S. The effects of motion on trunk biomechanics. Clin. Biomech. 2000, 15, 703–717. [Google Scholar] [CrossRef]
- Marras, W.S.; Lavender, S.A.; Leurgans, S.E.; Fathallah, F.A.; Ferguson, S.A.; Allread, W.G.; Rajulu, S.L. Biomechanical risk factors for occupationally related low back disorders. Ergonomics 1995, 38, 377–410. [Google Scholar] [CrossRef] [PubMed]
- Griffith, L.E.; Shannon, H.S.; Wells, R.P.; Walter, S.D.; Cole, D.C.; Cote, P.; Frank, J.; Hogg-Johnson, S.; Langlois, L.E. Individual participant data meta-analysis of mechanical workplace risk factors and low back pain. Am. J. Public Health 2012, 102, 309–318. [Google Scholar] [CrossRef] [PubMed]
- Lunde, L.K.; Koch, M.; Merkus, S.L.; Knardahl, S.; Waersted, M.; Veiersted, K.B. Associations of objectively measured forward bending at work with low-back pain intensity: A 2-year follow-up of construction and healthcare workers. Occup. Environ. Med. 2019, 76, 660–667. [Google Scholar] [CrossRef] [PubMed]
- Ribeiro, D.C.; Aldabe, D.; Abbott, J.H.; Sole, G.; Milosavljevic, S. Dose-response relationship between work-related cumulative postural exposure and low back pain: A systematic review. Ann. Occup. Hyg. 2012, 56, 684–696. [Google Scholar] [CrossRef] [PubMed]
- Swain, C.T.V.; Pan, F.; Owen, P.J.; Schmidt, H.; Belavy, D.L. No consensus on causality of spine postures or physical exposure and low back pain: A systematic review of systematic reviews. J. Biomech. 2020, 102, 109312. [Google Scholar] [CrossRef]
- Villumsen, M.; Samani, A.; Jorgensen, M.B.; Gupta, N.; Madeleine, P.; Holtermann, A. Are forward bending of the trunk and low back pain associated among Danish blue-collar workers? A cross-sectional field study based on objective measures. Ergonomics 2015, 58, 246–258. [Google Scholar] [CrossRef]
- Takala, E.P.; Pehkonen, I.; Forsman, M.; Hansson, G.A.; Mathiassen, S.E.; Neumann, W.P.; Sjogaard, G.; Veiersted, K.B.; Westgaard, R.H.; Winkel, J. Systematic evaluation of observational methods assessing biomechanical exposures at work. Scand. J. Work. Environ. Health 2010, 36, 3–24. [Google Scholar] [CrossRef]
- Lind, C.M.; Forsman, M.; Rose, L.M. Development and evaluation of RAMP I—A practitioner’s tool for screening of musculoskeletal disorder risk factors in manual handling. Int. J. Occup. Saf. Ergon. 2019, 25, 165–180. [Google Scholar] [CrossRef]
- Lind, C.M.; Forsman, M.; Rose, L.M. Development and evaluation of RAMP II—A practitioner’s tool for assessing musculoskeletal disorder risk factors in industrial manual handling. Ergonomics 2020, 63, 477–504. [Google Scholar] [CrossRef]
- Rhen, I.M.; Forsman, M. Inter- and intra-rater reliability of the OCRA checklist method in video-recorded manual work tasks. Appl. Ergon. 2020, 84, 103025. [Google Scholar] [CrossRef]
- Forsman, M. The search for practical and reliable observational or technical risk assessment methods to be used in prevention of musculoskeletal disorders. Agron. Res. 2017, 15, 680–686. [Google Scholar]
- Trask, C.; Mathiassen, S.E.; Wahlstrom, J.; Forsman, M. Cost-efficient assessment of biomechanical exposure in occupational groups, exemplified by posture observation and inclinometry. Scand. J. Work. Environ. Health 2014, 40, 252–265. [Google Scholar] [CrossRef] [PubMed]
- Dahlqvist, C.; Hansson, G.A.; Forsman, M. Validity of a small low-cost triaxial accelerometer with integrated logger for uncomplicated measurements of postures and movements of head, upper back and upper arms. Appl. Ergon. 2016, 55, 108–116. [Google Scholar] [CrossRef] [PubMed]
- Arvidsson, I.; Dahlqvist, C.; Enquist, H.; Nordander, C. Action Levels for Prevention of Work Related Musculoskeletal Disorders; Arbets-och Miljömedicin Syd: Lund, Sweden, 2017. [Google Scholar]
- Hansson, G.A.; Asterland, P.; Holmer, N.G.; Skerfving, S. Validity and reliability of triaxial accelerometers for inclinometry in posture analysis. Med. Biol. Eng. Comput. 2001, 39, 405–413. [Google Scholar] [CrossRef] [PubMed]
- Hansson, G.A.; Arvidsson, I.; Ohlsson, K.; Nordander, C.; Mathiassen, S.E.; Skerfving, S.; Balogh, I. Precision of measurements of physical workload during standardised manual handling. Part II: Inclinometry of head, upper back, neck and upper arms. J. Electromyogr. Kinesiol. 2006, 16, 125–136. [Google Scholar] [CrossRef]
- Amasay, T.; Zodrow, K.; Kincl, L.; Hess, J.; Karduna, A. Validation of tri-axial accelerometer for the calculation of elevation angles. Int. J. Ind. Ergon. 2009, 39, 783–789. [Google Scholar] [CrossRef]
- Chen, H.; Schall, M.C., Jr.; Fethke, N. Accuracy of angular displacements and velocities from inertial-based inclinometers. Appl. Ergon. 2018, 67, 151–161. [Google Scholar] [CrossRef] [PubMed]
- Korshoj, M.; Skotte, J.H.; Christiansen, C.S.; Mortensen, P.; Kristiansen, J.; Hanisch, C.; Ingebrigtsen, J.; Holtermann, A. Validity of the Acti4 software using ActiGraph GT3X+accelerometer for recording of arm and upper body inclination in simulated work tasks. Ergonomics 2014, 57, 247–253. [Google Scholar] [CrossRef] [PubMed]
- Bernmark, E.; Wiktorin, C. A triaxial accelerometer for measuring arm movements. Appl. Ergon. 2002, 33, 541–547. [Google Scholar] [CrossRef]
- Yang, L.; Grooten, W.J.A.; Forsman, M. An iPhone application for upper arm posture and movement measurements. Appl. Ergon. 2017, 65, 492–500. [Google Scholar] [CrossRef]
- Zhu, R.; Zhou, Z. A real-time articulated human motion tracking using tri-axis inertial/magnetic sensors package. IEEE Trans. Neural Syst. Rehabil. Eng. 2004, 12, 295–302. [Google Scholar] [CrossRef]
- Lind, C.M.; Yang, L.; Abtahi, F.; Hanson, L.; Lindecrantz, K.; Lu, K.; Forsman, M.; Eklund, J. Reducing postural load in order picking through a smart workwear system using real-time vibrotactile feedback. Appl. Ergon. 2020, 89, 103188. [Google Scholar] [CrossRef]
- Lind, C.M.; Diaz-Olivares, J.A.; Lindecrantz, K.; Eklund, J. A Wearable Sensor System for Physical Ergonomics Interventions Using Haptic Feedback. Sensors 2020, 20, 6010. [Google Scholar] [CrossRef]
- Schall, M.C., Jr.; Zhang, X.; Chen, H.; Gallagher, S.; Fethke, N.B. Comparing upper arm and trunk kinematics between manufacturing workers performing predominantly cyclic and non-cyclic work tasks. Appl. Ergon. 2021, 93, 103356. [Google Scholar] [CrossRef]
- Granzow, R.F.; Schall, M.C., Jr.; Smidt, M.F.; Chen, H.; Fethke, N.B.; Huangfu, R. Characterizing exposure to physical risk factors among reforestation hand planters in the Southeastern United States. Appl. Ergon. 2018, 66, 1–8. [Google Scholar] [CrossRef]
- Wahlstrom, J.; Bergsten, E.; Trask, C.; Mathiassen, S.E.; Jackson, J.; Forsman, M. Full-Shift Trunk and Upper Arm Postures and Movements Among Aircraft Baggage Handlers. Ann. Occup. Hyg. 2016, 60, 977–990. [Google Scholar] [CrossRef]
- Weber, B.; Douwes, M.; Forsman, M.; Könemann, R.; Heinrich, K.; Enquist, H.; Pinder, A.; Punakallio, A.; Uusitalo, A.; Ditchen, D.; et al. Assessing Arm Elevation at Work with Technical Systems; Partnership for European Research in Occupational Safety and Health (PEROSH): Leiden, The Netherlands, 2017. [Google Scholar]
- Arvidsson, I.; Dahlqvist, C.; Enquist, H.; Nordander, C. Action Levels for the Prevention of Work-Related Musculoskeletal Disorders in the Neck and Upper Extremities: A Proposal. Ann. Work Expo. Health 2021. [Google Scholar] [CrossRef] [PubMed]
- Moriguchi, C.S.; Carnaz, L.; Veiersted, K.B.; Hanvold, T.N.; Haeg, L.B.; Hansson, G.A.; Cote Gil Coury, H.J. Occupational posture exposure among construction electricians. Appl. Ergon. 2013, 44, 86–92. [Google Scholar] [CrossRef]
- Jorgensen, M.B.; Gupta, N.; Korshoj, M.; Lagersted-Olsen, J.; Villumsen, M.; Mortensen, O.S.; Skotte, J.; Sogaard, K.; Madeleine, P.; Samani, A.; et al. The DPhacto cohort: An overview of technically measured physical activity at work and leisure in blue-collar sectors for practitioners and researchers. Appl. Ergon. 2019, 77, 29–39. [Google Scholar] [CrossRef]
- Palm, P.; Gupta, N.; Forsman, M.; Skotte, J.; Nordquist, T.; Holtermann, A. Exposure to Upper Arm Elevation During Work Compared to Leisure Among 12 Different Occupations Measured with Triaxial Accelerometers. Ann. Work Expo. Health 2018, 62, 689–698. [Google Scholar] [CrossRef]
- Holtermann, A.; Fjeldstad Hendriksen, P.; Greby Schmidt, K.; Jagd Svendsen, M.; Norregaard Rasmussen, C.D. Physical Work Demands of Childcare Workers in Denmark: Device-Based Measurements and Workplace Observations Among 199 Childcare Workers from 16 Day Nurseries. Ann. Work Expo. Health 2020, 64, 586–595. [Google Scholar] [CrossRef] [PubMed]
- Wærsted, M.; Enquist, H.; Veiersted, K.B. Hairdressers’ shoulder load when blow-drying—Studying the effect of a new blow dryer design on arm inclination angle and muscle pain. Int. J. Ind. Ergon. 2019, 74, 102839. [Google Scholar] [CrossRef]
- Merkus, S.L.; Lunde, L.K.; Koch, M.; Waersted, M.; Knardahl, S.; Veiersted, K.B. Physical capacity, occupational physical demands, and relative physical strain of older employees in construction and healthcare. Int. Arch. Occup. Environ. Health 2019, 92, 295–307. [Google Scholar] [CrossRef] [PubMed]
- Buchholz, B.; Park, J.S.; Gold, J.E.; Punnett, L. Subjective ratings of upper extremity exposures: Inter-method agreement with direct measurement of exposures. Ergonomics 2008, 51, 1064–1077. [Google Scholar] [CrossRef] [PubMed]
- Thamsuwan, O.; Galvin, K.; Tchong-French, M.; Kim, J.H.; Johnson, P.W. A feasibility study comparing objective and subjective field-based physical exposure measurements during apple harvesting with ladders and mobile platforms. J. Agromed. 2019, 24, 268–278. [Google Scholar] [CrossRef] [PubMed]
- Bruno Garza, J.L.; Eijckelhof, B.H.; Johnson, P.W.; Raina, S.M.; Rynell, P.W.; Huysmans, M.A.; van Dieen, J.H.; van der Beek, A.J.; Blatter, B.M.; Dennerlein, J.T. Observed differences in upper extremity forces, muscle efforts, postures, velocities and accelerations across computer activities in a field study of office workers. Ergonomics 2012, 55, 670–681. [Google Scholar] [CrossRef][Green Version]
- Ciccarelli, M.; Straker, L.; Mathiassen, S.E.; Pollock, C. Posture variation among office workers when using different information and communication technologies at work and away from work. Ergonomics 2014, 57, 1678–1686. [Google Scholar] [CrossRef]
- Veiersted, K.B.; Gould, K.S.; Osteras, N.; Hansson, G.A. Effect of an intervention addressing working technique on the biomechanical load of the neck and shoulders among hairdressers. Appl. Ergon. 2008, 39, 183–190. [Google Scholar] [CrossRef] [PubMed]
- Hess, J.A.; Kincl, L.; Amasay, T.; Wolfe, P. Ergonomic evaluation of masons laying concrete masonry units and autoclaved aerated concrete. Appl. Ergon. 2010, 41, 477–483. [Google Scholar] [CrossRef] [PubMed]
- Douphrate, D.I.; Fethke, N.B.; Nonnenmann, M.W.; Rosecrance, J.C.; Reynolds, S.J. Full shift arm inclinometry among dairy parlor workers: A feasibility study in a challenging work environment. Appl. Ergon. 2012, 43, 604–613. [Google Scholar] [CrossRef]
- Ettinger, L.; Kincl, L.; Johnson, P.; Carter, C.; Garfinkel, S.; Karduna, A. Workday Arm Elevation Exposure: A Comparison Between Two Professions. IIE Trans Occup. 2013, 1, 119–127. [Google Scholar] [CrossRef]
- Arvidsson, I.; Balogh, I.; Hansson, G.A.; Ohlsson, K.; Akesson, I.; Nordander, C. Rationalization in meat cutting—Consequences on physical workload. Appl. Ergon. 2012, 43, 1026–1032. [Google Scholar] [CrossRef] [PubMed]
- Arvidsson, I.; Arvidsson, M.; Axmon, A.; Hansson, G.A.; Johansson, C.R.; Skerfving, S. Musculoskeletal disorders among female and male air traffic controllers performing identical and demanding computer work. Ergonomics 2006, 49, 1052–1067. [Google Scholar] [CrossRef]
- Arvidsson, I.; Hansson, G.A.; Mathiassen, S.E.; Skerfving, S. Changes in physical workload with implementation of mouse-based information technology in air traffic control. Int. J. Ind. Ergon. 2006, 36, 613–622. [Google Scholar] [CrossRef]
- Balogh, I.; Ohlsson, K.; Hansson, G.A.; Engstrom, T.; Skerfving, S. Increasing the degree of automation in a production system: Consequences for the physical workload. Int. J. Ind. Ergon. 2006, 36, 353–365. [Google Scholar] [CrossRef]
- Balogh, I.; Ohlsson, K.; Nordander, C.; Bjork, J.; Hansson, G.A. The importance of work organization on workload and musculoskeletal health—Grocery store work as a model. Appl. Ergon. 2016, 53, 143–151. [Google Scholar] [CrossRef]
- Dahlqvist, C.; Nordander, C.; Forsman, M.; Enquist, H. Self-recordings of upper arm elevation during cleaning—Comparison between analyses using a simplified reference posture and a standard reference posture. BMC Musculoskelet. Disord. 2018, 19, 402. [Google Scholar] [CrossRef]
- Hansson, G.A.; Balogh, I.; Ohlsson, K.; Granqvist, L.; Nordander, C.; Arvidsson, I.; Akesson, I.; Unge, J.; Rittner, R.; Stromberg, U.; et al. Physical workload in various types of work: Part II. Neck, shoulder and upper arm. Int. J. Ind. Ergon. 2010, 40, 267–281. [Google Scholar] [CrossRef]
- Nordander, C.; Ohlsson, K.; Balogh, I.; Hansson, G.A.; Axmon, A.; Persson, R.; Skerfving, S. Gender differences in workers with identical repetitive industrial tasks: Exposure and musculoskeletal disorders. Int. Arch. Occup. Environ. Health 2008, 81, 939–947. [Google Scholar] [CrossRef] [PubMed]
- Jonker, D.; Rolander, B.; Balogh, I. Relation between perceived and measured workload obtained by long-term inclinometry among dentists. Appl. Ergon. 2009, 40, 309–315. [Google Scholar] [CrossRef] [PubMed]
- Jonker, D.; Rolander, B.; Balogh, I.; Sandsjo, L.; Ekberg, K.; Winkel, J. Mechanical exposure among general practice dentists in Sweden and possible implications of rationalisation. Ergonomics 2011, 54, 953–960. [Google Scholar] [CrossRef] [PubMed]
- Jonker, D.; Rolander, B.; Balogh, I.; Sandsjo, L.; Ekberg, K.; Winkel, J. Rationalisation in public dental care—Impact on clinical work tasks and mechanical exposure for dentists—A prospective study. Ergonomics 2013, 56, 303–313. [Google Scholar] [CrossRef][Green Version]
- Moriguchi, C.S.; Carnaz, L.; Alencar, J.F.; Miranda Junior, L.C.; Granqvist, L.; Hansson, G.A.; Gil Coury, H.J. Postures and movements in the most common tasks of power line workers. Ind. Health 2011, 49, 482–491. [Google Scholar] [CrossRef] [PubMed]
- Christmansson, M.; Medbo, L.; Hansson, G.A.; Ohlsson, K.; Bystrom, J.U.; Moller, T.; Forsman, M. A case study of a principally new way of materials kitting—An evaluation of time consumption and physical workload. Int. J. Ind. Ergon. 2002, 30, 49–65. [Google Scholar] [CrossRef]
- Bystrom, J.U.; Hansson, G.A.; Rylander, L.; Ohlsson, K.; Kallrot, G.; Skerfving, S. Physical workload on neck and upper limb using two CAD applications. Appl. Ergon. 2002, 33, 63–74. [Google Scholar] [CrossRef]
- Unge, J.; Ohlsson, K.; Nordander, C.; Hansson, G.A.; Skerfving, S.; Balogh, I. Differences in physical workload, psychosocial factors and musculoskeletal disorders between two groups of female hospital cleaners with two diverse organizational models. Int. Arch. Occup. Environ. Health 2007, 81, 209–220. [Google Scholar] [CrossRef] [PubMed]
- Akesson, I.; Balogh, I.; Hansson, G.A. Physical workload in neck, shoulders and wrists/hands in dental hygienists during a work-day. Appl. Ergon. 2012, 43, 803–811. [Google Scholar] [CrossRef]
- Juul-Kristensen, B.; Hansson, G.A.; Fallentin, N.; Andersen, J.H.; Ekdahl, C. Assessment of work postures and movements using a video-based observation method and direct technical measurements. Appl. Ergon. 2001, 32, 517–524. [Google Scholar] [CrossRef]
- Kazmierczak, K.; Mathiassen, S.E.; Forsman, M.; Winkel, J. An integrated analysis of ergonomics and time consumption in Swedish ‘craft-type’ car disassembly. Appl. Ergon. 2005, 36, 263–273. [Google Scholar] [CrossRef]
- Wahlstrom, J.; Mathiassen, S.E.; Liv, P.; Hedlund, P.; Ahlgren, C.; Forsman, M. Upper arm postures and movements in female hairdressers across four full working days. Ann. Occup. Hyg. 2010, 54, 584–594. [Google Scholar] [CrossRef]
- Heiden, M.; Zetterberg, C.; Mathiassen, S.E. Trunk and upper arm postures in paper mill work. Appl. Ergon. 2019, 76, 90–96. [Google Scholar] [CrossRef]
- Heilskov-Hansen, T.; Svendsen, S.W.; Frolund Thomsen, J.; Mikkelsen, S.; Hansson, G.A. Sex differences in task distribution and task exposures among Danish house painters: An observational study combining questionnaire data with biomechanical measurements. PLoS ONE 2014, 9, e110899. [Google Scholar] [CrossRef]
- Moriguchi, C.S.; Carnaz, L.; Miranda Junior, L.C.; Marklin, R.W.; Gil Coury, H.J. Are posture data from simulated tasks representative of field conditions? Case study for overhead electric utility workers. Ergonomics 2012, 55, 1382–1394. [Google Scholar] [CrossRef]
- Jackson, J.A.; Mathiassen, S.E.; Wahlstrom, J.; Liv, P.; Forsman, M. Is what you see what you get? Standard inclinometry of set upper arm elevation angles. Appl. Ergon. 2015, 47, 242–252. [Google Scholar] [CrossRef] [PubMed]
- Acuna, M.; Amasay, T.; Karduna, A.R. The reliability of side to side measurements of upper extremity activity levels in healthy subjects. BMC Musculoskelet. Disord. 2010, 11, 168. [Google Scholar] [CrossRef] [PubMed]
- Amasay, T.; Latteri, M.; Karduna, A.R. In vivo measurement of humeral elevation angles and exposure using a triaxial accelerometer. Hum. Factors 2010, 52, 616–626. [Google Scholar] [CrossRef]
- Paquet, V.L.; Punnett, L.; Buchholz, B. Validity of fixed-interval observations for postural assessment in construction work. Appl. Ergon. 2001, 32, 215–224. [Google Scholar] [CrossRef]
- Rislund, C.; Hemphala, H.; Hansson, G.A.; Balogh, I. Evaluation of three principles for forklift steering: Effects on physical workload. Int. J. Ind. Ergon. 2013, 43, 249–256. [Google Scholar] [CrossRef]
- Yu, D.; Dural, C.; Morrow, M.M.B.; Yang, L.; Collins, J.W.; Hallbeck, S.; Kjellman, M.; Forsman, M.; Yu, D. Intraoperative workload in robotic surgery assessed by wearable motion tracking sensors and questionnaires. Surg. Endosc. 2016, 31, 1–10. [Google Scholar] [CrossRef]
- Schall, M.C., Jr.; Fethke, N.B.; Chen, H.; Oyama, S.; Douphrate, D.I. Accuracy and repeatability of an inertial measurement unit system for field-based occupational studies. Ergonomics 2016, 59, 591–602. [Google Scholar] [CrossRef]
- Robert-Lachaine, X.; Larue, C.; Denis, D.; Delisle, A.; Mecheri, H.; Corbeil, P.; Plamondon, A. Feasibility of quantifying the physical exposure of materials handlers in the workplace with magnetic and inertial measurement units. Ergonomics 2020, 63, 283–292. [Google Scholar] [CrossRef] [PubMed]
- Vignais, N.; Bernard, F.; Touvenot, G.; Sagot, J.C. Physical risk factors identification based on body sensor network combined to videotaping. Appl. Ergon. 2017, 65, 410–417. [Google Scholar] [CrossRef]
- Battini, D.; Persona, A.; Sgarbossa, F. Innovative real-time system to integrate ergonomic evaluations into warehouse design and management. Comput. Ind. Eng. 2014, 77, 1–10. [Google Scholar] [CrossRef]
- Fethke, N.B.; Schall, M.C., Jr.; Chen, H.; Branch, C.A.; Merlino, L.A. Biomechanical factors during common agricultural activities: Results of on-farm exposure assessments using direct measurement methods. J. Occup. Environ. Hyg. 2020, 17, 85–96. [Google Scholar] [CrossRef]
- Kersten, J.T.; Fethke, N.B. Radio frequency identification to measure the duration of machine-paced assembly tasks: Agreement with self-reported task duration and application in variance components analyses of upper arm postures and movements recorded over multiple days. Appl. Ergon. 2019, 75, 74–82. [Google Scholar] [CrossRef] [PubMed]
- Schall, M.C., Jr.; Fethke, N.B.; Chen, H. Working postures and physical activity among registered nurses. Appl. Ergon. 2016, 54, 243–250. [Google Scholar] [CrossRef] [PubMed]
- Freitag, S.; Ellegast, R.; Dulon, M.; Nienhaus, A. Quantitative measurement of stressful trunk postures in nursing professions. Ann. Occup. Hyg. 2007, 51, 385–395. [Google Scholar] [CrossRef] [PubMed][Green Version]
- Freitag, S.; Fincke-Junod, I.; Seddouki, R.; Dulon, M.; Hermanns, I.; Kersten, J.F.; Larsson, T.J.; Nienhaus, A. Frequent bending--an underestimated burden in nursing professions. Ann. Occup. Hyg. 2012, 56, 697–707. [Google Scholar] [CrossRef]
- Freitag, S.; Seddouki, R.; Dulon, M.; Kersten, J.F.; Larsson, T.J.; Nienhaus, A. The effect of working position on trunk posture and exertion for routine nursing tasks: An experimental study. Ann. Occup. Hyg. 2014, 58, 317–325. [Google Scholar] [CrossRef]
- Hermanns, I.; Raffler, N.; Ellegast, R.P.; Fischer, S.; Gores, B. Simultaneous field measuring method of vibration and body posture for assessment of seated occupational driving tasks. Int. J. Ind. Ergon. 2008, 38, 255–263. [Google Scholar] [CrossRef]
- Kozak, A.; Freitag, S.; Nienhaus, A. Evaluation of a Training Program to Reduce Stressful Trunk Postures in the Nursing Professions: A Pilot Study. Ann. Work Expo. Health 2017, 61, 22–32. [Google Scholar] [CrossRef]
- Raffler, N.; Ellegast, R.; Kraus, T.; Ochsmann, E. Factors affecting the perception of whole-body vibration of occupational drivers: An analysis of posture and manual materials handling and musculoskeletal disorders. Ergonomics 2016, 59, 48–60. [Google Scholar] [CrossRef]
- Raffler, N.; Rissler, J.; Ellegast, R.; Schikowsky, C.; Kraus, T.; Ochsmann, E. Combined exposures of whole-body vibration and awkward posture: A cross sectional investigation among occupational drivers by means of simultaneous field measurements. Ergonomics 2017, 60, 1564–1575. [Google Scholar] [CrossRef]
- Won, E.J.; Johnson, P.W.; Punnett, L.; Dennerlein, J.T. Upper extremity biomechanics in computer tasks differ by gender. J. Electromyogr. Kinesiol. 2009, 19, 428–436. [Google Scholar] [CrossRef] [PubMed]
- Vignais, N.; Miezal, M.; Bleser, G.; Mura, K.; Gorecky, D.; Marin, F. Innovative system for real-time ergonomic feedback in industrial manufacturing. Appl. Ergon. 2013, 44, 566–574. [Google Scholar] [CrossRef]
- Amari, M.; Caruel, E.; Donati, P. Inter-individual postural variability in seated drivers exposed to whole-body vibration. Ergonomics 2015, 58, 1162–1174. [Google Scholar] [CrossRef]
- Zare, M.; Biau, S.; Brunet, R.; Roquelaure, Y. Comparison of three methods for evaluation of work postures in a truck assembly plant. Ergonomics 2017, 60, 1551–1563. [Google Scholar] [CrossRef]
- Chen, H.; Schall, M.C., Jr.; Fethke, N.B. Measuring upper arm elevation using an inertial measurement unit: An exploration of sensor fusion algorithms and gyroscope models. Appl. Ergon. 2020, 89, 103187. [Google Scholar] [CrossRef] [PubMed]
- Peppoloni, L.; Filippeschi, A.; Ruffaldi, E.; Avizzano, C.A. (WMSDs issue) A novel wearable system for the online assessment of risk for biomechanical load in repetitive efforts. Int. J. Ind. Ergon. 2016, 52, 1–11. [Google Scholar] [CrossRef]
- Ahlstrom, L.; Grimby-Ekman, A.; Hagberg, M.; Dellve, L. The work ability index and single-item question: Associations with sick leave, symptoms, and health--a prospective study of women on long-term sick leave. Scand. J. Work. Environ. Health 2010, 36, 404–412. [Google Scholar] [CrossRef] [PubMed]
- Godinho, C.; Domingos, J.; Cunha, G.; Santos, A.T.; Fernandes, R.M.; Abreu, D.; Goncalves, N.; Matthews, H.; Isaacs, T.; Duffen, J.; et al. A systematic review of the characteristics and validity of monitoring technologies to assess Parkinson’s disease. J. Neuroeng. Rehabil. 2016, 13, 24. [Google Scholar] [CrossRef]
- Schmal, H.; Holsgaard-Larsen, A.; Izadpanah, K.; Brond, J.C.; Madsen, C.F.; Lauritsen, J. Validation of Activity Tracking Procedures in Elderly Patients after Operative Treatment of Proximal Femur Fractures. Rehabil. Res. Pract. 2018, 2018, 3521271. [Google Scholar] [CrossRef] [PubMed]
- Skotte, J.; Korshoj, M.; Kristiansen, J.; Hanisch, C.; Holtermann, A. Detection of physical activity types using triaxial accelerometers. J. Phys. Act Health 2014, 11, 76–84. [Google Scholar] [CrossRef]
- Downie, F.; Gannon, R. OPSITE Flexifix Gentle: Preventing breakdown in vulnerable skin. Br. J. Nurs. 2013, 22, 696, 698–700. [Google Scholar] [CrossRef]
- Blanca, M.J.; Alarcon, R.; Arnau, J.; Bono, R.; Bendayan, R. Non-normal data: Is ANOVA still a valid option? Psicothema 2017, 29, 552–557. [Google Scholar] [CrossRef] [PubMed]
- SCB. The Swedish Occupational Register with Statistics 2018; Statistics Sweden: Örebro, Sweden, 2020. [Google Scholar]
- Yang, L.; Borgström, D.; Forsman, M. Validation and Comparison of Three Positioning Protocols of Inertial Measurement Units for Measuring Trunk Movement. In Proceedings of the the 20th Congress of the International Ergonomics Association (IEA 2018), Florence, Italy, 26–30 August 2018; pp. 205–211. [Google Scholar]
- Peters, A.; Galna, B.; Sangeux, M.; Morris, M.; Baker, R. Quantification of soft tissue artifact in lower limb human motion analysis: A systematic review. Gait Posture 2010, 31, 1–8. [Google Scholar] [CrossRef] [PubMed]
- Leardini, A.; Chiari, L.; Della Croce, U.; Cappozzo, A. Human movement analysis using stereophotogrammetry. Part 3. Soft tissue artifact assessment and compensation. Gait Posture 2005, 21, 212–225. [Google Scholar] [CrossRef] [PubMed]


Publisher’s Note: MDPI stays neutral with regard to jurisdictional claims in published maps and institutional affiliations. |
© 2021 by the authors. Licensee MDPI, Basel, Switzerland. This article is an open access article distributed under the terms and conditions of the Creative Commons Attribution (CC BY) license (https://creativecommons.org/licenses/by/4.0/).