
Recognizing Physical Activities for Spinal Cord Injury Rehabilitation Using Wearable Sensors


Abstract
:1. Introduction
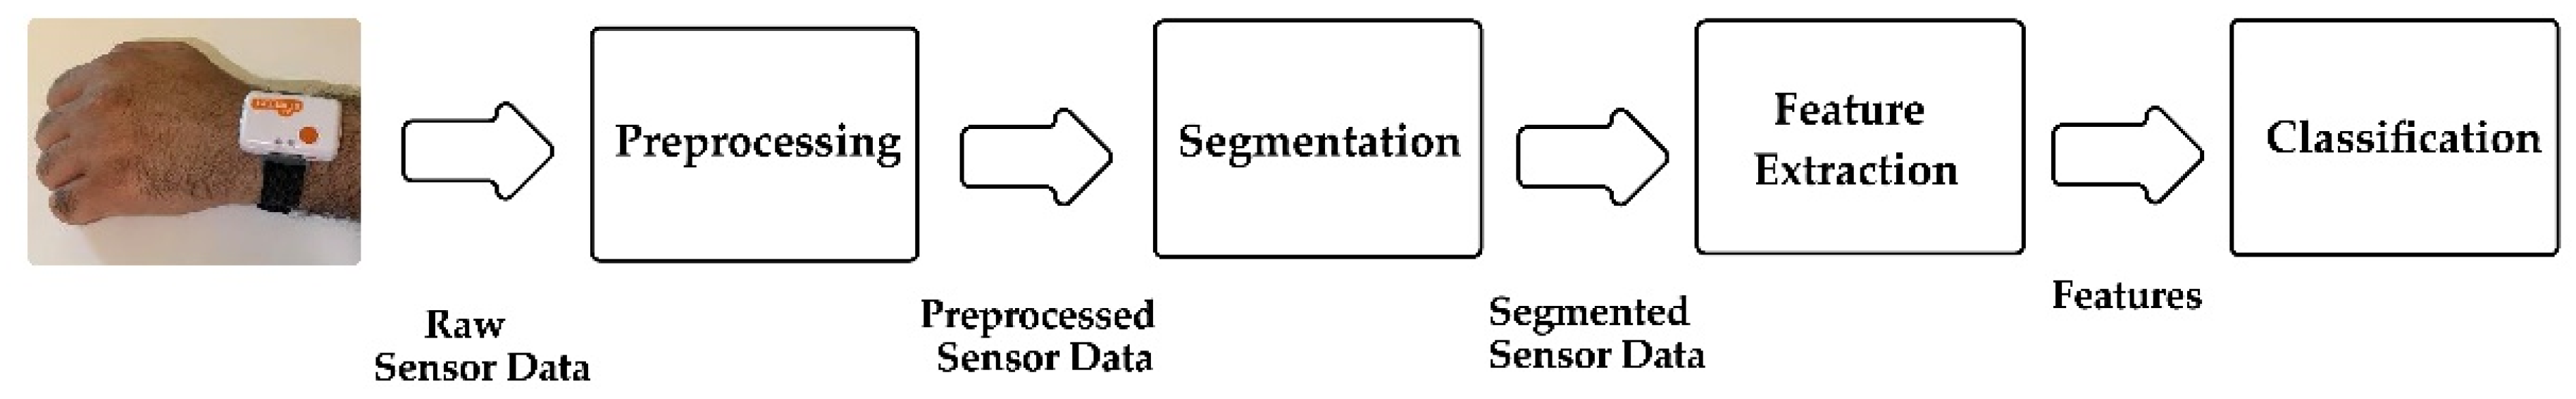
2. Methodology
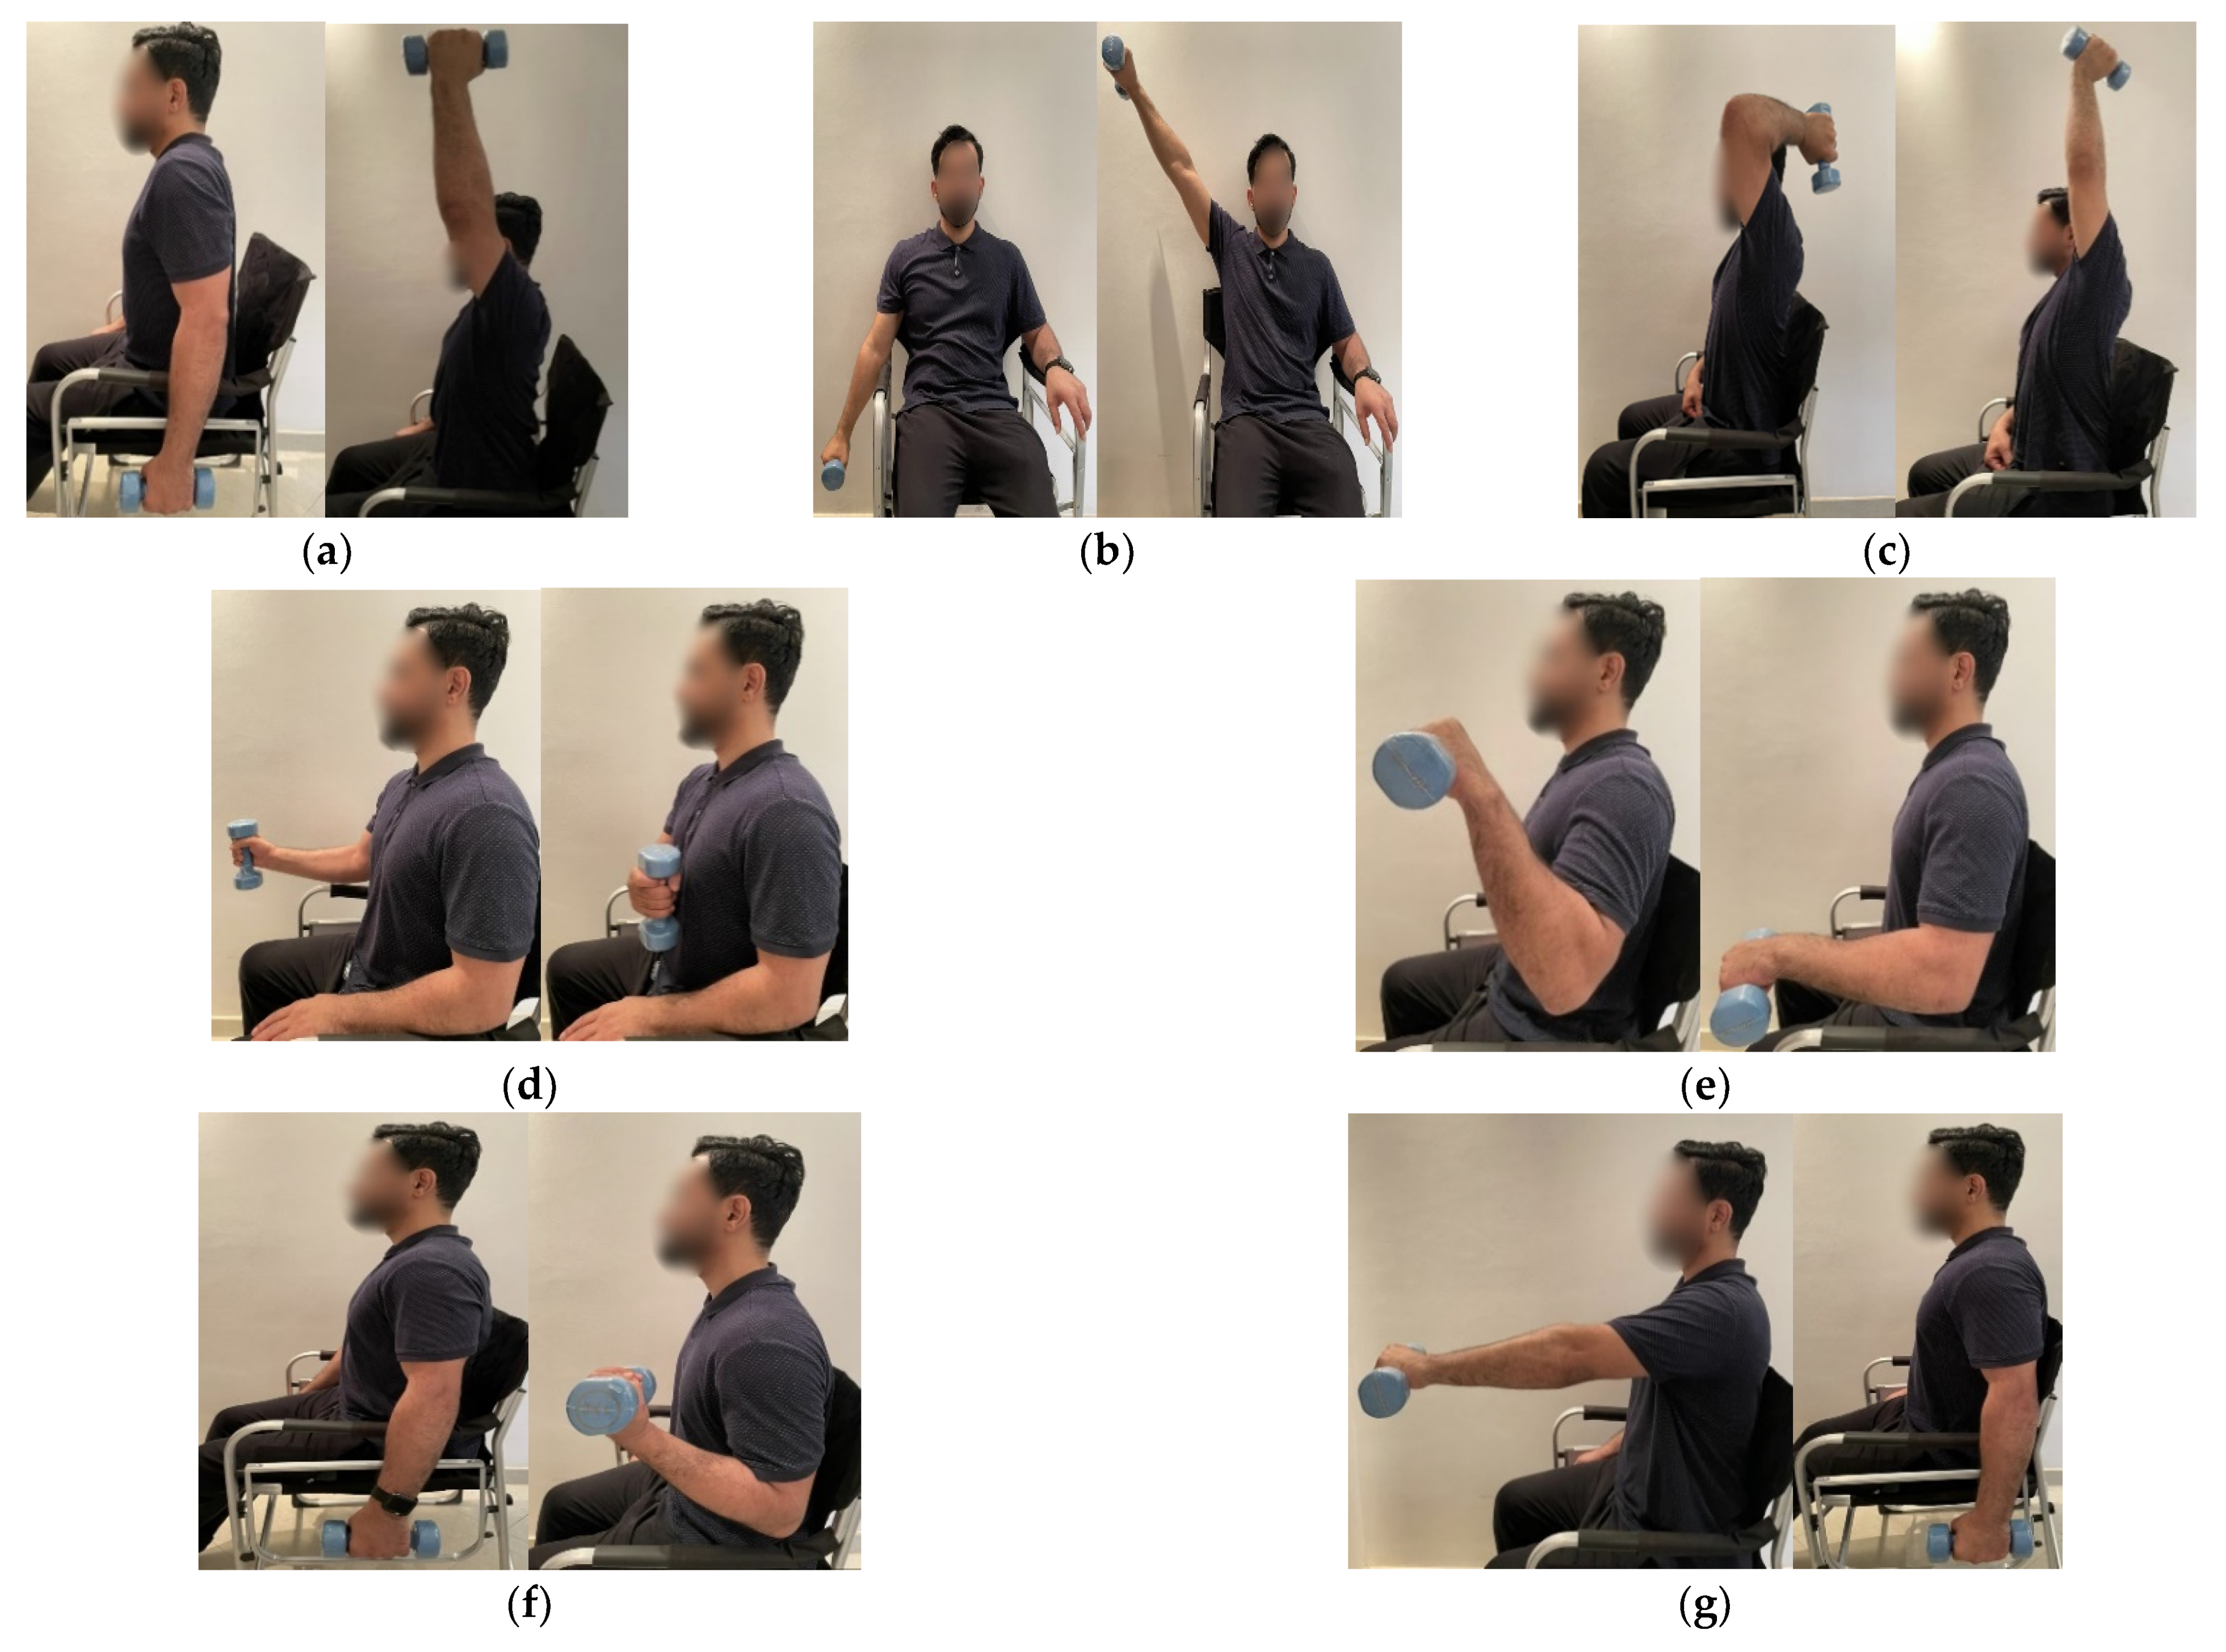
2.1. Rehabilitation Activities
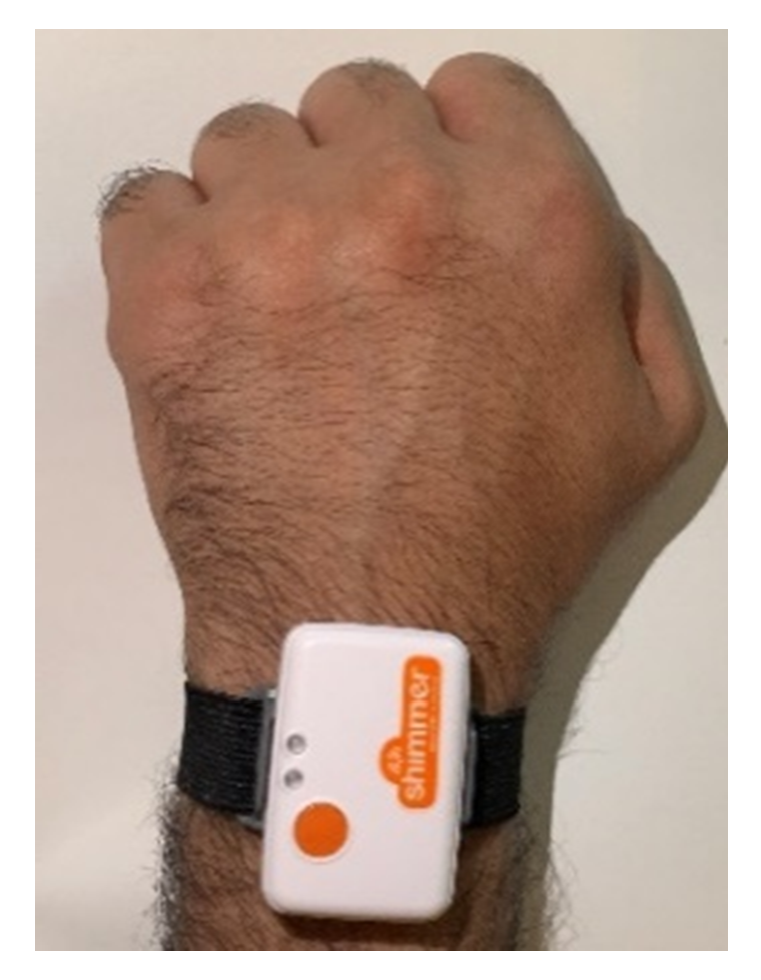
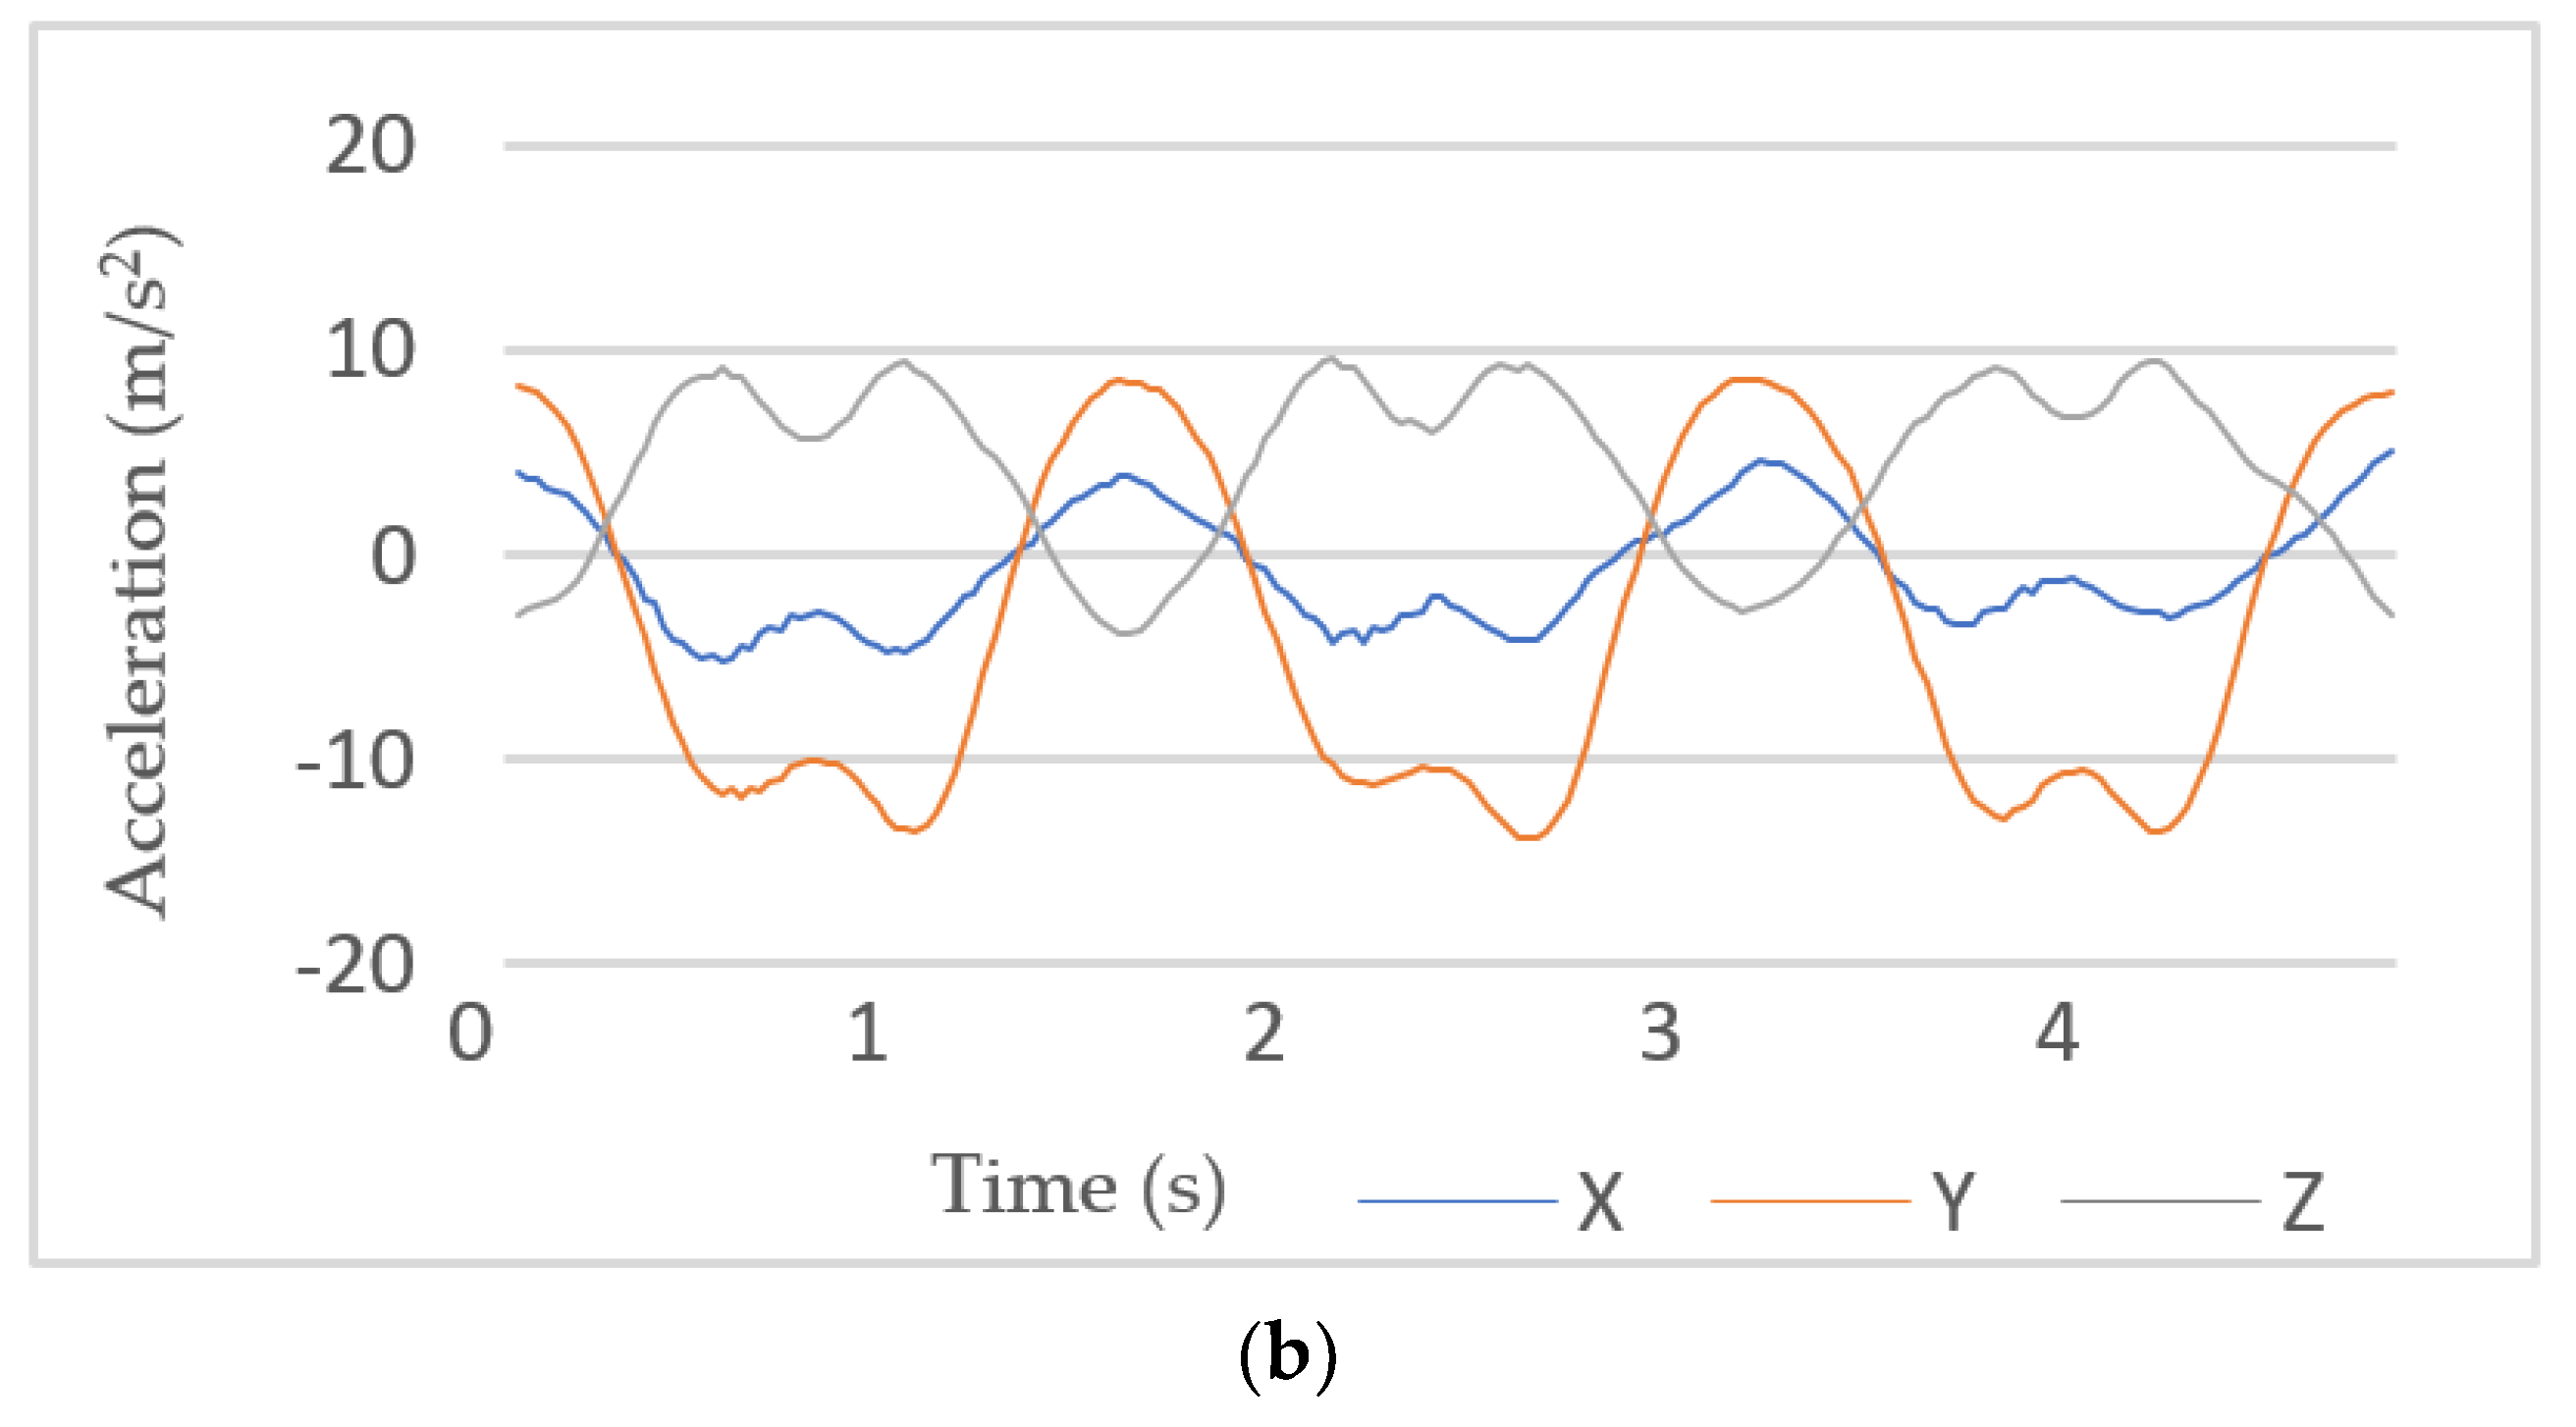
2.2. Instruments and Data Collection
2.3. Data Preprocessing
2.4. Segmentation
2.5. Feature Extraction
2.6. Classification
- SVM has been proven to be effective in addressing various problems, including activity recognition. SVM’s high accuracy and robustness to noise and overfitting problems have made it popular and one of the leading classifiers in terms of generalization [37,38]. To detect non-linear relations, the radial basis function (RBF), which is one of the most common kernels, was used in this study. Grid search was applied to tune the RBF kernel parameters. As a result, the chosen values for complexity (C) and radius (r) were 2.00 and 0.01, respectively.
- KNN is a simple algorithm that uses the K-closest training observations in the feature space to predict the class of a new entry. It calculates the distance between observations based on Euclidean distance. In this algorithm, the k parameter can be used to control underfitting and overfitting problems. For example, decreasing the value of k can make the model prone to overfitting [17].
- RF is an ensemble classifier, which involves many individual decision trees. To generate a prediction model using RF, it is necessary to define two parameters: first, the number of classification trees; and second, the number of features in each split [39]. In this research, the default values for the parameters were used. This is because several studies have stated that satisfactory results are mostly obtained with these default values [40].
- GNB is one of the main Bayesian classifiers used in literature. Using a naïve method, this classifier determines the probability of an event, which belongs to a certain class, assuming that all the features that are given as input are independent.
2.7. Model Training and Validation
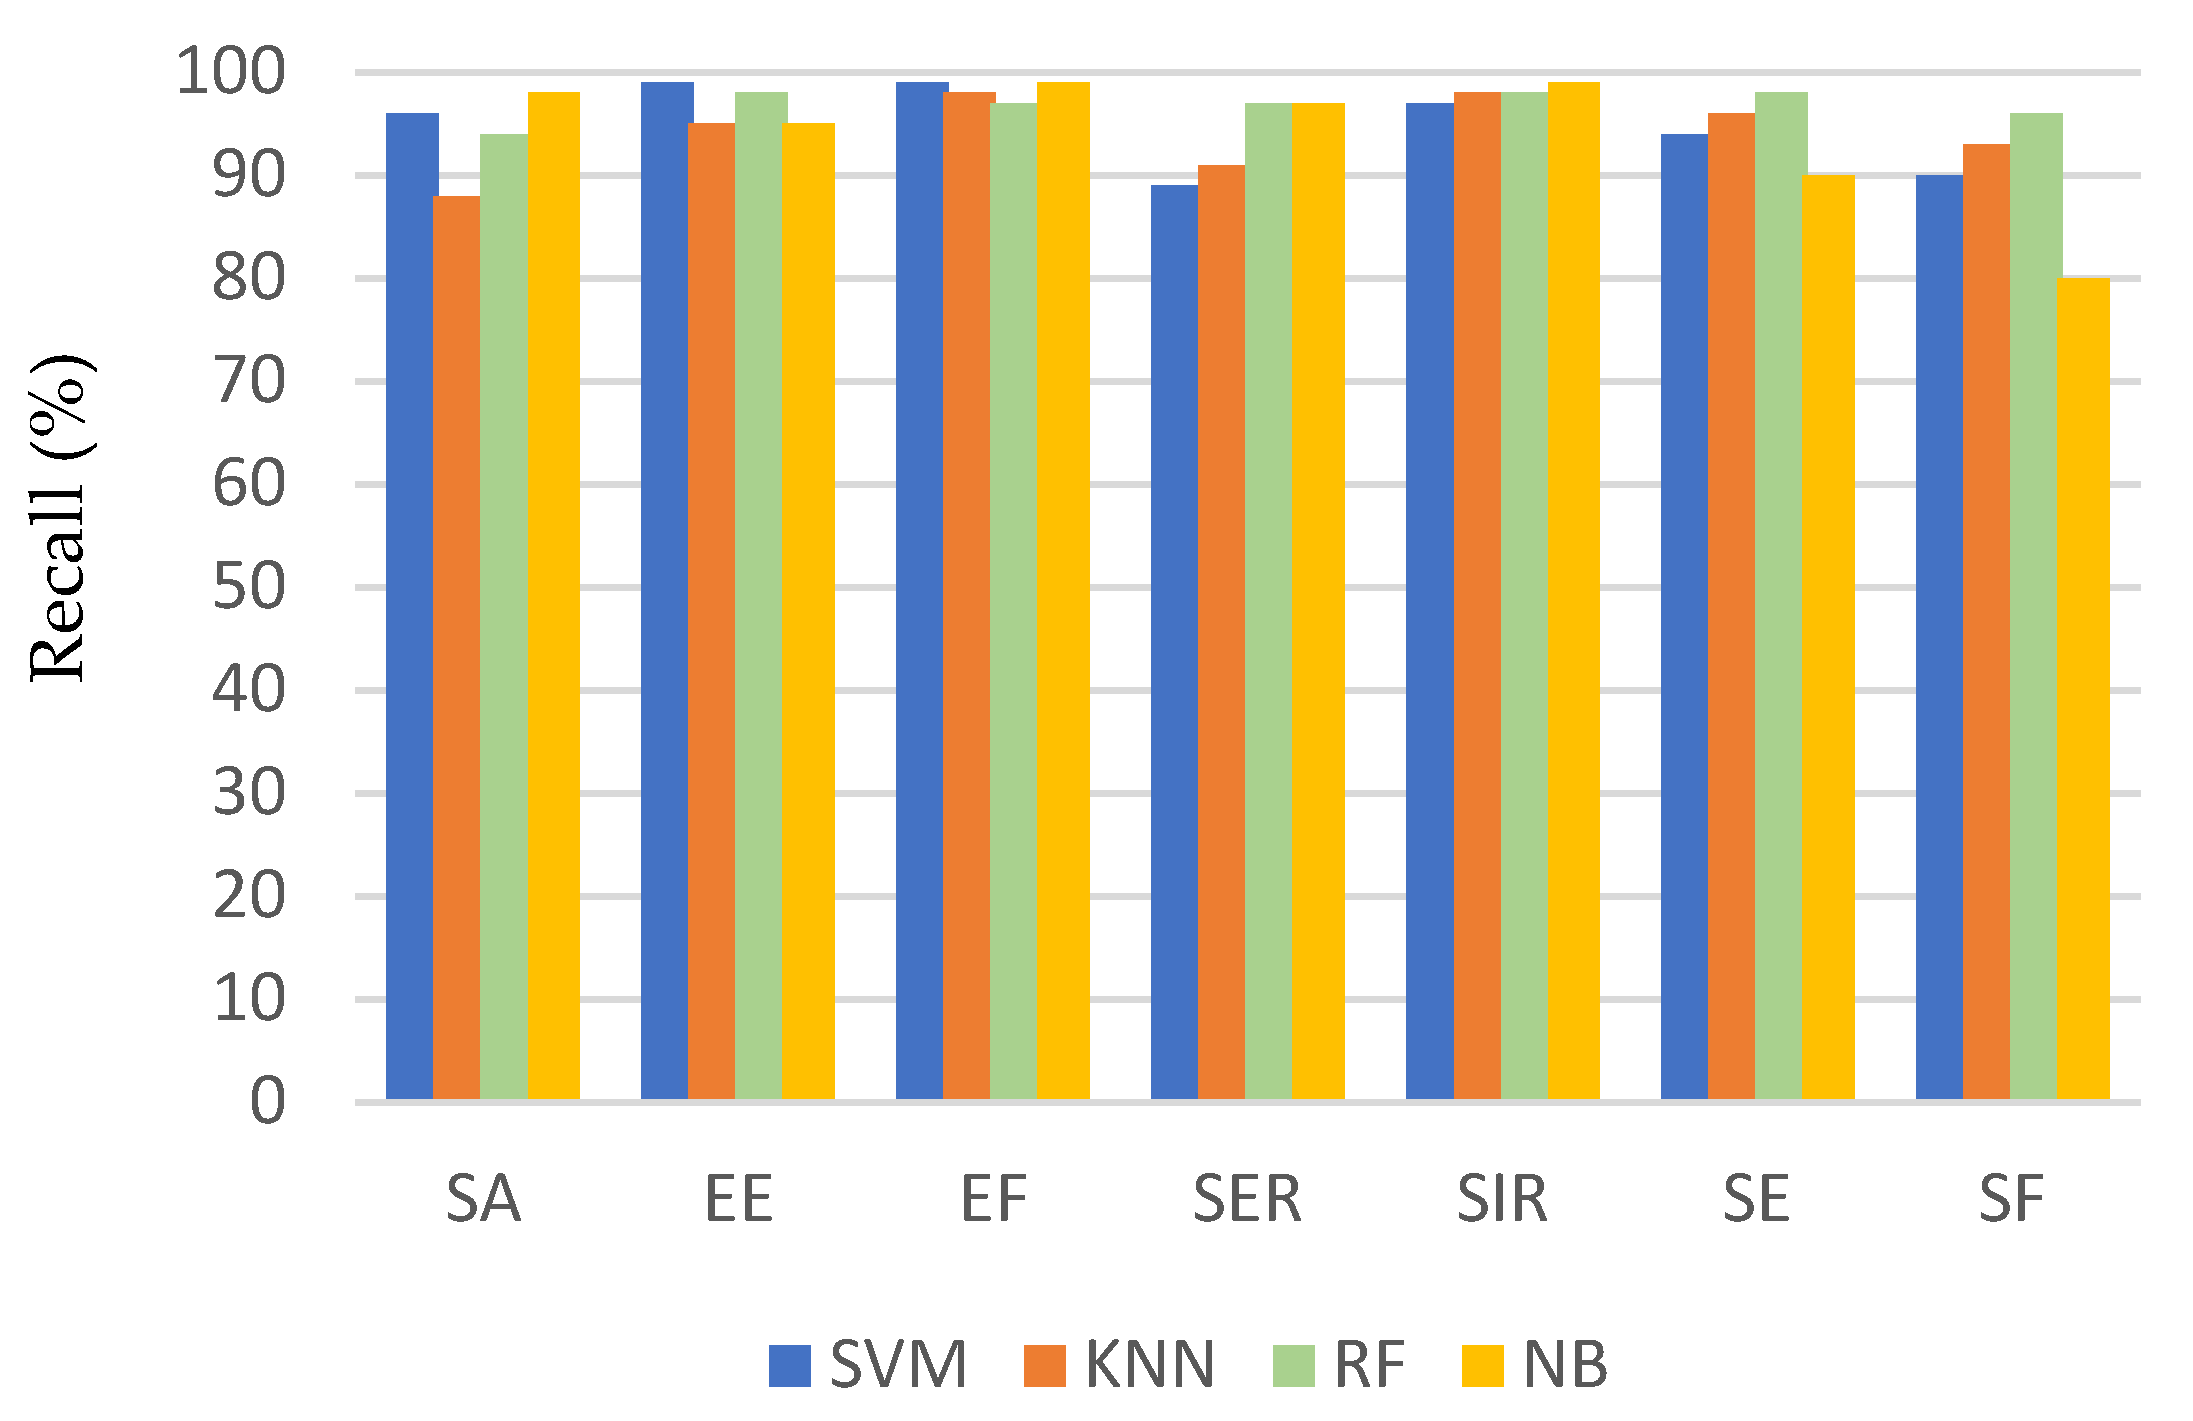
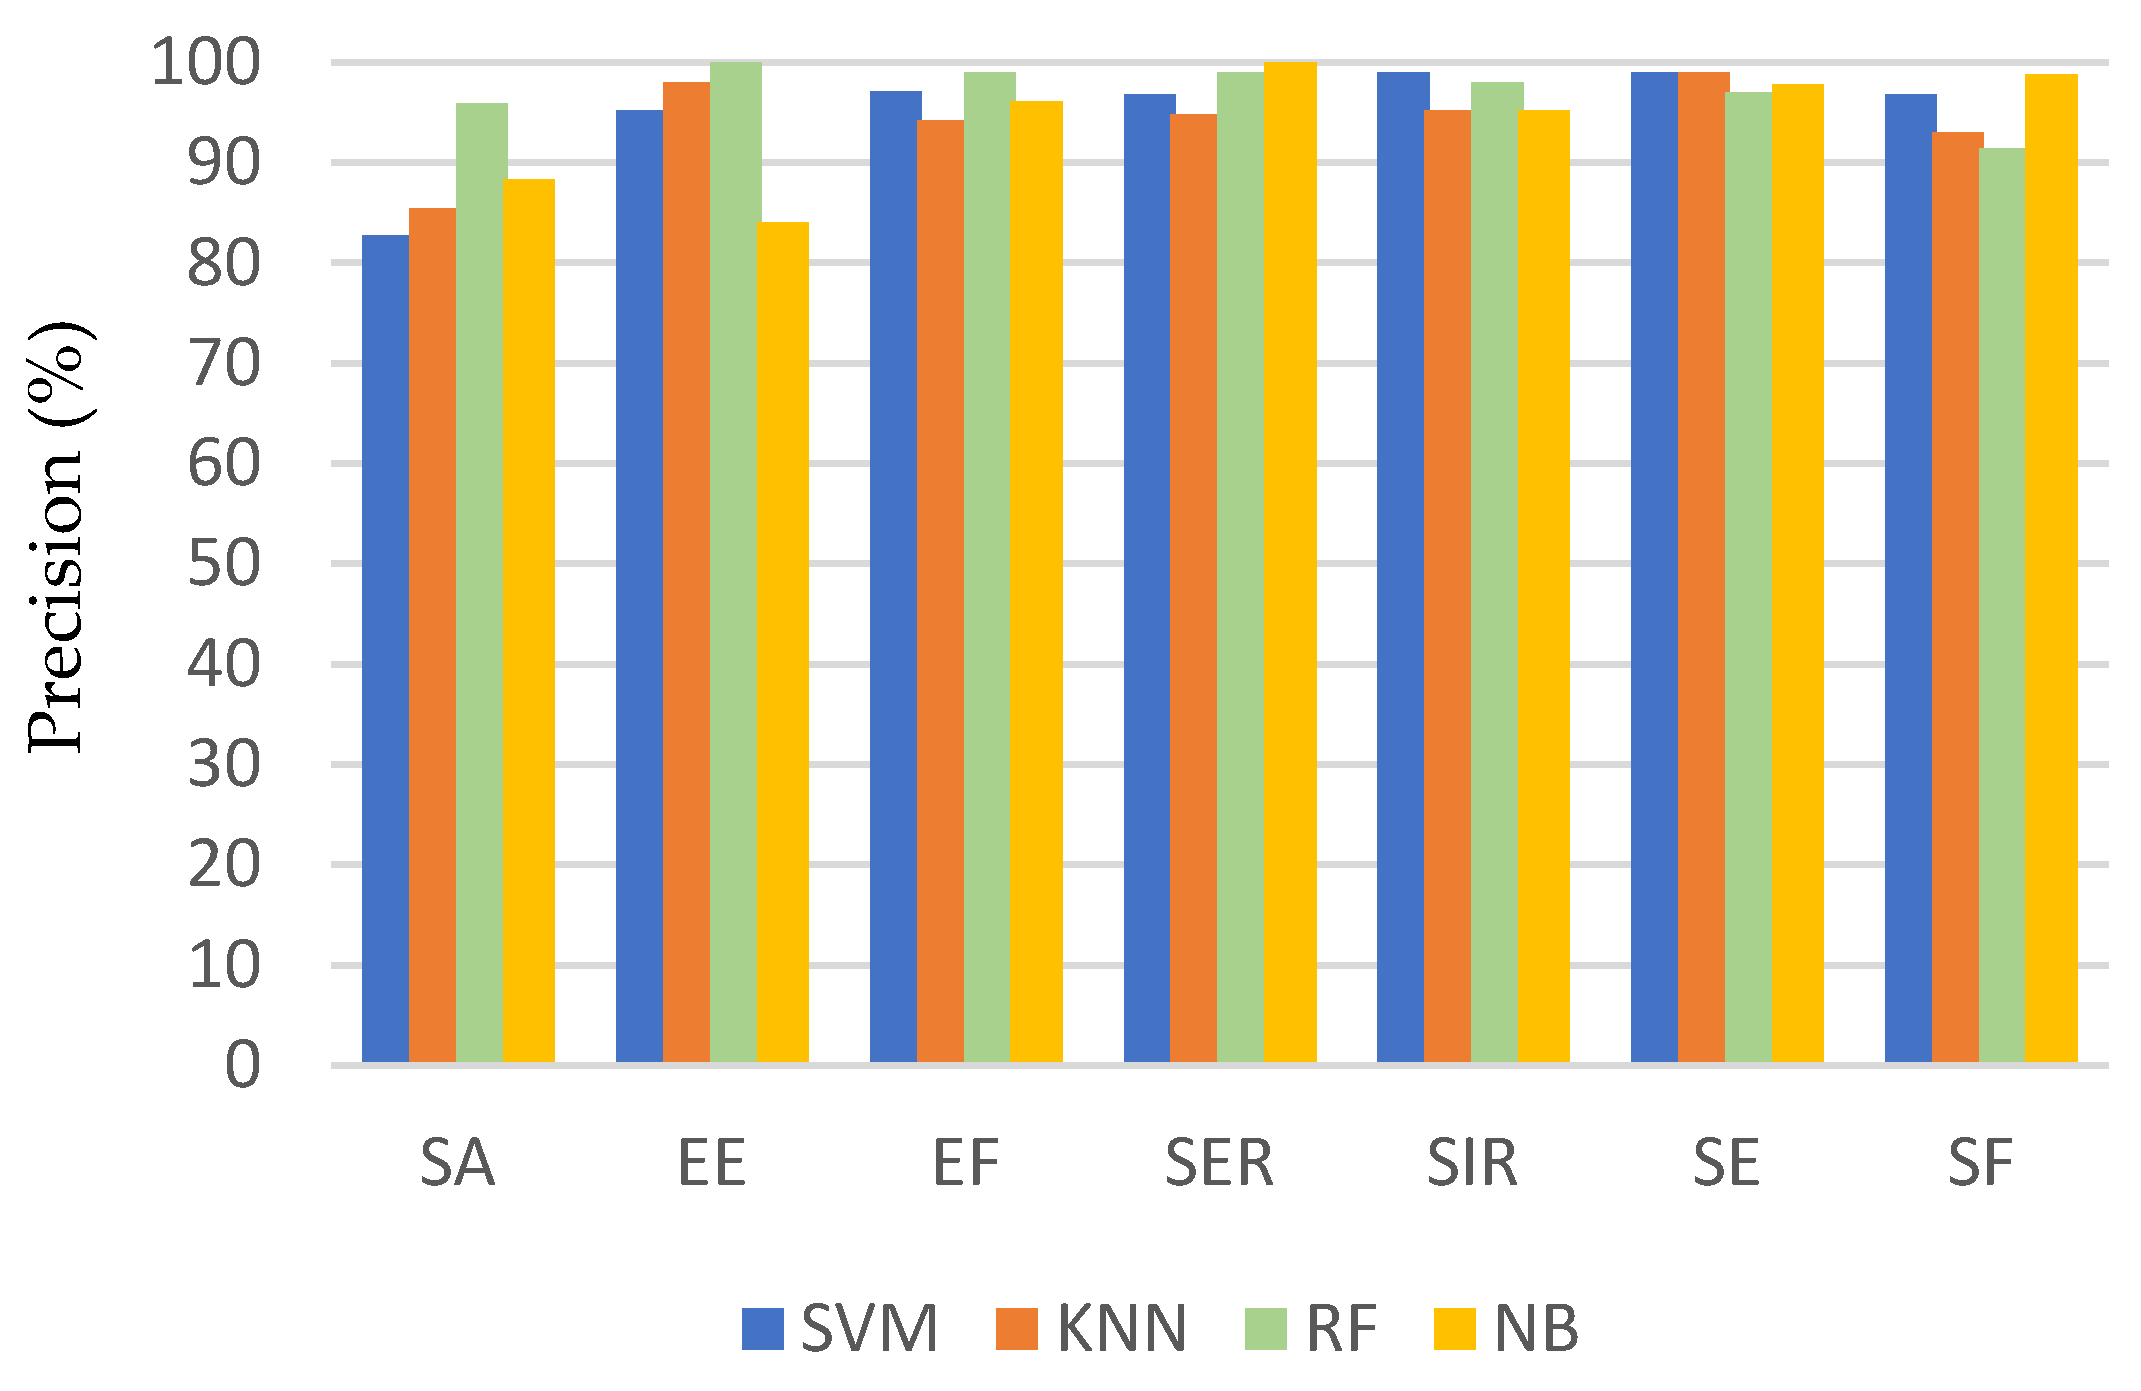
3. Results
4. Discussion
5. Conclusions
Author Contributions
Funding
Informed Consent Statement
Conflicts of Interest
References
- O’Sullivan, S.B.; Schmitz, T.J.; Fulk, G. Physical Rehabilitation, 7th ed.; F.A. Davis Co.: Philadelphia, PA, USA, 2019. [Google Scholar]
- Ding, D.; Ayubi, S.; Hiremath, S.; Parmanto, B. Physical activity monitoring and sharing platform for manual wheelchair users. In Proceedings of the 2012 Annual International Conference of the IEEE Engineering in Medicine and Biology Society, San Diego, CA, USA, 28 August–1 September 2012; Volume 2012, pp. 5833–5836. [Google Scholar]
- Harvey, L.A. Physiotherapy rehabilitation for people with spinal cord injuries. J. Physiother. 2016, 62, 4–11. [Google Scholar] [CrossRef] [Green Version]
- Burns, A.S.; Marino, R.J.; Kalsi-Ryan, S.; Middleton, J.W.; Tetreault, L.A.; Dettori, J.R.; Mihalovich, K.E.; Fehlings, M.G. Type and Timing of Rehabilitation Following Acute and Subacute Spinal Cord Injury: A Systematic Review. Glob. Spine J. 2017, 7, 175S–194S. [Google Scholar] [CrossRef] [Green Version]
- Warms, C.A.; Whitney, J.D.; Belza, B. Measurement and description of physical activity in adult manual wheelchair users. Disabil. Health J. 2008, 1, 236–244. [Google Scholar] [CrossRef] [PubMed] [Green Version]
- Bouvier, B.; Duprey, S.; Claudon, L.; Dumas, R.; Savescu, A. Upper Limb Kinematics Using Inertial and Magnetic Sensors: Comparison of Sensor-to-Segment Calibrations. Sensors 2015, 15, 18813–18833. [Google Scholar] [CrossRef] [PubMed]
- El-Gohary, M.; McNames, J. Human Joint Angle Estimation with Inertial Sensors and Validation with A Robot Arm. IEEE Trans. Biomed. Eng. 2015, 62, 1759–1767. [Google Scholar] [CrossRef] [PubMed]
- Peppoloni, L.; Filippeschi, A.; Ruffaldi, E.; Avizzano, C.A. (WMSDs issue) A novel wearable system for the online assessment of risk for biomechanical load in repetitive efforts. Int. J. Ind. Ergon. 2014, 52, 1–11. [Google Scholar] [CrossRef]
- Alvarez, D.; Alvarez, J.C.A.; Gonzalez, R.C.; López, A.M. Upper limb joint angle measurement in occupational health. Comput. Methods Biomech. Biomed. Eng. 2016, 19, 159–170. [Google Scholar] [CrossRef]
- Robert-Lachaine, X.; Mecheri, H.; Larue, C.; Plamondon, A. Validation of inertial measurement units with an optoelectronic system for whole-body motion analysis. Med. Biol. Eng. Comput. 2017, 55, 609–619. [Google Scholar] [CrossRef]
- Miezal, M.; Taetz, B.; Bleser, G. On Inertial Body Tracking in the Presence of Model Calibration Errors. Sensors 2016, 16, 1132. [Google Scholar] [CrossRef]
- Pernek, I.; Kurillo, G.; Stiglic, G.; Bajcsy, R. Recognizing the intensity of strength training exercises with wearable sensors. J. Biomed. Inform. 2015, 58, 145–155. [Google Scholar] [CrossRef] [PubMed] [Green Version]
- Biswas, D.; Cranny, A.; Gupta, N.; Maharatna, K.; Achner, J.; Klemke, J. Recognizing upper limb movements with wrist worn inertial sensors using k-means clustering classification. Hum. Mov. Sci. 2015, 40, 59–76. [Google Scholar] [CrossRef] [Green Version]
- Panwar, M.; Dyuthi, S.R.; Prakash, K.C.; Biswas, D.; Acharyya, A.; Maharatna, K.; Gautam, A.; Naik, G.R. CNN based approach for activity recognition using a wrist-worn accelerometer. In Proceedings of the 2017 39th Annual International Conference of the IEEE Engineering in Medicine and Biology Society (EMBC), Jeju Island, Korea, 11–15 July 2017; pp. 2438–2441. [Google Scholar]
- Lin, H.-C.; Chiang, S.-Y.; Lee, K.; Kan, Y.-C. An Activity Recognition Model Using Inertial Sensor Nodes in a Wireless Sensor Network for Frozen Shoulder Rehabilitation Exercises. Sensors 2015, 15, 2181–2204. [Google Scholar] [CrossRef] [Green Version]
- Cai, S.; Chen, Y.; Huang, S.; Wu, Y.; Zheng, H.; Li, X.; Xie, L. SVM-Based Classification of sEMG Signals for Upper-Limb Self-Rehabilitation Training. Front. Neurorobot. 2019, 13, 31. [Google Scholar] [CrossRef] [Green Version]
- Zambrana, C.; Idelsohn-Zielonka, S.; Claramunt-Molet, M.; Almenara-Masbernat, M.; Opisso, E.; Tormos, J.M.; Miralles, F.; Vargiu, E. Monitoring of upper-limb movements through inertial sensors—Preliminary results. Smart Health 2019, 13, 100059. [Google Scholar] [CrossRef]
- Nora, A.; Al-Dossari, H. Review of Physical Activities Recognition for Patients with Spinal Cord Injuries. J. Theor. Appl. Inf. Technol. 2020, 98, 2158–2173. [Google Scholar]
- Nas, K.; Yazmalar, L.; Şah, V.; Aydın, A.; Öneş, K. Rehabilitation of spinal cord injuries. World J. Orthop. 2015, 6, 8–16. [Google Scholar] [CrossRef] [PubMed]
- Côté, M.-P.; Murray, M.; Lemay, M.A. Rehabilitation Strategies after Spinal Cord Injury: Inquiry into the Mechanisms of Success and Failure. J. Neurotrauma 2017, 34, 1841–1857. [Google Scholar] [CrossRef] [PubMed] [Green Version]
- Physio Therapy Exercises. Available online: https://www.physiotherapyexercises.com (accessed on 3 October 2019).
- Elhoushi, M.; Georgy, J.; Noureldin, A.; Korenberg, M.J. A Survey on Approaches of Motion Mode Recognition Using Sensors. IEEE Trans. Intell. Transp. Syst. 2017, 18, 1662–1686. [Google Scholar] [CrossRef]
- García-Massó, X.; Serra-Añó, P.; Gonzalez, L.M.; Ye-Lin, Y.; Prats-Boluda, G.; Garcia-Casado, J. Identifying physical activity type in manual wheelchair users with spinal cord injury by means of accelerometers. Spinal Cord 2015, 53, 772–777. [Google Scholar] [CrossRef]
- Siirtola, P.; Laurinen, P.; Röning, J.; Kinnunen, H. Efficient accelerometer-based swimming exercise tracking. In Proceedings of the 2011 IEEE Symposium on Computational Intelligence and Data Mining (CIDM), Paris, France, 11–15 April 2017; 2011; pp. 156–161. [Google Scholar]
- Twomey, N.; Diethe, T.; Fafoutis, X.; Elsts, A.; McConville, R.; Flach, P.; Craddock, I. A Comprehensive Study of Activity Recognition Using Accelerometers. Informatics 2018, 5, 27. [Google Scholar] [CrossRef] [Green Version]
- Bergmann, J.H.M.; McGregor, A.H. Body-Worn Sensor Design: What Do Patients and Clinicians Want? Ann. Biomed. Eng. 2011, 39, 2299–2312. [Google Scholar] [CrossRef]
- Han, S.; Meng, Z.; Omisore, O.; Akinyemi, T.; Yan, Y. Random Error Reduction Algorithms for MEMS Inertial Sensor Accuracy Improvement—A Review. Micromachines 2020, 11, 1021. [Google Scholar] [CrossRef]
- Erdaş, B.; Atasoy, I.; Açici, K.; Oǧul, H. Integrating Features for Accelerometer-based Activity Recognition. Procedia Comput. Sci. 2016, 58, 522–527. [Google Scholar] [CrossRef] [Green Version]
- Noor, M.H.M.; Salcic, Z.; Wang, K.I.-K. Adaptive sliding window segmentation for physical activity recognition using a single tri-axial accelerometer. Pervasive Mob. Comput. 2017, 38, 41–59. [Google Scholar] [CrossRef]
- Ling, Y. Automatic Human Daily Activity Segmentation Applying Smart Sensing Technology. Int. J. Smart Sens. Intell. Syst. 2015, 8, 1624–1640. [Google Scholar] [CrossRef] [Green Version]
- Alhammad, N.; Al-Dossari, H. Dynamic Segmentation for Physical Activity Recognition Using a Single Wearable Sensor. Appl. Sci. 2021, 11, 2633. [Google Scholar] [CrossRef]
- Hiremath, S.V.; Intille, S.S.; Kelleher, A.; Cooper, R.A.; Ding, D. Detection of physical activities using a physical activity monitor system for wheelchair users. Med. Eng. Phys. 2015, 37, 68–76. [Google Scholar] [CrossRef] [PubMed]
- Wannenburg, J.; Malekian, R. Physical Activity Recognition from Smartphone Accelerometer Data for User Context Awareness Sensing. IEEE Trans. Syst. Man, Cybern. Syst. 2017, 47, 3142–3149. [Google Scholar] [CrossRef]
- Guo, S.; Xiong, H.; Zheng, X.; Zhou, Y. Activity Recognition and Semantic Description for Indoor Mobile Localization. Sensors 2017, 17, 649. [Google Scholar] [CrossRef] [Green Version]
- Ni, Q.; Zhang, L.; Li, L. A Heterogeneous Ensemble Approach for Activity Recognition with Integration of Change Point-Based Data Segmentation. Appl. Sci. 2018, 8, 1695. [Google Scholar] [CrossRef] [Green Version]
- Li, J.-H.; Tian, L.; Wang, H.; An, Y.; Wang, K.; Yu, L. Segmentation and Recognition of Basic and Transitional Activities for Continuous Physical Human Activity. IEEE Access 2019, 7, 42565–42576. [Google Scholar] [CrossRef]
- Cheng, W.C.; Jhan, D.M. Triaxial accelerometer-based fall detection method using a self-constructing cascade-AdaBoost-SVM classifier. IEEE J. Biomed. Health Inform. 2013, 17, 411–419. [Google Scholar] [CrossRef] [PubMed]
- Cornacchia, M.; Ozcan, K.; Zheng, Y.; Velipasalar, S. A Survey on Activity Detection and Classification Using Wearable Sensors. IEEE Sens. J. 2017, 17, 386–403. [Google Scholar] [CrossRef]
- Pavlov, Y.L. Random Forests. Random For. 2019, 1–122. [Google Scholar] [CrossRef]
- Noi, P.T.; Kappas, M. Comparison of Random Forest, k-Nearest Neighbor, and Support Vector Machine Classifiers for Land Cover Classification Using Sentinel-2 Imagery. Sensors 2017, 18, 18. [Google Scholar] [CrossRef] [Green Version]
- Wang, G.; Li, Q.; Wang, L.; Wang, W.; Wu, M.; Liu, T. Impact of Sliding Window Length in Indoor Human Motion Modes and Pose Pattern Recognition Based on Smartphone Sensors. Sensors 2018, 18, 1965. [Google Scholar] [CrossRef] [Green Version]
- Janidarmian, M.; Fekr, A.R.; Radecka, K.; Zilic, Z. A Comprehensive Analysis on Wearable Acceleration Sensors in Human Activity Recognition. Sensors 2017, 17, 529. [Google Scholar] [CrossRef]
- Micheal, T. Golf Swing Segmentation from a Single IMU Using Machine Learning. Mach. Learn. 2017, 45, 40–48. [Google Scholar]
- Ni, Q.; Patterson, T.; Cleland, I.; Nugent, C. Dynamic detection of window starting positions and its implementation within an activity recognition framework. J. Biomed. Inform. 2016, 62, 171–180. [Google Scholar] [CrossRef]


| Name | Definition |
|---|---|
| Minimum | lowest ai, i = 1, 2, …, N |
| Maximum | highest ai, i = 1, 2, …, N |
| Range | max(a)–min(a) |
| Mean | |
| Standard Deviation | |
| Root Mean Square |
| Accuracy | Recall | Precision | F1 Score | |
|---|---|---|---|---|
| SVM | 94.86% ± 5.5% | 94.86% ± 4.1% | 95.21% ± 5.7% | 94.91% ± 3.5% |
| KNN | 94.15% ± 3.6% | 94.15% ± 3.8% | 94.22% ± 4.5% | 94.16% ± 3.8% |
| RF | 96.86% ± 4% | 96.86% ± 1.5% | 97.2% ± 2.9% | 97.02% ± 2% |
| NB | 94% ± 6.1% | 94% ± 7% | 94.33% ± 6% | 93.91% ± 4.1% |
| Actual Activity | Predicted Activity | ||||||
|---|---|---|---|---|---|---|---|
| SA | EE | EF | SER | SIR | SE | SF | |
| SA | 96 | 1 | 3 | ||||
| EE | 99 | 1 | |||||
| EF | 99 | 1 | |||||
| SER | 9 | 2 | 89 | ||||
| SIR | 1 | 2 | 97 | ||||
| SE | 3 | 3 | 94 | ||||
| SF | 10 | 90 | |||||
| Actual Activity | Predicted Activity | ||||||
|---|---|---|---|---|---|---|---|
| SA | EE | EF | SER | SIR | SE | SF | |
| SA | 88 | 2 | 2 | 5 | 3 | ||
| EE | 95 | 4 | 1 | ||||
| EF | 98 | 2 | |||||
| SER | 8 | 91 | 1 | ||||
| SIR | 98 | 2 | |||||
| SE | 96 | ||||||
| SF | 7 | 93 | |||||
| Actual Activity | Predicted Activity | ||||||
|---|---|---|---|---|---|---|---|
| SA | EE | EF | SER | SIR | SE | SF | |
| SA | 94 | 6 | |||||
| EE | 98 | 2 | |||||
| EF | 97 | 3 | |||||
| SER | 97 | 3 | |||||
| SIR | 1 | 1 | 98 | ||||
| SE | 2 | 98 | |||||
| SF | 4 | 96 | |||||
| Actual Activity | Predicted Activity | ||||||
|---|---|---|---|---|---|---|---|
| SA | EE | EF | SER | SIR | SE | SF | |
| SA | 98 | 1 | 1 | ||||
| EE | 95 | 4 | 1 | ||||
| EF | 99 | 1 | |||||
| SER | 1 | 2 | 97 | ||||
| SIR | 1 | 99 | |||||
| SE | 6 | 4 | 90 | ||||
| SF | 12 | 8 | 80 | ||||
| SA | EE | EF | SER | SIR | SE | SF | Overall Accuracy | |
|---|---|---|---|---|---|---|---|---|
| Sliding window (2 s) | 87.44% | 95.48% | 94.48% | 93.47% | 94.48% | 93% | 86.14% | 91.86% |
| Sliding window (2.5 s) | 88.56% | 94.42% | 90.65% | 91.93% | 93.88% | 93.54% | 87.81% | 91.58% |
| Sliding window (3.5 s) | 82.42% | 90.46% | 88.56% | 88.45% | 89.56% | 88.56% | 81% | 87% |
| Our method | 94.96% | 98.99% | 97.98% | 97.98% | 98% | 97.52% | 93.66% | 96.86% |
Publisher’s Note: MDPI stays neutral with regard to jurisdictional claims in published maps and institutional affiliations. |
© 2021 by the authors. Licensee MDPI, Basel, Switzerland. This article is an open access article distributed under the terms and conditions of the Creative Commons Attribution (CC BY) license (https://creativecommons.org/licenses/by/4.0/).
Share and Cite
Alhammad, N.; Al-Dossari, H. Recognizing Physical Activities for Spinal Cord Injury Rehabilitation Using Wearable Sensors. Sensors 2021, 21, 5479. https://doi.org/10.3390/s21165479
Alhammad N, Al-Dossari H. Recognizing Physical Activities for Spinal Cord Injury Rehabilitation Using Wearable Sensors. Sensors. 2021; 21(16):5479. https://doi.org/10.3390/s21165479
Chicago/Turabian StyleAlhammad, Nora, and Hmood Al-Dossari. 2021. "Recognizing Physical Activities for Spinal Cord Injury Rehabilitation Using Wearable Sensors" Sensors 21, no. 16: 5479. https://doi.org/10.3390/s21165479
APA StyleAlhammad, N., & Al-Dossari, H. (2021). Recognizing Physical Activities for Spinal Cord Injury Rehabilitation Using Wearable Sensors. Sensors, 21(16), 5479. https://doi.org/10.3390/s21165479