Article

Identification of Autism Subtypes Based on Wavelet Coherence of BOLD FMRI Signals Using Convolutional Neural Network

by
Mohammed Isam Al-Hiyali
1,†,
Norashikin Yahya
1,*,†,
Ibrahima Faye
1 and
Ahmed Faeq Hussein
2
1
Centre for Intelligent Signal and Imaging Research (CISIR), Department of Electrical and Electronic Engineering, Universiti Teknologi PETRONAS, Seri Iskandar 32610, Perak, Malaysia
2
Biomedical Engineering Department, Faculty of Engineering, Al-Nahrain University, Baghdad 10072, Iraq
*
Author to whom correspondence should be addressed.
These authors contributed equally to this work.
Sensors 2021, 21(16), 5256; https://doi.org/10.3390/s21165256
Submission received: 13 June 2021 / Revised: 16 July 2021 / Accepted: 20 July 2021 / Published: 4 August 2021

Abstract

:
The functional connectivity (FC) patterns of resting-state functional magnetic resonance imaging (rs-fMRI) play an essential role in the development of autism spectrum disorders (ASD) classification models. There are available methods in literature that have used FC patterns as inputs for binary classification models, but the results barely reach an accuracy of 80%. Additionally, the generalizability across multiple sites of the models has not been investigated. Due to the lack of ASD subtypes identification model, the multi-class classification is proposed in the present study. This study aims to develop automated identification of autism spectrum disorder (ASD) subtypes using convolutional neural networks (CNN) using dynamic FC as its inputs. The rs-fMRI dataset used in this study consists of 144 individuals from 8 independent sites, labeled based on three ASD subtypes, namely autistic disorder (ASD), Asperger’s disorder (APD), and pervasive developmental disorder not otherwise specified (PDD-NOS). The blood-oxygen-level-dependent (BOLD) signals from 116 brain nodes of automated anatomical labeling (AAL) atlas are used, where the top-ranked node is determined based on one-way analysis of variance (ANOVA) of the power spectral density (PSD) values. Based on the statistical analysis of the PSD values of 3-level ASD and normal control (NC), putamen_R is obtained as the top-ranked node and used for the wavelet coherence computation. With good resolution in time and frequency domain, scalograms of wavelet coherence between the top-ranked node and the rest of the nodes are used as dynamic FC feature input to the convolutional neural networks (CNN). The dynamic FC patterns of wavelet coherence scalogram represent phase synchronization between the pairs of BOLD signals. Classification algorithms are developed using CNN and the wavelet coherence scalograms for binary and multi-class identification were trained and tested using cross-validation and leave-one-out techniques. Results of binary classification (ASD vs. NC) and multi-class classification (ASD vs. APD vs. PDD-NOS vs. NC) yielded, respectively, 89.8% accuracy and 82.1% macro-average accuracy, respectively. Findings from this study have illustrated the good potential of wavelet coherence technique in representing dynamic FC between brain nodes and open possibilities for its application in computer aided diagnosis of other neuropsychiatric disorders, such as depression or schizophrenia.

1. Introduction

Autism spectrum disorder (ASD) is a psychiatric disorder caused by impairment in brain functions [1]. ASD patients suffer from weakness in verbal and non-verbal communication and difficulty in social activities, which may influence their life quality and interpersonal skills. A report by the World Health Organization has indicated that, in 2019 alone, 1 in 160 children has ASD [2]. One of the challenges in clinical diagnosis of ASD is the lack of objective interpretation mechanisms of ASD  [3]. Current practise of clinical diagnosis of ASD is based on behavioral assessment, but with high heterogeneous nature of ASD and varying clinical symptoms [4] may render the diagnosis to be inaccurate. Based on the Diagnostic and Statistical Manual of Mental Disorders (DSM-4), ASD is categorized into three subtypes based on symptom variations; autistic disorder (ASD), Asperger’s disorder (APD), and pervasive developmental disorder not otherwise specified (PDD-NOS) [5]. However, accurate behavioral assessment requires a trained psychiatrist and is susceptible to human error either during the assessment or interpreting the results. This issue may hinder the treating progress of the ASD patients. Indeed, an objective early ASD detection and suitable therapeutic plans choice are essential in improving the condition and quality of life of the ASD patients. In the past two decades, neuroscience studies have been making progress in characterizing biomarkers for interpreting neural mechanisms of ASD using functional brain imaging modalities [6]. In a similar trend, there is also a rapid increase in application of artificial intelligence (AI) models in the medical diagnosis field, especially in psychiatric disorders [7]. The use of AI has improved the diagnosis results and decreased the decision time associated with the traditional diagnosis method. In ASD cases, several studies are devoted to using resting-state functional magnetic resonance imaging (rs-fMRI) data with different types of AI classifiers [8]. Generally, the functional magnetic resonance imaging (fMRI) is a non-invasive modality and has emerged as a powerful tool for depicting brain functionality of the cortex to deep brain regions. The fMRI provide the estimation of neuronal activity based on blood-oxygen-level-dependent (BOLD) [9], as indirect signals that reflect the fluctuation in brain blood flow and blood oxygenation levels coupled to underlying neuronal activity [10]. In a resting state experiment, the functional brain networks are detected without any specific tasks [11]. Using the BOLD signals analysis at resting state helps neuroscientists to understand the fundamental mechanism of brain functioning of ASD patients [7]. One common measure of brain functionality is by using functional connectivity (FC) of BOLD signals between brain regions which gives indication of the statistical correlation between different regions [12]. In general, there are two main models applied in BOLD signals analysis, static (SFC) and dynamic (DFC) functional connectivity [13], both can be used for detection of psychiatric disorders [14]. The SFC and DFC differ in their method of calculating the correlation coefficients. The SFC represents the interaction between pairs of brain nodes as a single correlation coefficient calculated from the BOLD signals of the entire scan but no temporal variations are considered in the calculation. In contrast, the DFC is calculated using wavelet transform, hence capturing both time and frequency details of the BOLD signals. It indicated the coherence strength between pairs of brain regions, represented in the form of two-dimensional matrix called scalogram.

Classification of ASD Using Functional Connectivity (FC)—Related Works

Many researches on brain FC are focussing on identifying the neurological biomarkers for ASD patients [15]. Application of SFC [10,12,16,17,18], and DFC [19] for detection of ASD in rs-fMRI has been investigated in the past papers. This section summarized the related works on ASD classification algorithms based on SFC and DFC as inputs to machine learning (ML) [16,17,19] or deep learning architecture [10,12]. Recent advancement in deep learning has enables the transfer learning technique which is known to effectively improve the identification accuracy of diagnostic algorithms [20,21]. The number of SFC features generated from correlation coefficients of the BOLD signals usually amount to the order of thousands but the classification accuracy based on these features still need to be improved. This is because only some regions of the brain carry the informative features that discriminate ASD vs. normal control (NC). In [16] Chen et al. used Pearson correlation of pairwise BOLD signals in low-frequency bands as input to support vector machine (SVM), achieving 79% accuracy in ASD vs. NC prediction. In another work by Abraham et al. [17], covariance matrices of pairwise BOLD signals are used as the input features to an SVM classifier giving 67% accuracy. Recently, Chaitra et al. [18] achieved 70.1% accuracy for ASD prediction using combination of Pearson correlation with complex brain network measurements as input features to the recursive-cluster-elimination-SVM (RCE-SVM) algorithm.
Apart from using conventional ML techniques, deep learning (DL) algorithms are also used in the development of binary classification algorithms of ASD v. NC using SFC features. The recent one by Heinsfeld, et al. [12], used two stacked denoising autoencoders to transfer 19,900 features of FC extracted based on the Pearson correlation into the deep neural network (DNN), giving 70% classification accuracy. The other one is by Zeinab, et al. [10], where Pearson correlation coefficients are input to the CNN as images and binary classification accuracy of 70.2%. An approach using DFC between pairwise BOLD signals by employing wavelet coherence transforms (WCT) was proposed by Bernas et al. [19]. The WCT coefficients are used as the input vector to SVM achieving 80% accuracy for ASD vs. NC prediction. Apart from FC, the time-frequency components of BOLD signals are represented into 2D images in our previous study [21] and used as input to the CNN models for feature extraction, and k-nearest neighbors (KNN) as a best classifier algorithm with 85.9% accuracy.
The ML-based techniques using either SFC or DFC are not able to capture the topological information within the brain regions and the relationships between the neural activity features and the clinical symptoms [22]. This is proven to be more difficult especially on the highly heterogeneous symptoms, such as ASD subtypes. However, the results of the studies mentioned above have had a minimal clinical impact. The reason for that is the vast majority of these studies have typically reported differences between ASD patients and normal controls, with best accuracy of 80%. At the same time, in clinical decisions, the ASD subtypes should not be ignored. Thus, the multi-class classification algorithm is critical in assisting ASD health practitioners in correct diagnosis of ASD subtypes. It is to be noted that the SFC features may not carry sufficient information for multi-class classification [23]. Hence, a better choice would be using the DFC which represents correlation as a function of time-frequency between BOLD signals. There is evidence that DFC patterns may play a crucial role in identifying subtypes of psychiatric disorders, such as ASD. Indeed, the DFC patterns have been rarely investigated as input features for ASD classification models. In [19] wavelet coherence transforms (WCT) and SVM are used for binary classification of ASD. With accuracy of 80%, this leaves much room for improvement.
In this work, we developed an ASD classification algorithm based on wavelet coherence of BOLD signals and CNN. In specific, the calculation of the wavelet coherence are calculated between the top-ranked brain node to the rest of the nodes of automated anatomical labeling (AAL) atlas. Method of statistical significance analysis is employed on the power spectral density (PSD) of the BOLD signals from 116 brain nodes to determine the most significant node in multi-class (3-level ASD and NC) settings. A total of 115 wavelet coherence scalograms generated for each subject, represent the time-frequency resolution of the signal which may provide valuable information in identification of ASD subtypes. Results generated from this work are using dataset from the autism brain imaging data exchange (ABIDE) [24] which is an online data source for rs-fMRI data of ASD patients and normal control (NC) groups collected from several neuroscience laboratories worldwide. The rest of this study is organized as follows. Section 2 describes the materials and proposed methods, including the data preparation, BOLD-dynamic features extraction and classification models. The results and comparison with benchmark studies are explained in Section 3 providing conclusions and future works in this area in Section 4. The objective of this study is to develop an automated ASD subtypes classification using DFC patterns of rs-fMRI data. DFC features extracted using pairwise WCT, inherently leveraging the rich information of the WCT both in time and frequency domains.

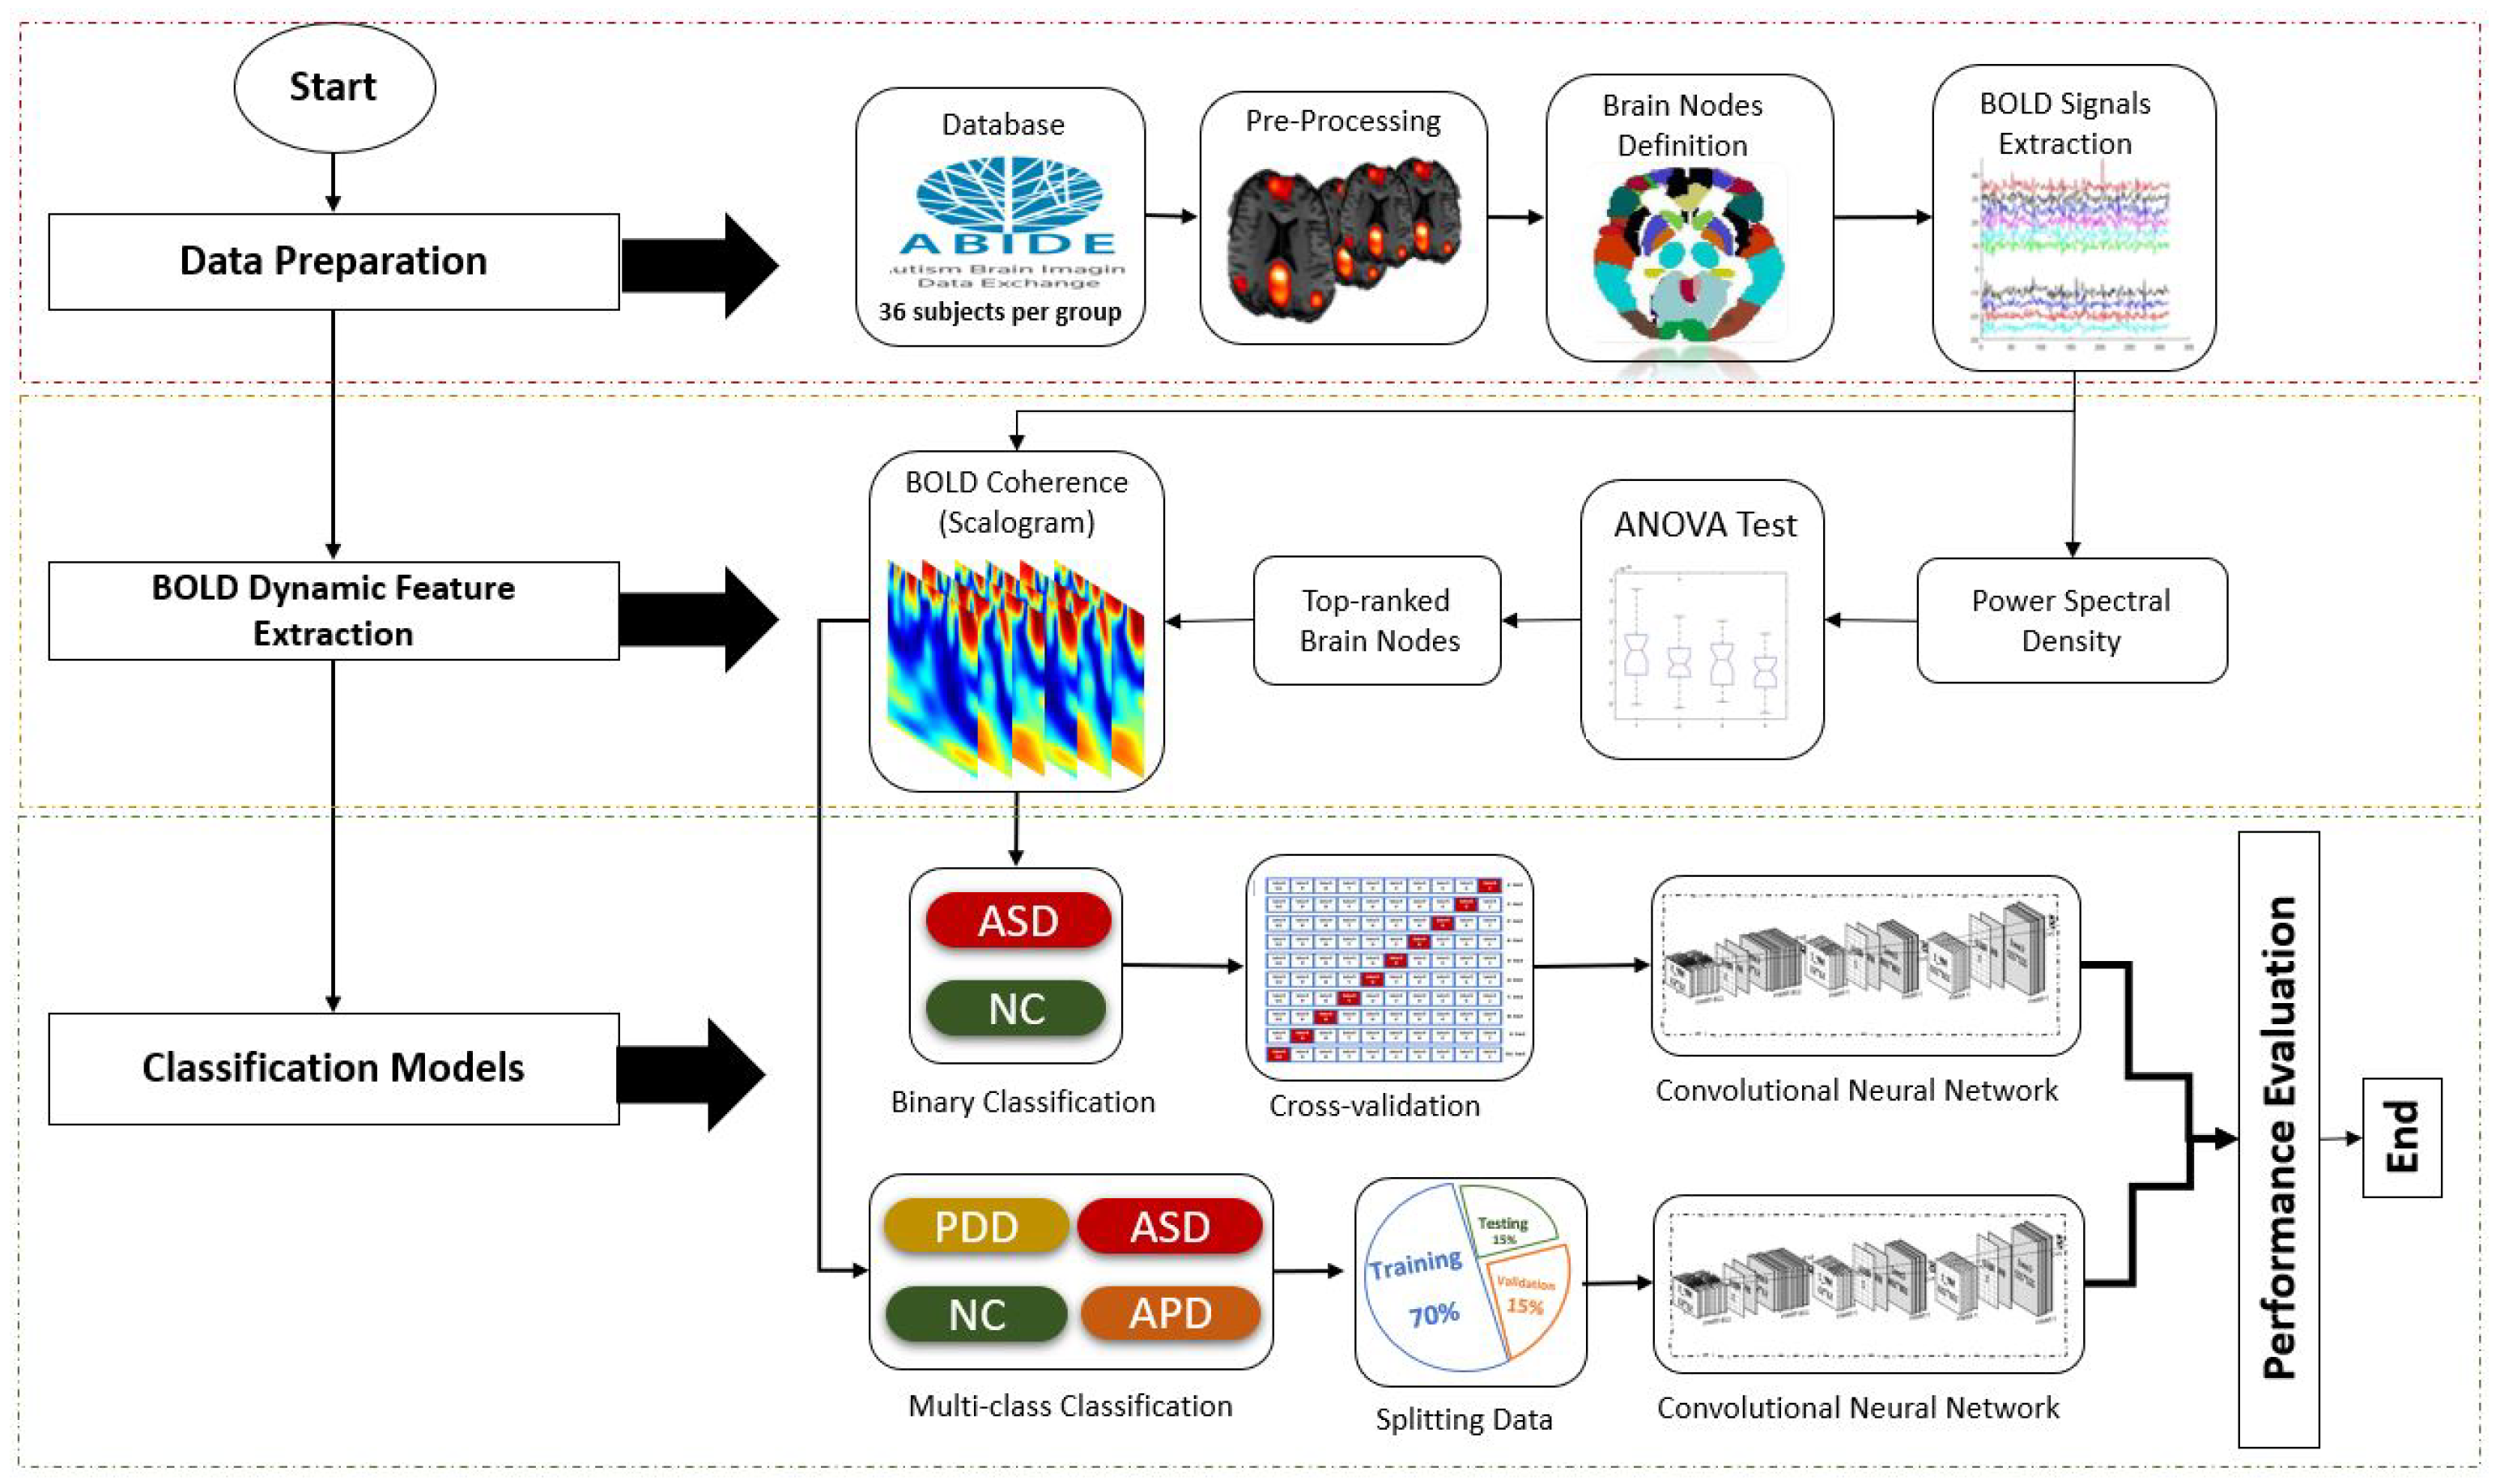
2. Materials and Methods

Overall methodology in the development of automated ASD subtypes classification using DFC patterns of rs-fMRI data is illustrated in Figure 1. Here, we consider 2 classification techniques, binary and multi-class classifications.

2.1. Data Preparation

In this study, resting-state fMRI data are collected from multiple sites of ABIDE dataset [24]. The ABIDE data contain longitudinal relaxation time (T1) structural MRI brain images, fMRI images, and phenotypic information of the patients. Although ABIDE has more than 1000 subjects, with 446 ASD and 590 NC, coming from various contributors, not all ASD data are labeled based on the subtypes of DSM-4. Specifically, the available data based on DSM-4 are 323 ASD, 87 APD, and 36 PDD-NOS subjects. To avoid the issue of an imbalanced dataset which might affect the performance of the classifier, the number of subjects for each group is set at 36, the smallest sample size of ASD class. Details on the dataset, its scanning parameter and the number of subjects are listed in Table 1. All datasets were acquired using 3 Tesla (3T) MRI scanners.
The use of multi-site data introduces larger data variance during the training of the classifier due to differences in scanning parameters or type of scanner. The multi-site data may pose a challenge in generalizing the trained ASD classifiers [12] and this issue will be experimented here using leave-one-site out validation method.
The selected data were pre-processed by using the DPARSF Matlab toolbox followed by BOLD signals extraction [25] from 116 regions of the automated anatomical labeling (AAL) atlas. The AAL atlas divides the brain region into 116 nodes, as shown in Table A1 under the Appendix A. Since there is variation in recording time, the number for sample points of the BOLD signals varies from one site to the other. Therefore, in order to work with the same length of data, the signal is truncated to the shortest sample point, which is 145 time points.

2.2. Statistical Analysis Using Power Spectral Density (PSD)

The dimension of the BOLD time series for each subject is 145-points × 116-region. If the WCT between all brain nodes are to be used in this investigation, the number of scalogram images for each subject alone will be ( 115 × 116 ) / 2 = 6670 which is a large number of images. Furthermore, some of these images may not have a meaningful contribution in the classification of ASD subtypes, thus, would be detrimental to the classification performance. Therefore, a group-level statistical test is performed to select the most significant brain node based on the PSD of the BOLD signals. Power spectral density of the BOLD time-series signals is estimated using Welch method [26].
Detail of the steps for finding the top-ranked node using the mean value of PSD is given in Algorithm 1. The PSD values of each 116 brain regions determined using Welch are normalized to zero mean and standard deviation of 1. Normalization is deemed necessary here since the dataset is obtained from different sites, thus ensuring the reliability of the statistical analysis. Next, the average of the normalized PSD values are used as the input for one-way analysis of variance (ANOVA) test.
Algorithm 1: Method of finding the top-ranked node in discriminating 3-level ASD subtypes and NC using mean value of PSD.
1.
Input data = matrix ( m × n )
m = 36 (number of subjects), n = 4 (number of group)
2.
BOLD signals = t × R j
t = time points, R j = node number (j = 1, 2, …, 116)
3.
PSD = estimate PSD for each BOLD signal
4.
P S D n = normalize and determine the average of the PSD values
5.
G j = cluster the outcome of (4) into matrix ( m × n )
6.
p-value = run ANOVA test for each cluster ( G j )
While j ≤ 116 repeat step 6
If p-value ≤ 0.05
save p-value at T
else T = empty
7.
F = Find top-ranked node based on T-index

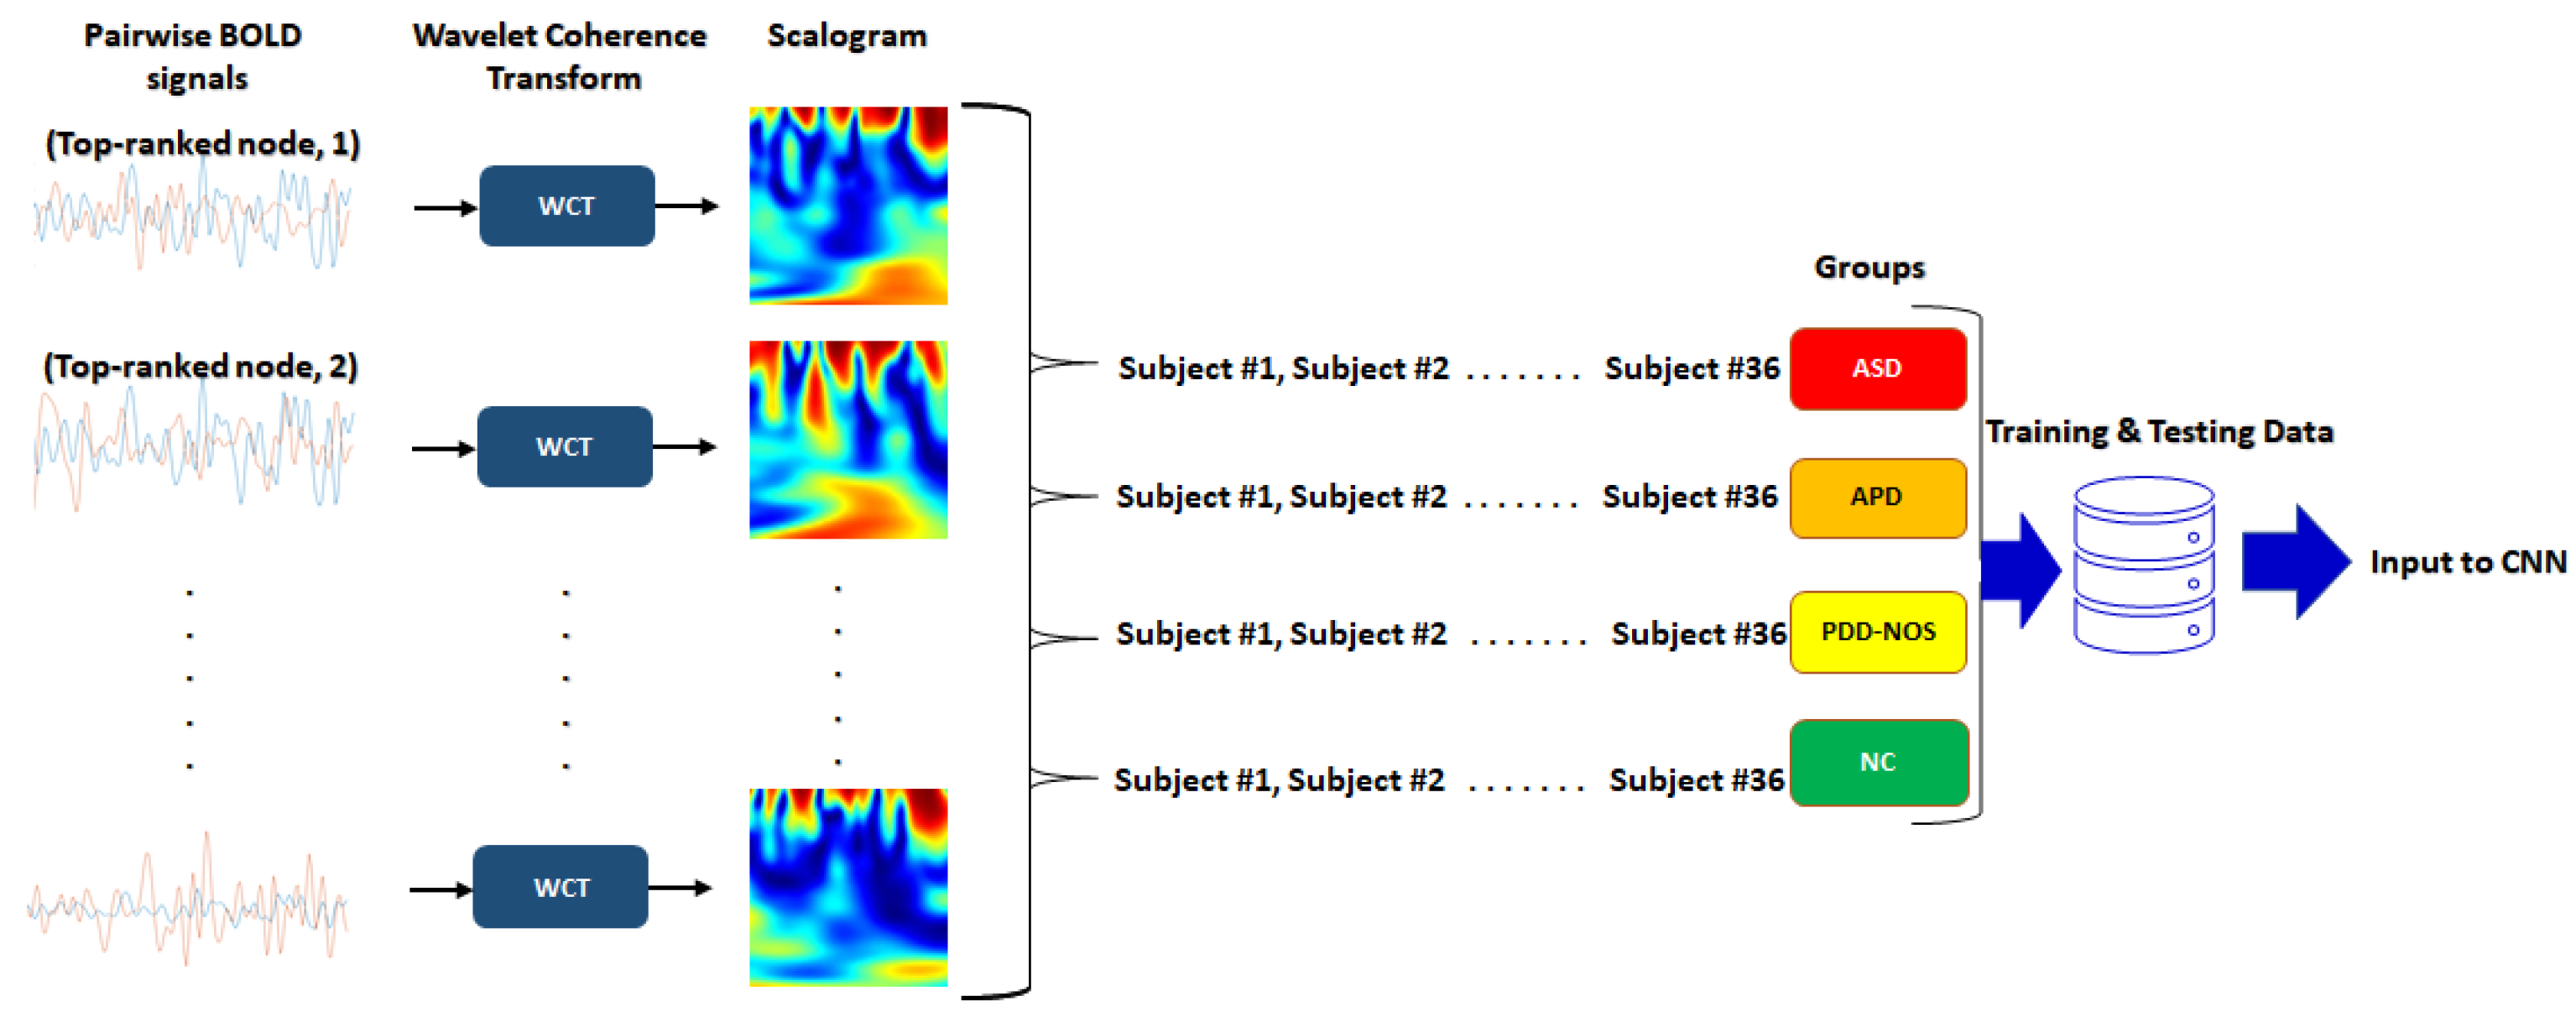
2.3. Wavelet Coherence of BOLD Time-Series Signals

Wavelet coherence of two signals is a measure of linear interaction or correlation between the signals. Since the wavelet transform provides both time and frequency domain representation of signals, WCT measures the mean resultant vector length of the cross-spectral density between two signals. In another word, the WCT will provide the phase synchronization between the pairwise BOLD signals [13,27].
Firstly, the time-frequency components for each BOLD signal were extracted by using a continuous wavelet transform (CWT). The CWT coefficient is defined as the convolution of the BOLD time series x ( t ) with the scaled and translated version of the mother wavelet ψ a , b ( t ) [28], as shown in Equation (1).
C W T ( a , b ) = 1 a x ( t ) ψ * t b a d t ,
where a denotes wavelet scale, b denotes positions and * denotes the complex conjugate [29]. The complex Morlet wavelet was selected as the mother wavelet. Morlet has the best ratio (1.03) between frequency band and wavelet scale, which helps interpreting results in the frequency domain [28]. CWT is becoming a popular method in biosignal analysis due to its ability to uncover meaningful information of non-stationary signals such as electroencephalogram (EEG) [30] and BOLD fMRI signals [19,21]. In fact, WCT based on CWT, characterizes coherence measures between two signals at multiple time scales, essentially makes no assumption about the stationarity of the input signals. Accordingly, CWT has achieved reasonable trade-off between time and frequency components [31,32].
In the subsequent step, the common power between the pairwise of BOLD signals x, y is measured at various scales a and time shift b by Equation (2):
C x y ( a , b ) = S ( C x * ( a , b ) C y ( a , b ) )
where C x ( a , b ) and C y ( a , b ) denote the CWT of x and y at scales a and positions b, the superscript * is the complex conjugate, and S is a smoothing operator in time and scale.
Then, the WCT between x and y is calculated by Equation (3):
W C T x y = C x y ( a , b ) 2 ( S C x ( a , b ) 2 ) ( S C y ( a , b ) 2 )
The WCT coefficients were represented as 2-D images involving the phase synchronization features of pairwise BOLD signals called scalogram images and will be used as the input of CNN for classification.
The scalogram image is a form of DFC between 2 BOLD signals, represented as phase synchronization patterns. In our proposed study, all coherent synchronicity features are represented as 224 × 224-pixel images and used as the input for CNN in binary and multi-class ASD classification models.
These images are the WCT between the most significant node, as determined using ANOVA test with the rest of 115 brain regions. This pairwise calculation of WCT between the top-ranked node and 115 brain regions is illustrated in Figure 2, which will produce a total of 115 scalograms per subject.

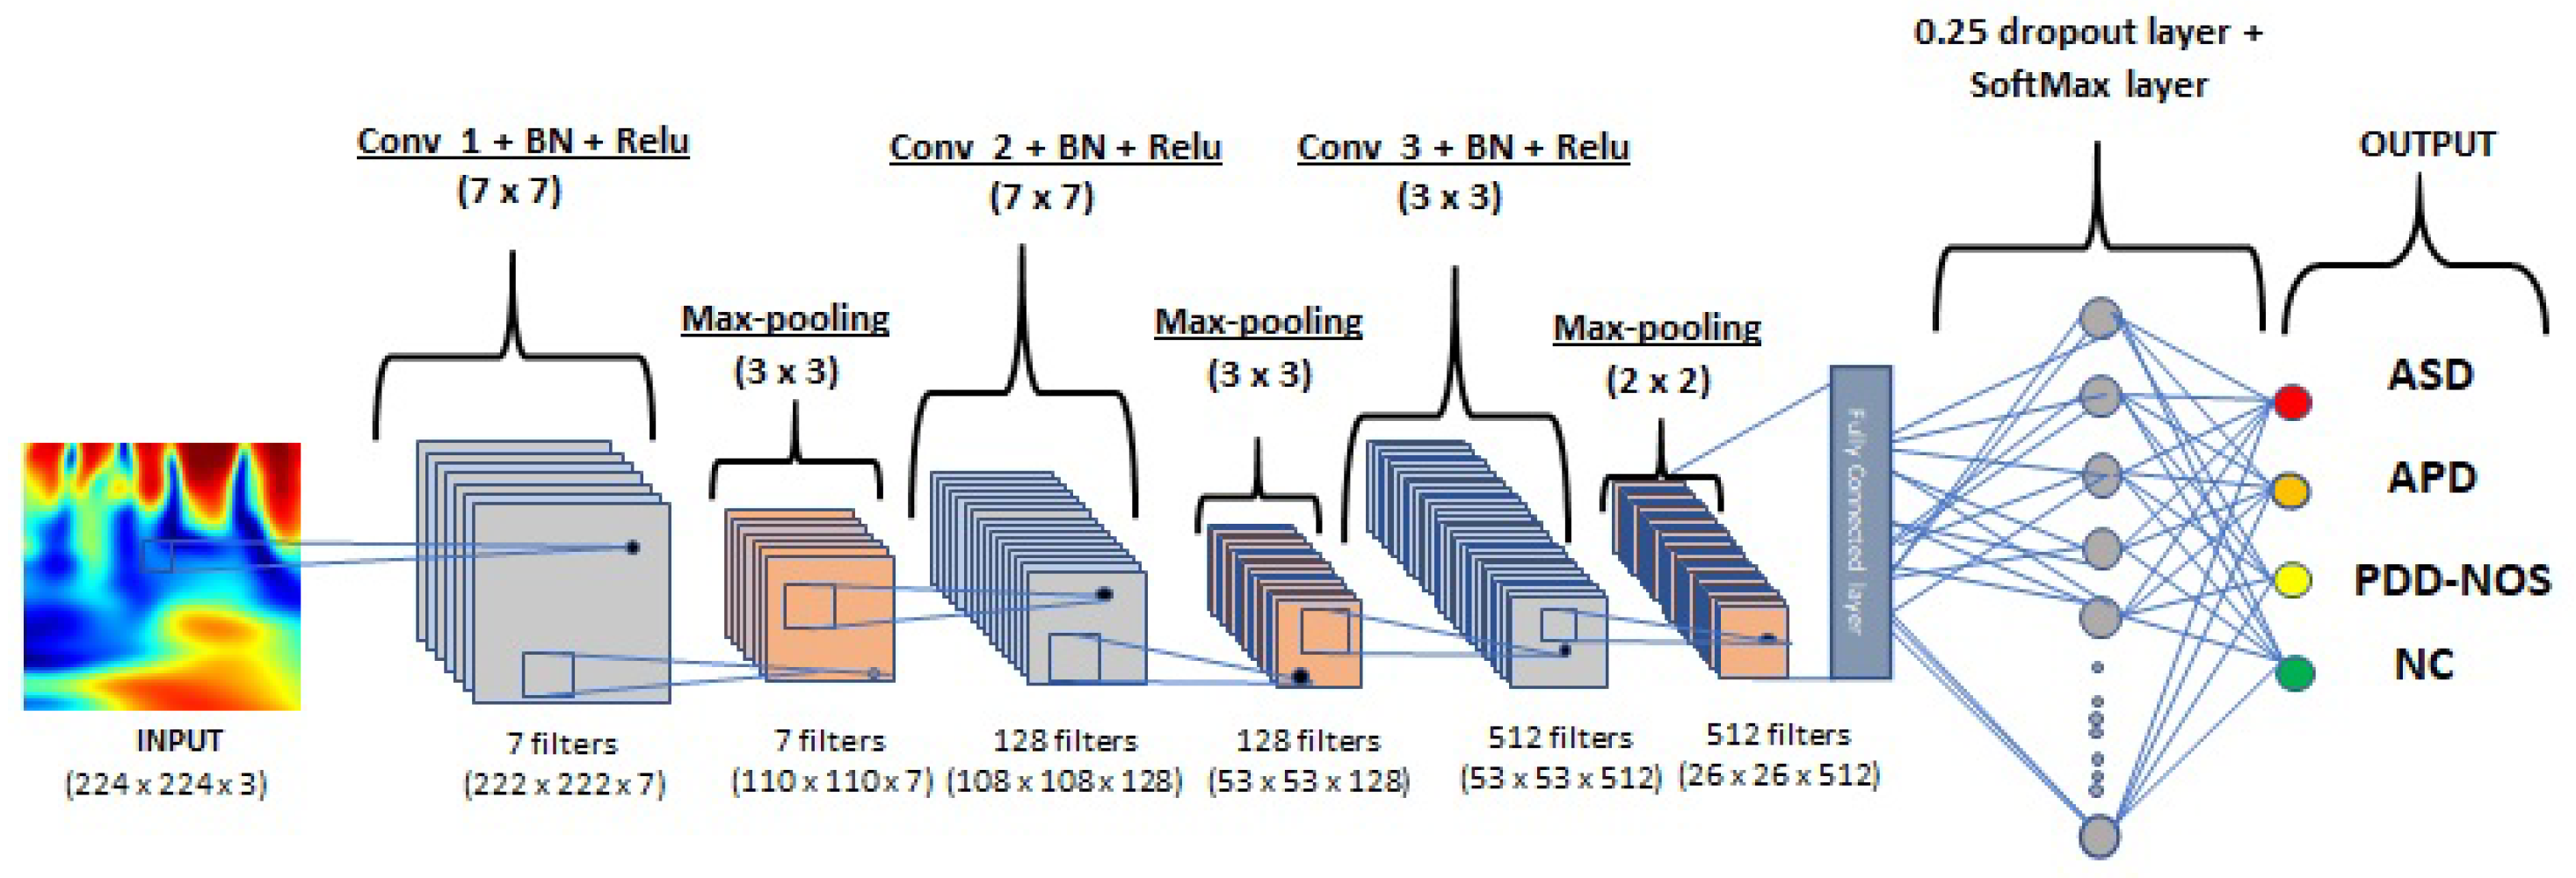
2.4. Convolutional Neural Network (CNN)

CNN is one of the essential deep neural networks related to applying local convolution filters for extracting regional information. CNNs are designed to process multiple data types, particularly two-dimensional variables, and are specifically influenced by the working principle of the brain’s visual cortex. There is a hierarchy of two basic cell types in the visual cortex: plain cells and complex cells. Simple cells respond to primitive patterns in visual stimulation sub-regions, and complex cells synthesize information from simple cells to recognize more complicated types. Since the visual cortex is such an efficient and normal visual processing device, CNNs are used to mimic three main ideas: local connectivity, position invariance, and local transformation invariance. Groups of local weighted sums, called feature maps, are obtained at the end convolution layer by computing convolutions between local patches and weight vectors called filters for extracting the strongly clustered sub-regions of features. In addition, because similar patterns may occur irrespective of the data position, filters are repeatedly implemented throughout the whole dataset, which often increases the accuracy of the trained network by minimizing the amount of parameters to be trained [33]. In this work, We proposed a 3-layer CNN model for identifying ASD subtypes based on scalogram classification, using the CNN structure as shown in Figure 3.

2.5. Performance Evaluation Metric

In order to analyze the performance of the proposed models, the following metrics (4) to (8) were chosen. True positive (TP) is the number of ASD patients, and true negative (TN) is the number of NC individuals correctly identified. Conversely, false positive (FP) is the number of ASD patients, and false negative (FN) is the number of NC individuals incorrectly identified.
Precision = T P T P + F P
Sensitivity = T P T P + F N
Specificity = T N T N + F P
Accuracy = T P + T N T P + T N + F P + F N
F score = 2 × P r e c i s i o n × S e n s i t i v i t y P r e c i s i o n + S e n s i t i v i t y
The sensitivity measures the effectiveness of proposed models to identify ASD patients correctly, and the specificity measures the effectiveness of models to identify NC individuals. Accuracy is the percentage of total effectiveness of a model. To evaluate our proposed models practically like in clinical set up, we calculate precision and F-score, respectively. The precision refers to the percentage of compatibility between the actual ASD patient class and patient class identified by the model. F-score is calculated from the precision and sensitivity of the model. The highest possible value of an F-score is indicating a perfect model performance.
Moreover, to analyze the general classification performance of multi-class models, we have chosen the macro-average evaluation, which makes an averaging calculation by class, not the subjects. The macro-average reduces the multi-class identifications down to multiple sets of binary classification, calculates the corresponding metric for each of the binary cases, and then averages the results [34].

3. Results and Discussion

In this section, the performance of ASD classification algorithms using wavelet coherence of rs-fMRI signals and CNN are evaluated. Two frameworks are experimented, binary classification (ASD and NC) and multi-class classification (ASD, APD, PDD-NOS, and NC). Prior to the classification, the most significant brain nodes need to be determined to ensure meaningful wavelet coherence features are input to the CNN.

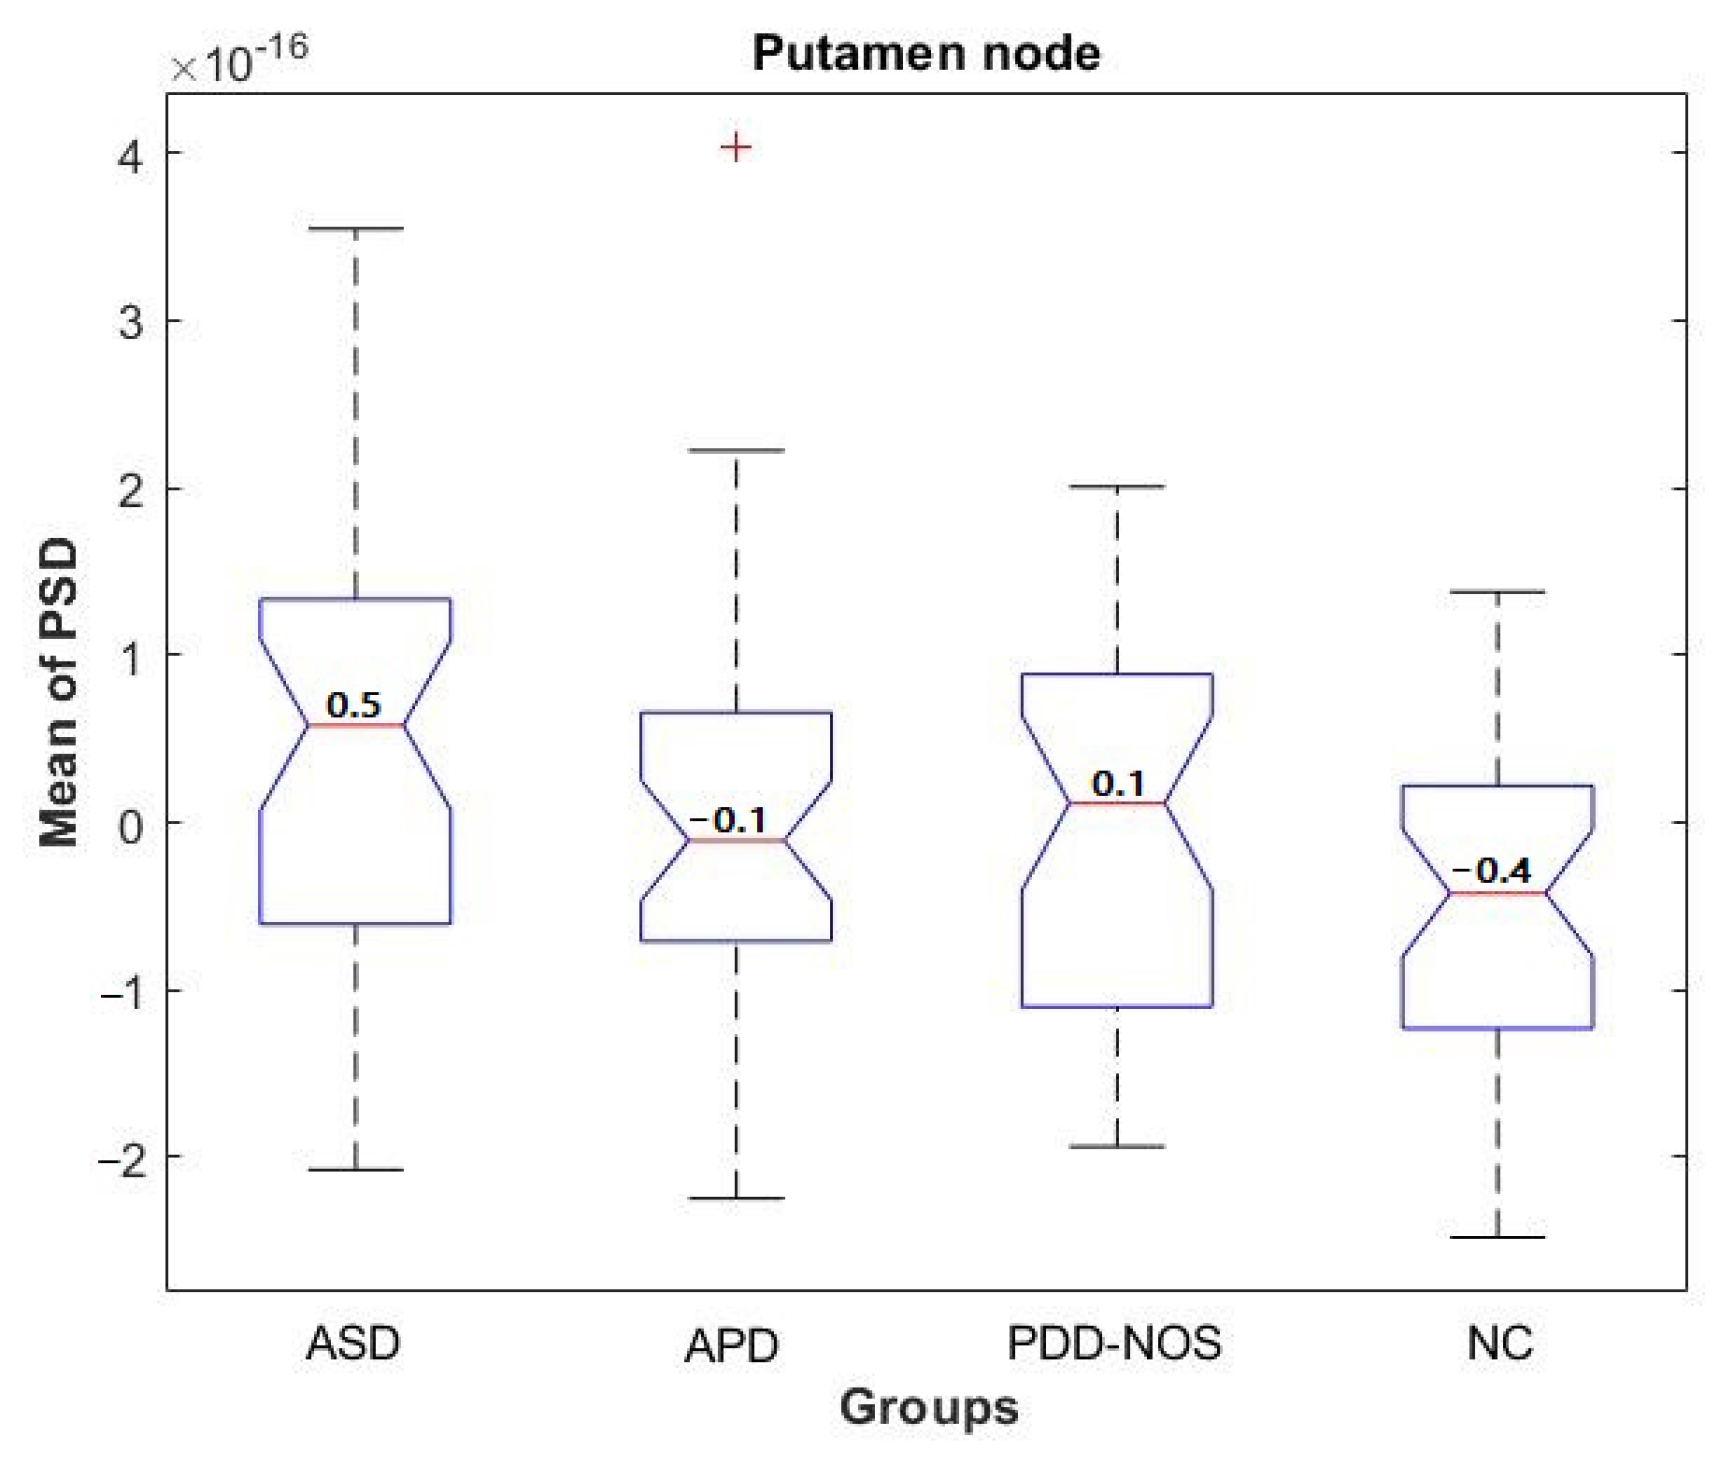
3.1. Selection of Top-Ranked Brain Node for Classification of ASD Subtypes via Statistical Analysis

As the first step in a statistical significance test, the mean PSD values of BOLD signals from 116 brain regions are determined as the input to group-level statistical significance tests. Results of the p-value are tabulated in Table A1, under Appendix A. From the p-value, it can be revealed that putamen_R node is the most significant node in discriminating the 3 ASD classes and NC. The location of putamen_R node, the 2nd (caudate nucleus_L) and 3rd ranked nodes (superior temporal gyrus_L), are shown in Figure 4. Further analysis on the PSD values of putamen_R node is shown as a boxplot in Figure 5. From the boxplot, it is clear that the PSD value is the highest for ASD among the 4 groups, while the lowest is for NC. These results indicate that there is significant variation of PSD based on putamen_R activity.
In other words, it is indicative that the top-ranked node activity plays an essential role in ASD subtypes classification. The results in this section corroborate the findings in neuroscience studies which reveal that the putamen and caudate are part of the basal ganglia group primarily responsible for motor learning, executive functions, behaviors, and emotions. Several neuroscience studies [1,35,36] demonstrated that the volume in the brain region of putamen node increase in the patients with ASD, followed by the volume differences in the brain region of putamen node among ASD subtypes might reflect the variations of the symptoms of ASD.

3.2. Binary Classification Using Wavelet Coherence of Top Three Significant Nodes

In the first experiment, we evaluated the significance of wavelet coherence features extracted from top-three nodes; putamen_R, caudate nucleus_L, superior temporal gyrus_L, and their combinations. Evaluation is conducted for discriminating ASD from NC using the proposed 3-layer CNN with the following training parameters: batch size = 32, epochs = 20, learning rate = 0.0005, adaptive moment estimation (ADAM) optimizer and ratio of training:validation:testing = 0.7:0.15:0.15.
The results for this experiment are presented in Table 2 where for single-node cases, the best accuracy is 89.2% by the top-ranked node putamen_R which is consistent with the result from ANOVA test, as presented in Section 3.1. As expected, the accuracy values for the 2nd and 3rd ranked nodes are both lower than the 1st node.
In the case of combined nodes, although more images are available for training and testing the CNN, the results show that it cannot exceed the performance of the 1st-node. Notably, 1st + 2nd nodes yielded the highest accuracy higher than 2nd and 3rd nodes alone but still lower than the 1st node alone. Subsequent combinations of 1st + 3rd nodes and 1st + 2nd + 3rd nodes still produce lower accuracy than the 1st node. Additionally, despite larger training images for combined nodes, the additional images do not carry meaningful features for discriminating ASD from normal NC

3.3. Binary Classification Using Wavelet Coherence of Putamen_R Node

In this section, the Putamen_R node will be used for classification of ASD from NC. Except for the cross-validation (CV) framework, the CNN training parameters are the same as in the previous section. The training of the CNN is tested using 3 optimizers, root mean square propagation (RMSPROP), stochastic gradient descent with momentum (SGDM), and adaptive moment estimation (ADAM), and the results for different values of folds are presented in Table 3. From the values of accuracy, sensitivity, specificity, precision, and F-score, it is evident that ADAM optimizer results in the best result for k-fold CV, thus, the subsequent experiments are conducted using ADAM optimizer. Evaluation of the proposed algorithm is further tested using k-fold cross validation and the result is tabulated in Table 4. As expected, the performance improved as the number of fold increases. However, it is notable that only marginal improvement is achieved as the fold number is increased from 10 to 15 and 20.
Since the rs-fMRI data were aggregated across ABIDE’s multi-site, validation technique based on leave one-site-out is used to investigate how well the CNN model generalized over different datasets. The results of this experiment are presented in Table 5. With average accuracy of 86.8 ± 0.7 % the proposed binary classification model is considered as robust against the effects of different types of MRI scanners and scanning parameters, as listed in Table 1.
Further performance comparison for binary classification of ASD vs. NC with other related work is presented in Table 6. Methods based on static FC of Pearson correlation [10,12,17] and of covariance matrix [16] can only yield the highest accuracy of 79.2%, inferior to the dynamic FC. Our proposed method that inputs WCT of putamen_R and 115 brain regions to CNN has shown to result in a good accuracy of 89.8%, that is 9.8% higher than the dynamic FC based method proposed by Bernas et al. [19]. Although Bernas et al. [19] used the same WCT, the calculation of the WCT is between 7 brain networks and only in-phase components are input to the SVM classifier.

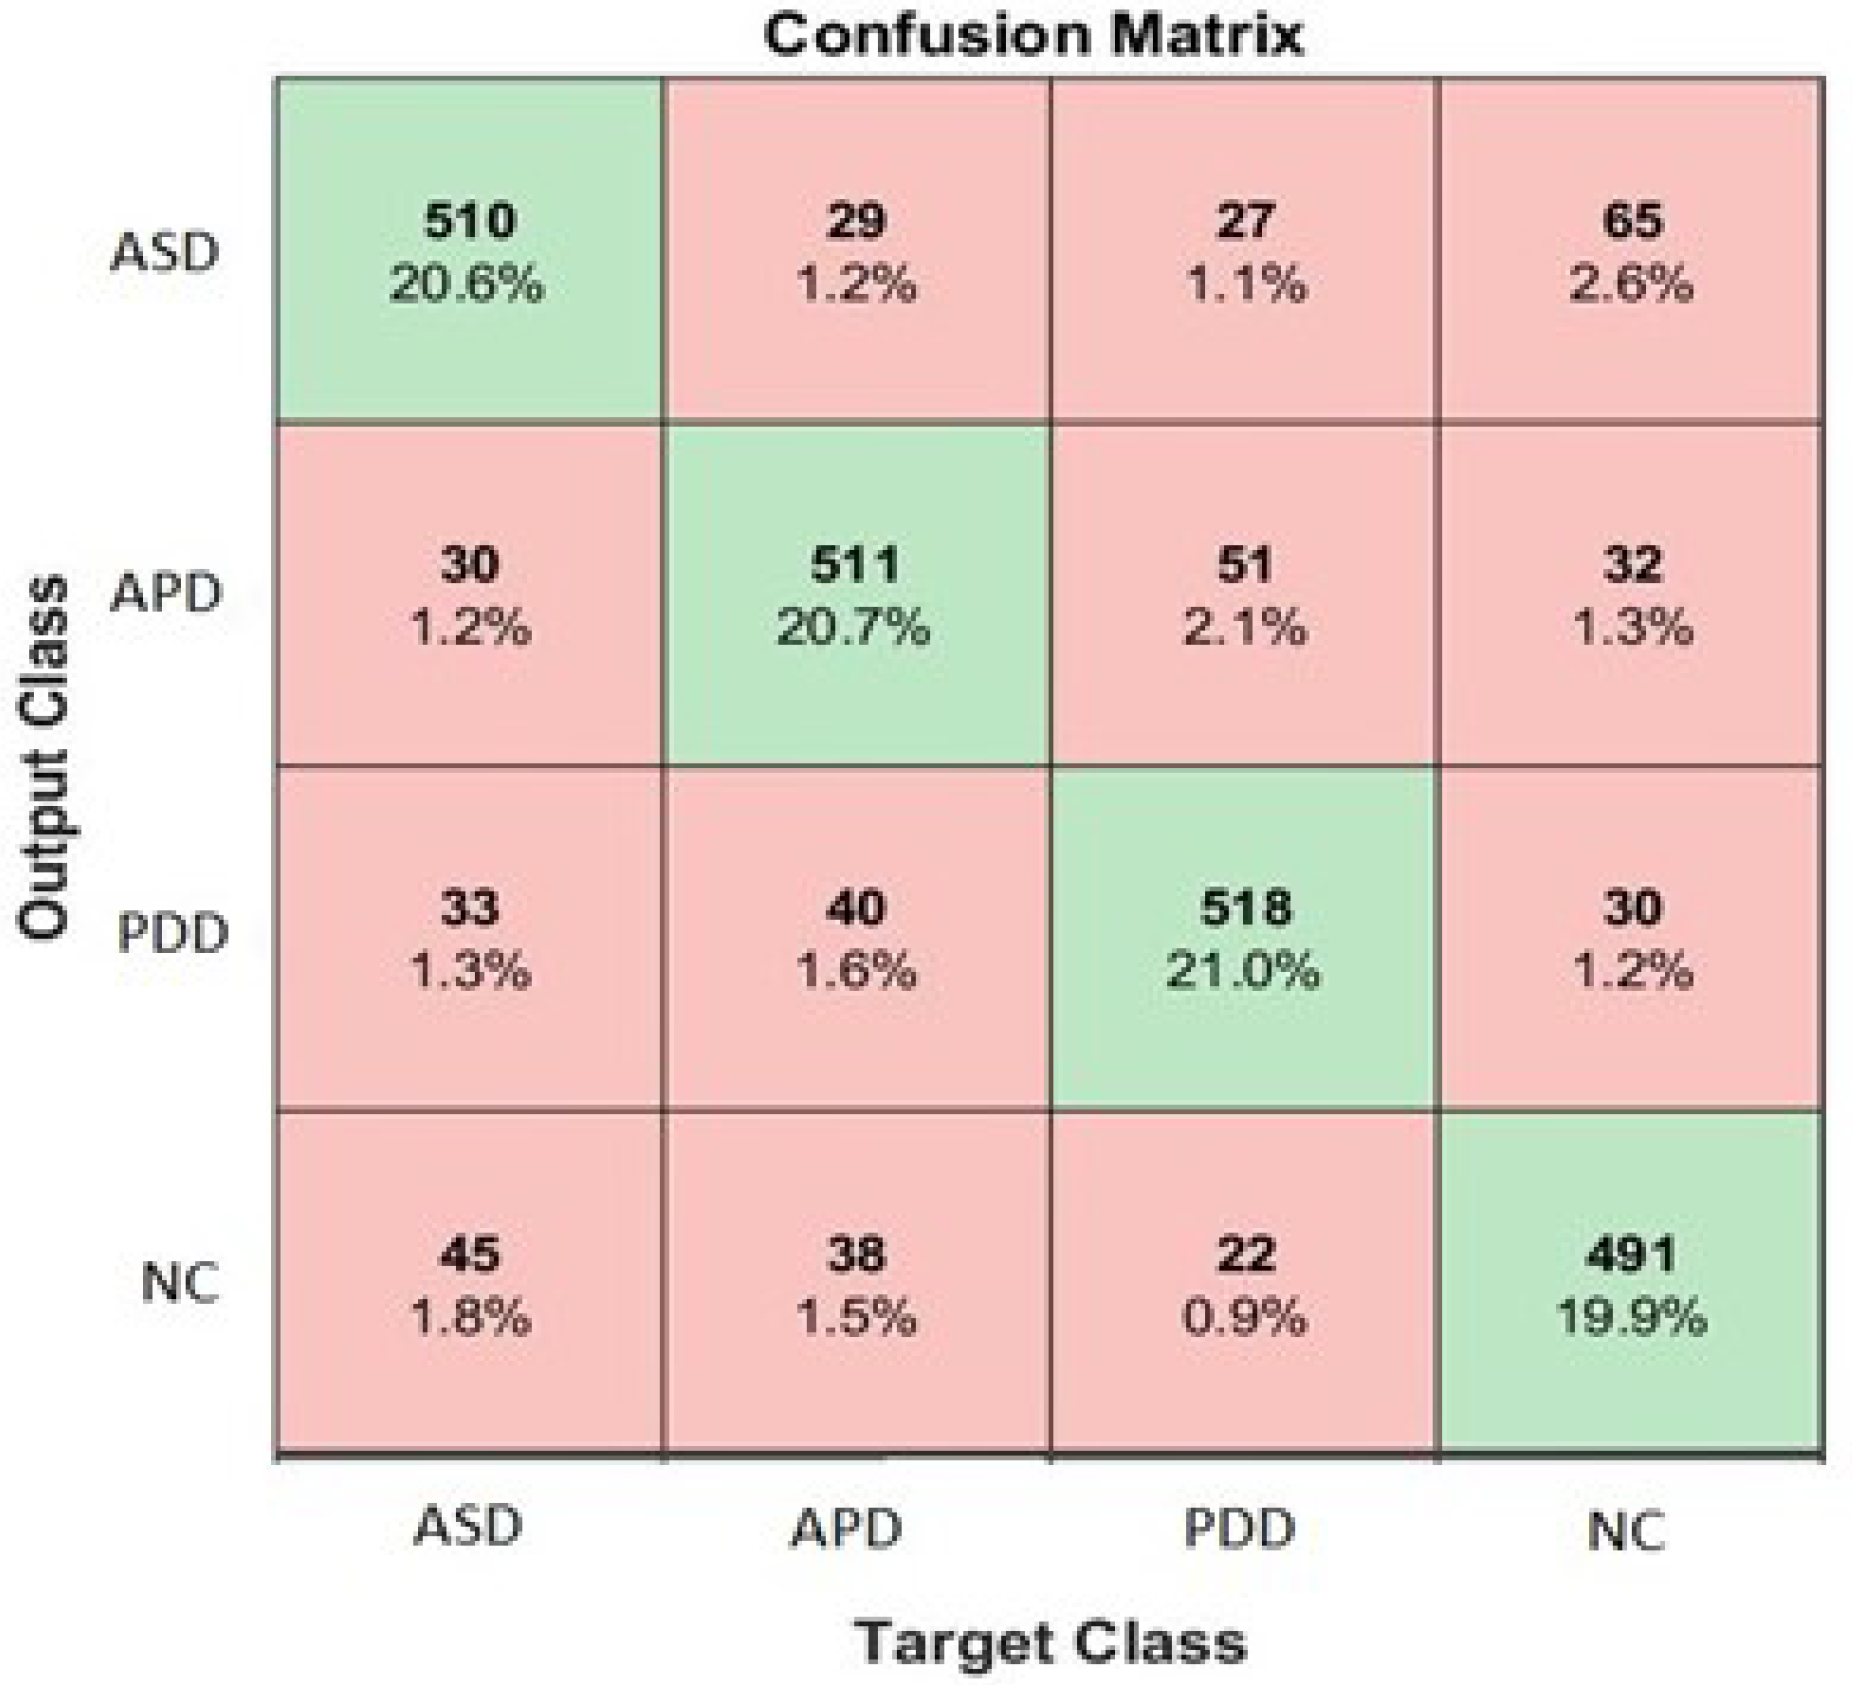
3.4. Multi-Class Classification

In the last experiment, the proposed model is trained for multi-class classification of 3-level ASD and NC taking scalogram images for four groups as its input. To evaluate the performance of the proposed CNN model, the scalogram data is divided into 0.7 as training dataset, 0.15 as validation dataset and 0.15 as testing datasets. The rest of the training parameters are the same as in Section 3.2. The proposed CNN is trained using ADAM, SGDM, and RMSPROP optimizer and the results for each optimizer are presented in Table 7. The best performance is achieved by the proposed CNN with ADAM optimizer giving macro-average accuracy 82.1%. Detailed performance of each class is presented in the confusion matrix, as shown in Figure 6. It is worth highlighting that to date, the ASD subtypes classification has not been done in literature so in this first attempt, with macro-average accuracy 82.1%, there are still opportunities for further enhancements to the classification algorithm.

4. Conclusions and Future Works

In this study, we proposed scalogram-based classification models using the CNN to identify ASD subtypes. The scalogram is generated based on wavelet coherence of pairwise rs-fMRI BOLD signals of top-rank node and the rest of 115 brain nodes. The multi-class datasets of ASD subtypes comprising 144 subjects are downloaded from the multi-site of ABIDE website. Using statistical significance analysis of mean PSD values, putamen_R node is identified as the most significant node. The WCT scalograms of putamen_R and the rest of 115 nodes are then used as the input for training and testing the 3-layer CNN model. In general, the WCT of pairwise BOLD signals is a 2D feature representation that measures the phase synchronization between putamen_R to other brain nodes. Clearly, the extracted feature is proven to be a discriminative BOLD signals descriptor for ASD subtypes and may be a potential biomarker for diagnosis of ASD. The accuracy of 89.8% for binary and 82.1% for multi-class classification, are obtained based on BOLD signals combined from all subjects in respective class, which may not give true measure of its performance for subject-based diagnosis. Therefore, training and testing the CNN on subject-based needs to be investigated for assessment of its diagnostic ability as in clinical practices. In addition, further investigation to improve its performance may consider utilizing different brain atlases, such as Craddock (CC200, CC400) that extract more information from the BOLD signals. Besides, the scalogram images can also be trained and tested on other CNN architecture, such as residual or inception blocks for better classification of ASD subtypes. Lastly, the phase synchronization between one significant brain node to the rest may also be applied for classification of other neuropsychiatric disorders such as ADHD, bipolar disorders, and schizophrenia. The present study approach of using WCT as DFC of rs-fMRI BOLD signals opens a possibility for further research on new biomarkers of psychiatric disorders.

Author Contributions

M.I.A.-H. conducted the research and investigation process, finalized the methodology, proposed algorithm & result analysis, and completed the manuscript writing. N.Y. formulated the research goal, provided supervision, validation of results & methodology, revision of manuscript, management of funding for the project. I.F. provided some valuable suggestions and supervision. A.F.H. involved in writing, reviewing and editing the final manuscript. All authors have read and agreed to the published version of the manuscript.

Funding

TThis research is supported by three research grants: (1) The Ministry of Education Malaysia under Higher Institutional Centre of Excellence (HICoE) Scheme awarded to Centre for Intelligent Signal and Imaging Research (CISIR), and two of the Yayasan Universiti Teknologi PETRONAS under Grant number (2) YUTP-FRG 015LC0-031 and (3) YUTP-FRG 015LC0-243.

Institutional Review Board Statement

Not applicable.

Informed Consent Statement

Not applicable.

Data Availability Statement

Not applicable.

Acknowledgments

We would like to thank Irraivan Elamvazuthi for providing some funding and valuable suggestions to the paper.

Conflicts of Interest

Authors declare that they have no conflict of interest to report regarding the present study.

Appendix A

Table A1. p-Value for all brain nodes based on ANOVA test.
No.Region Labelp-ValueNo.Region Labelp-ValueNo.Region Labelp-ValueNo.Region Labelp-Value
1Precentral_L0.19131Cingulum_Ant_L0.48561Parietal_Inf_L0.97191Cerebelum_Crus1_L0.570
2Precentral_R0.11532Cingulum_Ant_R0.91162Parietal_Inf_R0.86292Cerebelum_Crus1_R0.862
3Frontal_Sup_L0.06133Cingulum_Mid_L0.65363SupraMarginal_L0.91293Cerebelum_Crus2_L0.352
4Frontal_Sup_R0.13834Cingulum_Mid_R0.82064SupraMarginal_R0.16294Cerebelum_Crus2_R0.662
5Frontal_Sup_Orb_L0.05235Cingulum_Post_L0.99865Angular_L0.45295Cerebelum_3_L0.010
6Frontal_Sup_Orb_R0.29436Cingulum_Post_R0.14666Angular_R0.41496Cerebelum_3_R0.539
7Frontal_Mid_L0.36537Hippocampus_L0.84767Precuneus_L0.89097Cerebelum_4_5_L0.653
8Frontal_Mid_R0.33338Hippocampus_R0.38968Precuneus_R0.39698Cerebelum_4_5_R0.412
9Frontal_Mid_Orb_L0.73339ParaHippocampal_L0.05269Paracentral_Lobule_L0.77199Cerebelum_6_L0.425
10Frontal_Mid_Orb_R0.77940ParaHippocampal_R0.45570Paracentral_Lobule_R0.910100Cerebelum_6_R0.868
11Frontal_Inf_Oper_L0.80041Amygdala_L0.17671Caudate_L0.012101Cerebelum_7b_L0.044
12Frontal_Inf_Oper_R0.47042Amygdala_R0.38672Caudate_R0.279102Cerebelum_7b_R0.423
13Frontal_Inf_Tri_L0.30043Calcarine_L0.49073Putamen_L0.143103Cerebelum_8_L0.951
14Frontal_Inf_Tri_R0.41744Calcarine_R0.71474Putamen_R0.008104Cerebelum_8_R0.900
15Frontal_Inf_Orb_L0.28345Cuneus_L0.73275Pallidum_L0.646105Cerebelum_9_L0.836
16Frontal_Inf_Orb_R0.97346Cuneus_R0.75076Pallidum_R0.561106Cerebelum_9_R0.096
17Rolandic_Oper_L0.07547Lingual_L0.68577Thalamus_L0.990107Cerebelum_10_L0.903
18Rolandic_Oper_R0.13148Lingual_R0.25678Thalamus_R0.594108Cerebelum_10_R0.836
19Supp_Motor_Area_L0.69849Occipital_Sup_L0.61579Heschl_L0.095109Vermis_1_20.649
20Supp_Motor_Area_R0.47350Occipital_Sup_R0.60880Heschl_R0.160110Vermis_30.329
21Olfactory_L0.98251Occipital_Mid_L0.51481Temporal_Sup_L0.045111Vermis_4_50.762
22Olfactory_R0.91352Occipital_Mid_R0.09082Temporal_Sup_R0.830112Vermis_60.772
23Frontal_Sup_Medial_L0.34053Occipital_Inf_L0.48783Temporal_Pole_Sup_L0.070113Vermis_70.738
24Frontal_Sup_Medial_R0.18354Occipital_Inf_R0.28284Temporal_Pole_Sup_R0.917114Vermis_80.867
25Frontal_Med_Orb_L0.92855Fusiform_L0.74985Temporal_Mid_L0.900115Vermis_90.592
26Frontal_Med_Orb_R0.76956Fusiform_R0.93886Temporal_Mid_R0.113116Vermis_100.272
27Rectus_L0.09657Postcentral_L0.87887Temporal_Pole_Mid_L0.364
28Rectus_R0.87158Postcentral_R0.10888Temporal_Pole_Mid_R0.860
29Insula_L0.07559Parietal_Sup_L0.98489Temporal_Inf_L0.566
30Insula_R0.74460Parietal_Sup_R0.14490Temporal_Inf_R0.343

References

  1. Pagnozzi, A.M.; Conti, E.; Calderoni, S.; Fripp, J.; Rose, S.E. A systematic review of structural MRI biomarkers in autism spectrum disorder: A machine learning perspective. Int. J. Dev. Neurosci. 2018, 71, 68–82. [Google Scholar] [CrossRef]
  2. Autism Spectrum Disorders. Available online: https://www.who.int/news-room/fact-sheets/detail/autism-spectrum-disorders (accessed on 7 February 2021).
  3. Hansen, S.N.; Schendel, D.E.; Parner, E.T. Explaining the increase in the prevalence of autism spectrum disorders: The proportion attributable to changes in reporting practices. JAMA Pediatr. 2015, 169, 56–62. [Google Scholar] [CrossRef] [PubMed] [Green Version]
  4. Witwer, A.N.; Lecavalier, L. Examining the validity of autism spectrum disorder subtypes. J. Autism Dev. Disord. 2008, 38, 1611–1624. [Google Scholar] [CrossRef]
  5. Mazurek, M.O.; Lu, F.; Symecko, H.; Butter, E.; Bing, N.M.; Hundley, R.J.; Poulsen, M.; Kanne, S.M.; Macklin, E.A.; Handen, B.L. A prospective study of the concordance of DSM-IV and DSM-5 diagnostic criteria for autism spectrum disorder. J. Autism Dev. Disord. 2017, 47, 2783–2794. [Google Scholar] [CrossRef]
  6. Conti, E.; Mitra, J.; Calderoni, S.; Pannek, K.; Shen, K.; Pagnozzi, A.; Rose, S.; Mazzotti, S.; Scelfo, D.; Tosetti, M.; et al. Network over-connectivity differentiates autism spectrum disorder from other developmental disorders in toddlers: A diffusion MRI study. Hum. Brain Mapp. 2017, 38, 2333–2344. [Google Scholar] [CrossRef] [Green Version]
  7. Thabtah, F. Machine learning in autistic spectrum disorder behavioral research: A review and ways forward. Inform. Health Soc. Care 2019, 44, 278–297. [Google Scholar] [CrossRef]
  8. Yin, W.; Li, L.; Wu, F.X. Deep learning for brain disorder diagnosis based on fMRI images. Neurocomputing 2020. [Google Scholar] [CrossRef]
  9. Kassraian-Fard, P.; Matthis, C.; Balsters, J.H.; Maathuis, M.H.; Wenderoth, N. Promises, pitfalls, and basic guidelines for applying machine learning classifiers to psychiatric imaging data, with autism as an example. Front. Psychiatry 2016, 7, 177. [Google Scholar] [CrossRef] [Green Version]
  10. Sherkatghanad, Z.; Akhondzadeh, M.; Salari, S.; Zomorodi-Moghadam, M.; Abdar, M.; Acharya, U.R.; Khosrowabadi, R.; Salari, V. Automated detection of autism spectrum disorder using a convolutional neural network. Front. Neurosci. 2020, 13, 1325. [Google Scholar] [CrossRef] [PubMed] [Green Version]
  11. Iidaka, T. Resting state functional magnetic resonance imaging and neural network classified autism and control. Cortex 2015, 63, 55–67. [Google Scholar] [CrossRef] [PubMed]
  12. Heinsfeld, A.S.; Franco, A.R.; Craddock, R.C.; Buchweitz, A.; Meneguzzi, F. Identification of autism spectrum disorder using deep learning and the ABIDE dataset. NeuroImage Clin. 2018, 17, 16–23. [Google Scholar] [CrossRef]
  13. Hutchison, R.M.; Womelsdorf, T.; Allen, E.A.; Bandettini, P.A.; Calhoun, V.D.; Corbetta, M.; Della Penna, S.; Duyn, J.H.; Glover, G.H.; Gonzalez-Castillo, J.; et al. Dynamic functional connectivity: Promise, issues, and interpretations. Neuroimage 2013, 80, 360–378. [Google Scholar] [CrossRef] [PubMed] [Green Version]
  14. Menon, S.S.; Krishnamurthy, K. A comparison of static and dynamic functional connectivities for identifying subjects and biological sex using intrinsic individual brain connectivity. Sci. Rep. 2019, 9, 1–11. [Google Scholar] [CrossRef] [PubMed] [Green Version]
  15. Yahata, N.; Kasai, K.; Kawato, M. Computational neuroscience approach to biomarkers and treatments for mental disorders. Psychiatry Clin. Neurosci. 2017, 71, 215–237. [Google Scholar] [CrossRef] [PubMed] [Green Version]
  16. Chen, H.; Duan, X.; Liu, F.; Lu, F.; Ma, X.; Zhang, Y.; Uddin, L.Q.; Chen, H. Multivariate classification of autism spectrum disorder using frequency-specific resting-state functional connectivity—A multi-center study. Prog. Neuro-Psychopharmacol. Biol. Psychiatry 2016, 64, 1–9. [Google Scholar] [CrossRef]
  17. Abraham, A.; Milham, M.P.; Di Martino, A.; Craddock, R.C.; Samaras, D.; Thirion, B.; Varoquaux, G. Deriving reproducible biomarkers from multi-site resting-state data: An Autism-based example. NeuroImage 2017, 147, 736–745. [Google Scholar] [CrossRef] [Green Version]
  18. Chaitra, N.; Vijaya, P.; Deshpande, G. Diagnostic prediction of autism spectrum disorder using complex network measures in a machine learning framework. Biomed. Signal Process. Control 2020, 62, 102099. [Google Scholar] [CrossRef]
  19. Bernas, A.; Aldenkamp, A.P.; Zinger, S. Wavelet coherence-based classifier: A resting-state functional MRI study on neurodynamics in adolescents with high-functioning autism. Comput. Methods Programs Biomed. 2018, 154, 143–151. [Google Scholar] [CrossRef]
  20. Yu, K.; Fu, Q.; Ma, H.; Lin, T.R.; Li, X. Simulation data driven weakly supervised adversarial domain adaptation approach for intelligent cross-machine fault diagnosis. Struct. Health Monit. 2021, 20. [Google Scholar] [CrossRef]
  21. Al-Hiyali, M.I.; Yahya, N.; Faye, I.; Khan, Z.; Alsaih, K. Classification of BOLD FMRI signals using wavelet transform and transfer learning for detection of autism spectrum disorder. In Proceedings of the 2020 IEEE-EMBS Conference on Biomedical Engineering and Sciences (IECBES), Langkawi Island, Malaysia, 1–3 March 2021; pp. 94–98. [Google Scholar] [CrossRef]
  22. Zhai, T.; Koriche, F.; Wang, H.; Gao, Y. Tracking sparse linear classifiers. IEEE Trans. Neural Netw. Learn. Syst. 2018, 30, 2079–2092. [Google Scholar] [CrossRef]
  23. Billings, J.M.; Eder, M.; Flood, W.C.; Dhami, D.S.; Natarajan, S.; Whitlow, C.T. Machine learning applications to resting-state functional (MR) imaging analysis. Neuroimaging Clin. 2017, 27, 609–620. [Google Scholar] [CrossRef]
  24. Craddock, C.; Benhajali, Y.; Chu, C.; Chouinard, F.; Evans, A.; Jakab, A.; Khundrakpam, B.S.; Lewis, J.D.; Li, Q.; Milham, M.; et al. The neuro bureau preprocessing initiative: Open sharing of preprocessed neuroimaging data and derivatives. Front. Neuroinform. 2013. Available online: https://www.frontiersin.org/10.3389/conf.fninf.2013.09.00041/event_abstract (accessed on 28 July 2021).
  25. Yan, C.; Zang, Y. (DPARSF): A MATLAB toolbox for pipeline data analysis of resting-state (fMRI). Front. Syst. Neurosci. 2010, 4, 13. [Google Scholar] [CrossRef] [PubMed] [Green Version]
  26. Zhang, J.; Yuan, Z.; Huang, J.; Yang, Q.; Chen, H. Quantification of the power changes in BOLD signals using Welch spectrum method during different single-hand motor imageries. Magn. Reson. Imaging 2014, 32, 1307–1313. [Google Scholar] [CrossRef]
  27. Cribben, I.; Haraldsdottir, R.; Atlas, L.Y.; Wager, T.D.; Lindquist, M.A. Dynamic connectivity regression: Determining state-related changes in brain connectivity. Neuroimage 2012, 61, 907–920. [Google Scholar] [CrossRef] [PubMed] [Green Version]
  28. Torrence, C.; Compo, G.P. A practical guide to wavelet analysis. Bull. Am. Meteorol. Soc. 1998, 79, 61–78. [Google Scholar] [CrossRef] [Green Version]
  29. Morabito, F.C.; Campolo, M.; Mammone, N.; Versaci, M.; Franceschetti, S.; Tagliavini, F.; Sofia, V.; Fatuzzo, D.; Gambardella, A.; Labate, A.; et al. Deep learning representation from electroencephalography of early-stage Creutzfeldt-Jakob disease and features for differentiation from rapidly progressive dementia. Int. J. Neural Syst. 2017, 27, 1650039. [Google Scholar] [CrossRef] [PubMed]
  30. Yahya, N.; Musa, H.; Ong, Z.Y.; Elamvazuthi, I. Classification of Motor Functions from Electroencephalogram (EEG) Signals Based on an Integrated Method Comprised of Common Spatial Pattern and Wavelet Transform Framework. Sensors 2019, 19, 4878. [Google Scholar] [CrossRef] [PubMed] [Green Version]
  31. Rodríguez-Murillo, J.C.; Filella, M. Significance and Causality in Continuous Wavelet and Wavelet Coherence Spectra Applied to Hydrological Time Series. Hydrology 2020, 7, 82. [Google Scholar] [CrossRef]
  32. Grinsted, A.; Moore, J.C.; Jevrejeva, S. Application of the cross wavelet transform and wavelet coherence to geophysical time series. Nonlinear Process. Geophys. 2004, 11, 561–566. [Google Scholar] [CrossRef]
  33. Choe, J.; Lee, S.M.; Do, K.H.; Lee, G.; Lee, J.G.; Lee, S.M.; Seo, J.B. Deep Learning–based Image Conversion of CT Reconstruction Kernels Improves Radiomics Reproducibility for Pulmonary Nodules or Masses. Radiology 2019, 292, 365–373. [Google Scholar] [CrossRef]
  34. Albahri, O.; Zaidan, A.; Albahri, A.; Zaidan, B.; Abdulkareem, K.H.; Al-Qaysi, Z.; Alamoodi, A.; Aleesa, A.; Chyad, M.; Alesa, R.; et al. Systematic review of artificial intelligence techniques in the detection and classification of COVID-19 medical images in terms of evaluation and benchmarking: Taxonomy analysis, challenges, future solutions and methodological aspects. J. Infect. Public Health 2020, 13, 1381–1396. [Google Scholar] [CrossRef] [PubMed]
  35. Sato, W.; Kubota, Y.; Kochiyama, T.; Uono, S.; Yoshimura, S.; Sawada, R.; Sakihama, M.; Toichi, M. Increased putamen volume in adults with autism spectrum disorder. Front. Hum. Neurosci. 2014, 8, 957. [Google Scholar] [CrossRef] [PubMed] [Green Version]
  36. Luo, X.; Mao, Q.; Shi, J.; Wang, X.; Li, C.S.R. Putamen gray matter volumes in neuropsychiatric and neurodegenerative disorders. World J. Psychiatry Ment. Health Res. 2019, 3, 1020. [Google Scholar] [PubMed]
Figure 1. Methods for development of binary and multi-class classification of BOLD fMRI signals using wavelet coherence and CNN.
Sensors 21 05256 g001
Figure 2. Wavelet coherence of pairwise BOLD signals between top-ranked node and 115 brain nodes.
Sensors 21 05256 g002
Figure 3. Training parameters: Batch size = 32, Epochs = 20, Learning rate = 0.0005. 3-layer CNN architecture for wavelet coherence scalogram classification into three ASD subtypes and normal control.
Sensors 21 05256 g003
Figure 4. Top-three ranked brain nodes for classification of 3-level ASD subtypes and NC, determined using ANOVA analysis of mean value of PDC.
Sensors 21 05256 g004
Figure 5. Statistical comparison of 3 ASD subtypes and NC based on PSD of putamen nodes.
Sensors 21 05256 g005
Figure 6. Confusion matrix for classification of WCT images of ASD subtypes and NC using ADAM optimizer.
Sensors 21 05256 g006
Table 1. Details fMRI ASD subtypes and NC dataset from ABIDE database, acquired using 3T MRI scanner.
SiteCountryVendorVoxel Size
(mm 3 )
Flip Angle
(deg)
TR
(sec)
Time Points
(sec)
SubjectsTotal-per Site
ASDAPDPDD-NOSNC
NYUUSASiemens1.372175985931
SBLNetherlandsPhilips182.2195956929
SDSUUSAGE14.52175962926
TrinityIrelandPhilips182145-47-11
YaleUSASiemens1921959514937
USMUSASiemens192235--1-1
KKIUSAPhilips182.5151-8--8
UM1USAGE1.2152295--1-1
Total36363636144
Legend: NYU: New York University, SBL: Social Brain lab, SDSU: San Diego State University, Trinity: Trinity College Institute of Neuroscience, Yale: Yale School of Medicine, USM: University of Utah School of Medicine, KKI: Kennedy Krieger Institute, UM: University of Michigan, TR:Repetition Time.
Table 2. Performance of proposed CNN for binary classification using WCT of significant node(s) as the input images, where the number of subjects is ASD = NC = 36.
 Node for WCTNumber of WCT
Images per Class
Accuracy
(%)
1st-node414089.2
2nd-node414084.9
3rd-node414083.1
1st + 2nd-nodes828085.5
1st + 3rd-nodes828084.7
1st + 2nd + 3rd-nodes12,42081.7
Table 3. Percentage of accuracy, sensitivity, specificity, precision, and F-score (±standard deviation) of 10-folds cross-validation for binary classification.
OptimizerAccuracySensitivitySpecificityPrecisionF-Score
RMSPROP84.5 ± 1.885.1 ± 2.584.3 ± 2.284.2 ± 2.884.6 ± 1.9
SGDM87.2 ± 0.987.1 ± 1.487.4 ± 1.587.4 ± 1.587.2 ± 0.9
ADAM89.2 ± 0.789.1 ± 2.589.5 ± 1.989.5 ± 2.589.2 ± 0.5
Table 4. Percentage of accuracy, sensitivity, specificity, precision, and F-score (±standard deviation) for binary classification of ASD vs. NC using k-fold cross-validation.
k-FoldsAccuracySensitivitySpecificityPrecisionF-Score
5-fold88.6 ± 1.588.7 ± 2.388.7 ± 2.388.6 ± 2.688.6 ± 1.5
10-fold89.2 ± 0.789.1 ± 2.589.5 ± 1.989.5 ± 2.589.2 ± 0.5
15-fold89.6 ± 1.688.9 ± 2.490.5 ± 1.890.6 ± 2.189.7 ± 1.5
20-fold89.8 ± 1.790.1 ± 2.689.7 ± 2.289.6 ± 2.589.8 ± 1.7
Table 5. Percentage of accuracy, sensitivity and specificity (in%) for binary classification, ASD vs. NC using leave-one site validation.
SiteAccuracySensitivitySpecificityPrecisionF-Score
NYU87.588.386.886.587.4
SBL86.987.686.285.986.7
SDSU86.988.485.484.886.5
Yale85.885.486.286.385.8
Mean86.887.486.185.986.6
Table 6. Comparison of the proposed ASD binary classification with previous papers.
PaperClassifierFC ModellingMethodSubjectAccuracy (%)
Chen et al. 2016 [16]SVMStatic FCPearson correlation24079.2
Abraham et al. 2017 [17]SVMStatic FCCovariance matrix87167
Heinsfeld et al. 2018 [12]DNNStatic FCPearson correlation103570
Bernas et al. 2018 [19]SVMDynamic FCWavelet coherence5480
Sherkatghanad et al. 2020 [10]DNNStatic FCPearson correlation87170.2
Our proposed methodCNNDynamic FCWavelet coherence7289.8
Table 7. Macro-accuracy (in %) of multi-class classification using three optimization methods.
OptimizerF1-Score(%)Accuracy (%)
ASDAPDPDD-NOSOverall
RMSPROP79.680.781.780.2
SGDM80.979.880.680.3
ADAM81.782.383.682.1
Publisher’s Note: MDPI stays neutral with regard to jurisdictional claims in published maps and institutional affiliations.

