
A Novel Framework for Quantifying Accuracy and Precision of Event Detection Algorithms in FES-Cycling

 , ,
, ,  , , and
Abstract
1. Introduction
2. Materials and Methods
2.1. Subjects
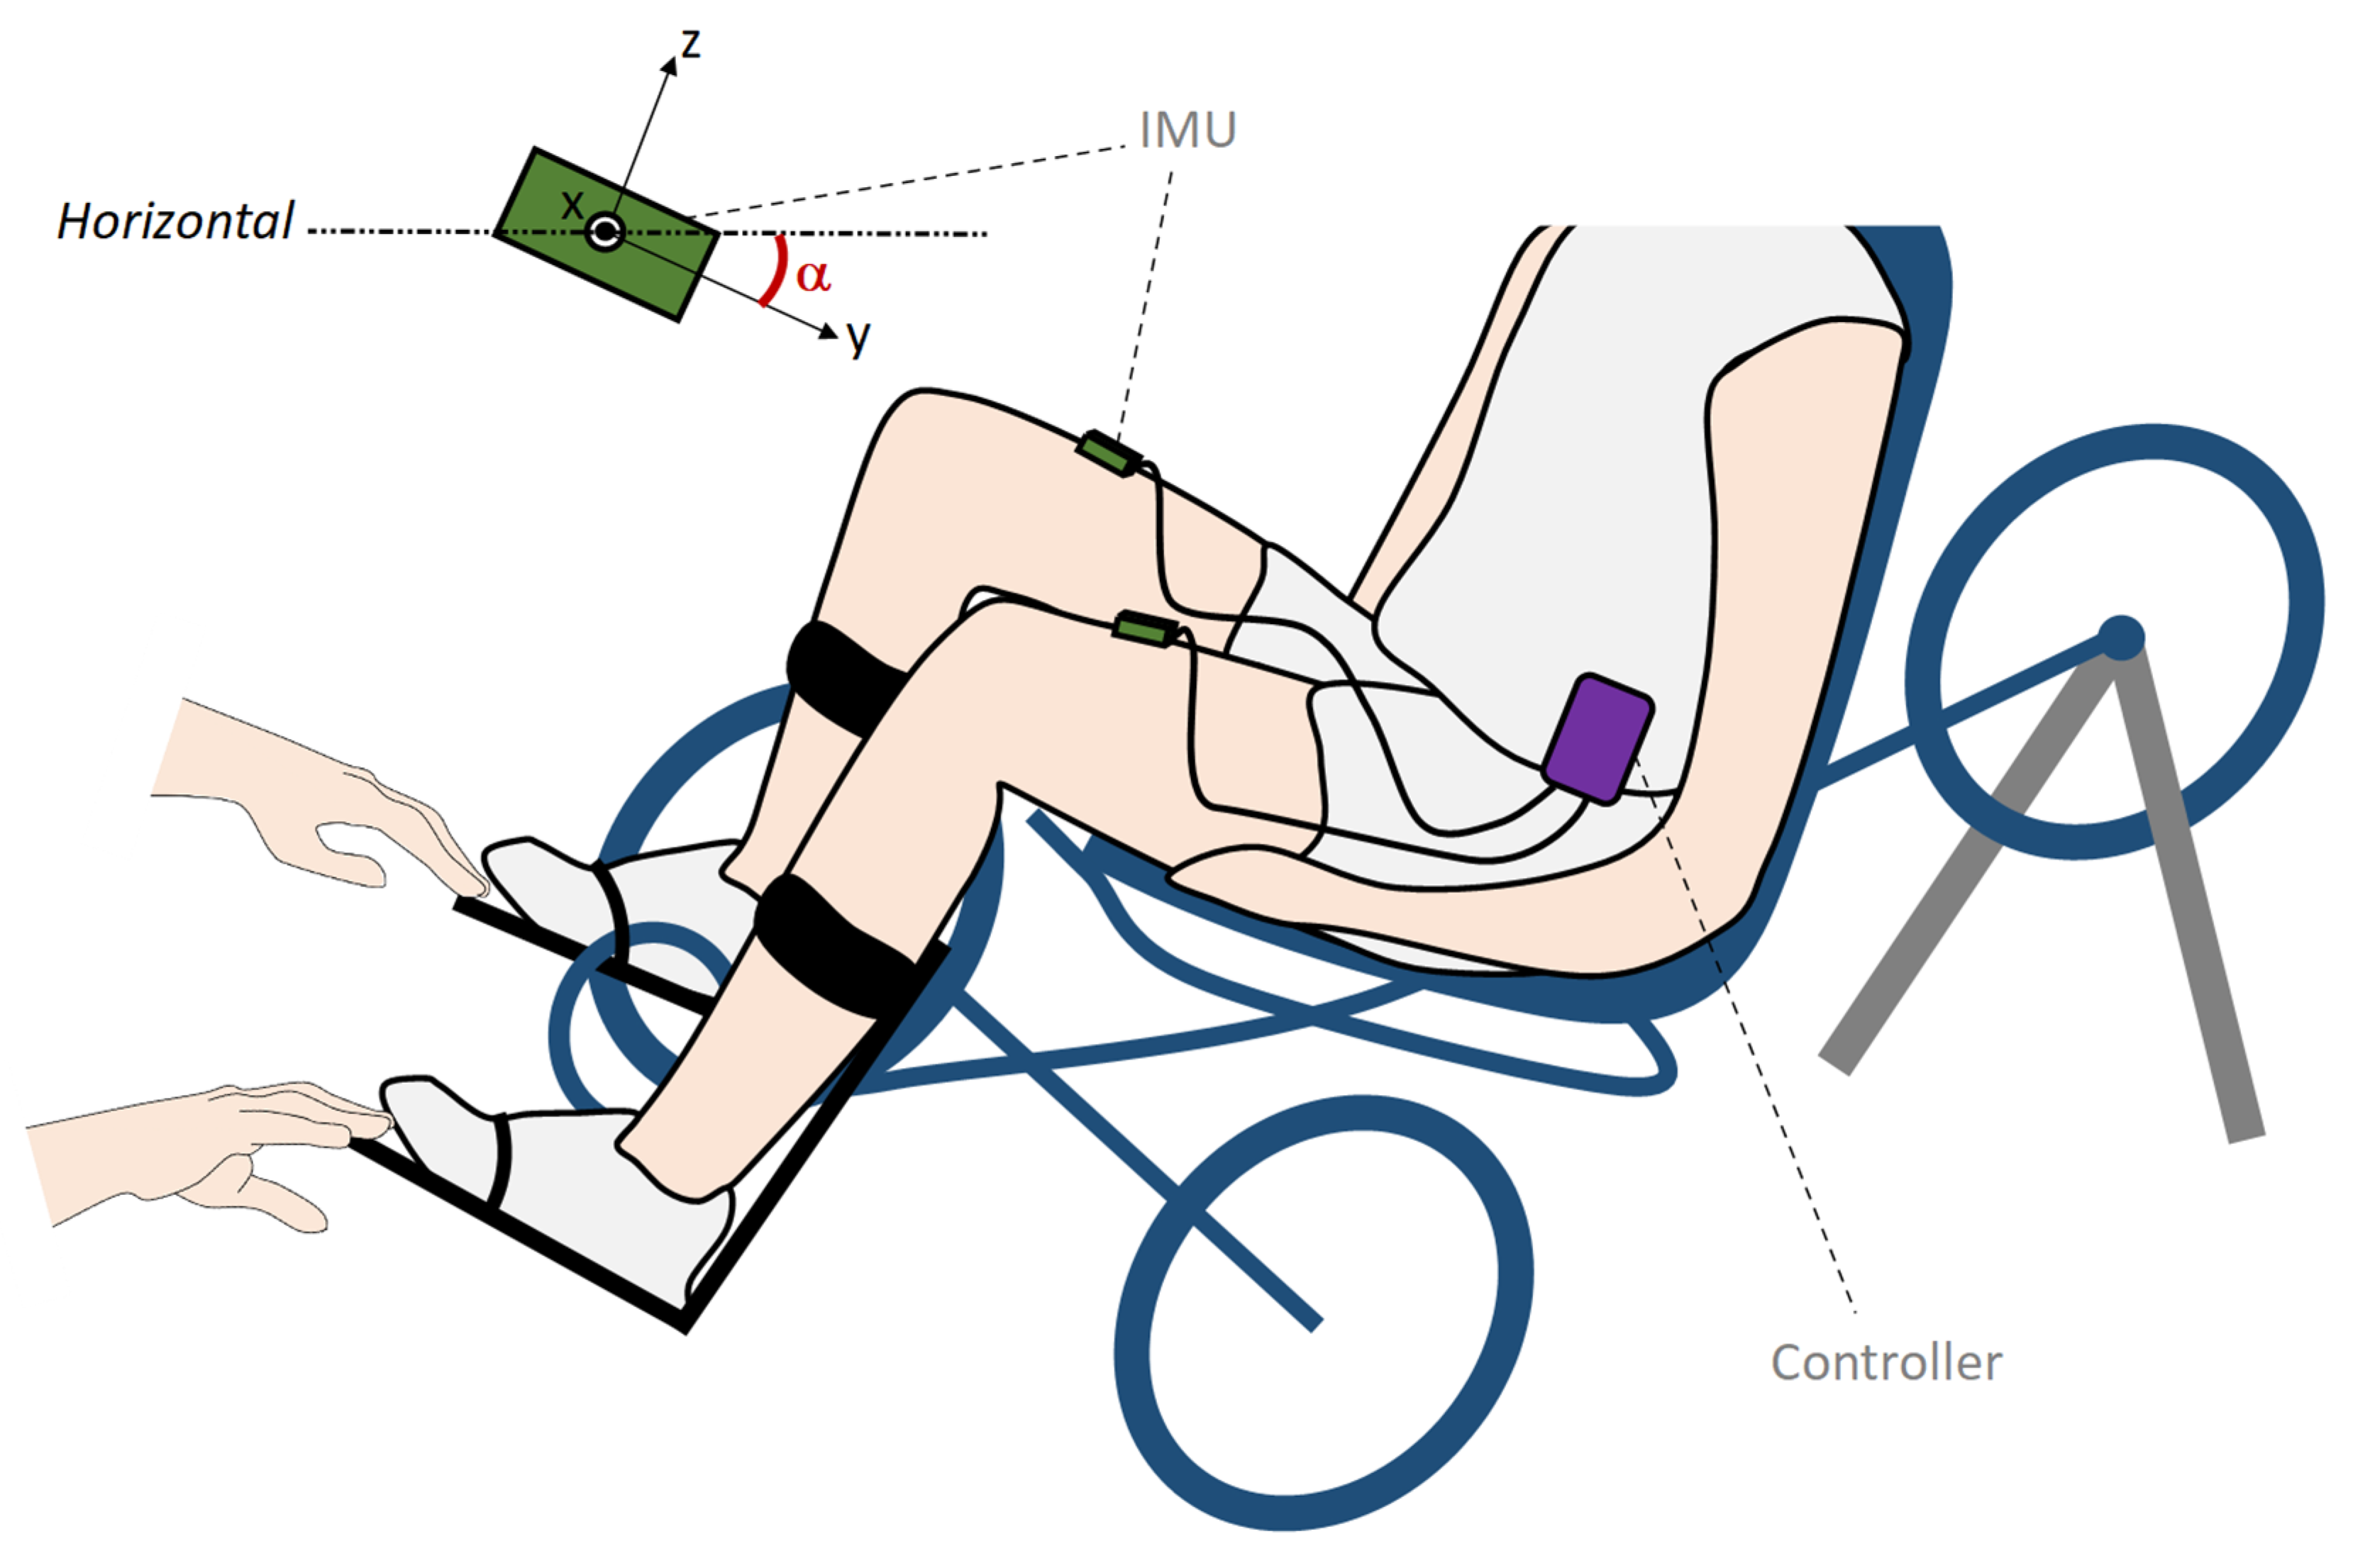
2.2. Material
2.3. Methods
2.3.1. Data Acquisition and Conditioning
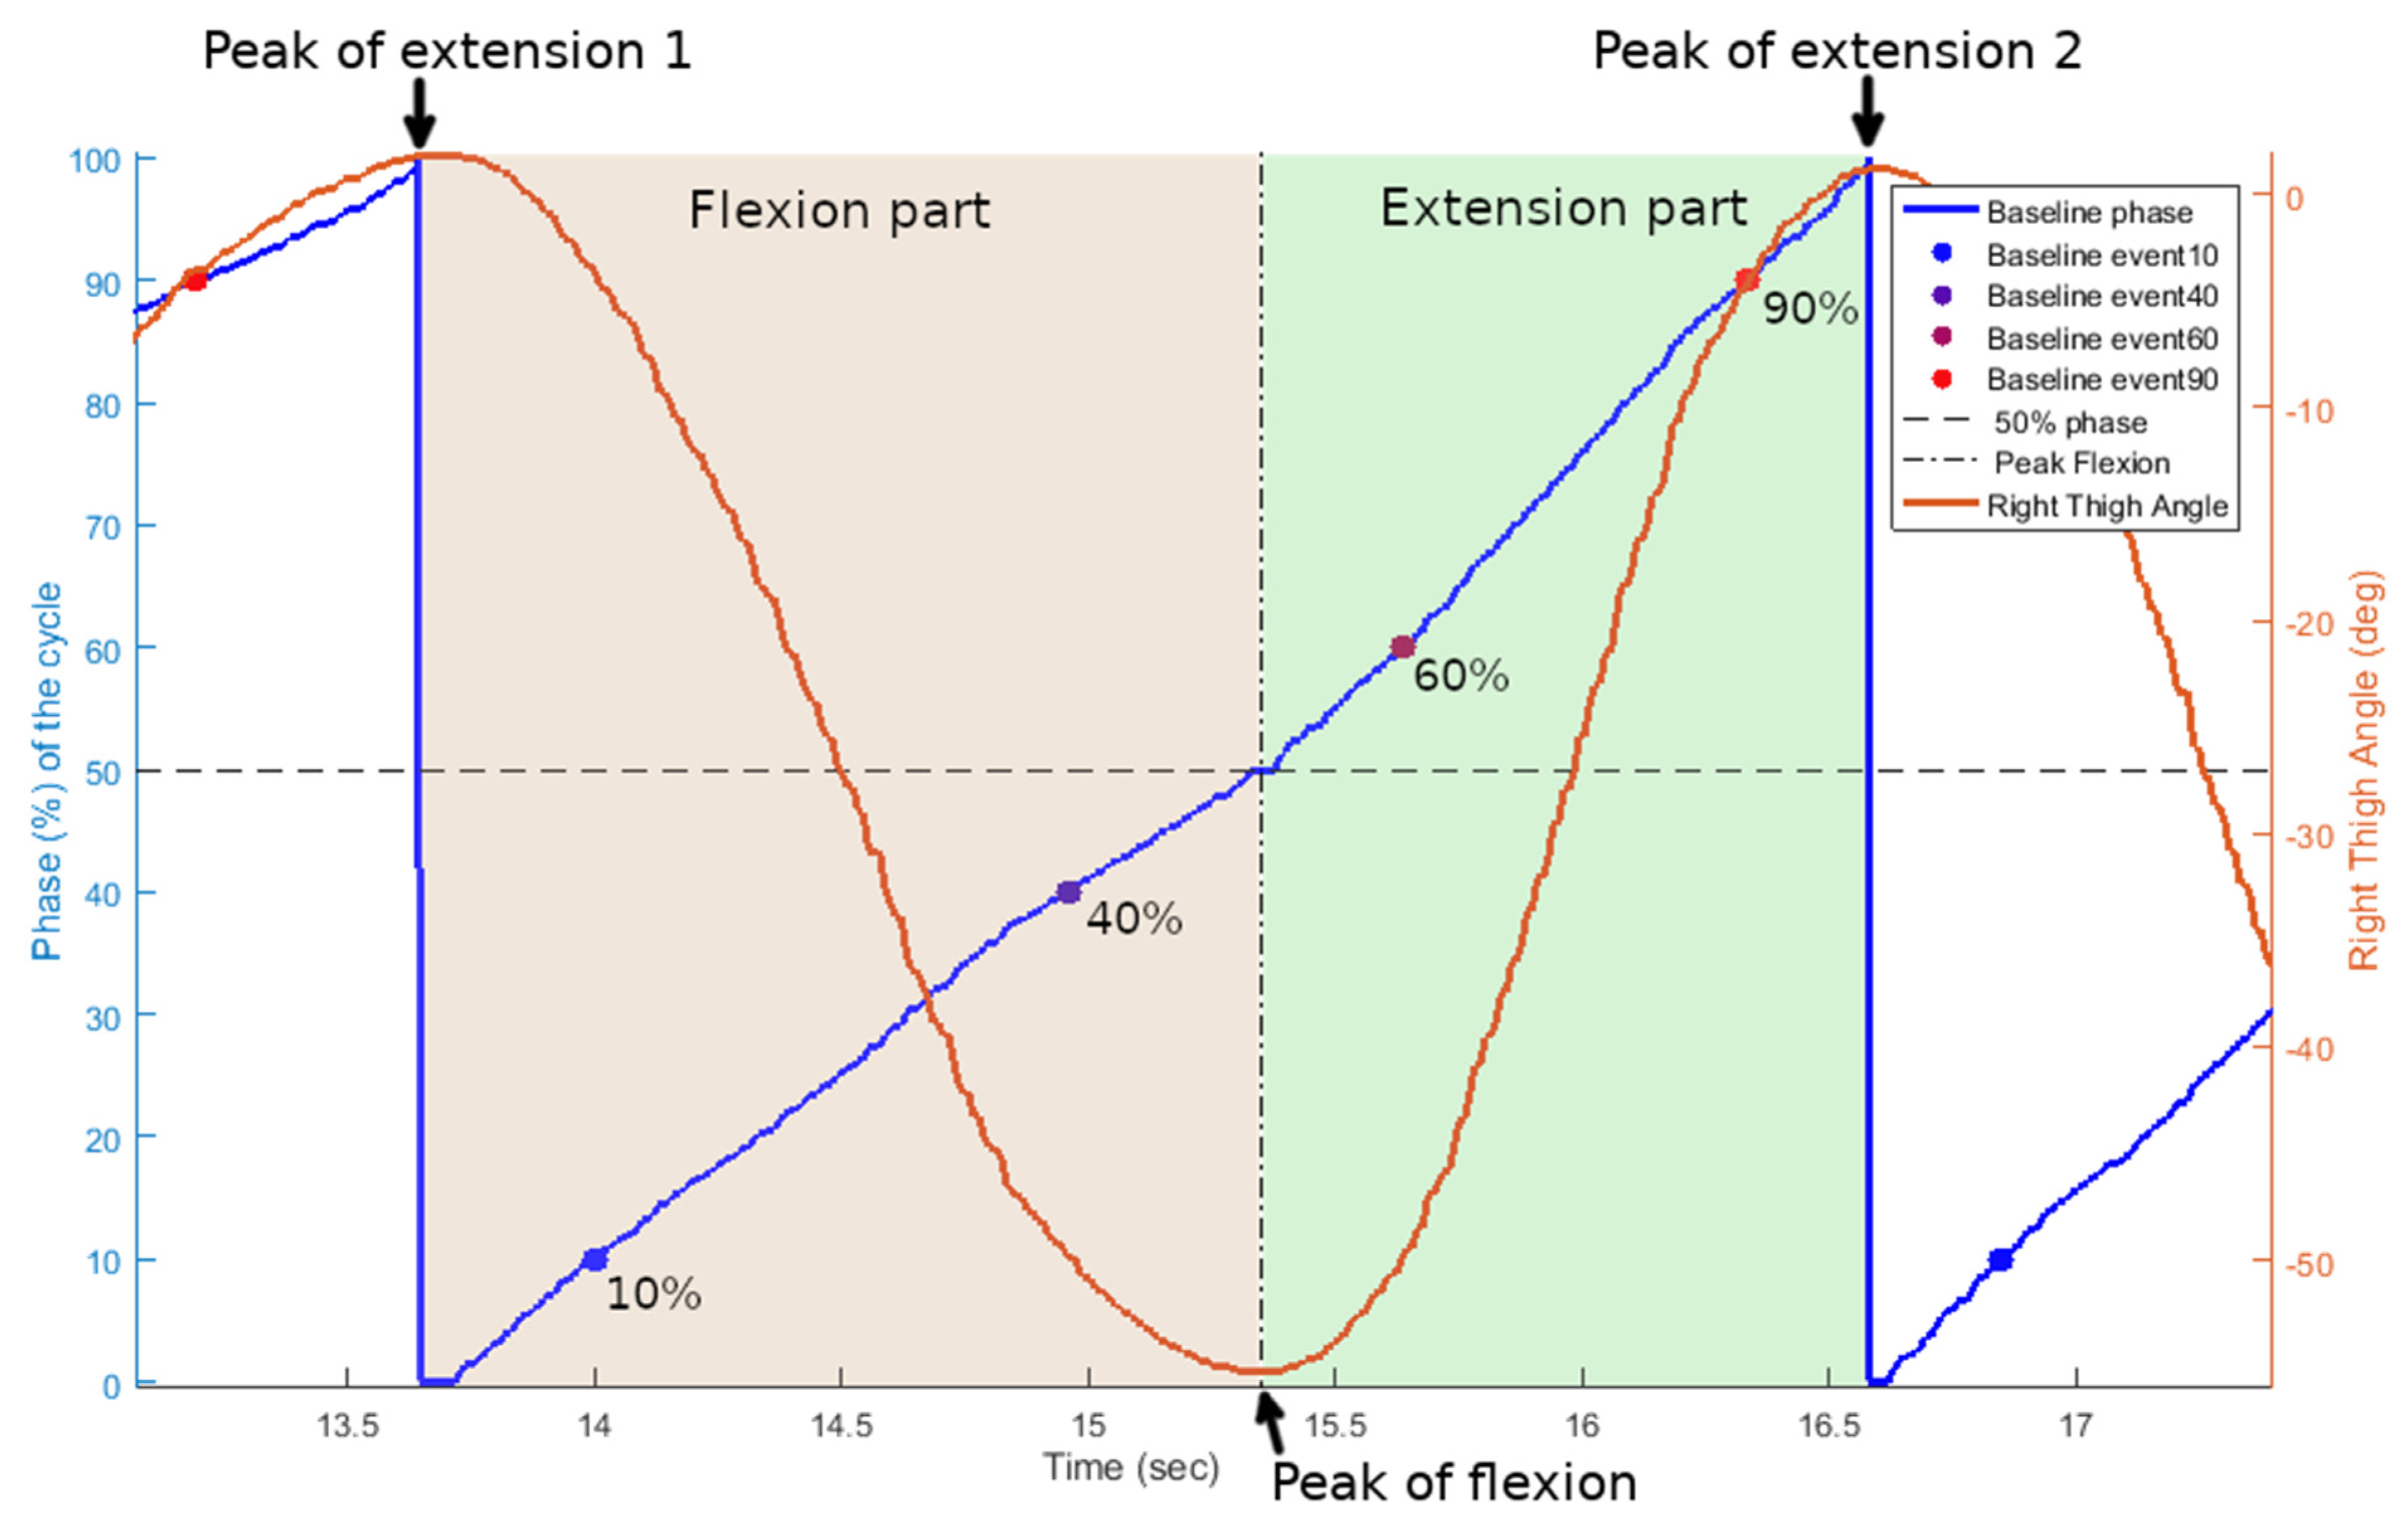
2.3.2. Baseline Reference for Event Detection
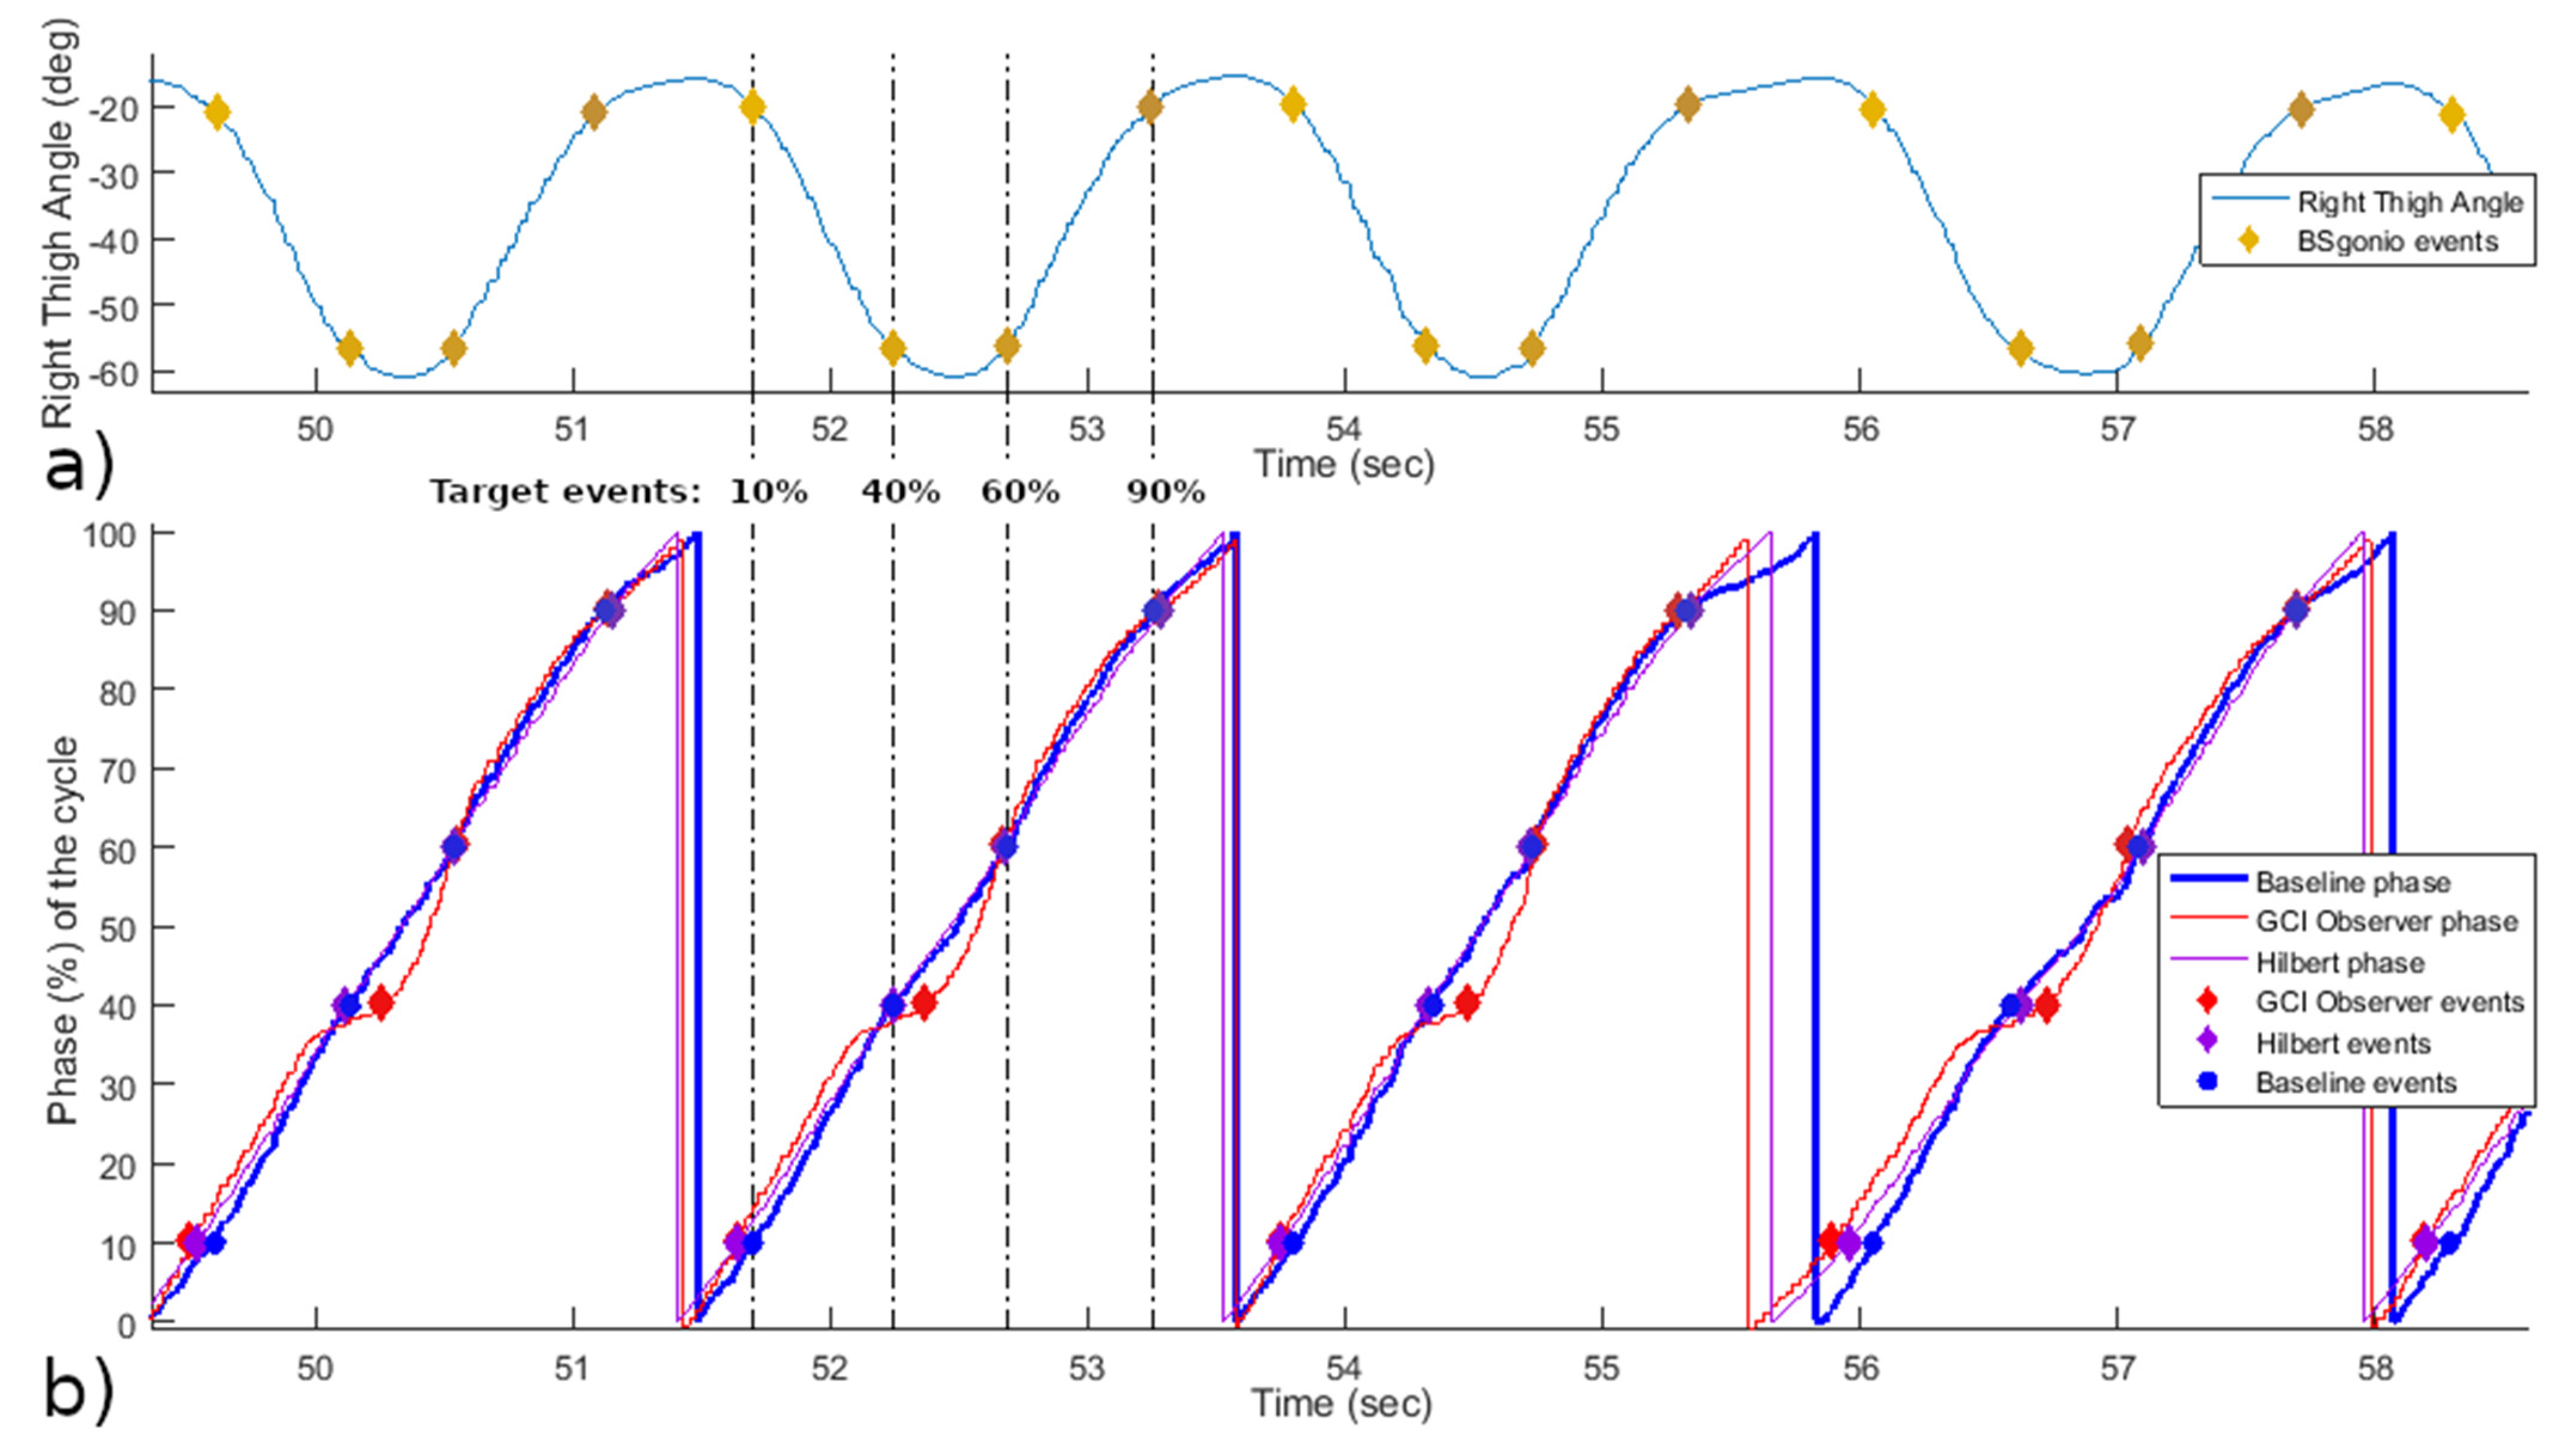
2.3.3. Algorithms
2.3.4. Event Detection
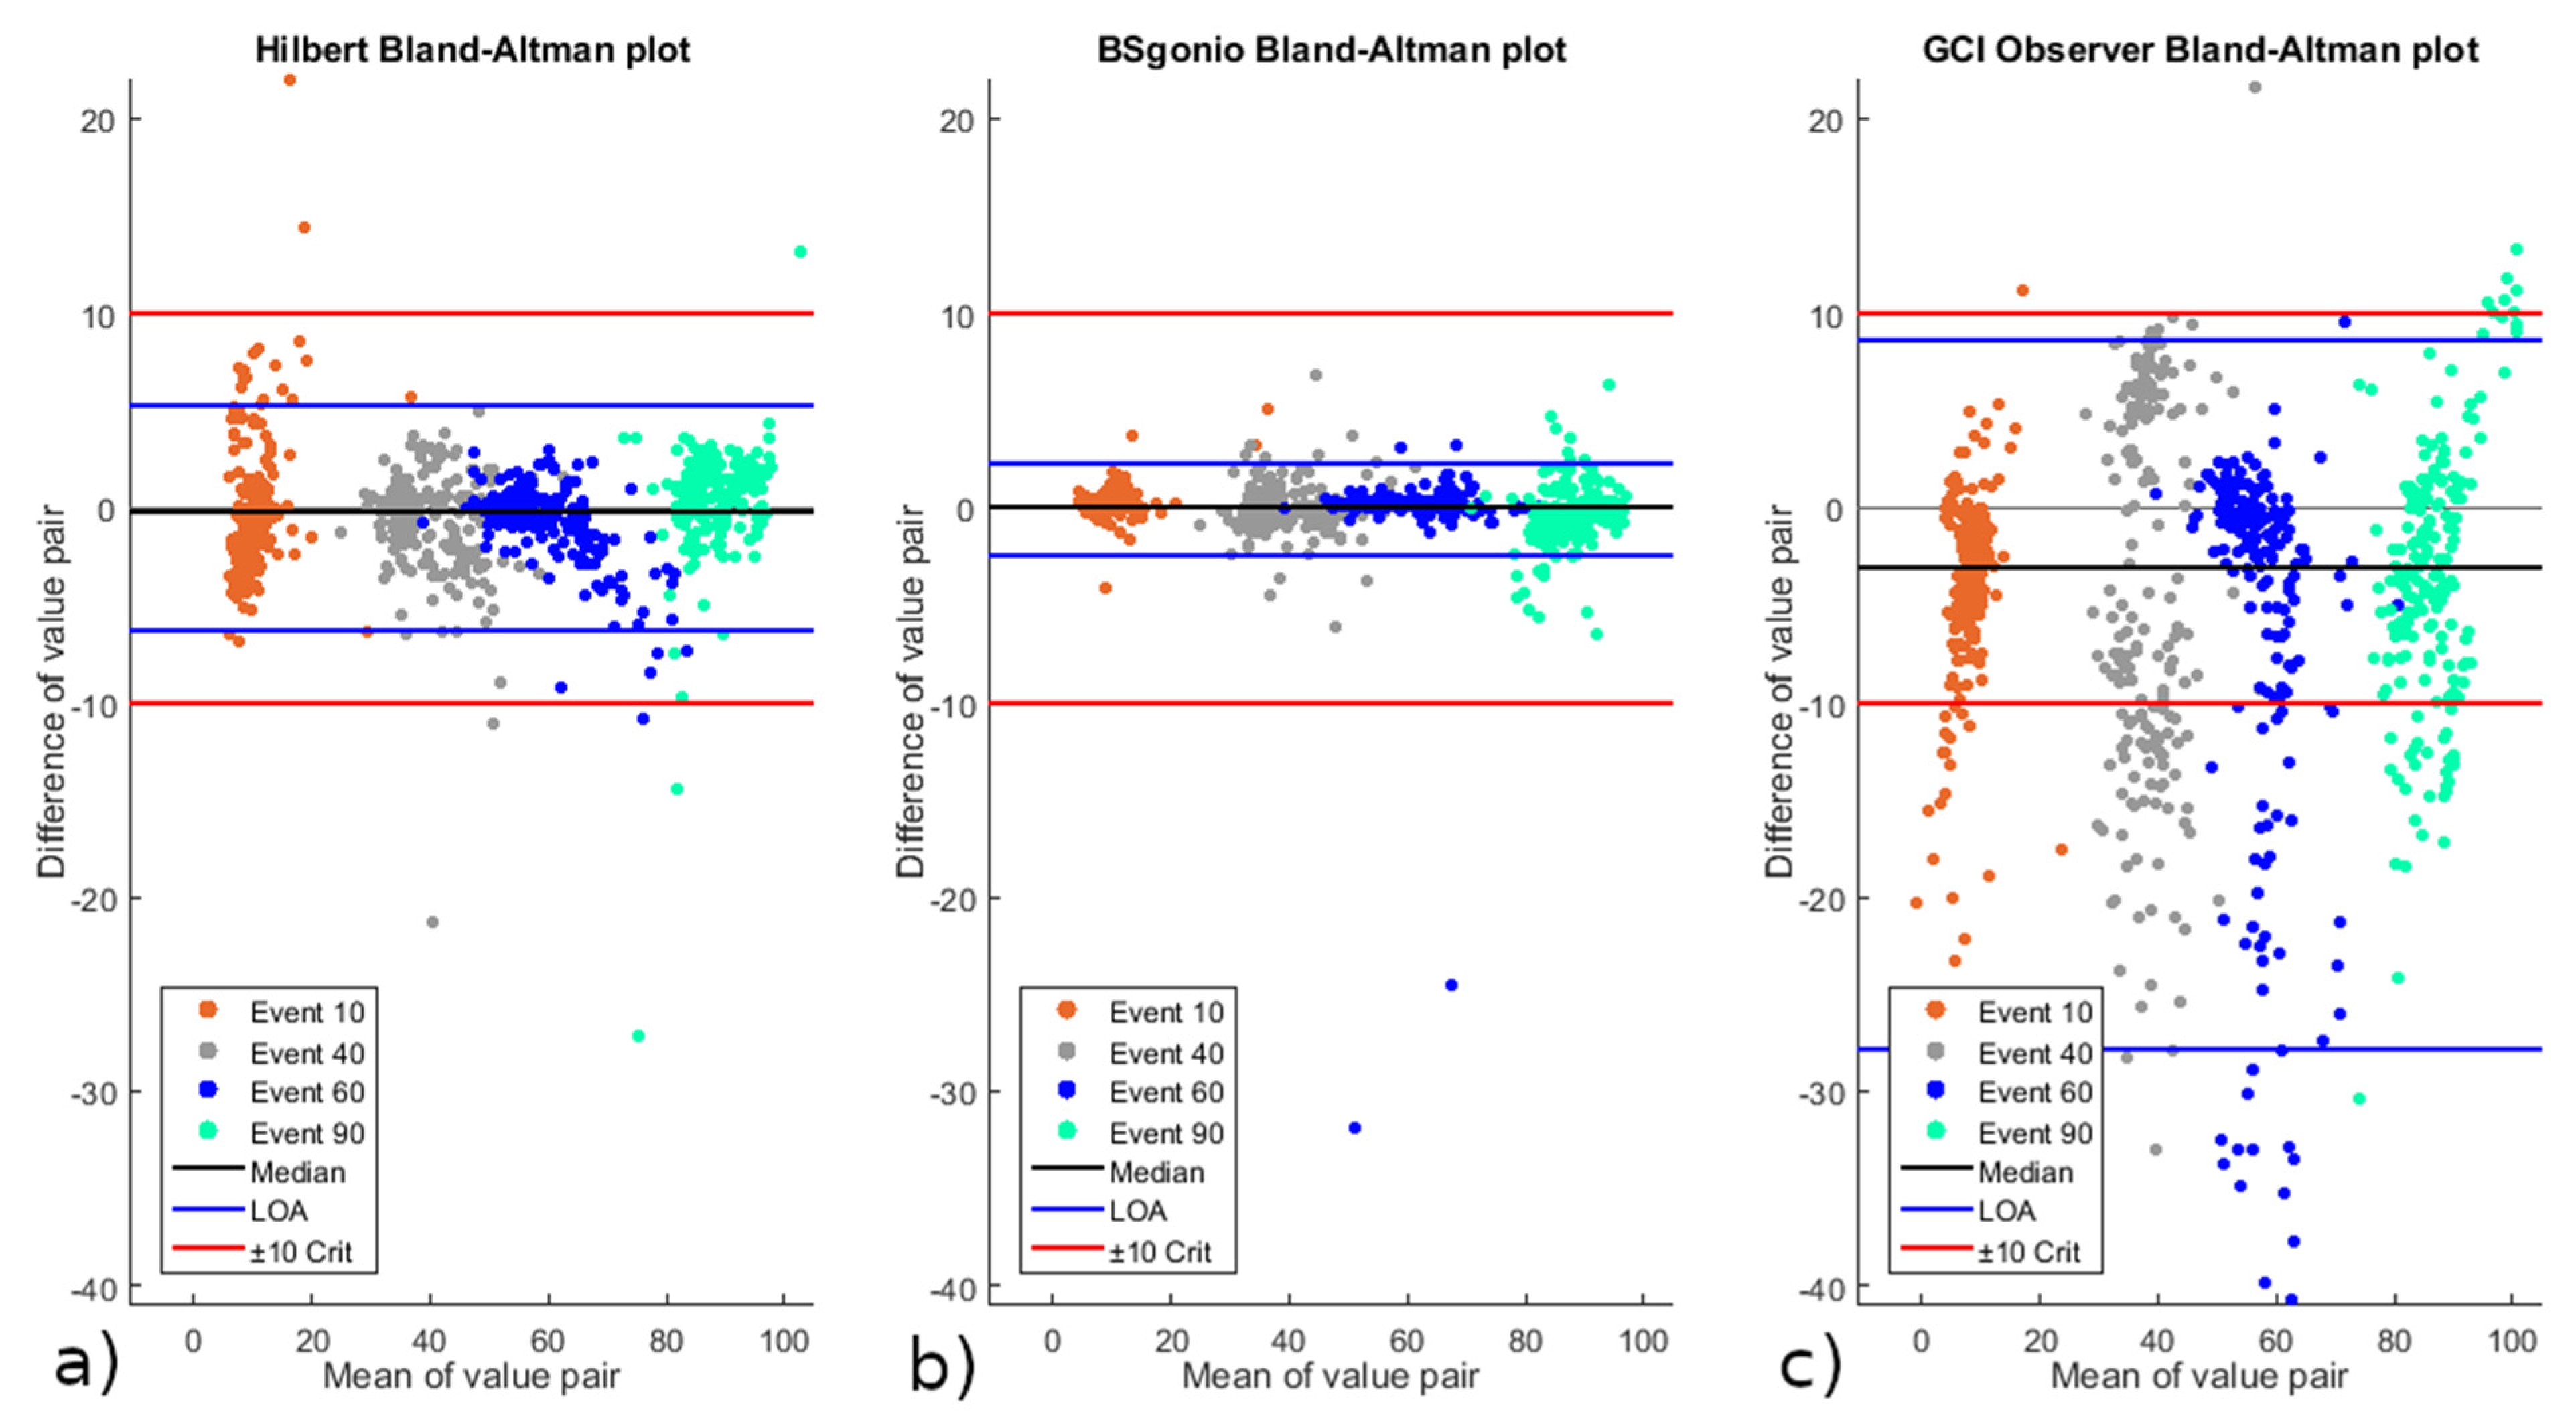
2.3.5. Statistical Data Analysis
3. Results
4. Discussion
Author Contributions
Funding
Institutional Review Board Statement
Informed Consent Statement
Data Availability Statement
Acknowledgments
Conflicts of Interest
References
- Peckham, P.H.; Knutson, J.S. Functional Electrical Stimulation for Neuromuscular Applications. Annu. Rev. Biomed. Eng. 2005, 7, 327–360. [Google Scholar] [CrossRef]
- Dudley, G.A.; Castro, M.J.; Rogers, S.; Apple, D.F. A Simple Means of Increasing Muscle Size after Spinal Cord Injury: A Pilot Study. Eur. J. Appl. Physiol. 1999, 80, 394–396. [Google Scholar] [CrossRef]
- Bickel, C.S.; Yarar-Fisher, C.; Mahoney, E.T.; McCully, K.K. Neuromuscular Electrical Stimulation-Induced Resistance Training after SCI: A Review of the Dudley Protocol. Top. Spinal Cord Inj. Rehabil. 2015, 21, 294–302. [Google Scholar] [CrossRef] [PubMed][Green Version]
- Bajd, T.; Kralj, A.; Turk, R.; Benko, H.; Šega, J. Use of Functional Electrical Stimulation in the Rehabilitation of Patients with Incomplete Spinal Cord Injuries. J. Biomed. Eng. 1989, 11, 96–102. [Google Scholar] [CrossRef]
- Jacobs, P.L.; Nash, M.S. Modes, Benefits, and Risks of Voluntary and Electrically Induced Exercise in Persons with Spinal Cord Injury. J. Spinal Cord Med. 2001, 24, 10–18. [Google Scholar] [CrossRef]
- Berry, H.R.; Perret, C.; Saunders, B.A.; Kakebeeke, T.H.; Donaldson, N.D.N.; Allan, D.B.; Hunt, K.J. Cardiorespiratory and Power Adaptations to Stimulated Cycle Training in Paraplegia. Med. Sci. Sports Exerc. 2008, 40, 1573–1580. [Google Scholar] [CrossRef]
- Peng, C.W.; Chen, S.C.; Lai, C.H.; Chen, C.J.; Chen, C.C.; Mizrahi, J.; Handa, Y. Review: Clinical Benefits of Functional Electrical Stimulation Cycling Exercise for Subjects with Central Neurological Impairments. J. Med. Biol. Eng. 2011, 31, 1–11. [Google Scholar] [CrossRef]
- Petrofsky, J.S.; Heaton, H.; Phillips, C.A. Outdoor Bicycle for Exercise in Paraplegics and Quadriplegics. J. Biomed. Eng. 1983, 5, 292–296. [Google Scholar] [CrossRef]
- Watanabe, T.; Murakami, T.; Handa, Y. Preliminary Tests of a Prototype FES Control System for Cycling Wheelchair Rehabilitation. In Proceedings of the IEEE 13th International Conference on Rehabilitation Robotics, Seattle, WA, USA, 24–26 June 2013. [Google Scholar]
- Bo, A.P.L.; Da Fonseca, L.O.; Guimaraes, J.A.; Fachin-Martins, E.; Paredes, M.E.G.; Brindeiro, G.A.; De Sousa, A.C.C.; Dorado, M.C.N.; Ramos, F.M. Cycling with Spinal Cord Injury: A Novel System for Cycling Using Electrical Stimulation for Individuals with Paraplegia, and Preparation for Cybathlon 2016. IEEE Rob. Autom Mag. 2017, 24, 58–65. [Google Scholar] [CrossRef]
- Perkins, T.; Donaldson, N.; Fitzwater, R.; Phillips, G.; Wood, D.; Mayr, W.; Bijak, M.; Jancik, C. Leg Powered Paraplegic Cycling System Using Surface Functional Electrical Stimulation. In Proceedings of the 7th Vienna International Workshop on Functional Electrical Stimulation, Vienna, Austria, 12–15 September 2001; pp. 36–39. [Google Scholar]
- Rinaldin, C.D.P.; Cabral, L.P.A.; Krueger, E.; Nogueira-Neto, G.N.; Nohama, P.; Scheeren, E.M. Fatigue in Complete Spinal Cord Injury and Implications on Total Delay. Artif. Organs 2020, 44, 305–313. [Google Scholar] [CrossRef]
- Wiesener, C.; Schauer, T. The Cybathlon RehaBike: Inertial-Sensor-Driven Functional Electrical Stimulation Cycling by Team Hasomed. IEEE Rob. Autom. Mag. 2017, 24, 49–57. [Google Scholar] [CrossRef]
- Gföhler, M.; Lugner, P. Dynamic Simulation of FES-Cycling: Influence of Individual Parameters. IEEE Trans. Neural Syst. Rehabil. Eng. 2004, 12, 398–405. [Google Scholar] [CrossRef]
- Wiesener, C.; Ruppin, S.; Schauer, T. Robust Discrimination of Flexion and Extension Phases for Mobile Functional Electrical Stimulation (FES) Induced Cycling in Paraplegics. IFAC-PapersOnLine 2016, 49, 210–215. [Google Scholar] [CrossRef]
- Baptista, R.; Sijobert, B.; Coste, C.A. New Approach of Cycling Phases Detection to Improve FES-Pedaling in SCI Individuals. In Proceedings of the 2018 IEEE/RSJ International Conference on Intelligent Robots and Systems, Madrid, Spain, 1–5 October 2018; pp. 5181–5186. [Google Scholar]
- Sijobert, B.; Le Guillou, R.; Fattal, C.; Azevedo Coste, C. FES-Induced Cycling in Complete SCI: A Simpler Control Method Based on Inertial Sensors. Sensors 2019, 19, 4268. [Google Scholar] [CrossRef]
- Ruppin, S.; Wiesener, C.; Schauer, T. Inertial Sensor-Based Control of Functional Electrical Stimulation in Paraplegic Cycling. Eur. J. Transl. Myology 2016, 26, 2. [Google Scholar]
- Martin Bland, J.; Altman, D.G. Statistical Methods for Assessing Agreement between Two Methods of Clinical Measurement. Lancet 1986, 327, 307–310. [Google Scholar] [CrossRef]
- Gottlieb, U.; Balasukumaran, T.; Hoffman, J.R.; Springer, S. Agreement of Gait Events Detection during Treadmill Backward Walking by Kinematic Data and Inertial Motion Units. Sensors 2020, 20, 6331. [Google Scholar] [CrossRef]
- McGinley, J.L.; Baker, R.; Wolfe, R.; Morris, M.E. The Reliability of Three-Dimensional Kinematic Gait Measurements: A Systematic Review. Gait Posture 2009, 29, 360–369. [Google Scholar] [CrossRef]
- Kawai, H.; Bellman, M.J.; Downey, R.J.; Dixon, W.E. Closed-Loop Position and Cadence Tracking Control for FES-Cycling Exploiting Pedal Force Direction with Antagonistic Biarticular Muscles. IEEE Trans. Control Syst. Technol. 2019, 27, 730–742. [Google Scholar] [CrossRef]
- Hunt, K.J.; Ferrario, C.; Grant, S.; Stone, B.; McLean, A.N.; Fraser, M.H.; Allan, D.B. Comparison of Stimulation Patterns for FES-Cycling Using Measures of Oxygen Cost and Stimulation Cost. Med. Eng. Phys. 2006, 28, 710–718. [Google Scholar] [CrossRef][Green Version]
- McDaniel, J.; Lombardo, L.M.; Foglyano, K.M.; Marasco, P.D.; Triolo, R.J. Cycle Training Using Implanted Neural Prostheses: Team Cleveland. Eur. J. Transl. Myol. 2017, 27, 7087. [Google Scholar] [CrossRef][Green Version]
- Azevedo Coste, C.; Jovic, J.; Pissard-Gibollet, R.; Froger, J. Continuous Gait Cycle Index Estimation for Electrical Stimulation Assisted Foot Drop Correction. J. Neuro Eng. Rehabil. 2014, 11, 1–10. [Google Scholar] [CrossRef][Green Version]
- Héliot, R.; Espiau, B. Multisensor Input for CPG-Based Sensory - Motor Coordination. IEEE Trans. Rob. 2008, 24, 191–195. [Google Scholar] [CrossRef]
- Héliot, R.; Mombaur, K.; Azevedo-Coste, C. Modeling, Simulation and Optimization of Bipedal Walking; Mombaur, K., Berns, K., Eds.; Cognitive Systems Monographs; Springer: Berlin, Heidelberg, 2013; Volume 18, pp. 53–69. [Google Scholar]
- Boashash, B. Estimating and Interpreting the Instantaneous Frequency of a Signal. I. Fundamentals. Proc. IEEE 1992, 80, 520–538. [Google Scholar] [CrossRef]
- Hahn, S.L. Hilbert Transforms in Signal Processing; Artech House: London, UK, 1996. [Google Scholar]
- Giavarina, D. Understanding Bland Altman analysis. Biochemia Med. 2015, 25, 141–151. [Google Scholar] [CrossRef]
- Lin, L.I.-K. A Concordance Correlation Coefficient to Evaluate Reproducibility. Biometrics 1989, 45, 255. [Google Scholar] [CrossRef]
- Vetter, T.R.; Schober, P. Agreement Analysis: What He Said, She Said versus You Said. Anesth. Analg. 2018, 126, 2123–2128. [Google Scholar] [CrossRef]
- McBride, G. A Proposal for Strength-of-Agreement Criteria for Lin’s Concordance Correlation Coefficient. NIWA Client Rep. 2005, 45, 307–310. [Google Scholar]
- Schmoll, M.; Guillou, R.L.; Borges, D.L.; Fattal, C.; Martins, E.F.; Coste, C.A. Standardizing Fatigue-Resistance Testing during Electrical Stimulation of Paralysed Human Quadriceps Muscles, a Practical Approach. J. Neuro Eng. Rehabil. 2021, 18, 1–14. [Google Scholar]
- Sinclair, P.J.; Smith, R.M.; Davis, G.M. The Effect of Joint Angle on the Timing of Muscle Contractions Elicited by Neuromuscular Electrical Stimulation. IEEE Trans. Neural Syst. Rehabil. Eng. 2004, 12, 303–306. [Google Scholar] [CrossRef]


| Subject | Gender | Age (Years) | Body Mass Index (kg/m2) | Time Since Injury (Months) | Injury Level |
|---|---|---|---|---|---|
| P1 | Male | 43 | 19.4 | 252 | C5 |
| P2 | Male | 33 | 23.4 | 204 | C5 |
| P3 | Male | 42 | 29.4 | 36 | T6 |
| P4 | Male | 33 | 29.2 | 144 | T1 |
| P5 | Male | 47 | 24.0 | 79 | T7 |
| P6 | Female | 36 | 21.4 | 180 | T7 |
| Mean | - | 39 | 24.5 | 149 | - |
| SD 1 | - | 5 | 3.7 | 73 | - |
| Hilbert (n = 784) | BSgonio (n = 770) | GCI (n = 772) | |
|---|---|---|---|
| Delay in % of cycle duration | Delay in % of cycle duration | Delay in % of cycle duration | |
| Median delay error | −0.20 | 0.05 | −3.08 |
| Mean delay error ± SD | −0.40 ± 3.16 | −0.03 ± 2.22 | −4.63 ± 8.70 |
| 95% Upper LoA | 5.17 | 2.25 | 8.59 |
| 95% Lower LoA | −6.34 | −2.51 | −27.89 |
| Absolute 95% LoA | 5.59 | 2.44 | 21.57 |
| Hilbert | BSgonio | GCI | |
|---|---|---|---|
| Lin CCC | 0.9941 | 0.9971 | 0.9440 |
| Upper 95% of CI | 0.9948 | 0.9975 | 0.9511 |
| Lower 95% of CI | 0.9932 | 0.9966 | 0.9360 |
Publisher’s Note: MDPI stays neutral with regard to jurisdictional claims in published maps and institutional affiliations. |
© 2021 by the authors. Licensee MDPI, Basel, Switzerland. This article is an open access article distributed under the terms and conditions of the Creative Commons Attribution (CC BY) license (https://creativecommons.org/licenses/by/4.0/).
Share and Cite
Le Guillou, R.; Schmoll, M.; Sijobert, B.; Lobato Borges, D.; Fachin-Martins, E.; Resende, H.; Pissard-Gibollet, R.; Fattal, C.; Azevedo Coste, C. A Novel Framework for Quantifying Accuracy and Precision of Event Detection Algorithms in FES-Cycling. Sensors 2021, 21, 4571. https://doi.org/10.3390/s21134571
Le Guillou R, Schmoll M, Sijobert B, Lobato Borges D, Fachin-Martins E, Resende H, Pissard-Gibollet R, Fattal C, Azevedo Coste C. A Novel Framework for Quantifying Accuracy and Precision of Event Detection Algorithms in FES-Cycling. Sensors. 2021; 21(13):4571. https://doi.org/10.3390/s21134571
Chicago/Turabian StyleLe Guillou, Ronan, Martin Schmoll, Benoît Sijobert, David Lobato Borges, Emerson Fachin-Martins, Henrique Resende, Roger Pissard-Gibollet, Charles Fattal, and Christine Azevedo Coste. 2021. "A Novel Framework for Quantifying Accuracy and Precision of Event Detection Algorithms in FES-Cycling" Sensors 21, no. 13: 4571. https://doi.org/10.3390/s21134571
APA StyleLe Guillou, R., Schmoll, M., Sijobert, B., Lobato Borges, D., Fachin-Martins, E., Resende, H., Pissard-Gibollet, R., Fattal, C., & Azevedo Coste, C. (2021). A Novel Framework for Quantifying Accuracy and Precision of Event Detection Algorithms in FES-Cycling. Sensors, 21(13), 4571. https://doi.org/10.3390/s21134571