Author Contributions
Conceptualization, P.K. and J.L.; methodology, P.K.; software, P.K. and J.L.; validation, P.K. and J.L.; formal analysis, P.K.; investigation, P.K. and J.L.; resources, P.K. and J.L.; data curation, P.K.; writing—original draft preparation, P.K.; writing—review and editing, C.S.S.; visualization, P.K.; supervision, C.S.S.; project administration, C.S.S.; and funding acquisition, C.S.S. All authors have read and agreed to the published version of the manuscript.
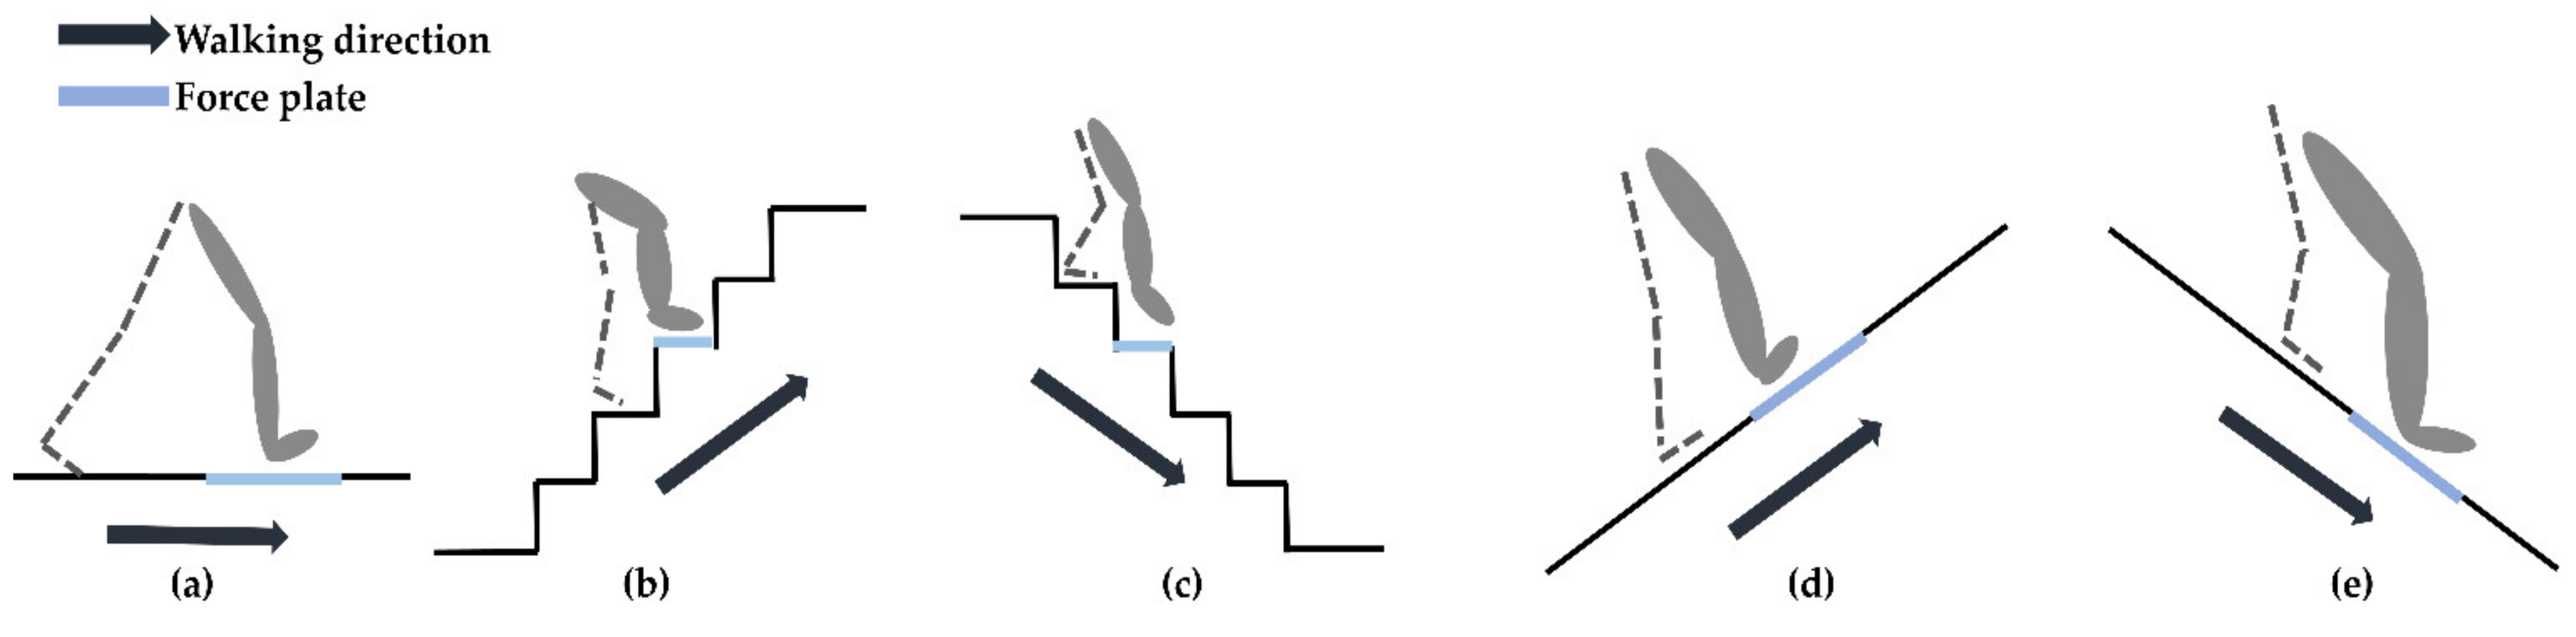
Figure 1.
The five walking environments tested in this work (a) flat-ground, (b) upstairs, (c) downstairs, (d) uphill, and (e) downhill. A force plate was embedded in different positions according to each walking environment as shown by the blue line in each diagram. The force plate was embedded in the floor of the flat- ground environment as shown in (a). The experimental staircase was designed with five steps, here the force plate was embedded in the third step as shown in (b,c). The sloped walkway was made of three pieces joined together, the force plate was embedded in the second piece as shown in (d,e).
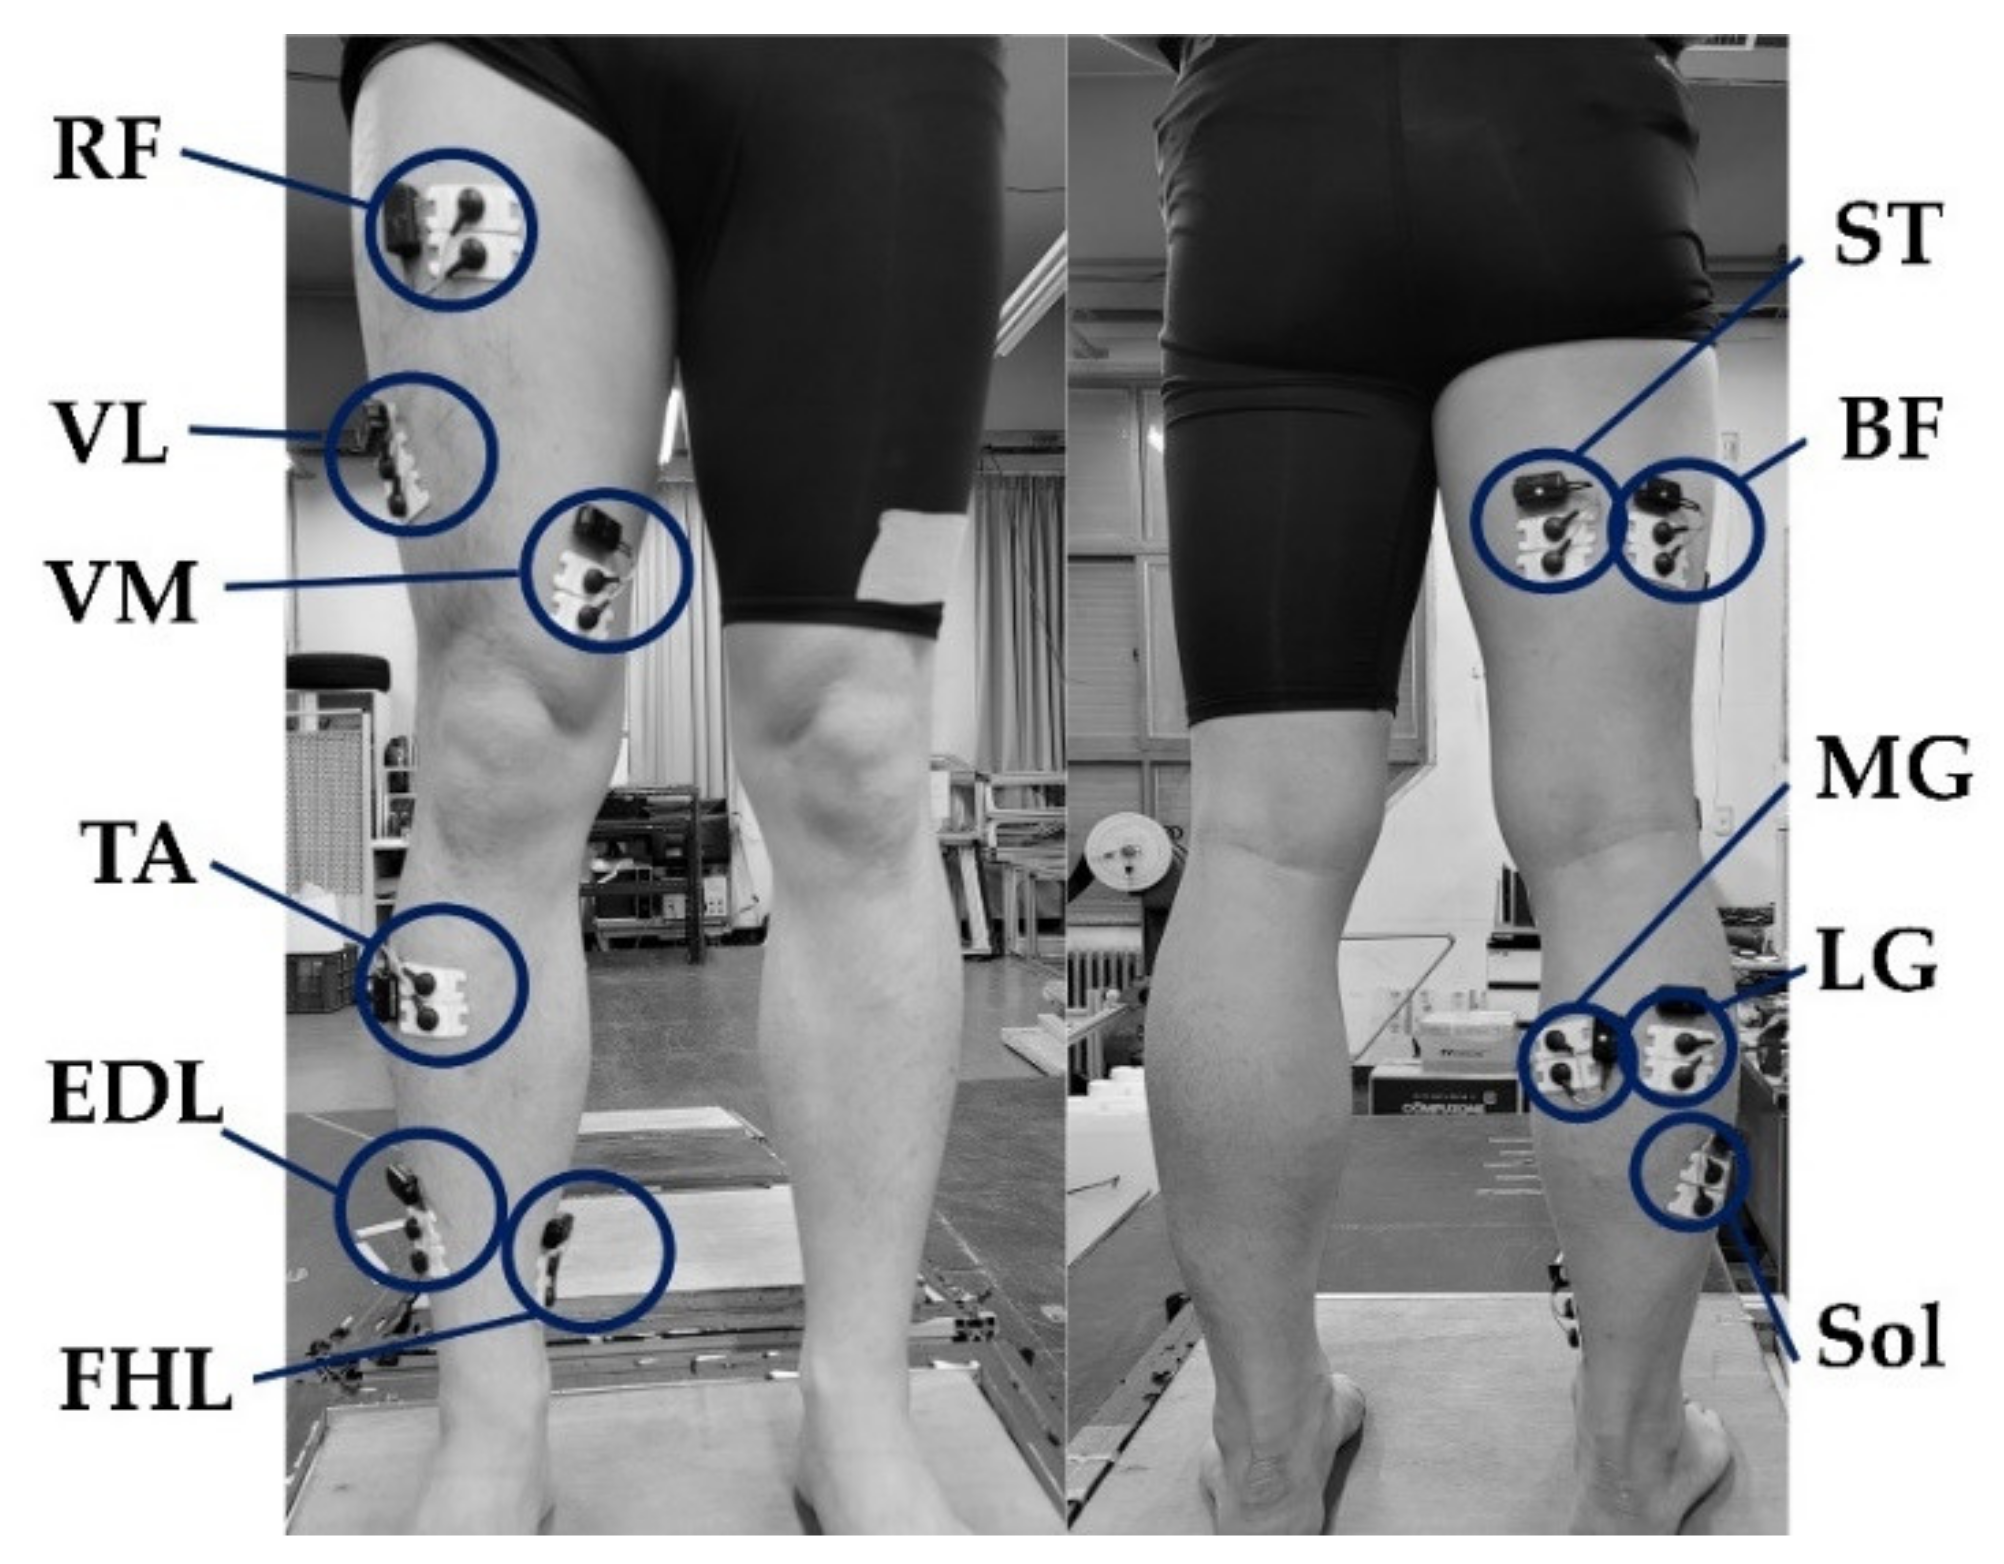
Figure 2.
Attachment of electrodes. RF, VL, VM, ST, BF, MG, LG, Sol, TA, FHL, and EDL labels indicate the rectus femoris, vastus lateralis, vastus medialis, semitendinosus, biceps femoris, medial gastrocnemius, lateral gastrocnemius, soleus, tibialis anterior, flexor hallucis longus, and extensor digitorum longus, respectively.
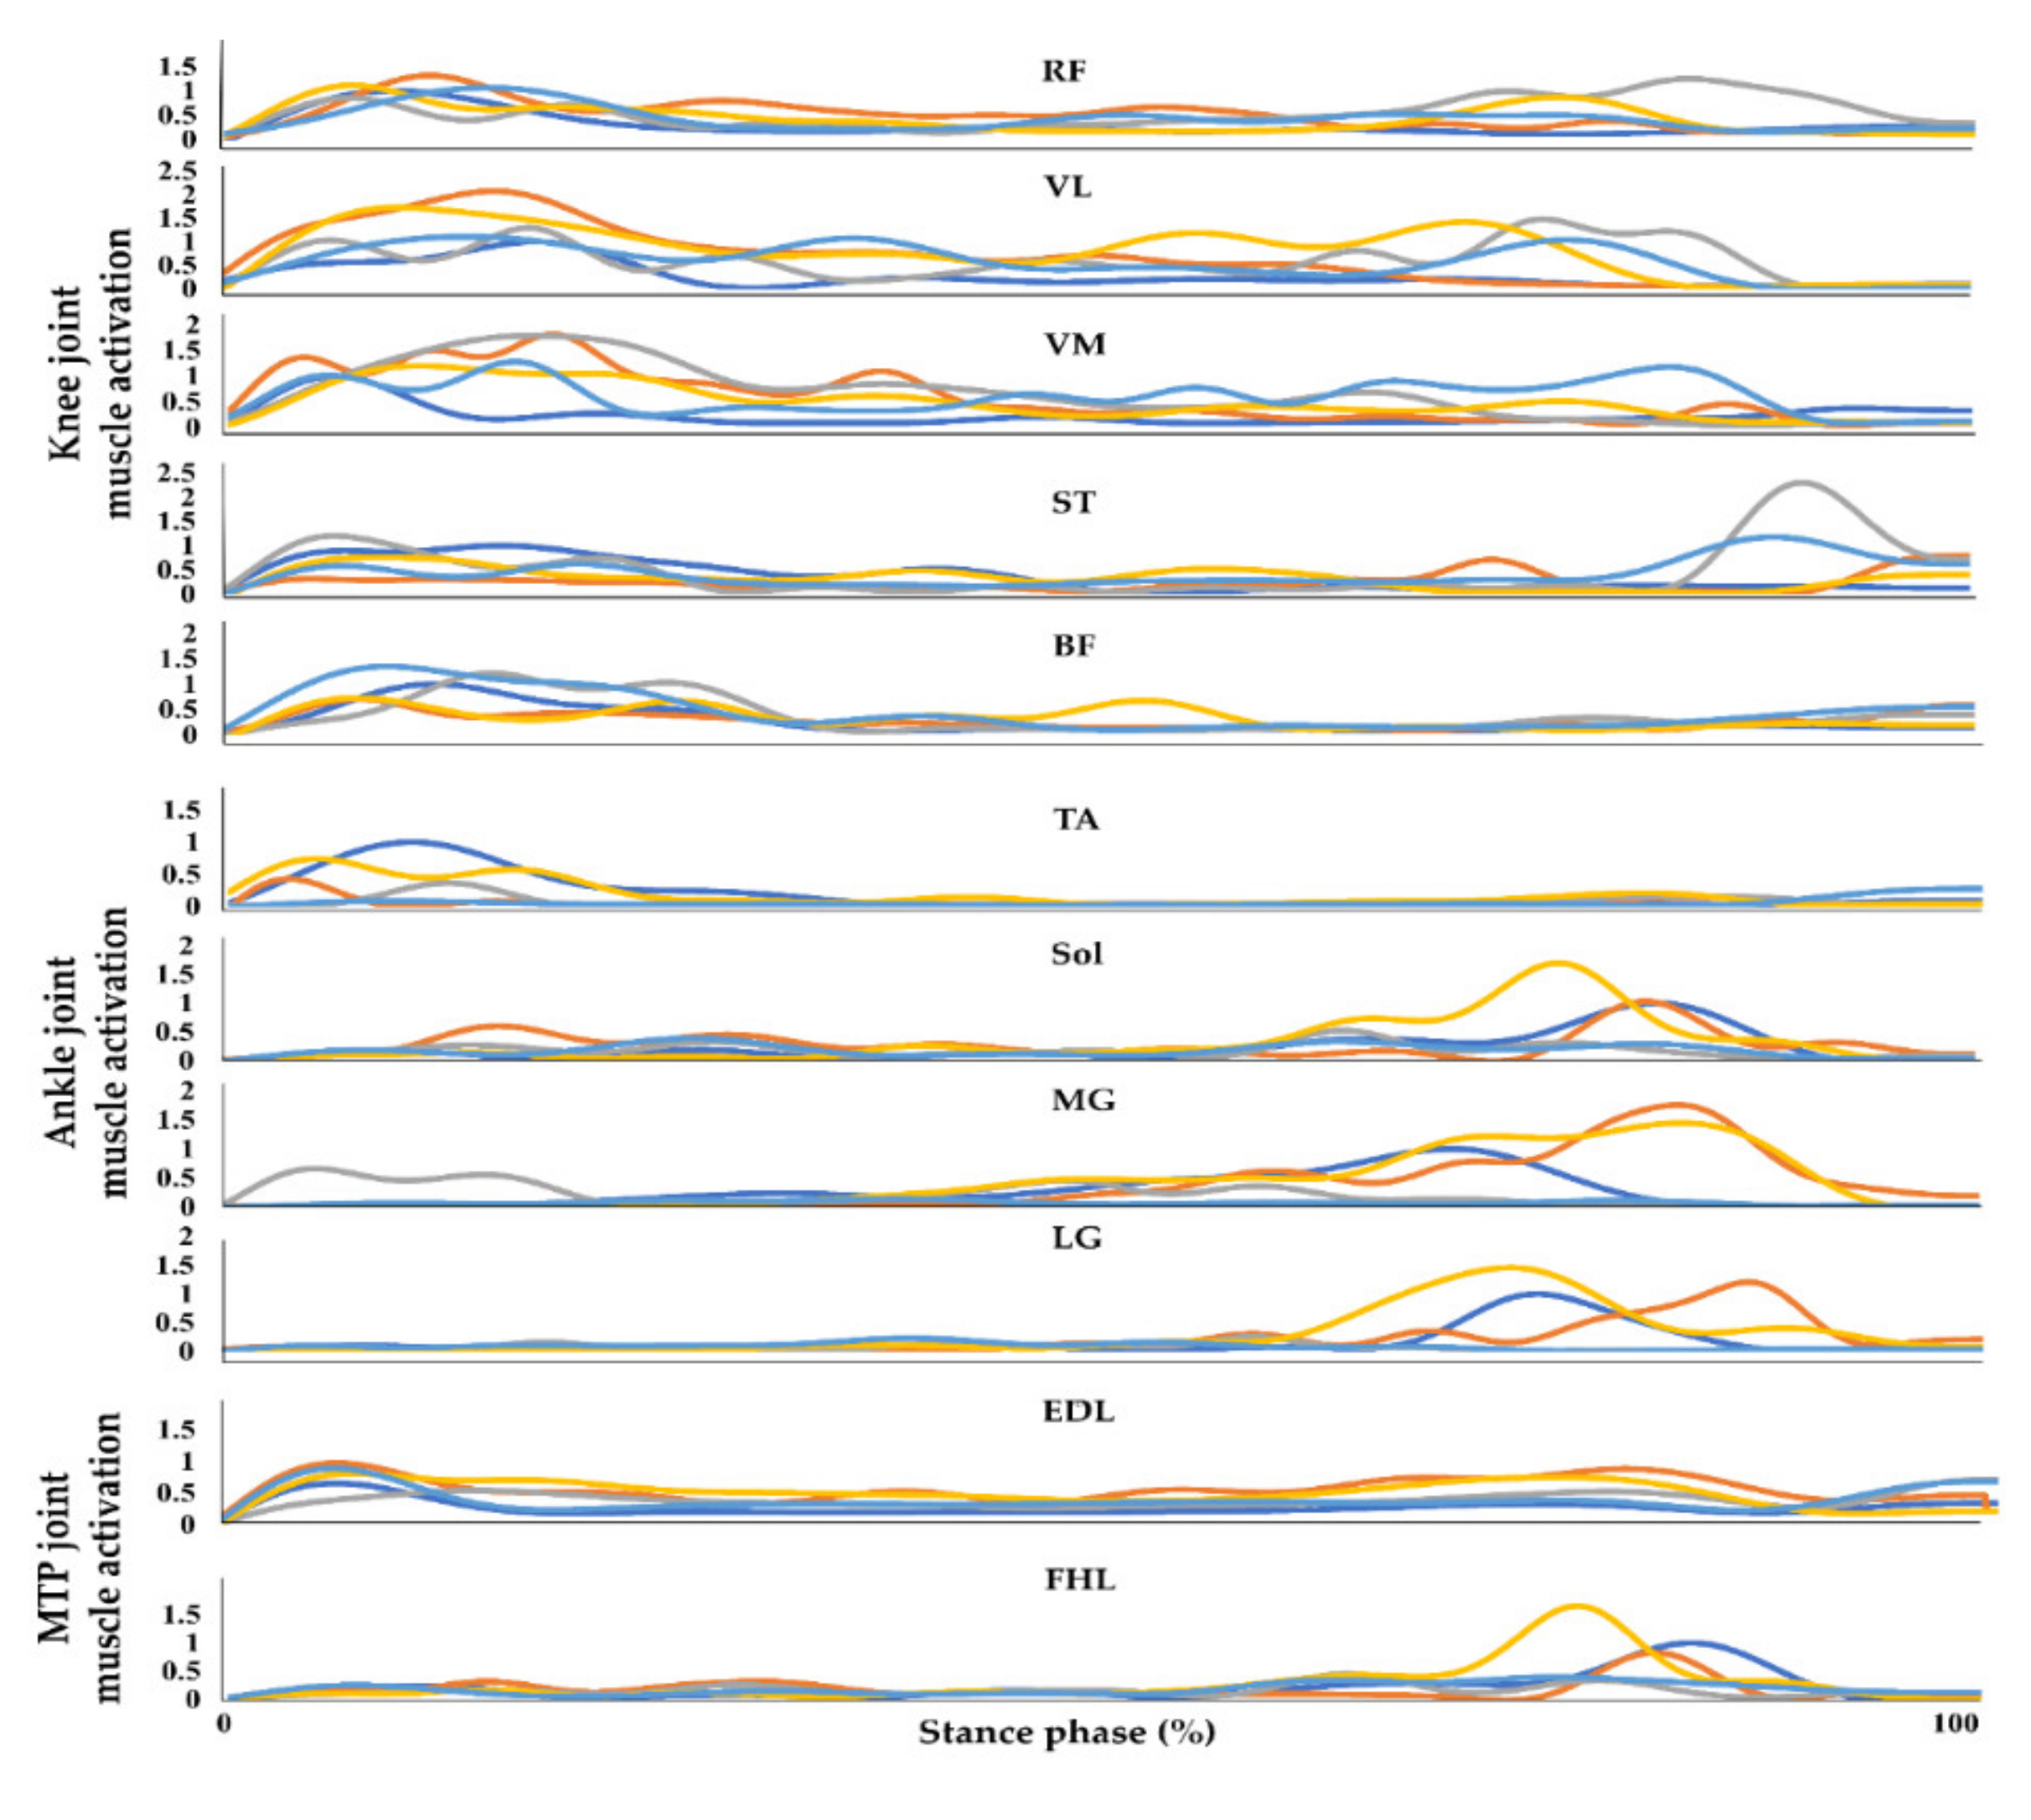
Figure 3.
Example of an entire normalized sEMG profile from one trial of a subject collected during the stance phase while walking on flat-ground, upstairs, downstairs, uphill, and downhill. RF, VL, VM, ST, BF, TA, Sol, MG, LG, FHL, and EDL indicate the rectus femoris, vastus lateralis, vastus medialis, semitendinosus, biceps femoris, tibialis anterior, soleus, medial gastrocnemius, lateral gastrocnemius, flexor hallucis longus, and extensor digitorum longus, respectively. The blue, orange, grey, yellow, and sky-blue lines indicate walking on flat-ground, upstairs, downstairs, uphill, and downhill, respectively.
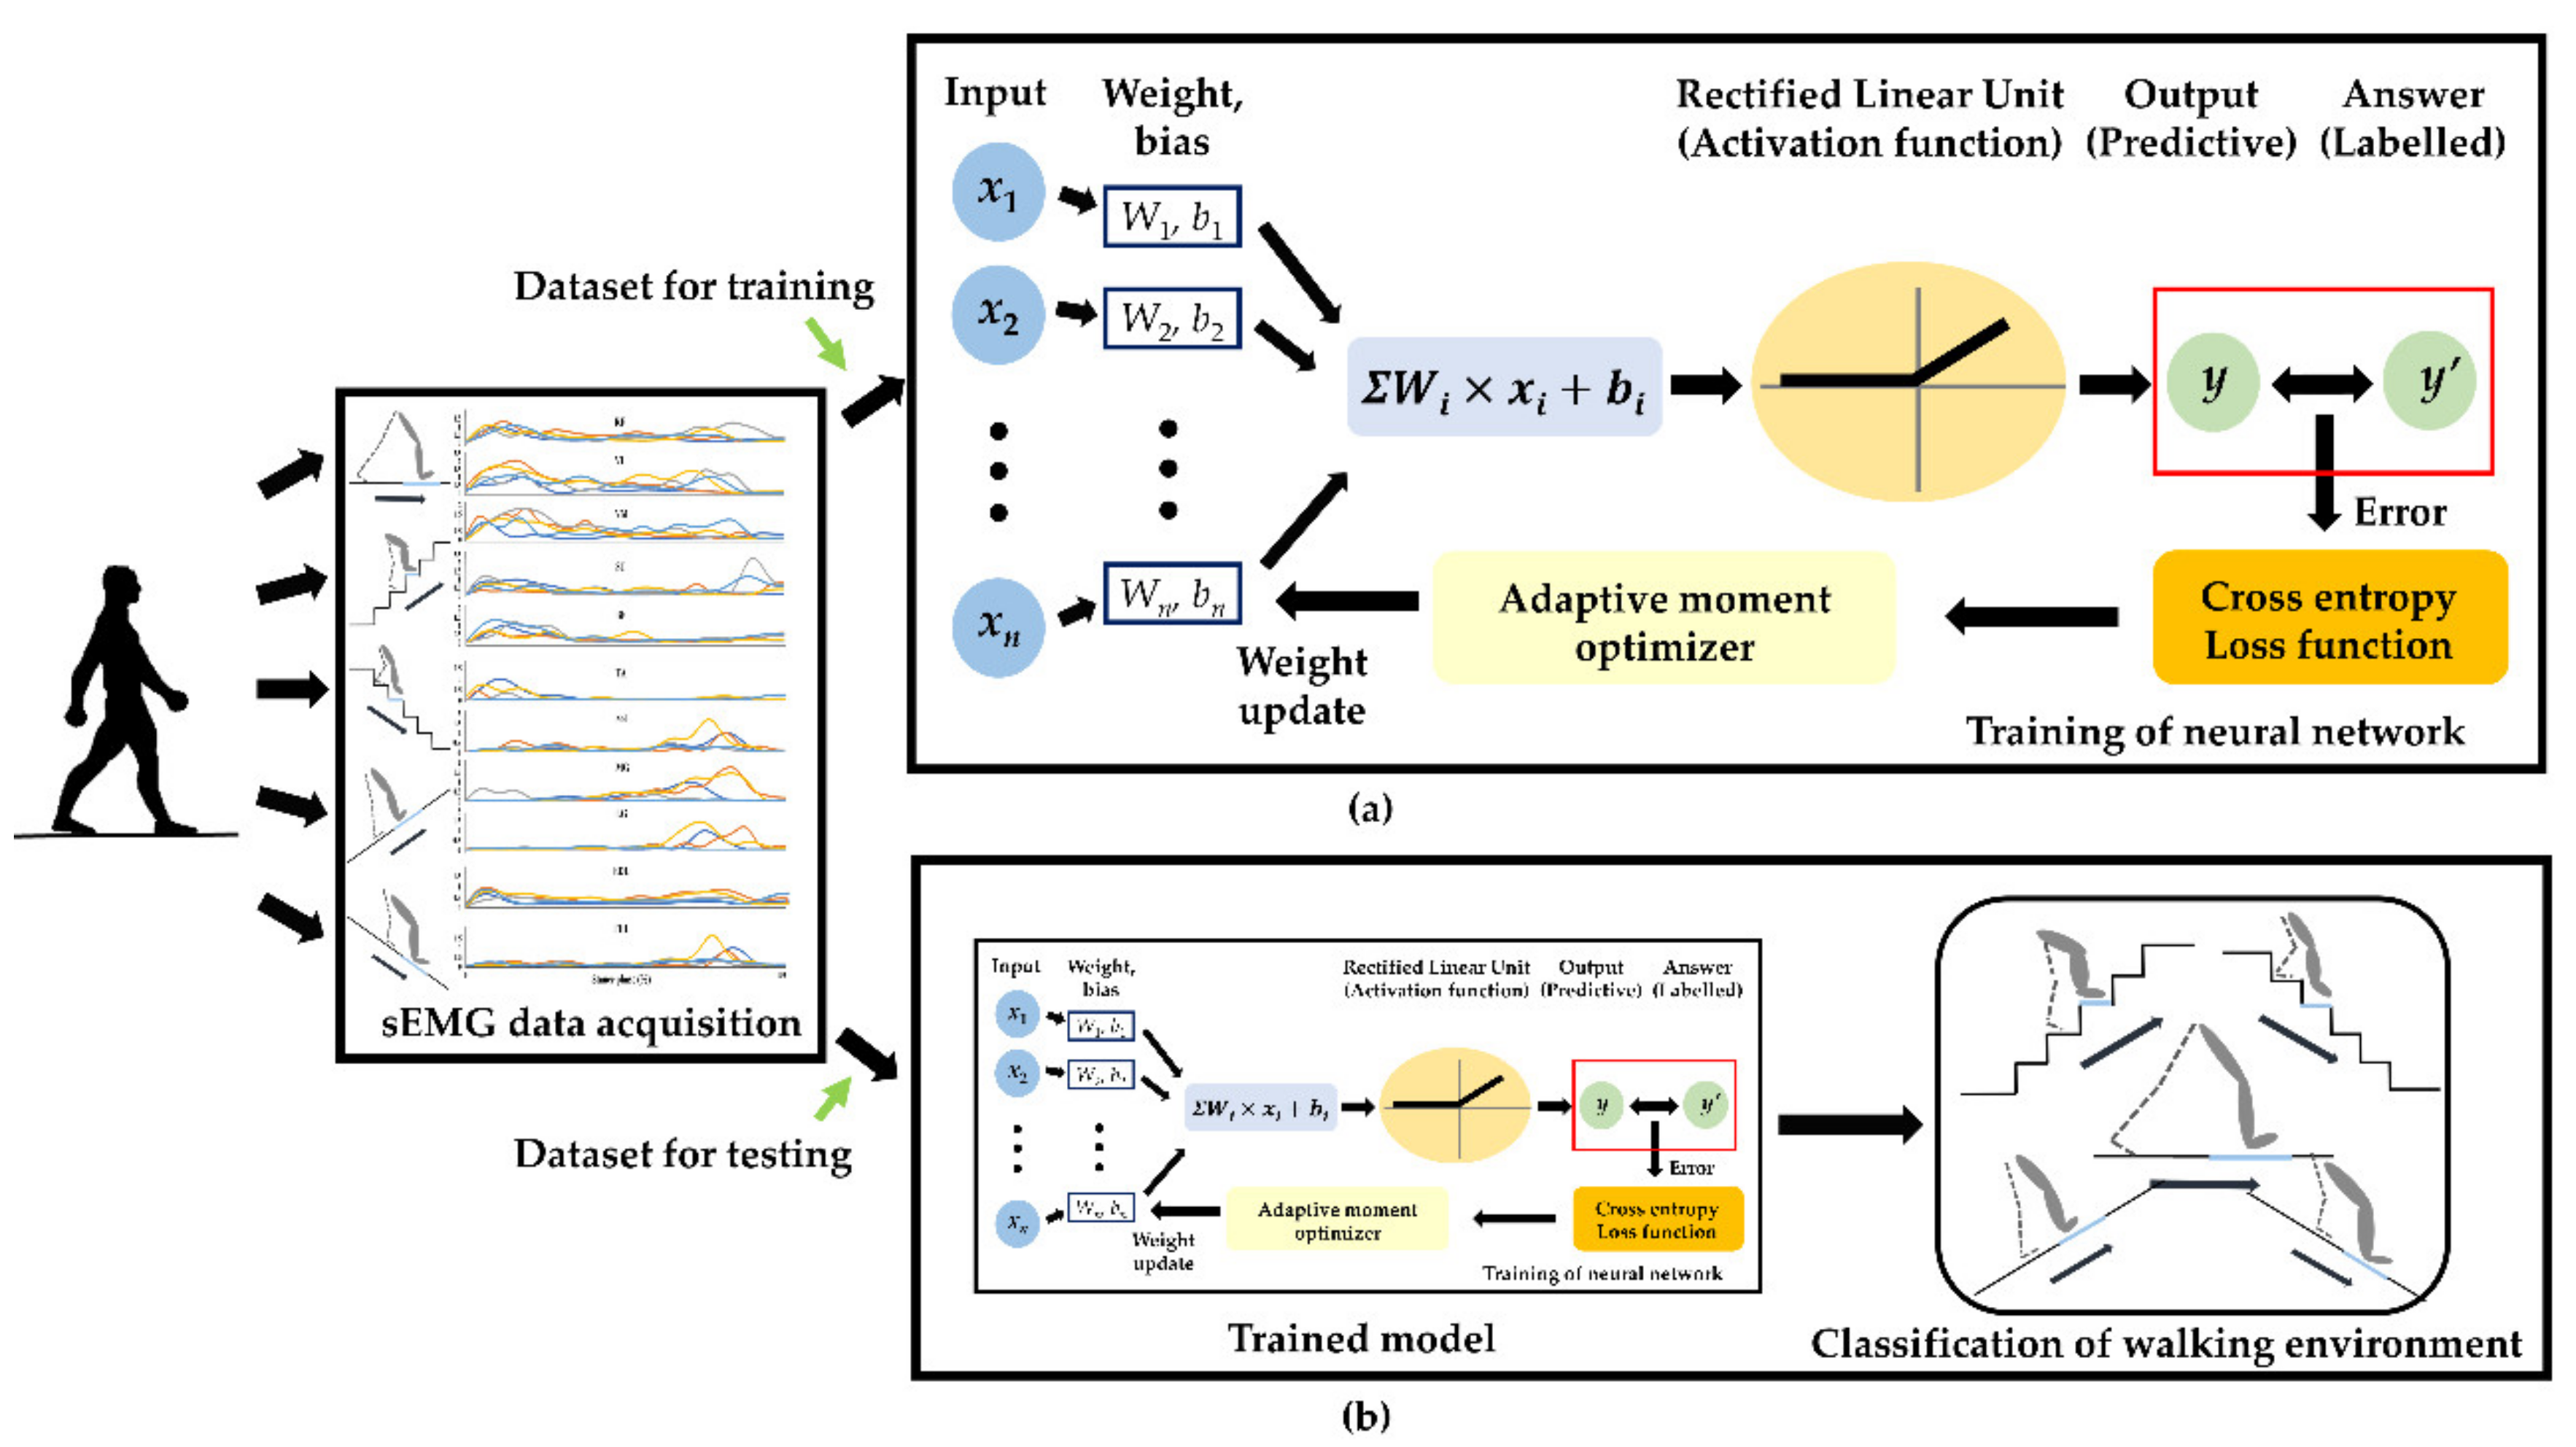
Figure 4.
Schematics of the classification procedures using sEMG signals as the input to an artificial neural network (a) training the artificial neural network, (b) classification of walking environment.
Figure 4.
Schematics of the classification procedures using sEMG signals as the input to an artificial neural network (a) training the artificial neural network, (b) classification of walking environment.
Table 1.
Labeling table. The walking environments are labelled in a sequence.
Table 1.
Labeling table. The walking environments are labelled in a sequence.
| Walking Environment | Label |
|---|
| FGW | 1 |
| US | 2 |
| DS | 3 |
| UW | 4 |
| DW | 5 |
Table 2.
The definitions of TP, FP, FN, and TN.
Table 2.
The definitions of TP, FP, FN, and TN.
| | Prediction | Positive | Negative |
|---|
| Actual | | | |
|---|
| Positive | | TP | FN |
| Negative | | FP | TN |
Table 3.
Confusion matrix for walking environment classification using sEMG signals as input.
Table 3.
Confusion matrix for walking environment classification using sEMG signals as input.
| All Muscle Activation |
|---|
| | FGW | US | DS | UW | DW |
|---|
| FGW | 100 | 0 | 0 | 0 | 0 |
| US | 0 | 100 | 0 | 0 | 0 |
| DS | 0 | 0 | 96.3 | 0 | 3.7 |
| UW | 3.7 | 0 | 0 | 96.3 | 0 |
| DW | 0 | 3.7 | 3.7 | 3.7 | 88.9 |
Table 4.
The accuracy, sensitivity, and specificity of the model when using all muscle profiles.
Table 4.
The accuracy, sensitivity, and specificity of the model when using all muscle profiles.
| | Walking Environment | All Muscle Activations |
|---|
| Accuracy (%) | All conditions | 96.3 |
| Sensitivity (%) | Flat-ground | 100 |
| Upstairs | 100 |
| Downstairs | 96.3 |
| Uphill | 96.3 |
| Downhill | 88.9 |
| Specificity (%) | Flat-ground | 99.1 |
| Upstairs | 99.1 |
| Downstairs | 99.1 |
| Uphill | 100 |
| Downhill | 99.1 |
Table 5.
The confusion matrix for classifying the walking environment using only sEMG signals from the flexor and extensor muscle groups of the ankle, knee, and metatarsophalangeal (MTP) joint.
Table 5.
The confusion matrix for classifying the walking environment using only sEMG signals from the flexor and extensor muscle groups of the ankle, knee, and metatarsophalangeal (MTP) joint.
| Flexor | Extensor |
|---|
| | | FGW | US | DS | UW | DW | | FGW | US | DS | UW | DW |
|---|
| Knee | FGW | 74.1 | 3.7 | 0 | 14.8 | 7.4 | FGW | 77.8 | 3.7 | 0.0 | 3.7 | 14.8 |
| US | 3.7 | 88.9 | 3.7 | 0 | 3.7 | US | 0.0 | 77.8 | 0.0 | 18.5 | 3.7 |
| DS | 0 | 14.8 | 77.8 | 0 | 7.4 | DS | 7.4 | 0.0 | 74.1 | 3.7 | 14.8 |
| UW | 18.5 | 0 | 3.7 | 74.1 | 3.7 | UW | 7.4 | 14.8 | 3.7 | 63.0 | 11.1 |
| DW | 18.5 | 0 | 14.8 | 3.7 | 63 | DW | 11.1 | 18.5 | 14.8 | 7.4 | 48.1 |
| Ankle | FGW | 59.3 | 11.1 | 0.0 | 11.1 | 18.5 | FGW | 88.9 | 0.0 | 0.0 | 7.4 | 3.7 |
| US | 3.7 | 48.1 | 29.6 | 3.7 | 14.8 | US | 7.4 | 92.6 | 0.0 | 0.0 | 0.0 |
| DS | 0.0 | 3.7 | 81.5 | 3.7 | 11.1 | DS | 0.0 | 3.7 | 85.2 | 0.0 | 11.1 |
| UW | 14.8 | 14.8 | 7.4 | 59.3 | 3.7 | UW | 11.1 | 0.0 | 0.0 | 88.9 | 0.0 |
| DW | 7.4 | 11.1 | 7.4 | 7.4 | 66.7 | DW | 7.4 | 3.7 | 0.0 | 0.0 | 88.9 |
| MTP | FGW | 74.1 | 0.0 | 0.0 | 11.1 | 14.8 | FGW | 25.9 | 11.1 | 11.1 | 25.9 | 37.0 |
| US | 3.7 | 81.5 | 7.4 | 0.0 | 7.4 | US | 7.4 | 51.9 | 29.6 | 11.1 | 0.0 |
| DS | 11.1 | 7.4 | 55.6 | 7.4 | 18.5 | DS | 18.5 | 11.1 | 48.1 | 11.1 | 11.1 |
| UW | 14.8 | 0.0 | 3.7 | 81.5 | 0.0 | UW | 22.2 | 11.1 | 25.9 | 40.7 | 0.0 |
| DW | 22.2 | 7.4 | 18.5 | 7.4 | 44.4 | DW | 18.5 | 11.1 | 11.1 | 0.0 | 59.3 |
Table 6.
The confusion matrix for classifying the walking environment using only sEMG signals from the individual muscles around the ankle, knee, and MTP joints.
Table 6.
The confusion matrix for classifying the walking environment using only sEMG signals from the individual muscles around the ankle, knee, and MTP joints.
| Flexor | Extensor |
|---|
| | | FGW | US | DS | UW | DW | | | FGW | US | DS | UW | DW |
|---|
| RF | FGW | 74.1 | 18.5 | 0.0 | 3.7 | 3.7 | VL | FGW | 66.7 | 7.4 | 7.4 | 14.8 | 3.7 |
| US | 0.0 | 92.6 | 0.0 | 3.7 | 3.7 | US | 0.0 | 77.8 | 0.0 | 22.2 | 0.0 |
| DS | 0.0 | 3.7 | 55.6 | 29.6 | 11.1 | DS | 3.7 | 0.0 | 55.6 | 7.4 | 33.3 |
| UW | 3.7 | 11.1 | 7.4 | 55.6 | 22.2 | UW | 11.1 | 3.7 | 3.7 | 33.3 | 25.9 |
| DW | 11.1 | 3.7 | 14.8 | 11.1 | 59.3 | DW | 14.8 | 3.7 | 11.1 | 18.5 | 51.9 |
| VM | FGW | 92.6 | 0.0 | 0.0 | 3.7 | 3.7 | ST | FGW | 74.1 | 0.0 | 0.0 | 7.4 | 18.5 |
| US | 0.0 | 77.8 | 0.0 | 22.2 | 3.7 | US | 7.4 | 77.8 | 7.4 | 3.7 | 3.7 |
| DS | 0.0 | 0.0 | 59.3 | 7.4 | 33.3 | DS | 0.0 | 22.2 | 66.7 | 0.0 | 11.1 |
| UW | 11.1 | 14.8 | 0.0 | 59.3 | 14.8 | UW | 3.7 | 7.4 | 0.0 | 88.9 | 0.0 |
| DW | 3.7 | 3.7 | 14.8 | 22.2 | 55.6 | DW | 29.6 | 7.4 | 3.7 | 3.7 | 55.6 |
| BF | FGW | 59.3 | 3.7 | 18.5 | 0.0 | 18.5 | MG | FGW | 85.2 | 0.0 | 0.0 | 11.1 | 3.7 |
| US | 7.4 | 63.0 | 7.4 | 3.7 | 18.5 | US | 3.7 | 96.3 | 0.0 | 0.0 | 0.0 |
| DS | 3.7 | 7.4 | 70.4 | 11.1 | 7.4 | DS | 0.0 | 0.0 | 63.0 | 0.0 | 37.0 |
| UW | 7.4 | 3.7 | 3.7 | 85.2 | 0.0 | UW | 11.1 | 3.7 | 0.0 | 85.2 | 0.0 |
| DW | 7.4 | 14.8 | 14.8 | 7.4 | 55.6 | DW | 14.8 | 0.0 | 7.4 | 0.0 | 77.8 |
| LG | FGW | 70.4 | 3.7 | 7.4 | 14.8 | 3.7 | Sol | FGW | 55.6 | 3.7 | 7.4 | 25.9 | 7.4 |
| US | 7.4 | 88.9 | 0.0 | 0.0 | 3.7 | US | 7.4 | 85.2 | 3.7 | 3.7 | 0.0 |
| DS | 7.4 | 0.0 | 66.7 | 3.7 | 22.2 | DS | 11.1 | 0.0 | 70.4 | 0.0 | 18.5 |
| UW | 7.4 | 0.0 | 3.7 | 88.9 | 0.0 | UW | 14.8 | 3.7 | 3.7 | 74.1 | 3.7 |
| DW | 0.0 | 0.0 | 25.9 | 3.7 | 70.4 | DW | 14.8 | 3.7 | 22.2 | 3.7 | 55.6 |
| TA | FGW | 59.3 | 11.1 | 0.0 | 11.1 | 18.5 | FHL | FGW | 74.1 | 0.0 | 0.0 | 11.1 | 14.8 |
| US | 3.7 | 48.1 | 29.6 | 3.7 | 14.8 | US | 3.7 | 81.5 | 7.4 | 0.0 | 7.4 |
| DS | 0.0 | 3.7 | 81.5 | 3.7 | 11.1 | DS | 11.1 | 7.4 | 55.6 | 7.4 | 18.5 |
| UW | 14.8 | 14.8 | 7.4 | 59.3 | 3.7 | UW | 14.8 | 0.0 | 3.7 | 81.5 | 0.0 |
| DW | 7.4 | 11.1 | 7.4 | 7.4 | 66.7 | DW | 22.2 | 7.4 | 18.5 | 7.4 | 44.4 |
| EDL | FGW | 25.9 | 11.1 | 11.1 | 14.8 | 37.0 | | | | | | | |
| US | 7.4 | 51.9 | 29.6 | 11.1 | 0.0 | | | | | | | |
| DS | 18.5 | 11.1 | 48.1 | 11.1 | 11.1 | | | | | | | |
| UW | 22.2 | 11.1 | 25.9 | 40.7 | 0.0 | | | | | | | |
| DW | 18.5 | 11.1 | 11.1 | 0.0 | 59.3 | | | | | | | |


