
Multitemporal Mapping of Post-Fire Land Cover Using Multiplatform PRISMA Hyperspectral and Sentinel-UAV Multispectral Data: Insights from Case Studies in Portugal and Italy


Abstract
1. Introduction
1.1. Limitatons of Field Method
1.2. Sensing Platforms for the Mapping of Burned Areas
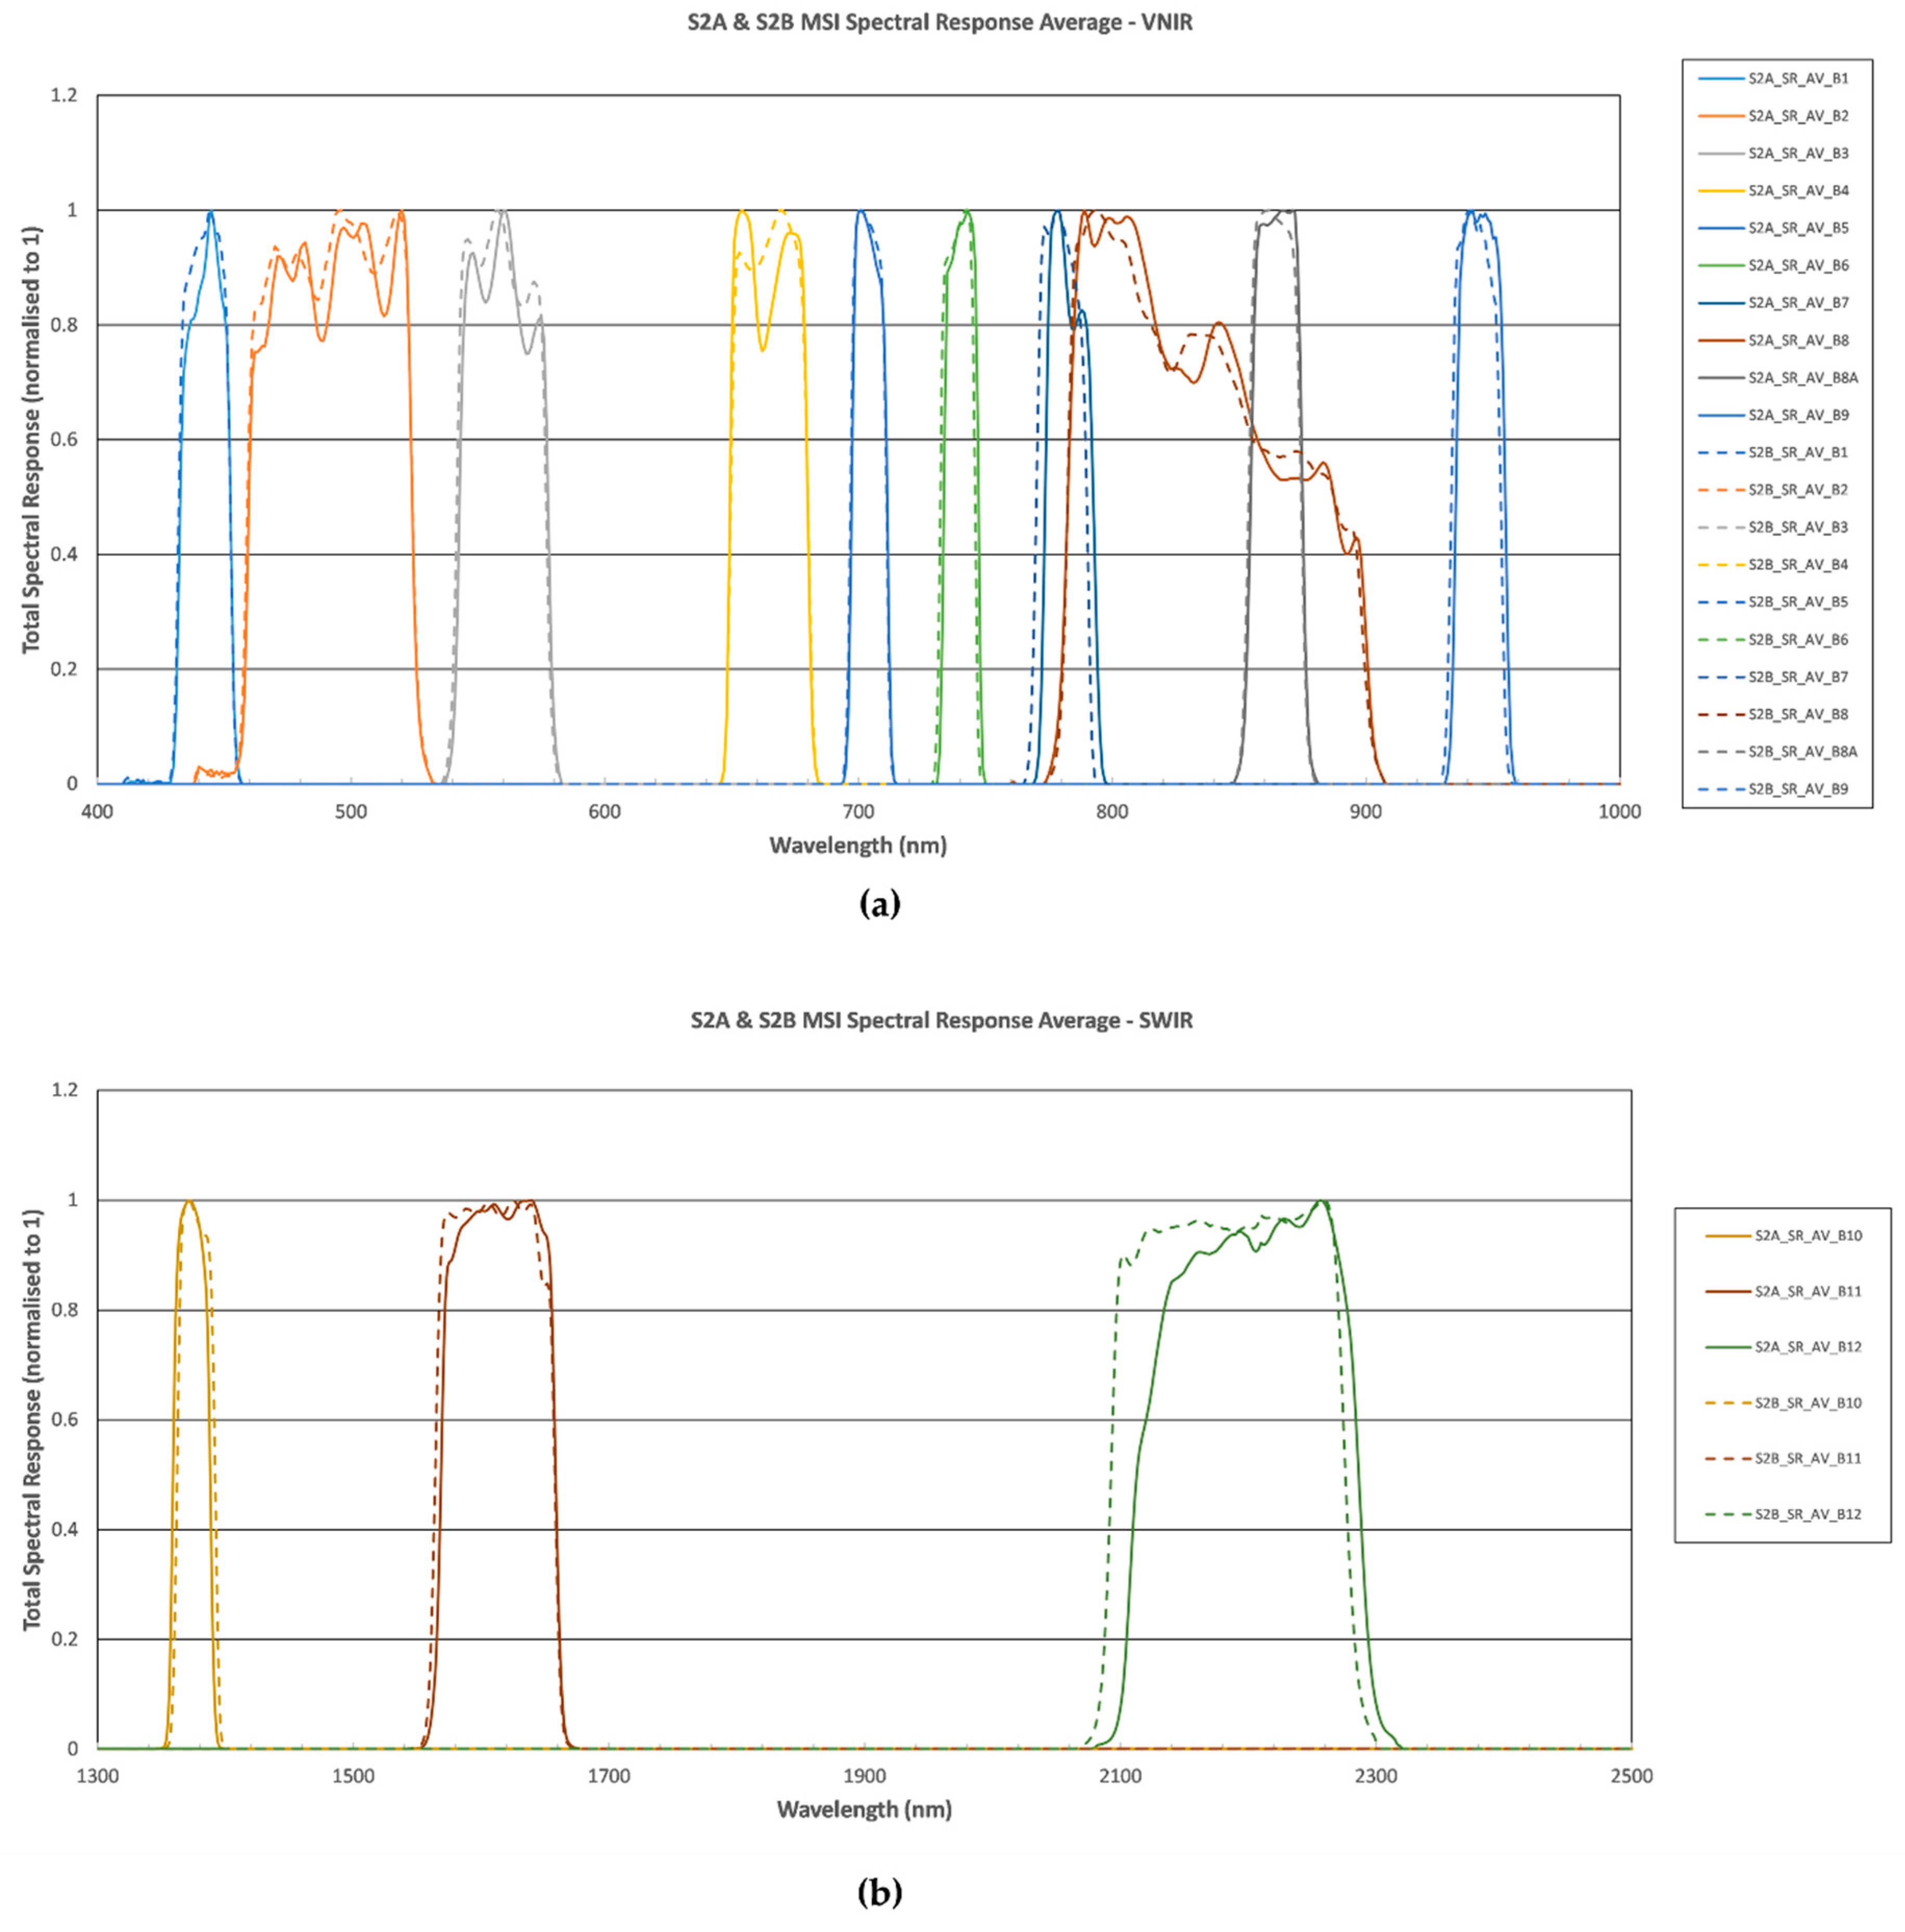
1.2.1. Sentinel-2 Platform
1.2.2. Prisma Platform
1.2.3. UAV Platform
1.3. The Advantages and Development of Remote Sensing Methods
2. Burned Area Mapping and Vegetation Indices
2.1. Burned Area Indices
2.2. Vegetation Indices
3. Materials and Methods
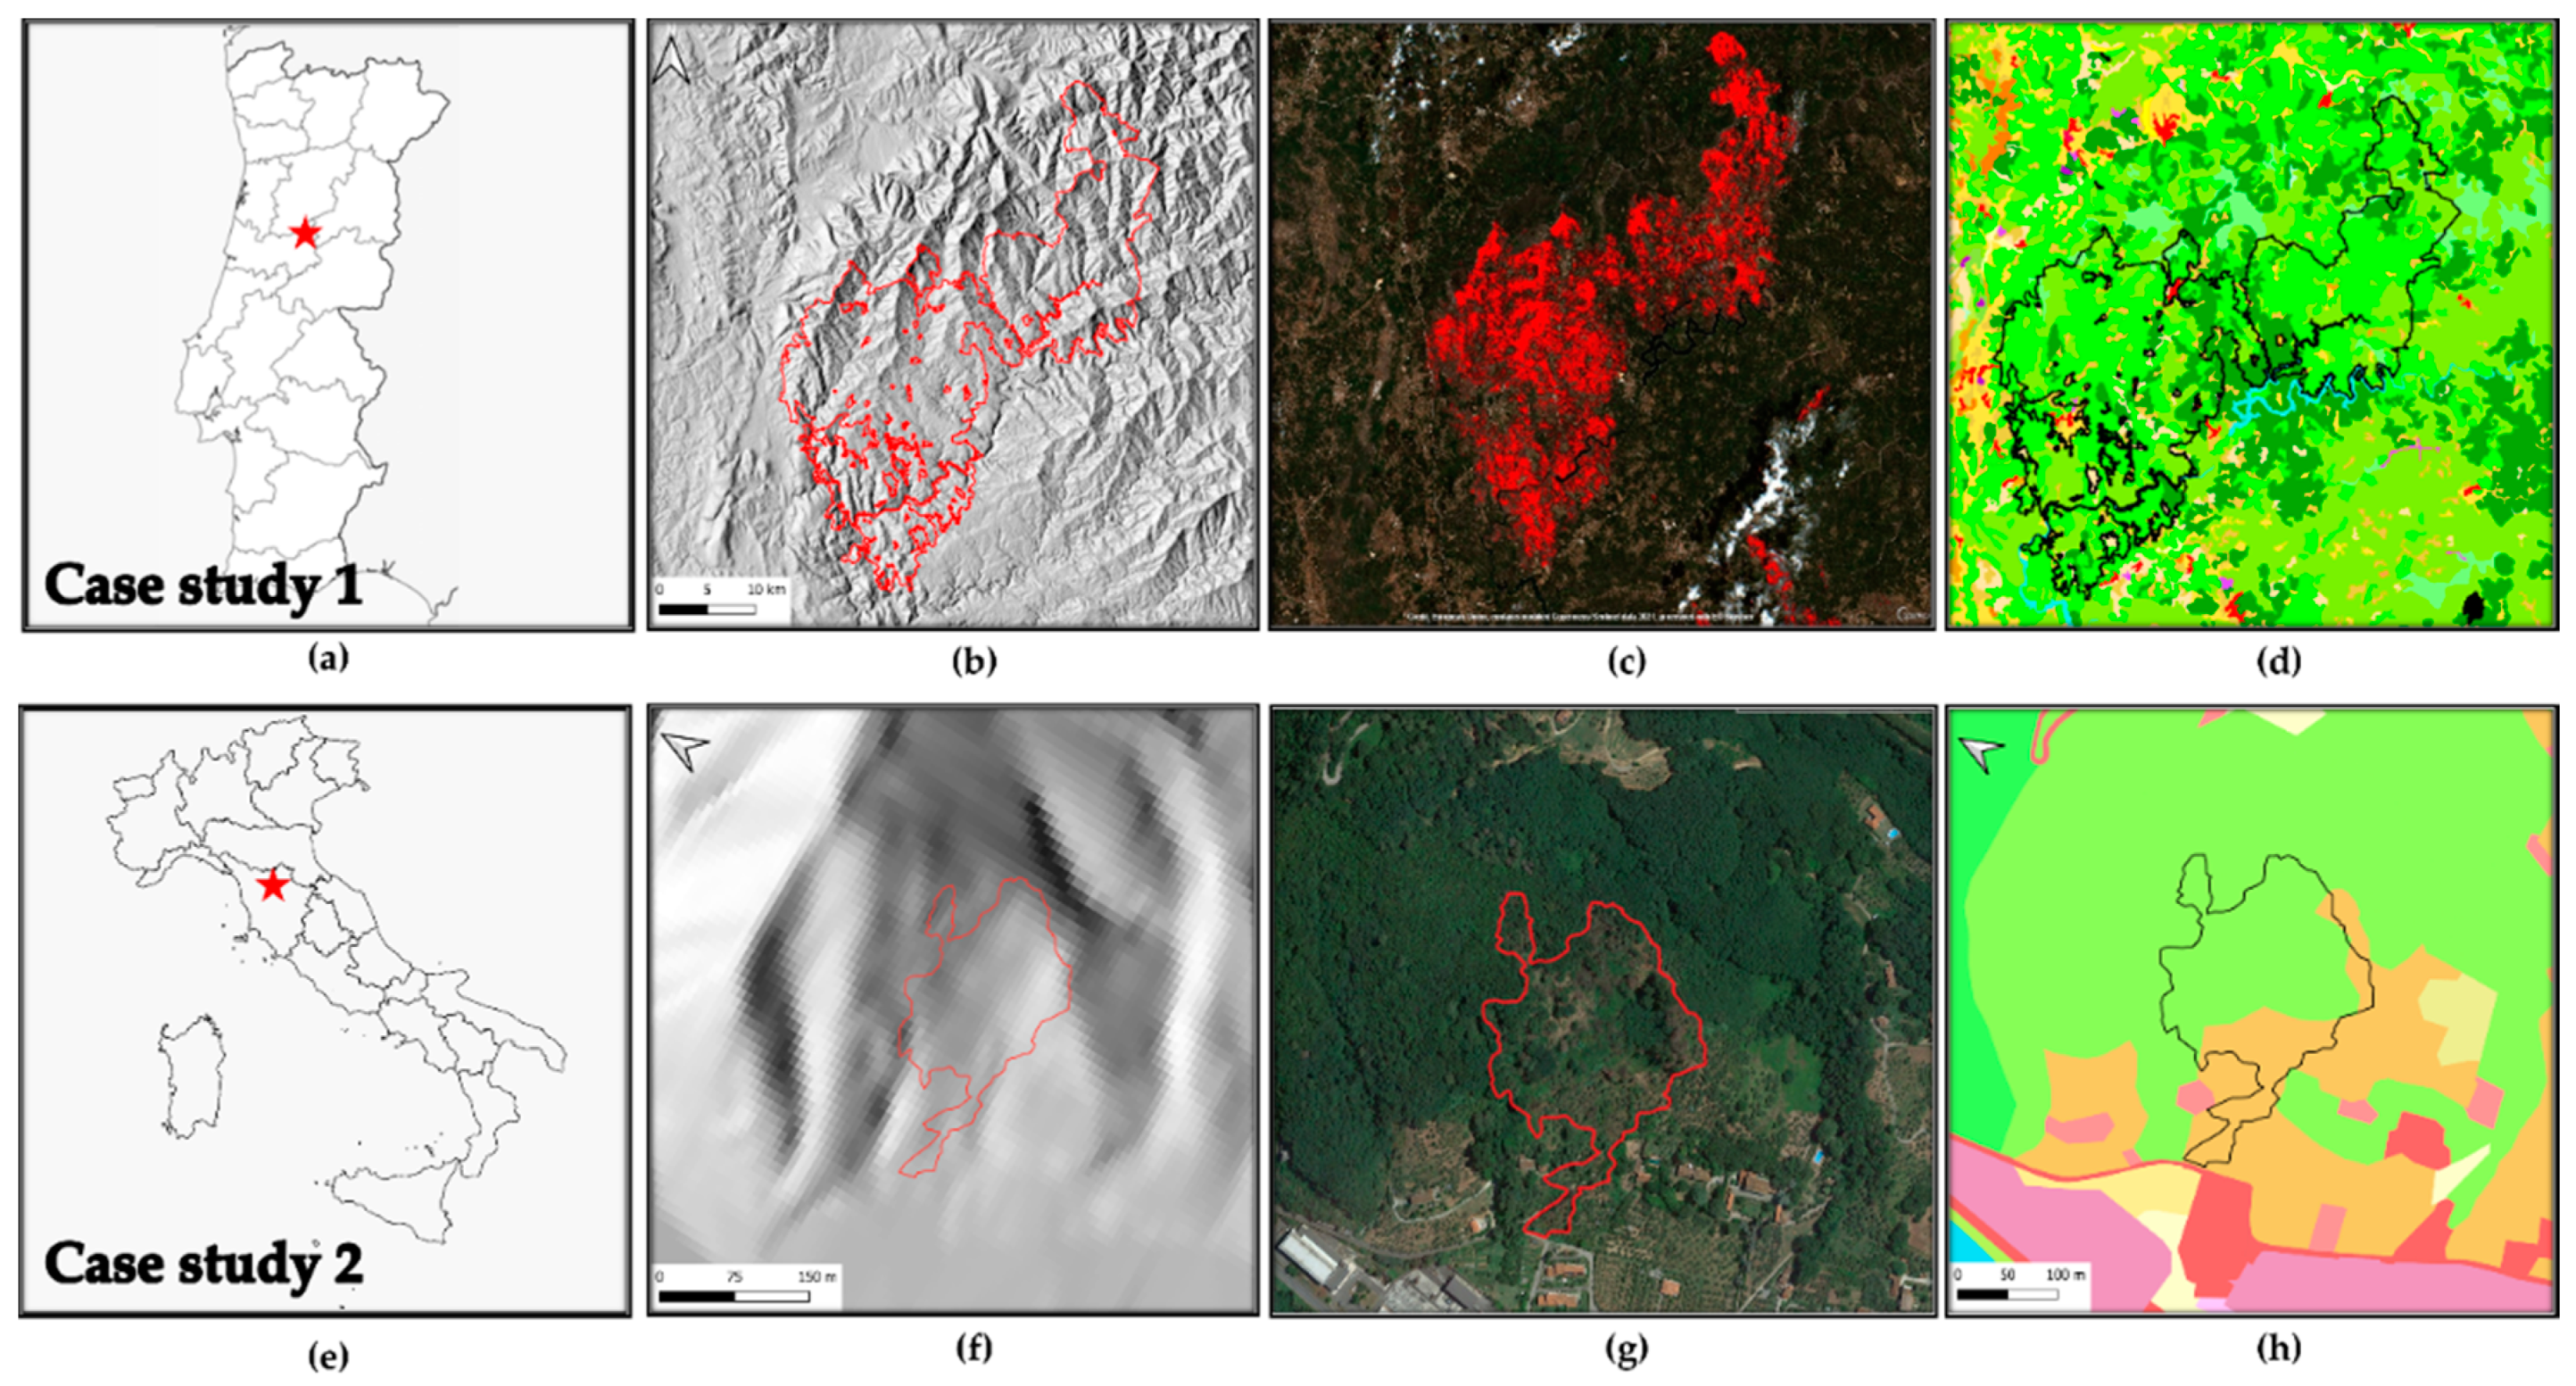
3.1. Case Studies
3.1.1. Castanheira de Pêra Fire—Study Site 1
3.1.2. Vinchiana Fire—Study Site 2
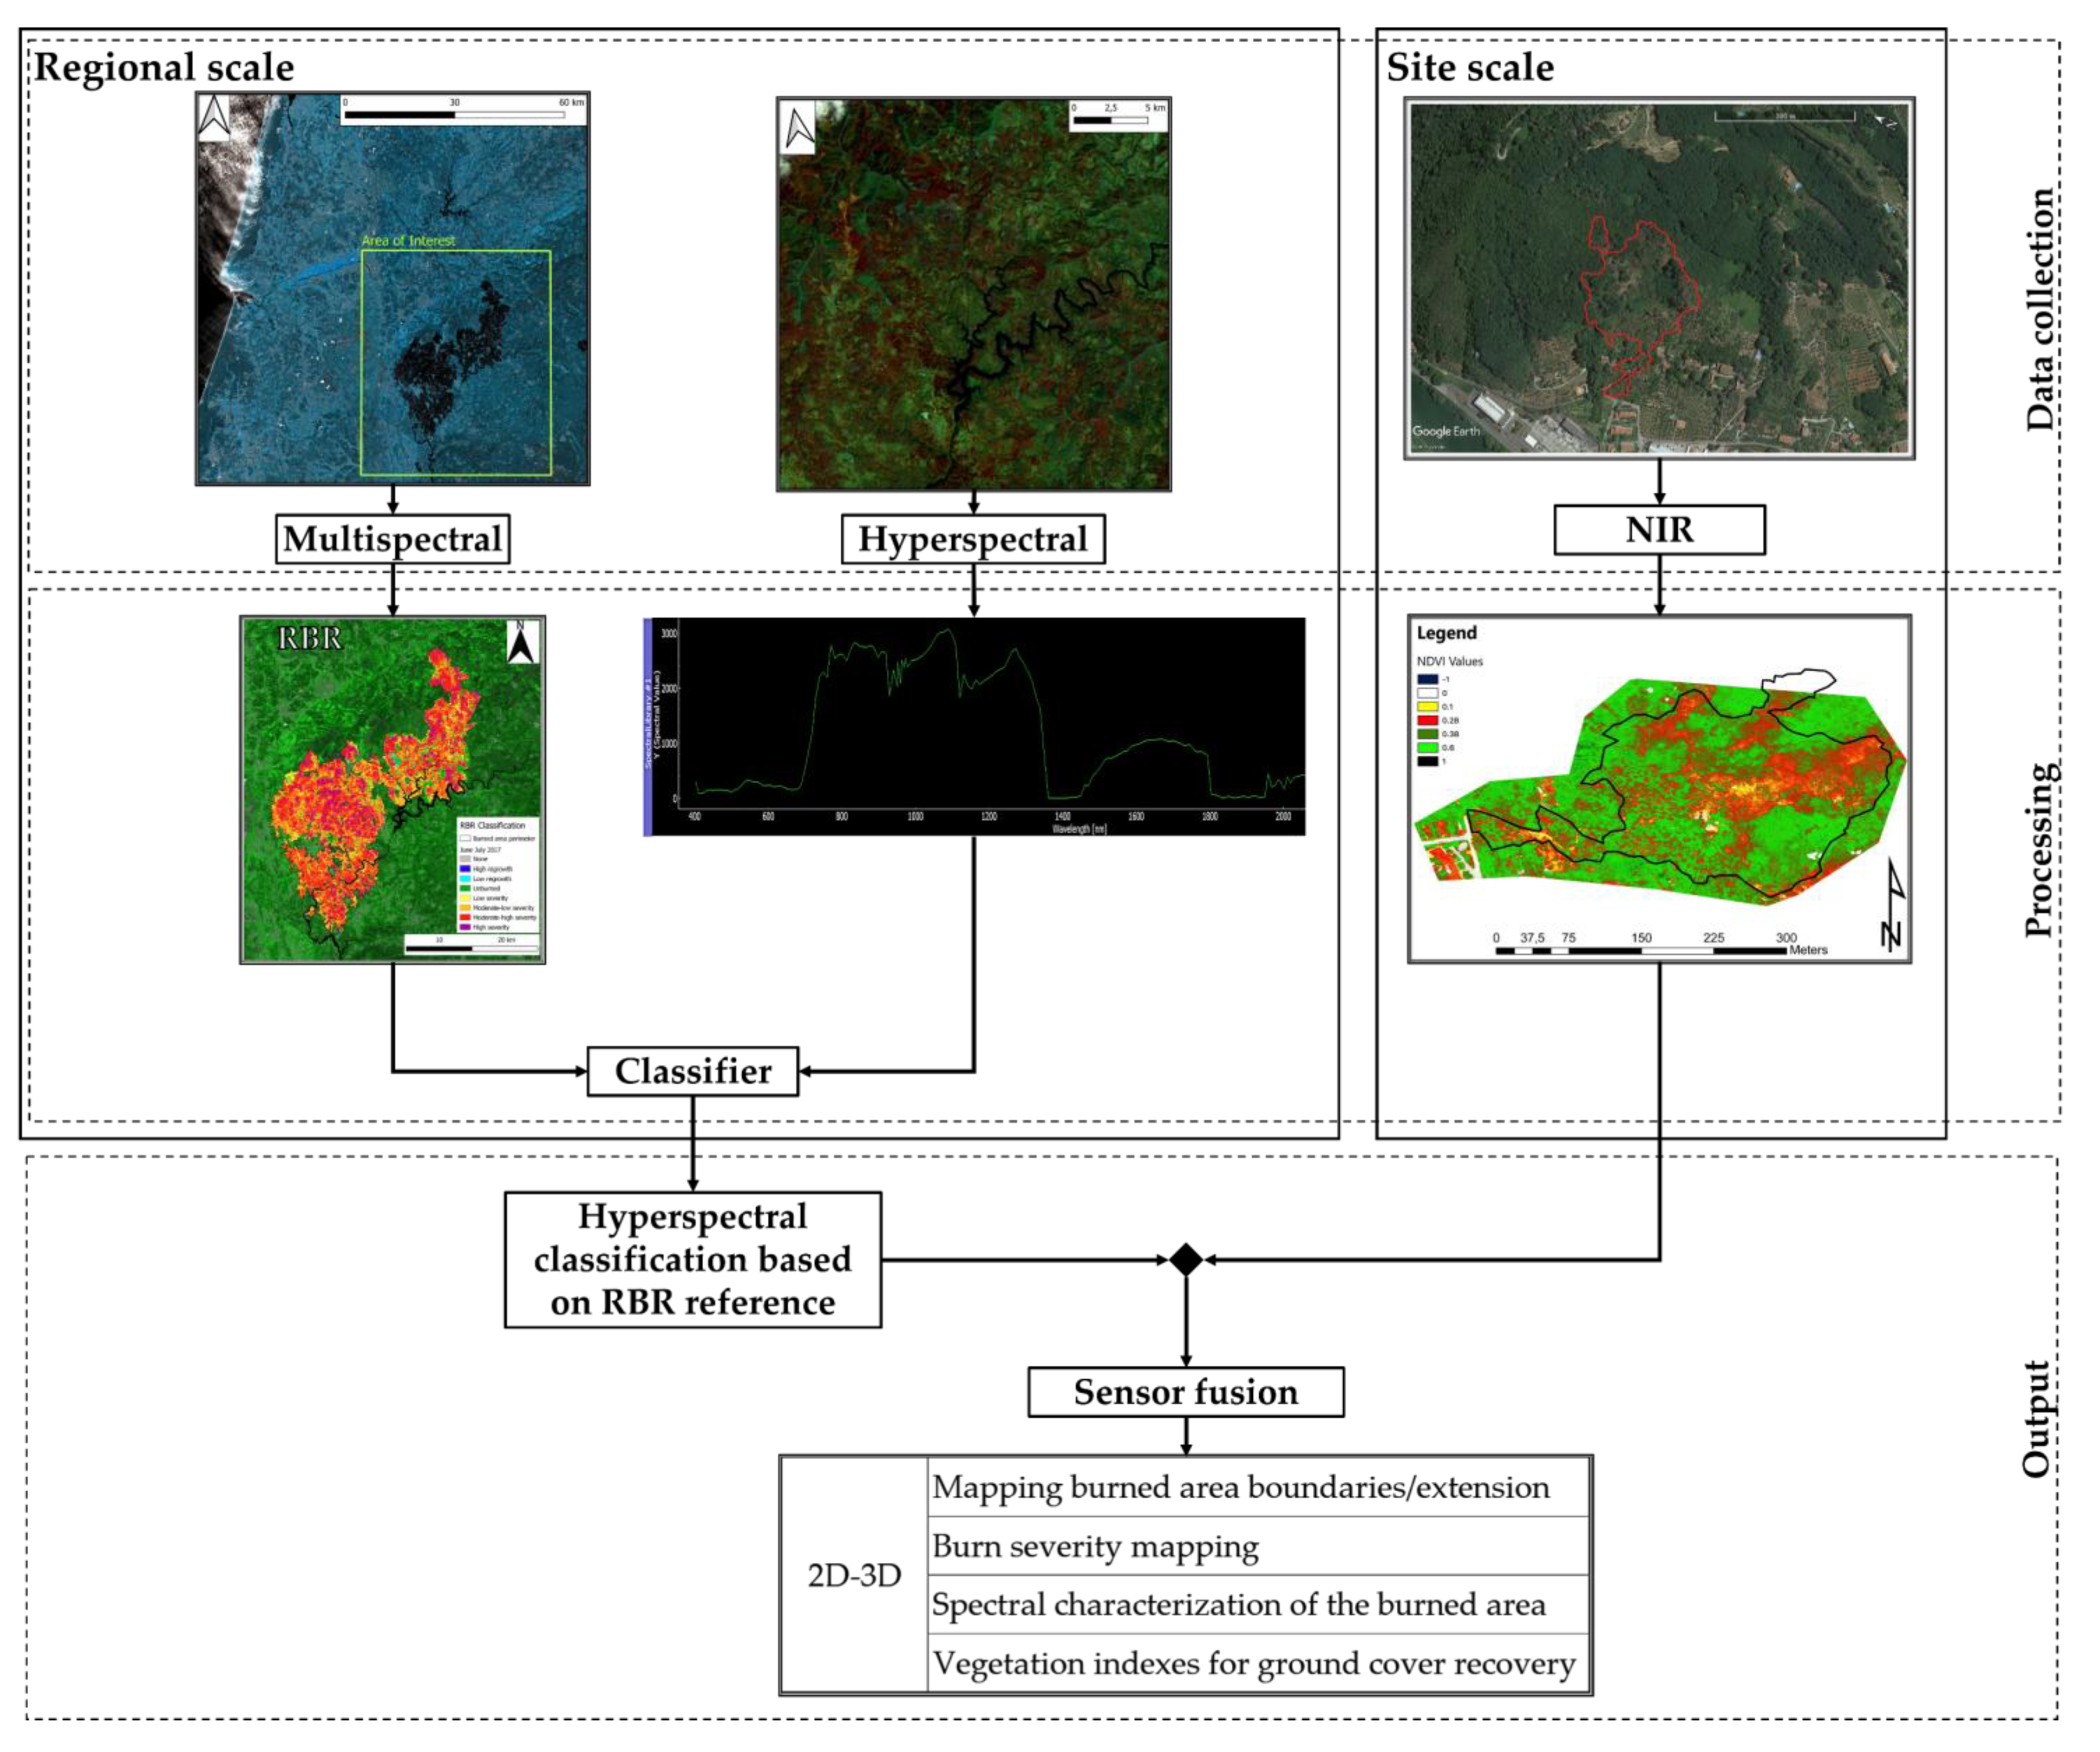
4. Methodological Approach
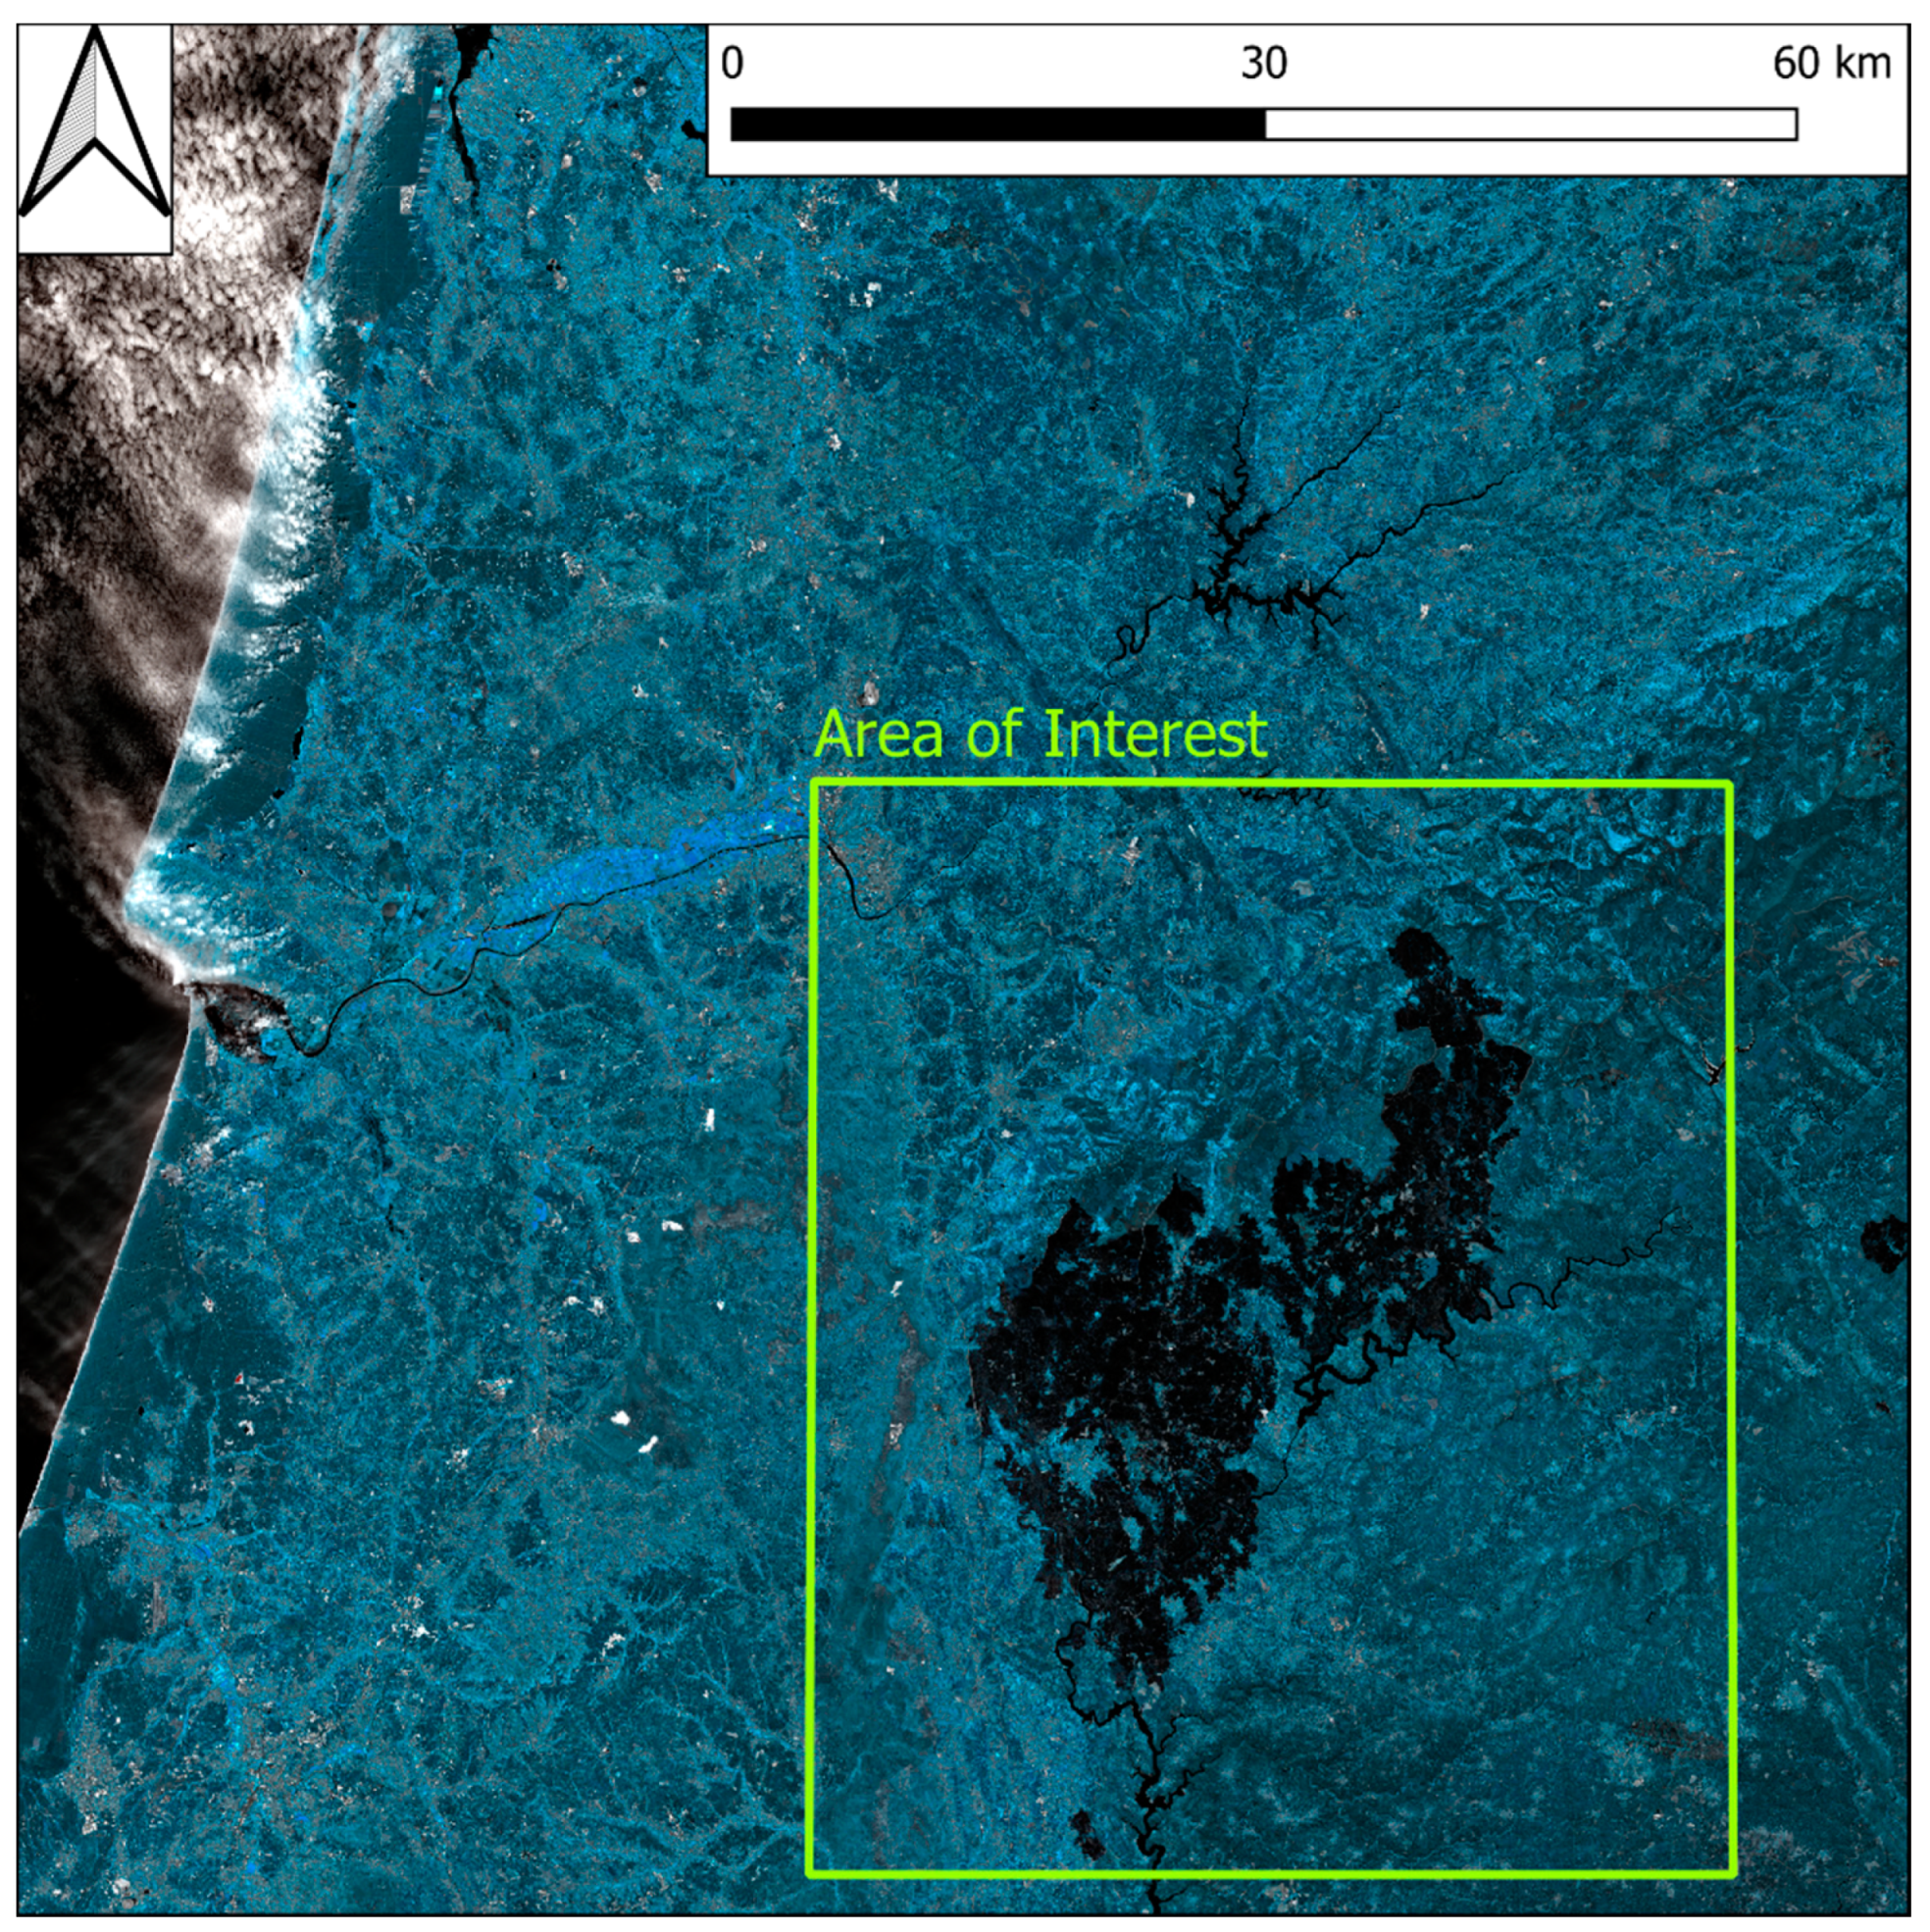
4.1. Study Site 1
4.1.1. Relativized Burn Ratio (RBR) Computation
- Creation and subtraction to the acquisition of a layer constituted by the pixels classified as clouds and cirrus by Sentinel-2 preprocessed metadata;
- Resampling of the bands to homogenize the spatial resolution to 10 m;
- Computation of NBR index for each image as it is needed for RBR index computation:
- Computation of the normalized difference water index (NDWI) [79] to reduce the noise arising from water bodies light scattering and subtraction from the images. The computation of this index was performed in the optic of improving the data quality or further RBR index computation:
- Computation of the dNBR index via subtraction among two adjacent acquisitions starting with the pre-fire image (couplets, Table 3):
- Computation of the relativized burn ration (RBR) for each couplet:
4.1.2. Biophysical Parameters Computation
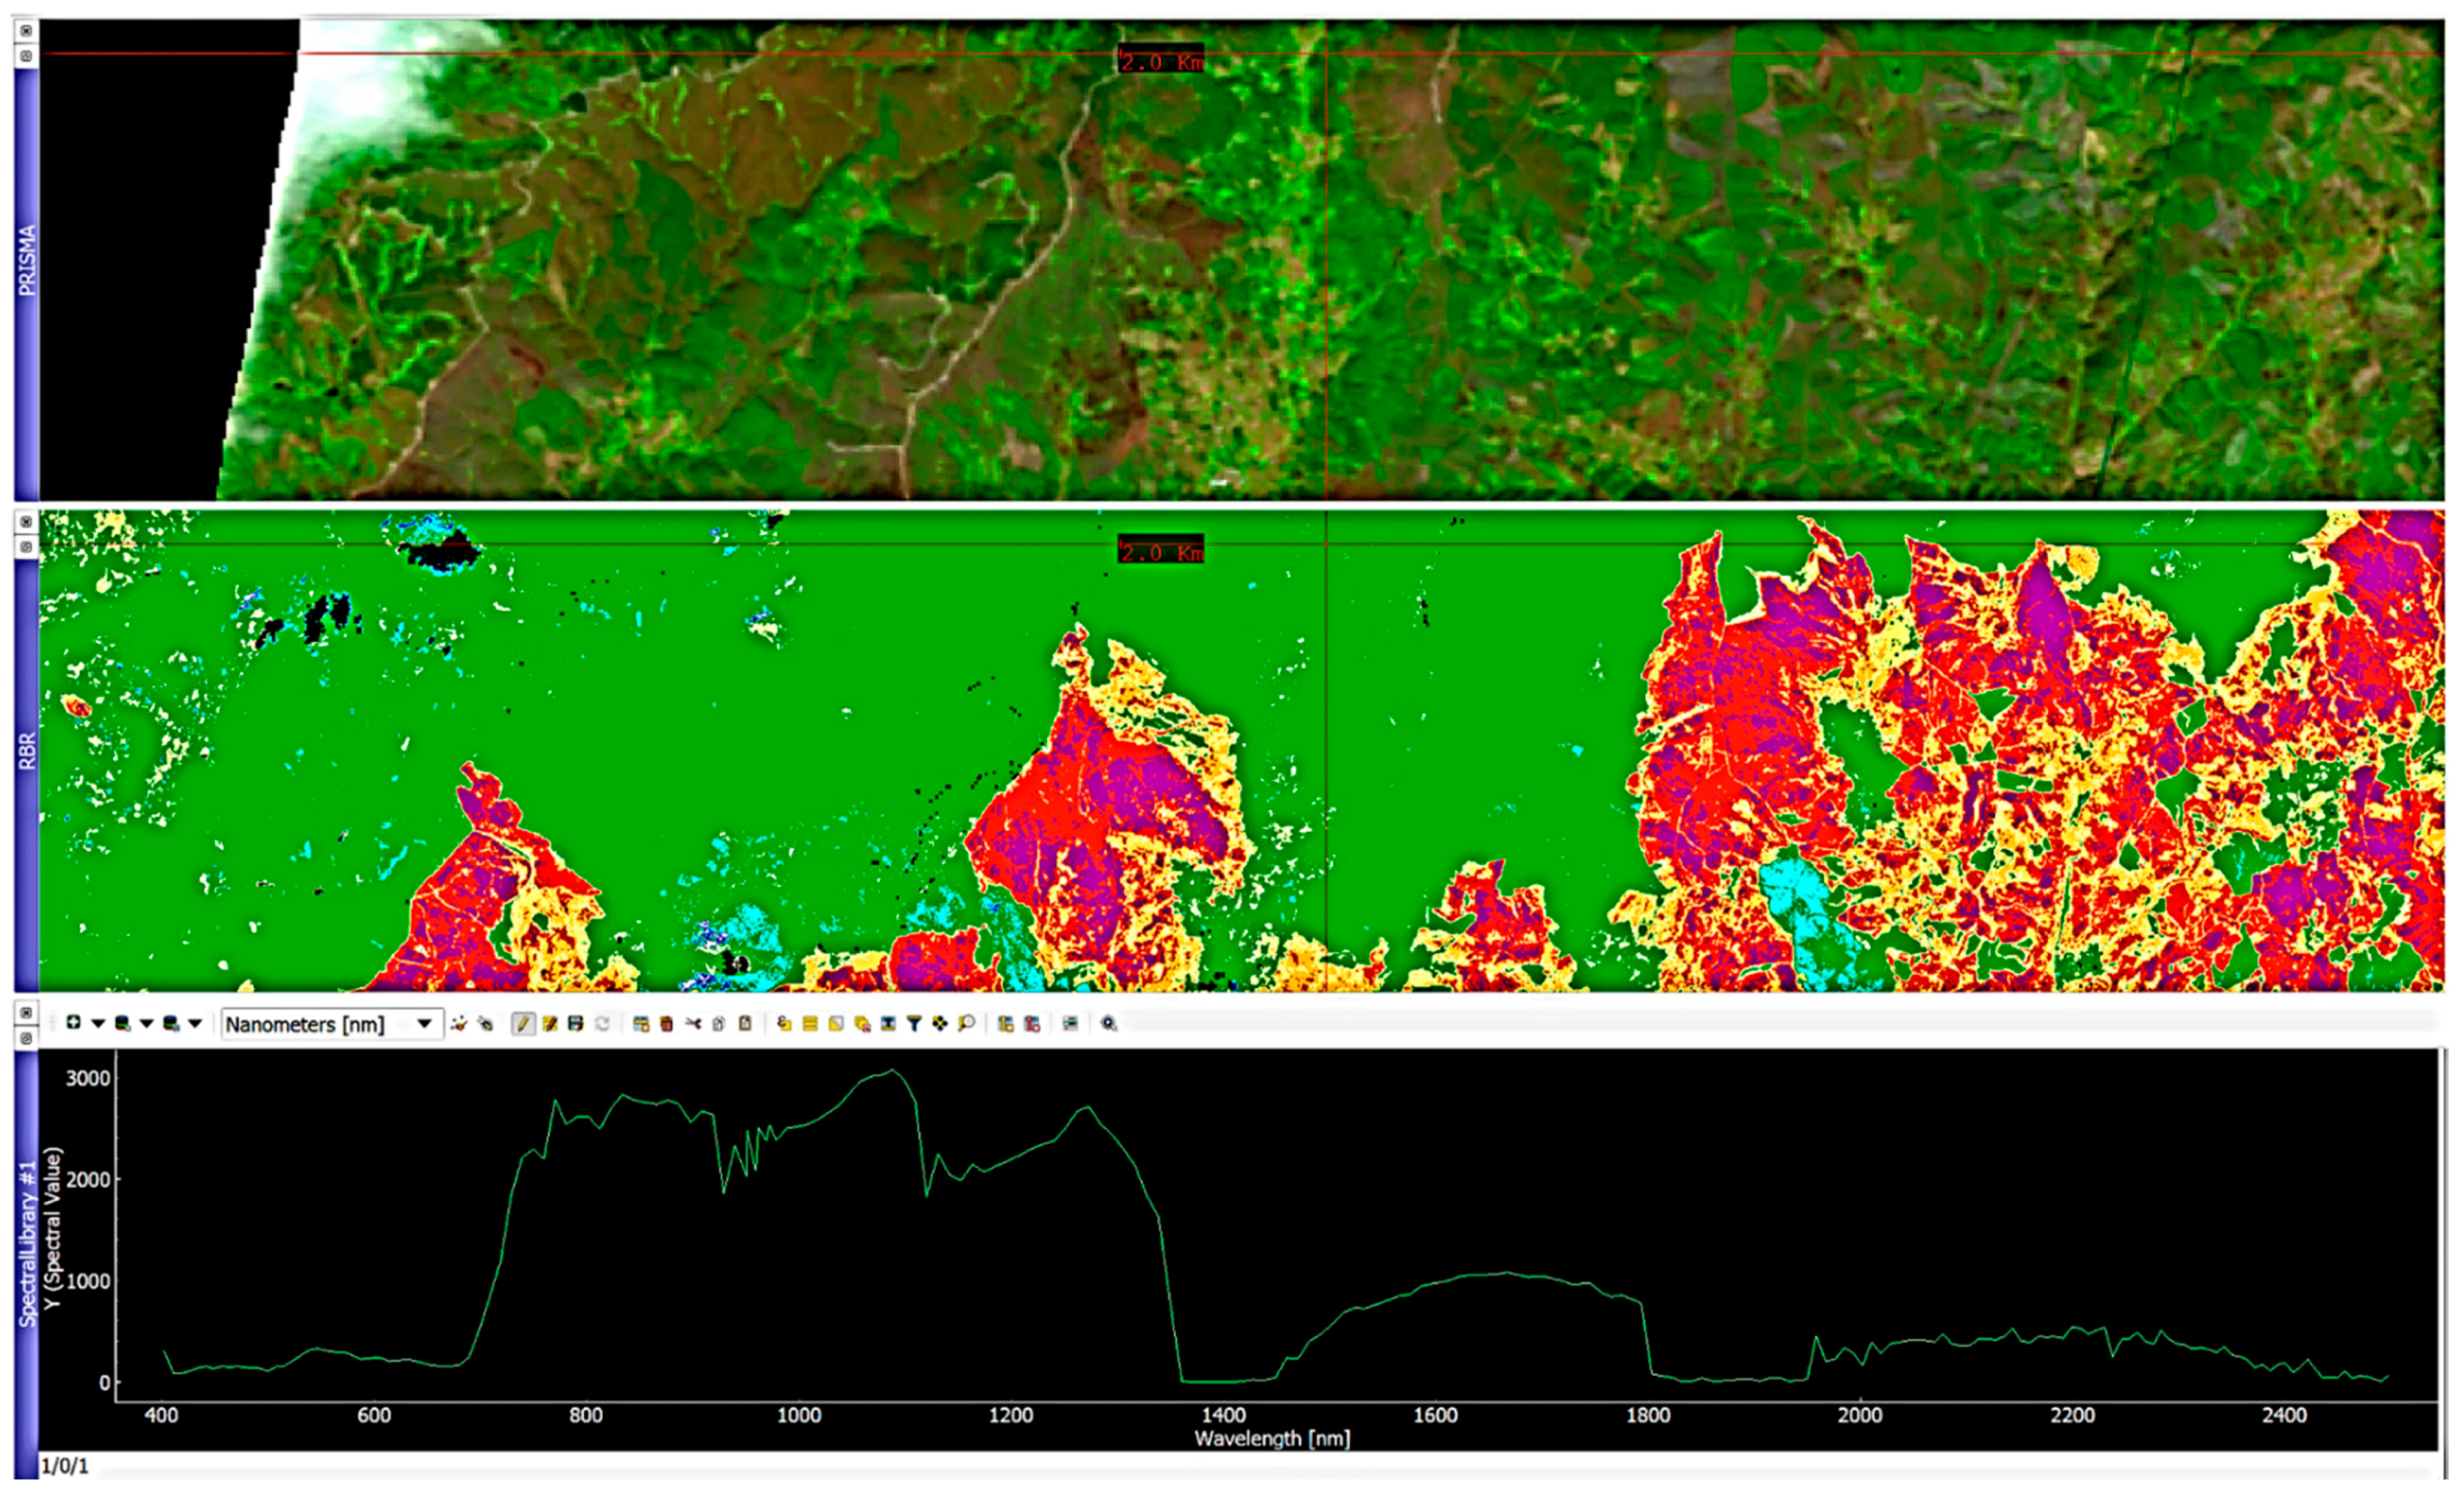
4.1.3. Hyperspectral Burned Scar Detection Assessment
4.2. Study Site 2
UAV NDVI Burned Area Mapping
5. Results
5.1. Study Site 1
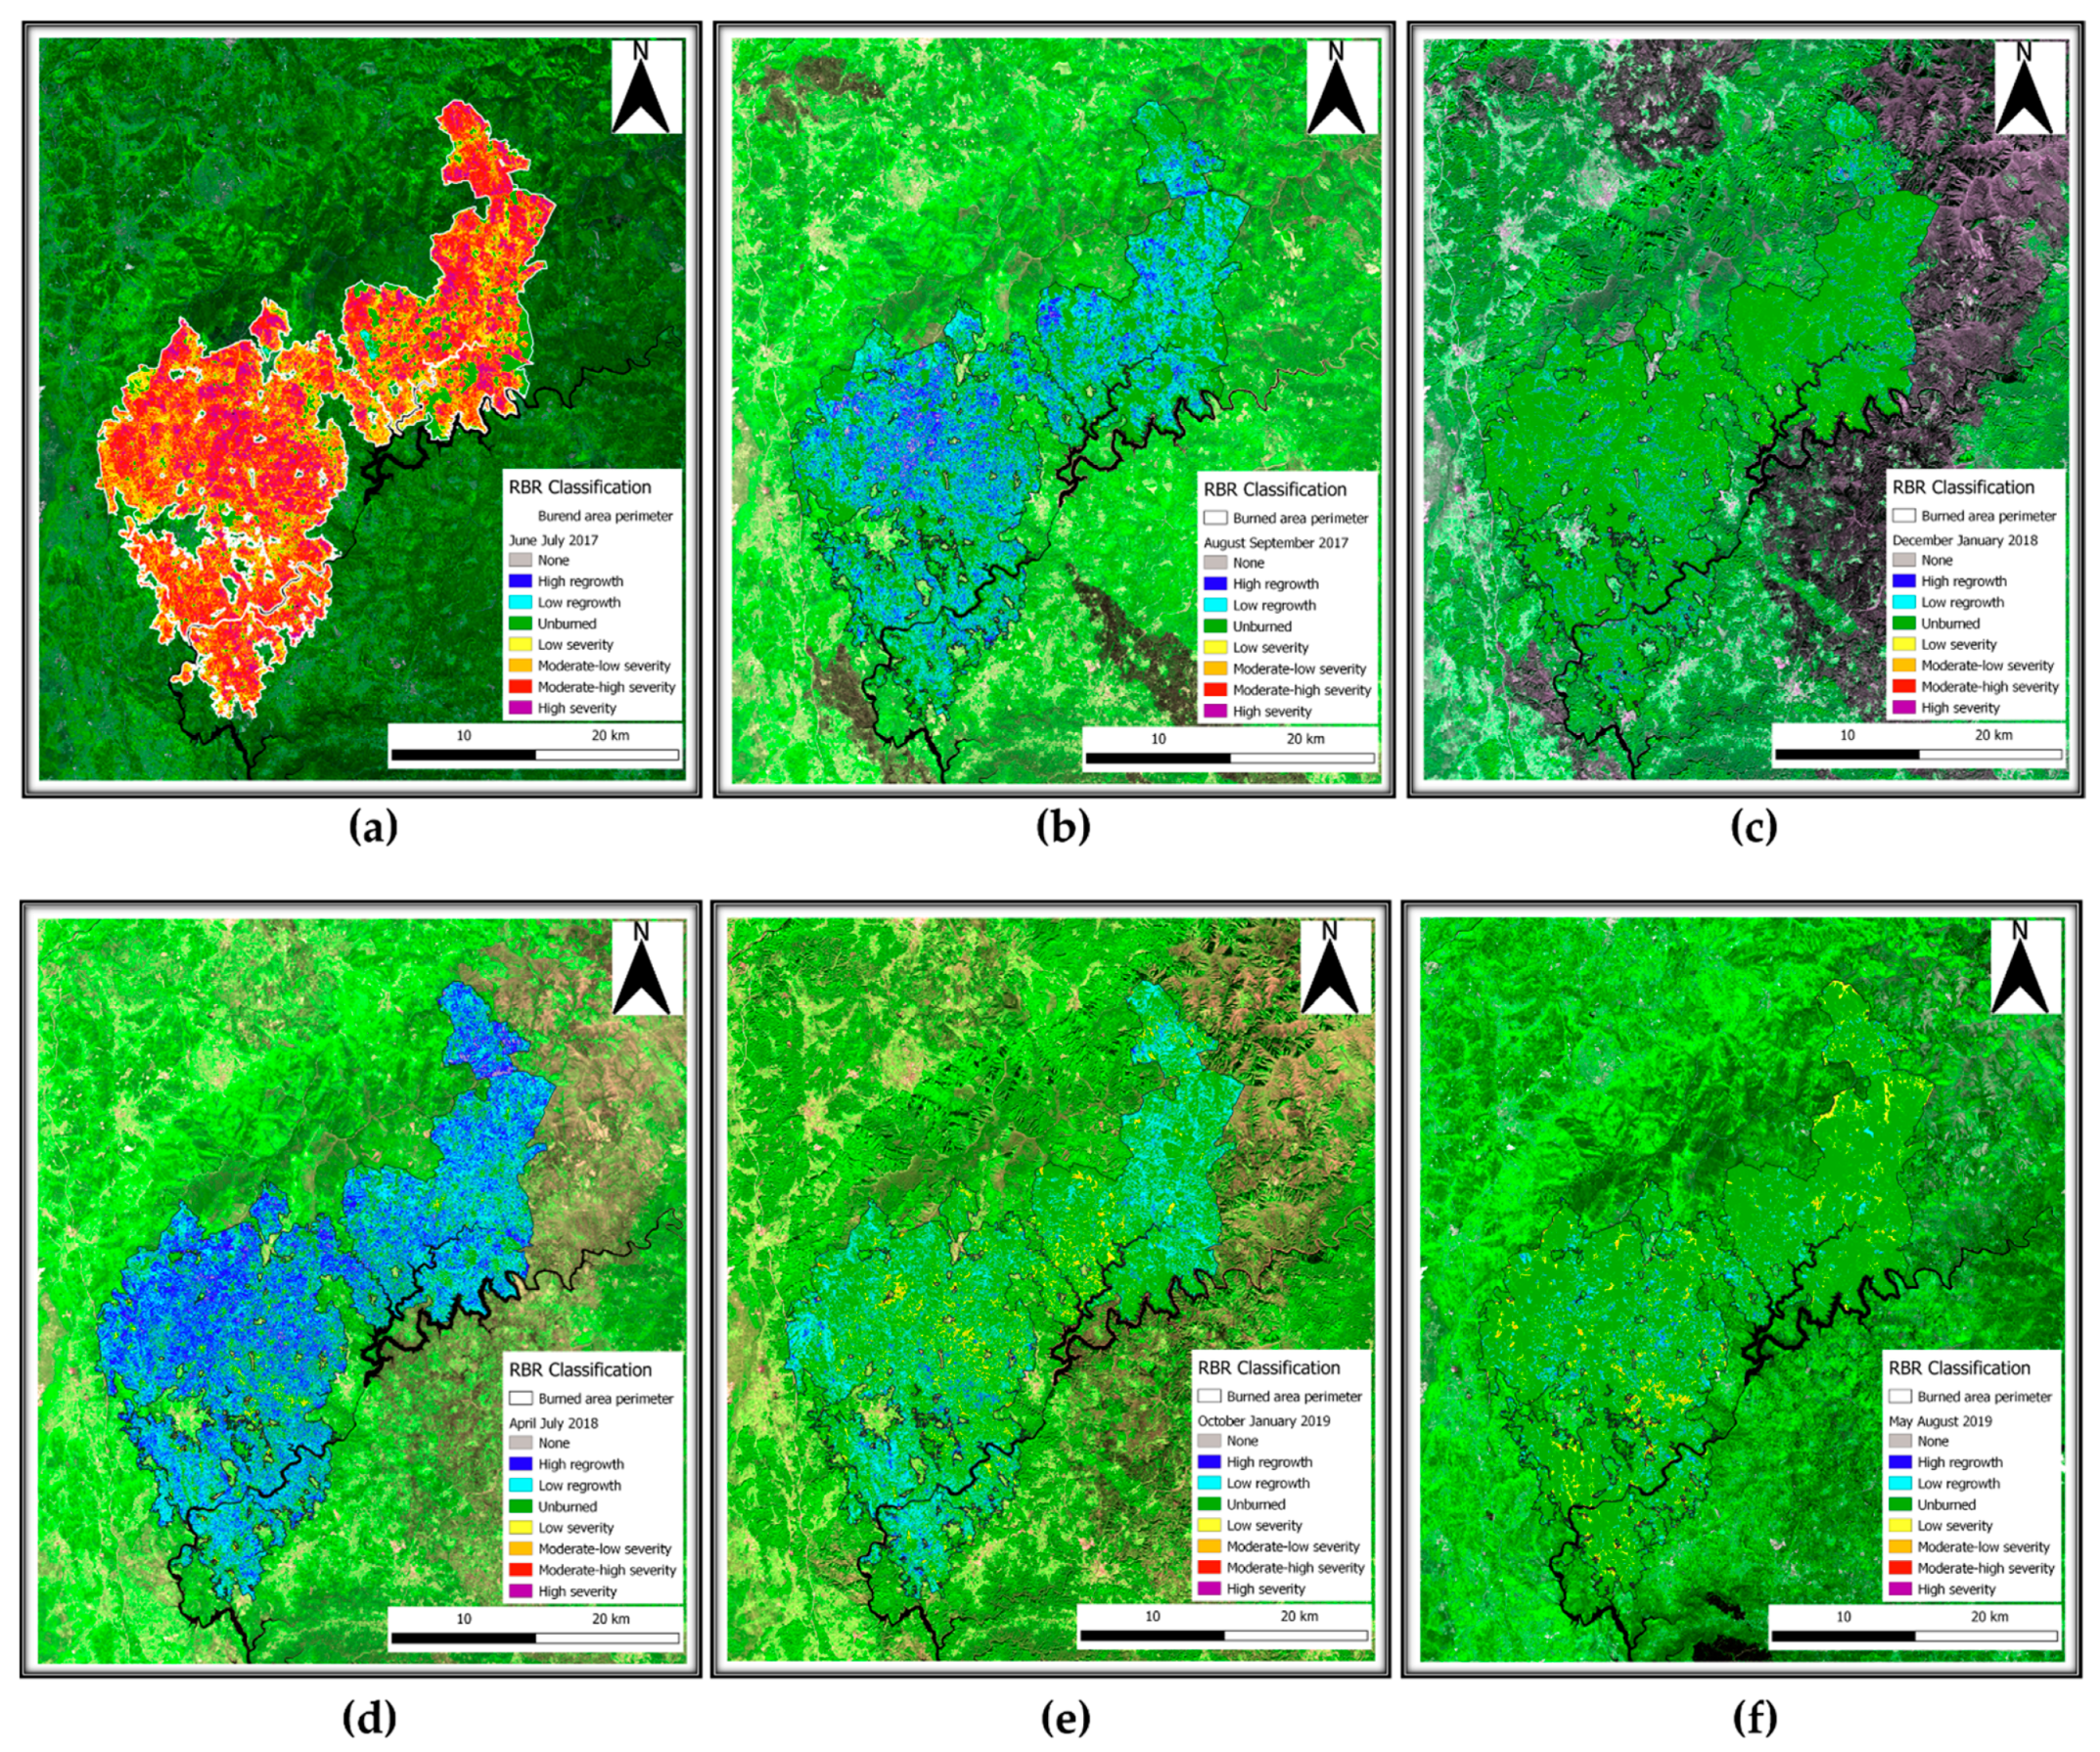
5.1.1. Relativized Burn Ratio (RBR) Computation
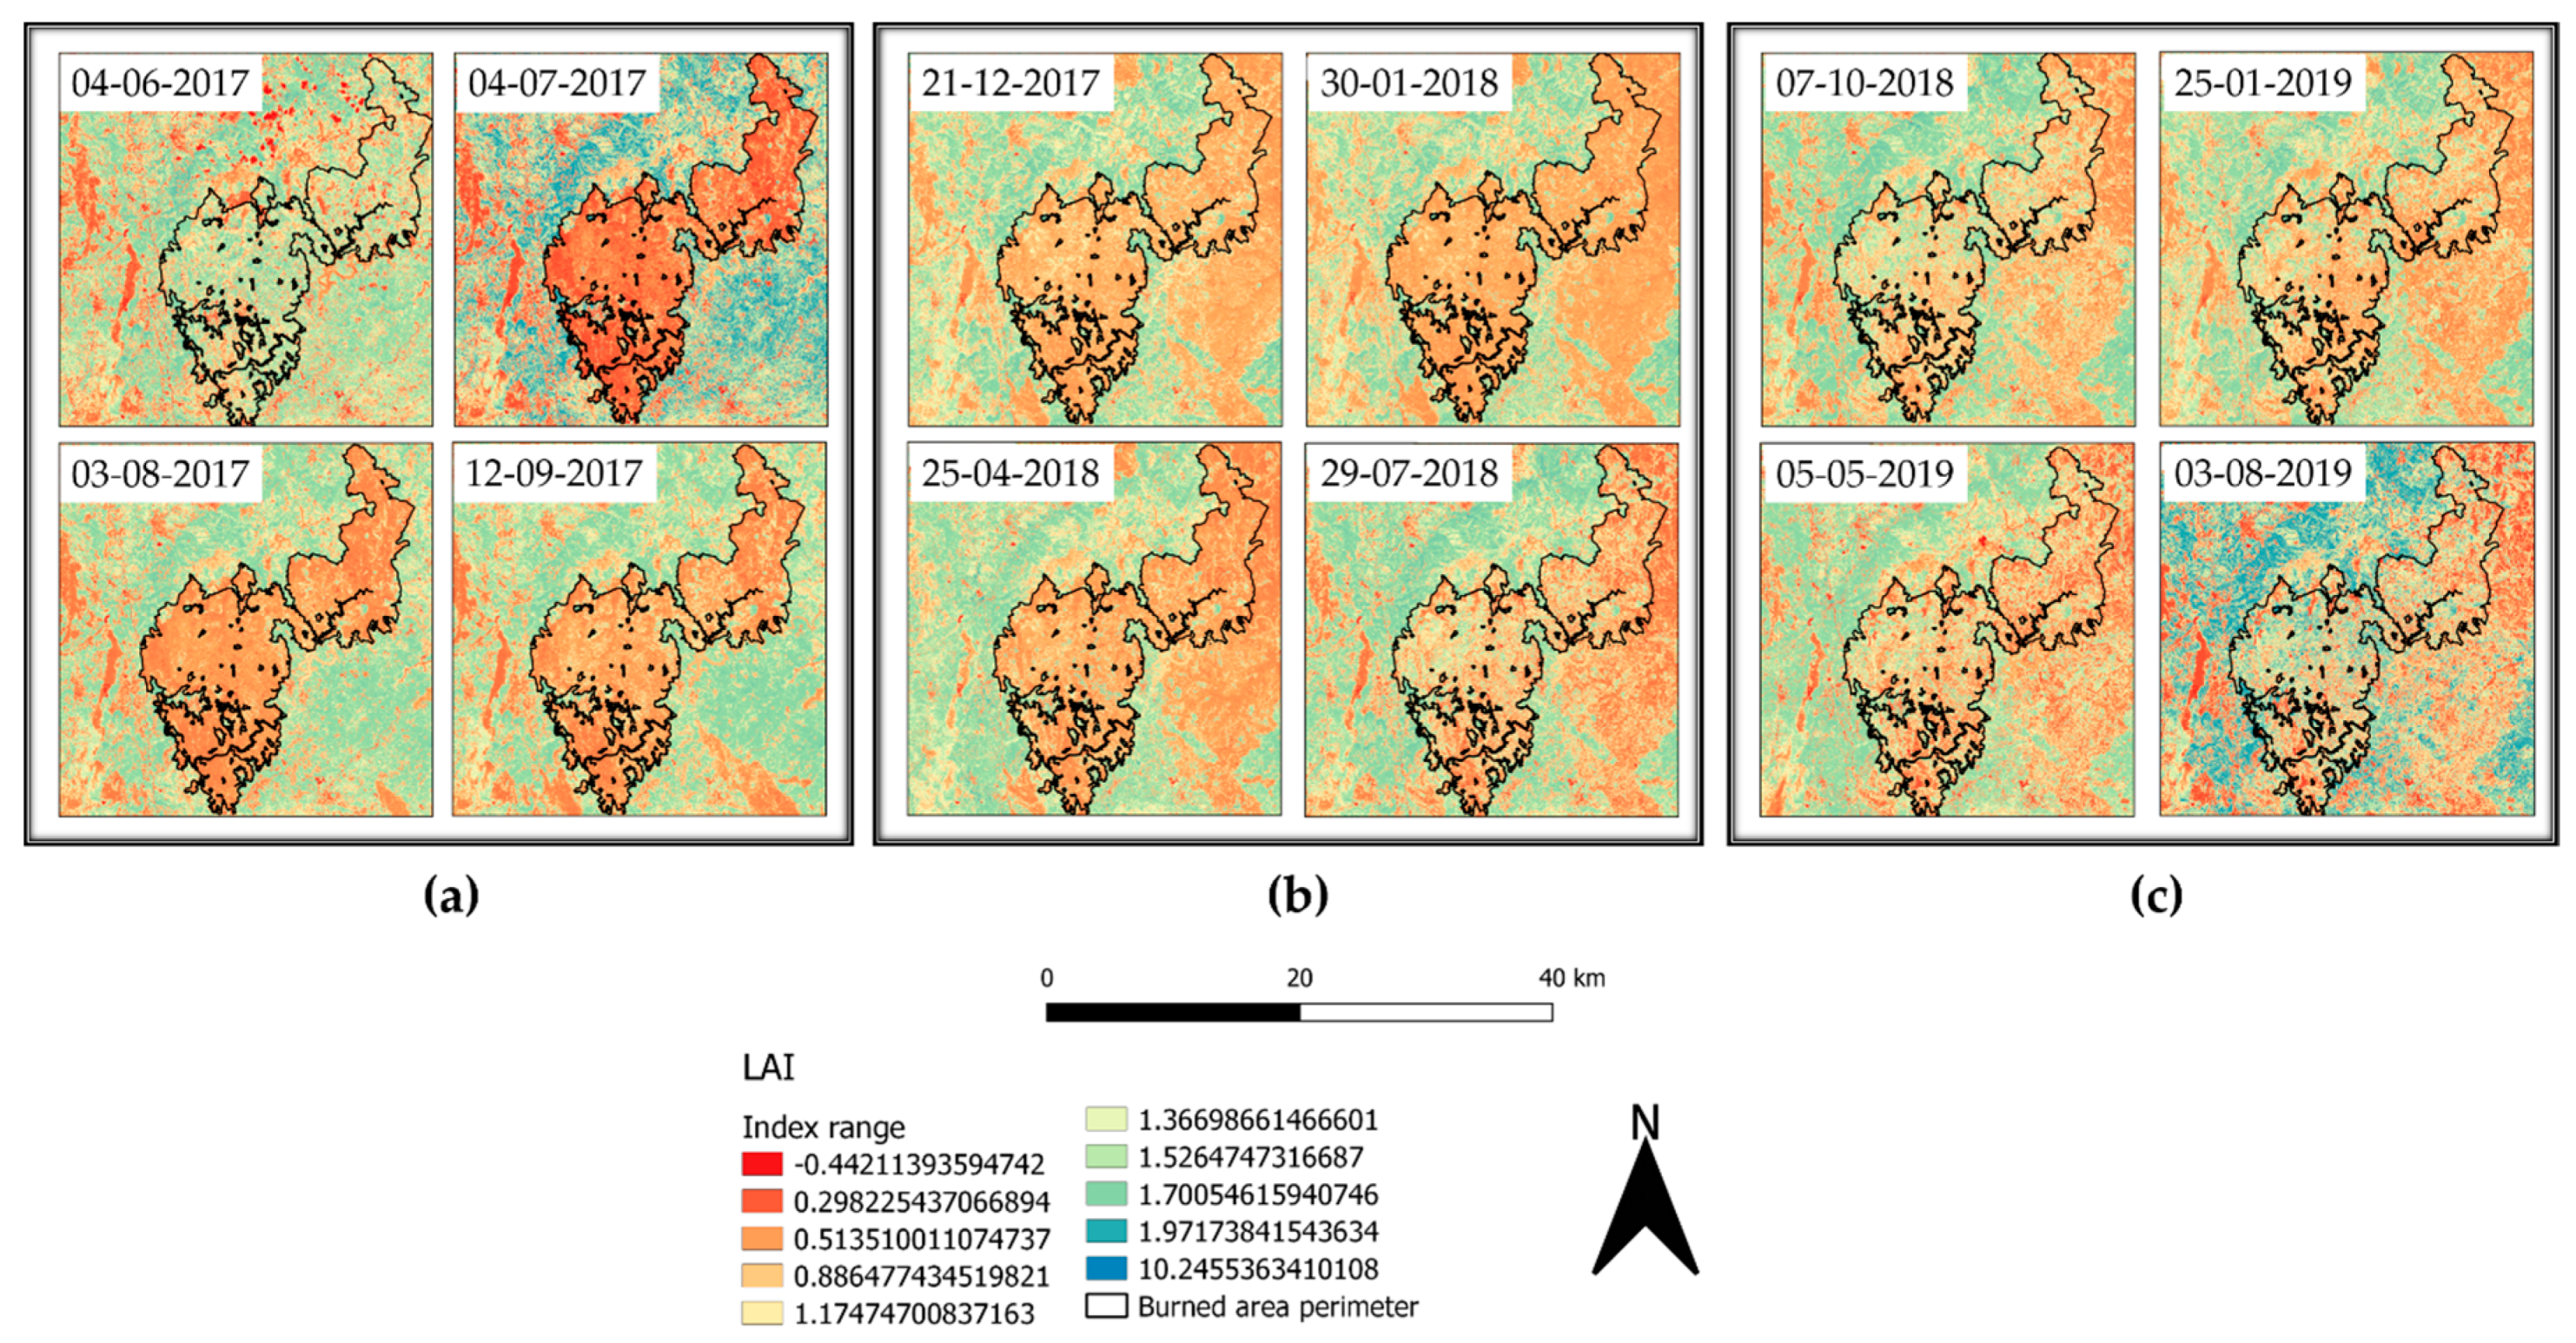
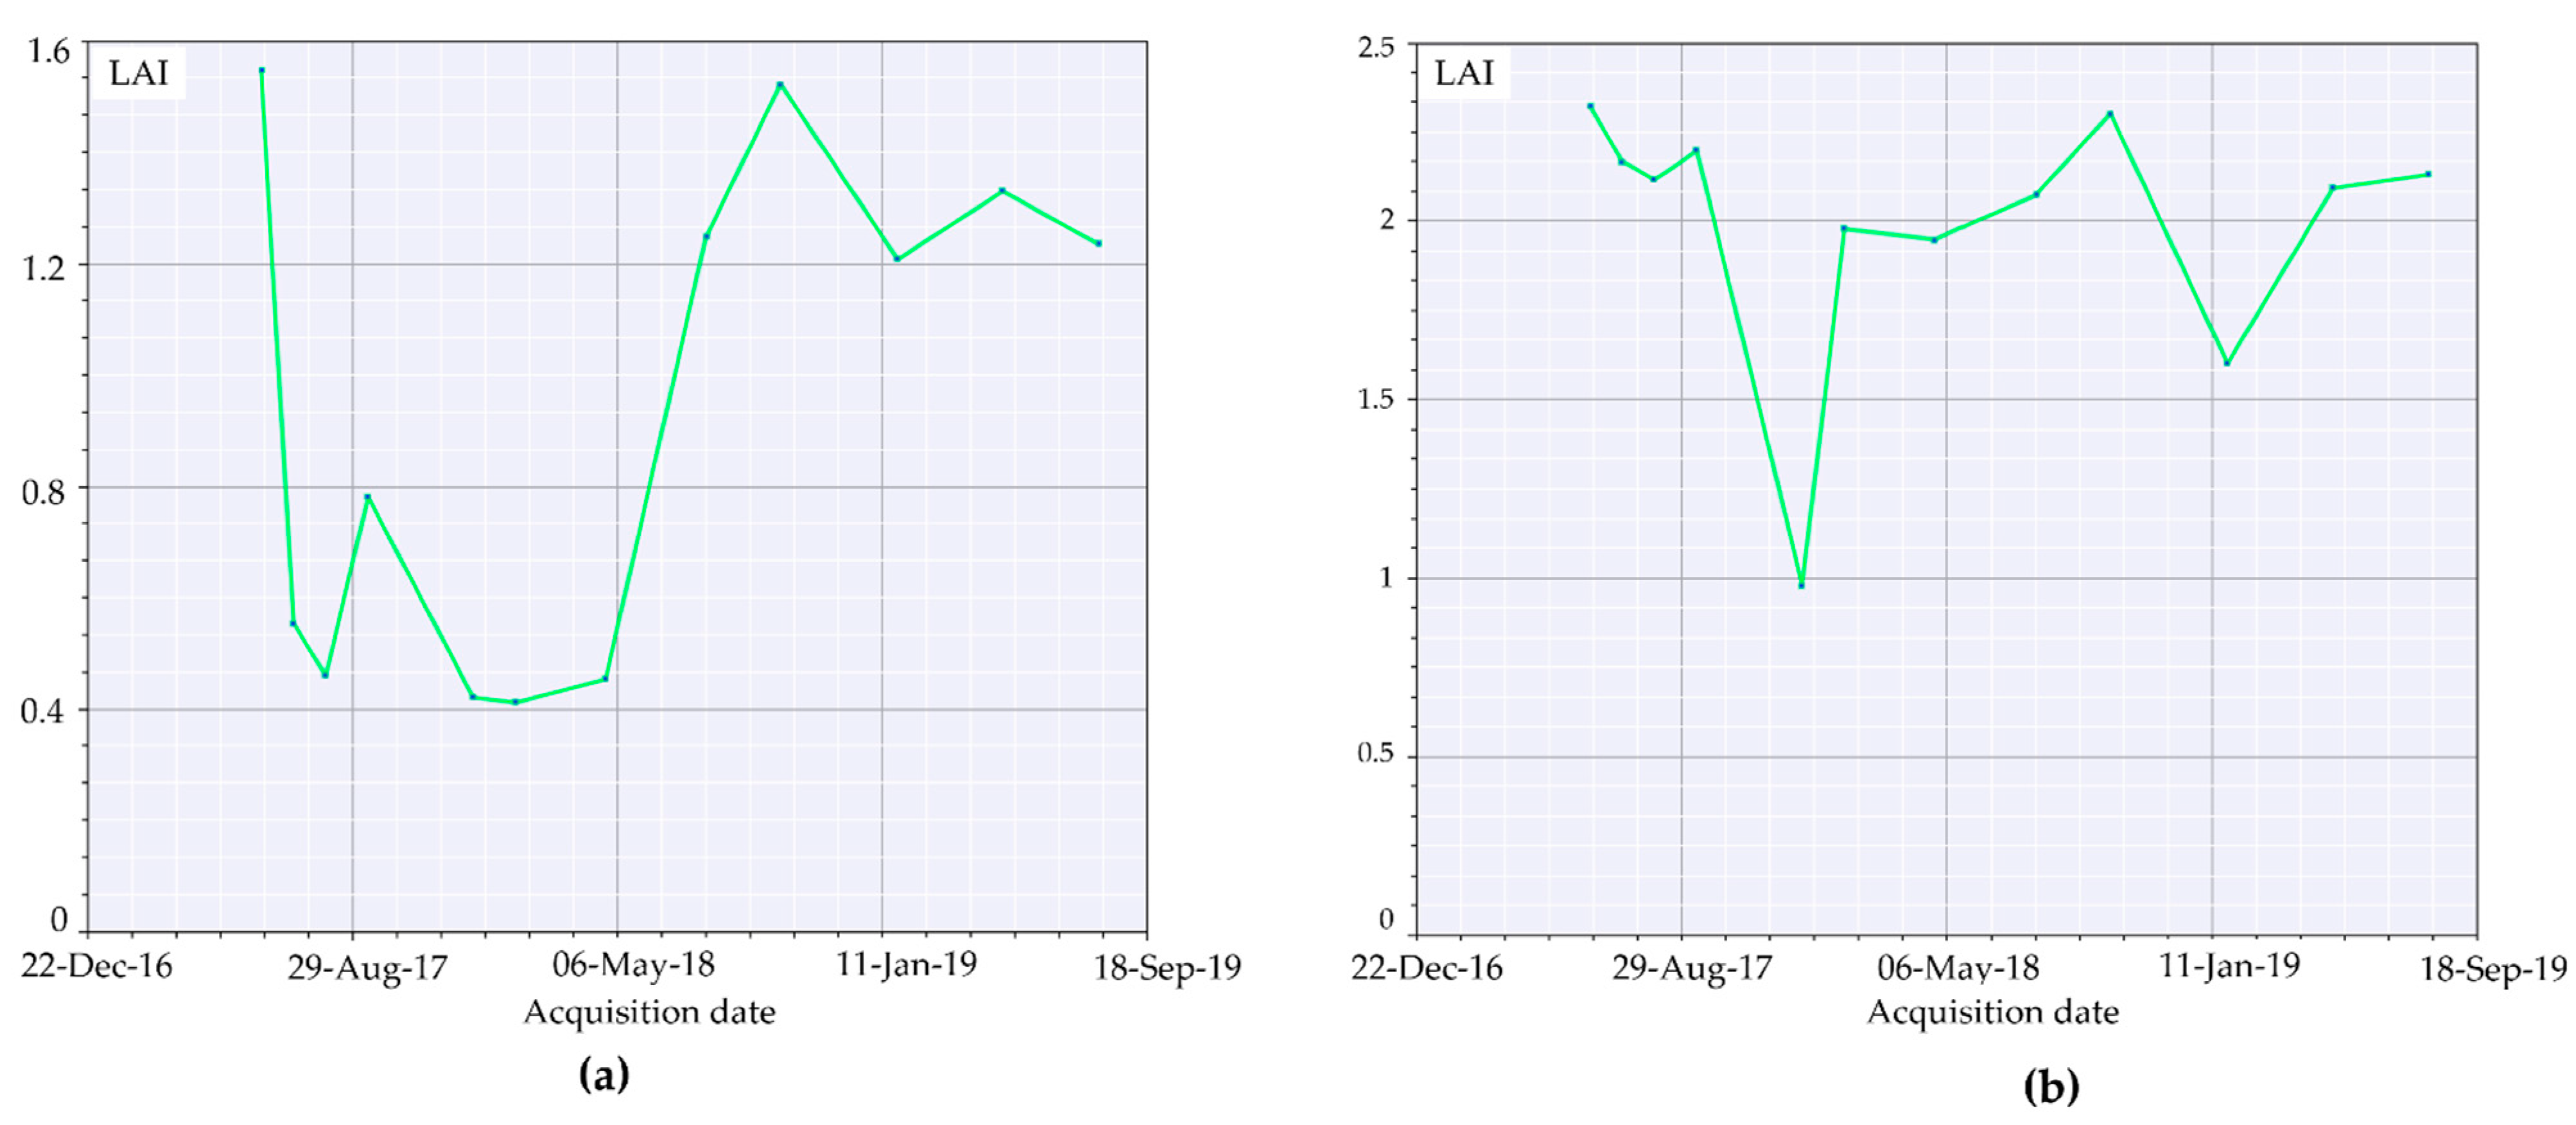
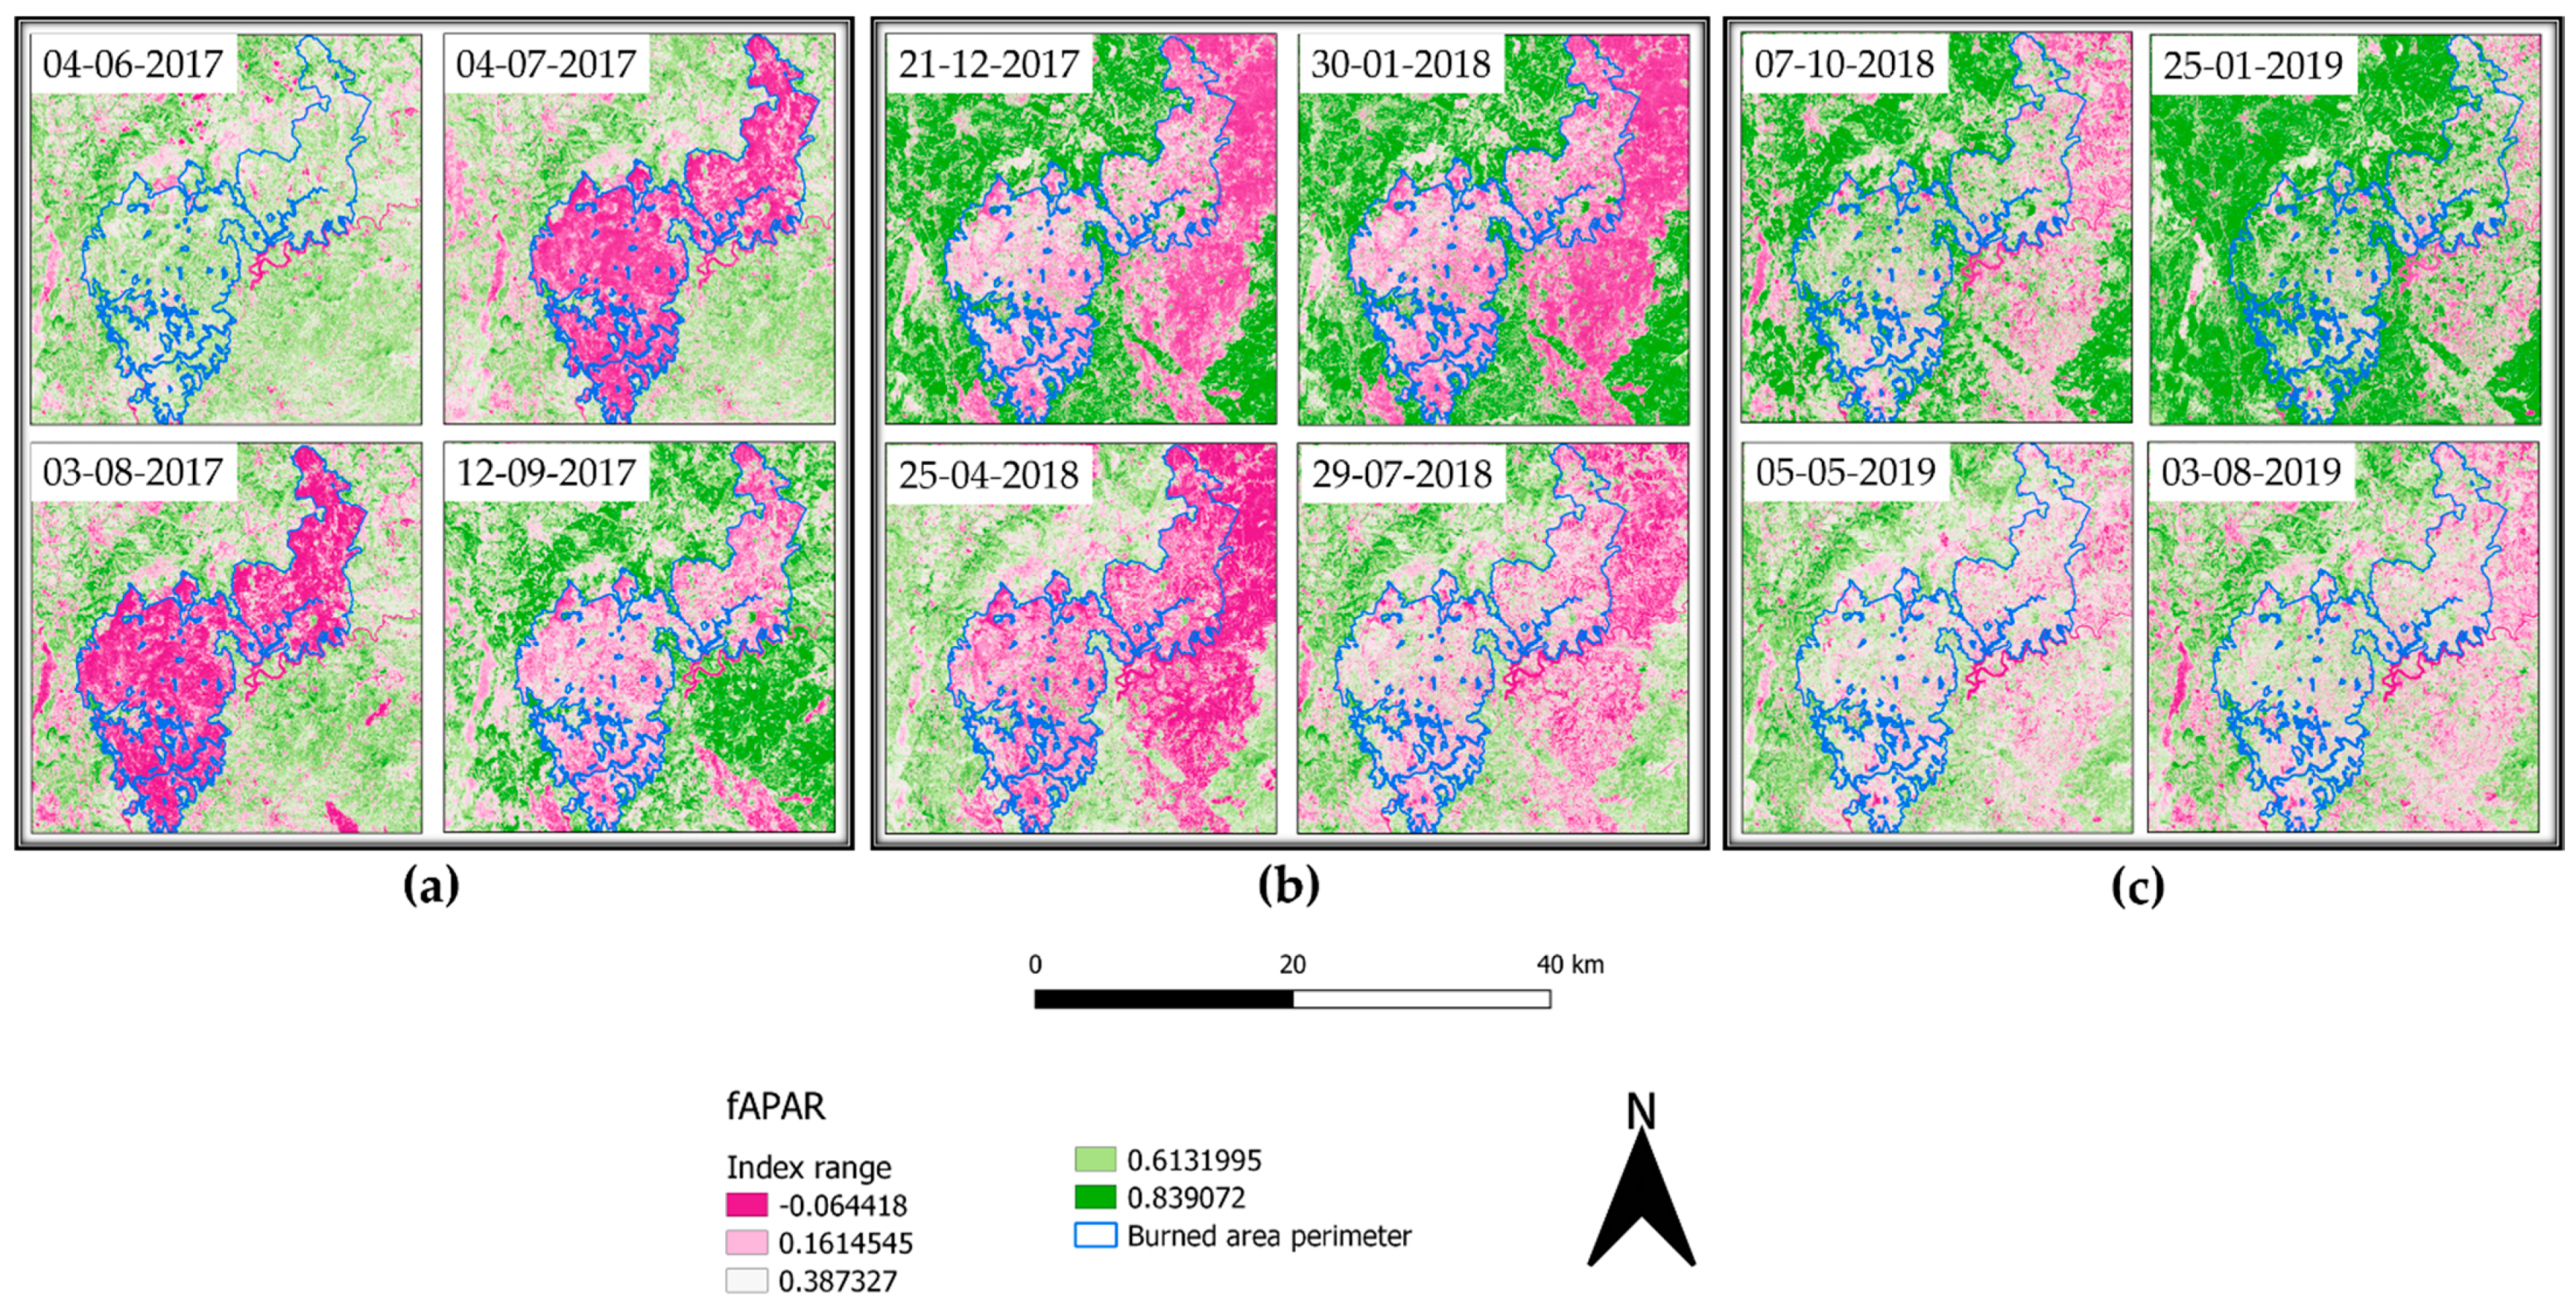
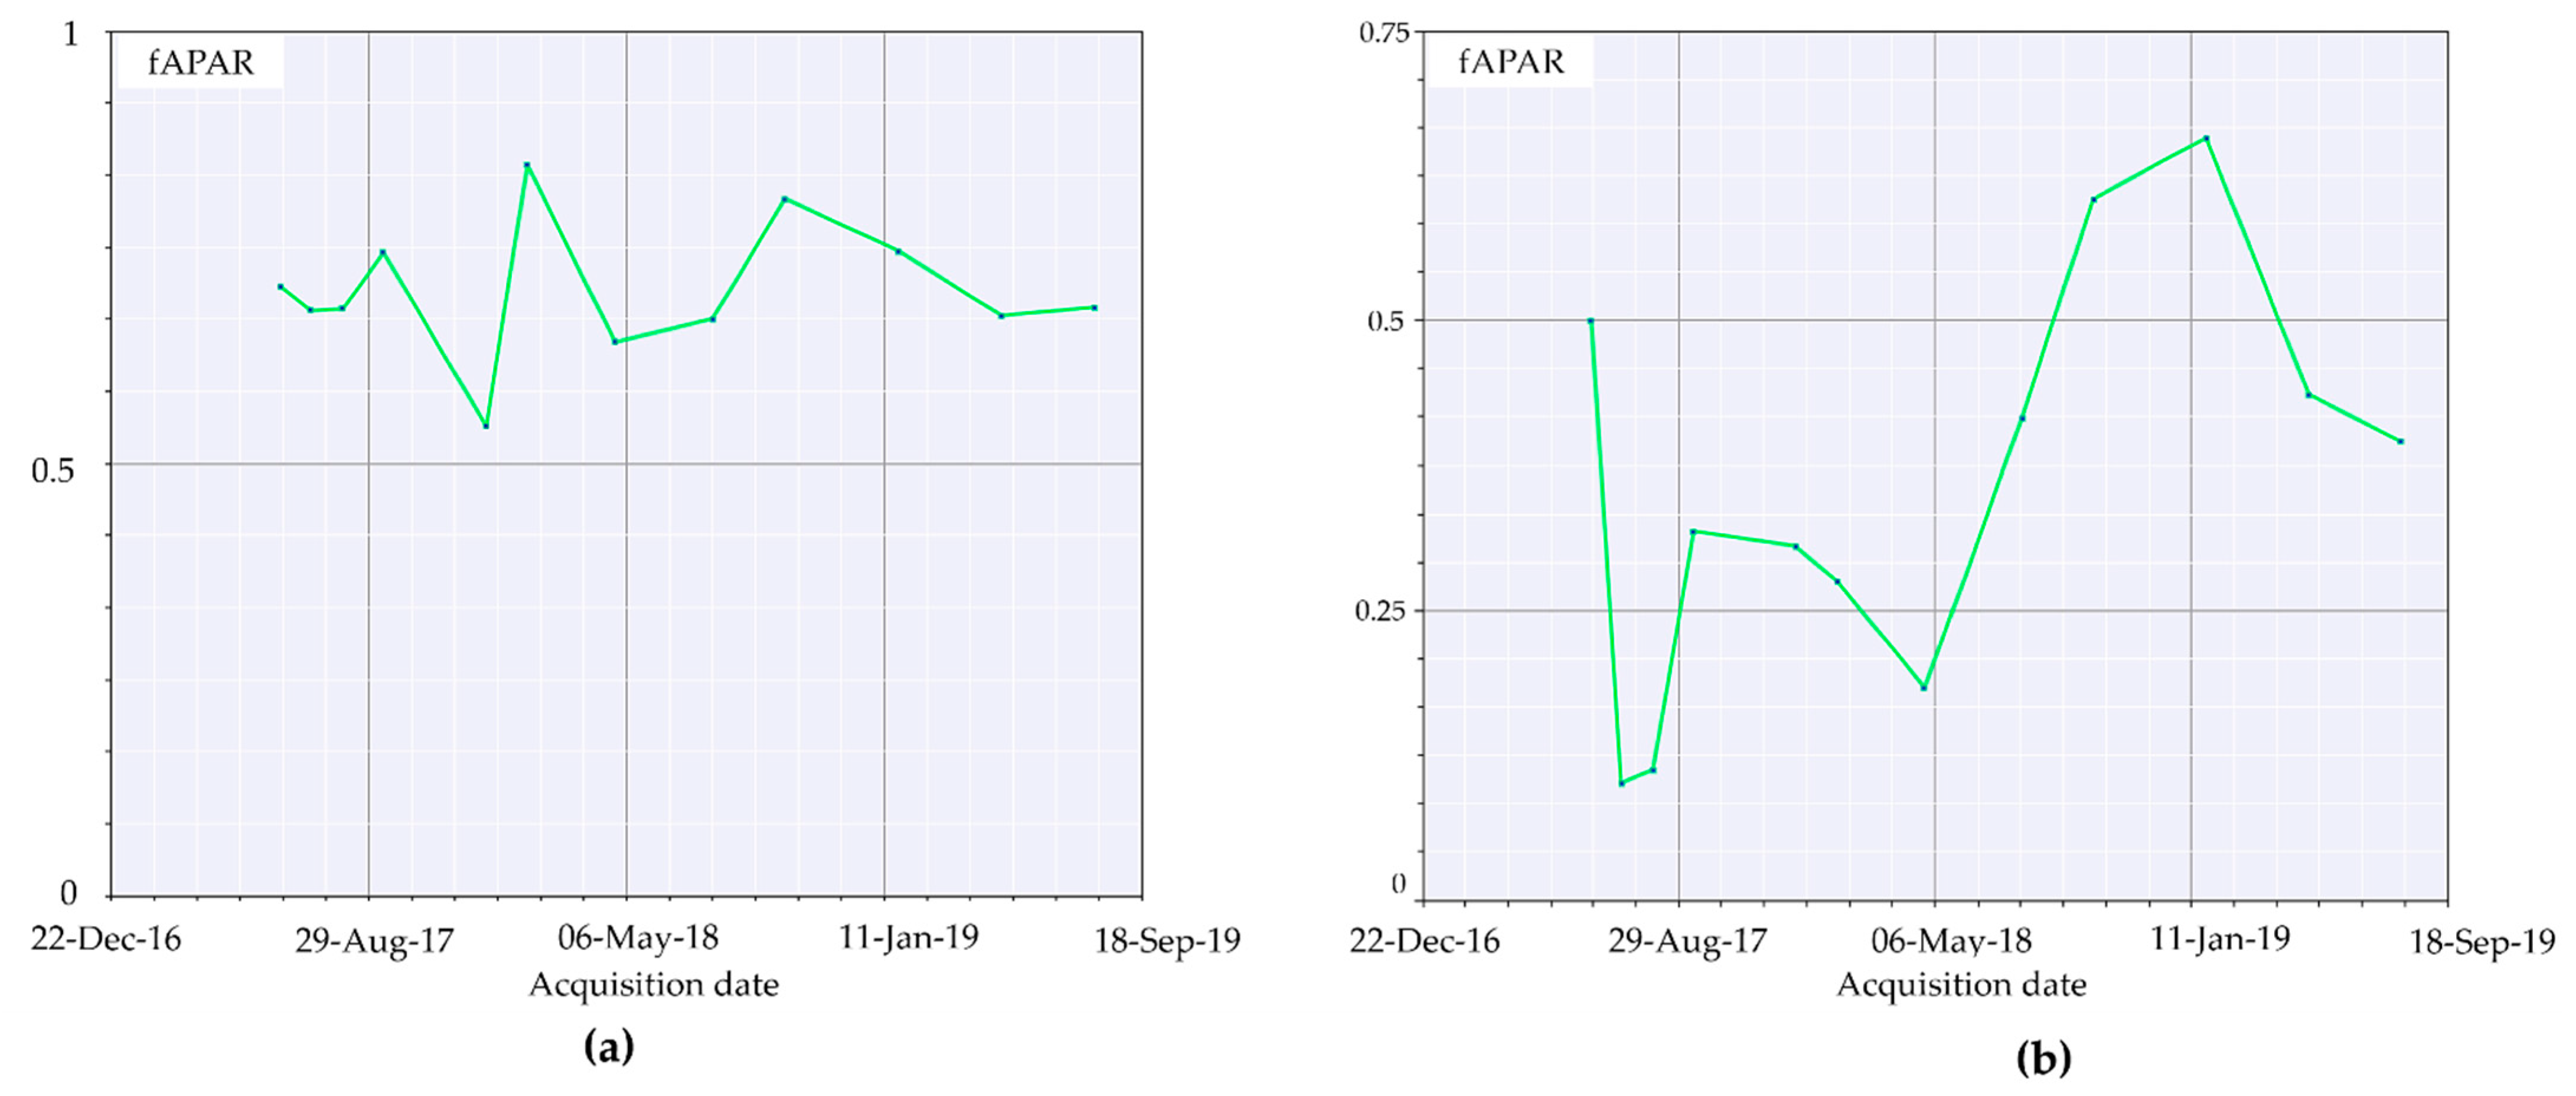
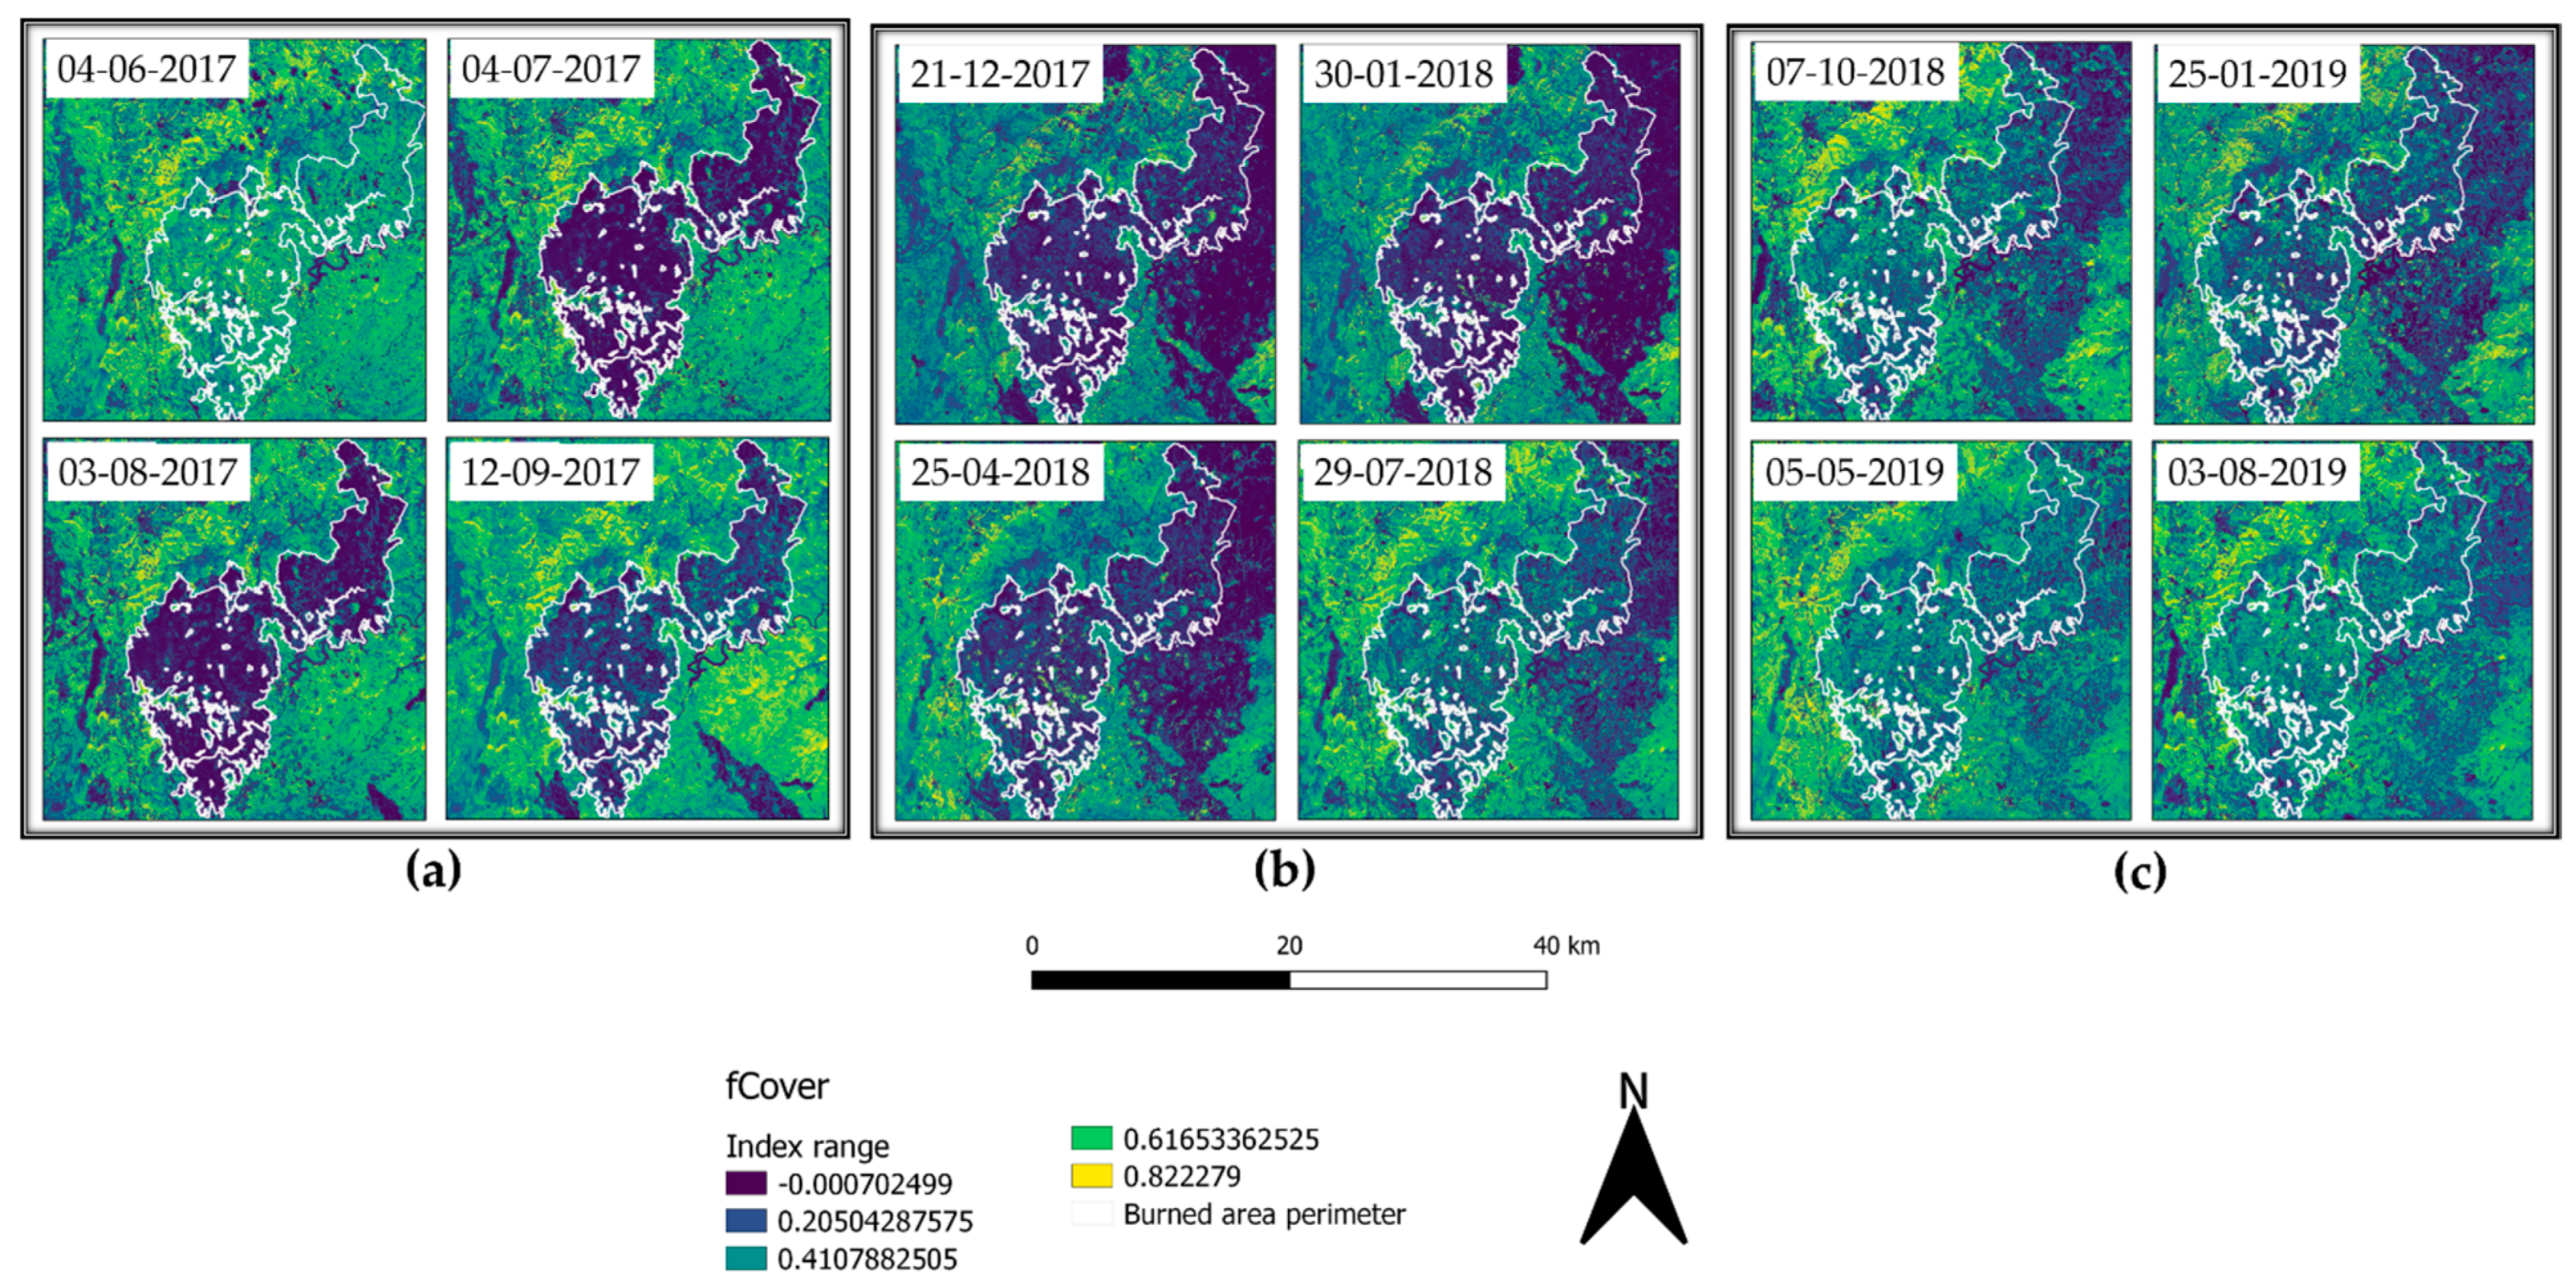
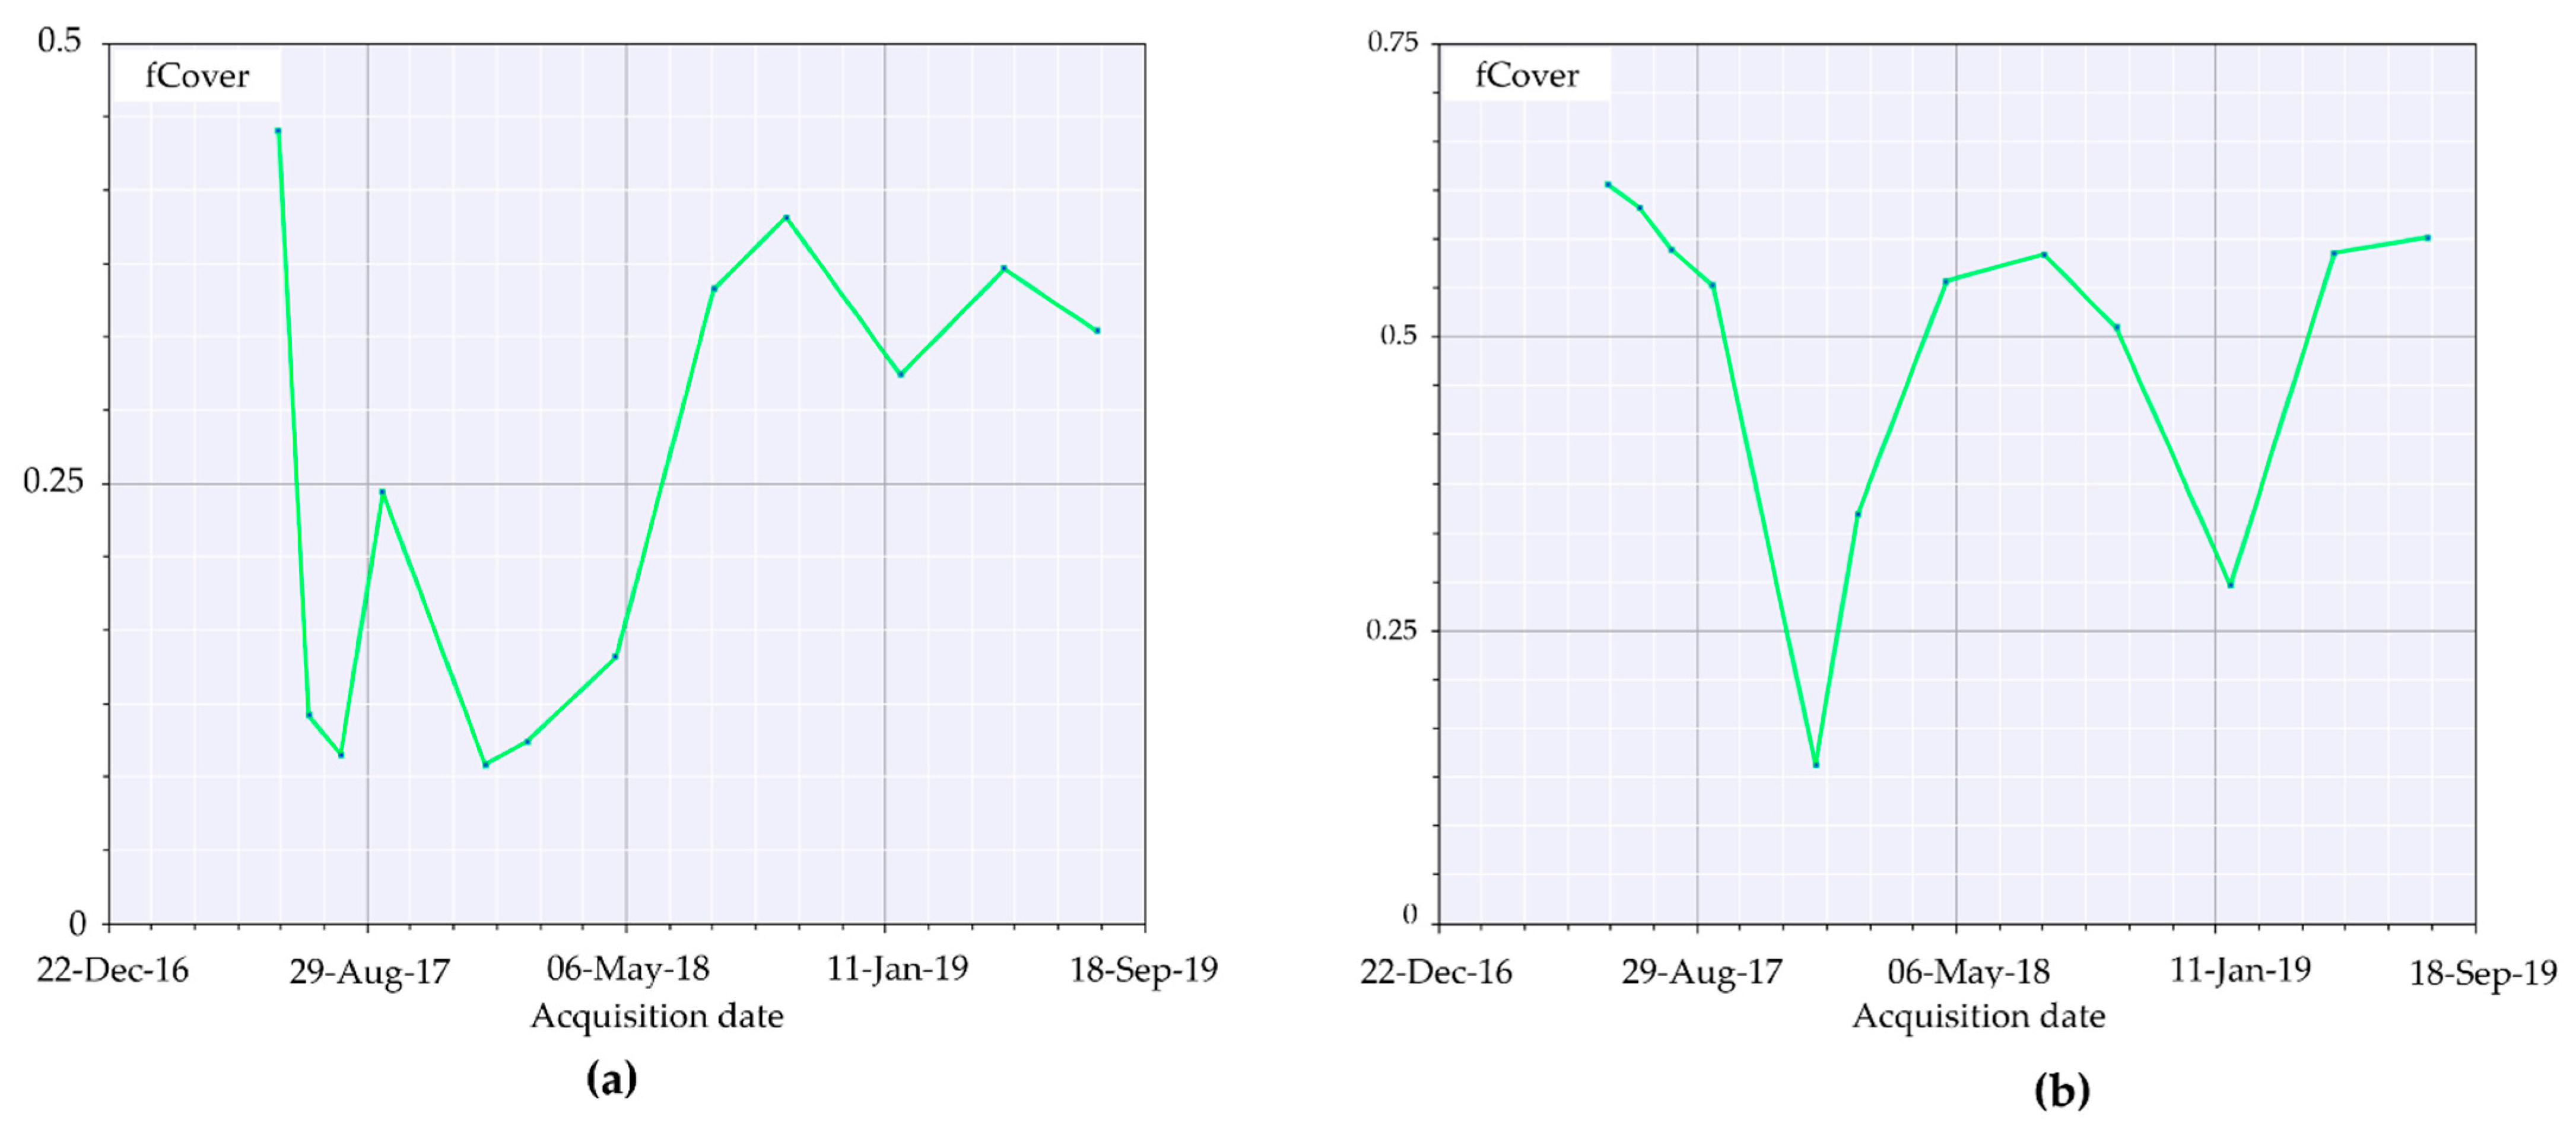
5.1.2. Biophysical Parameters Computation
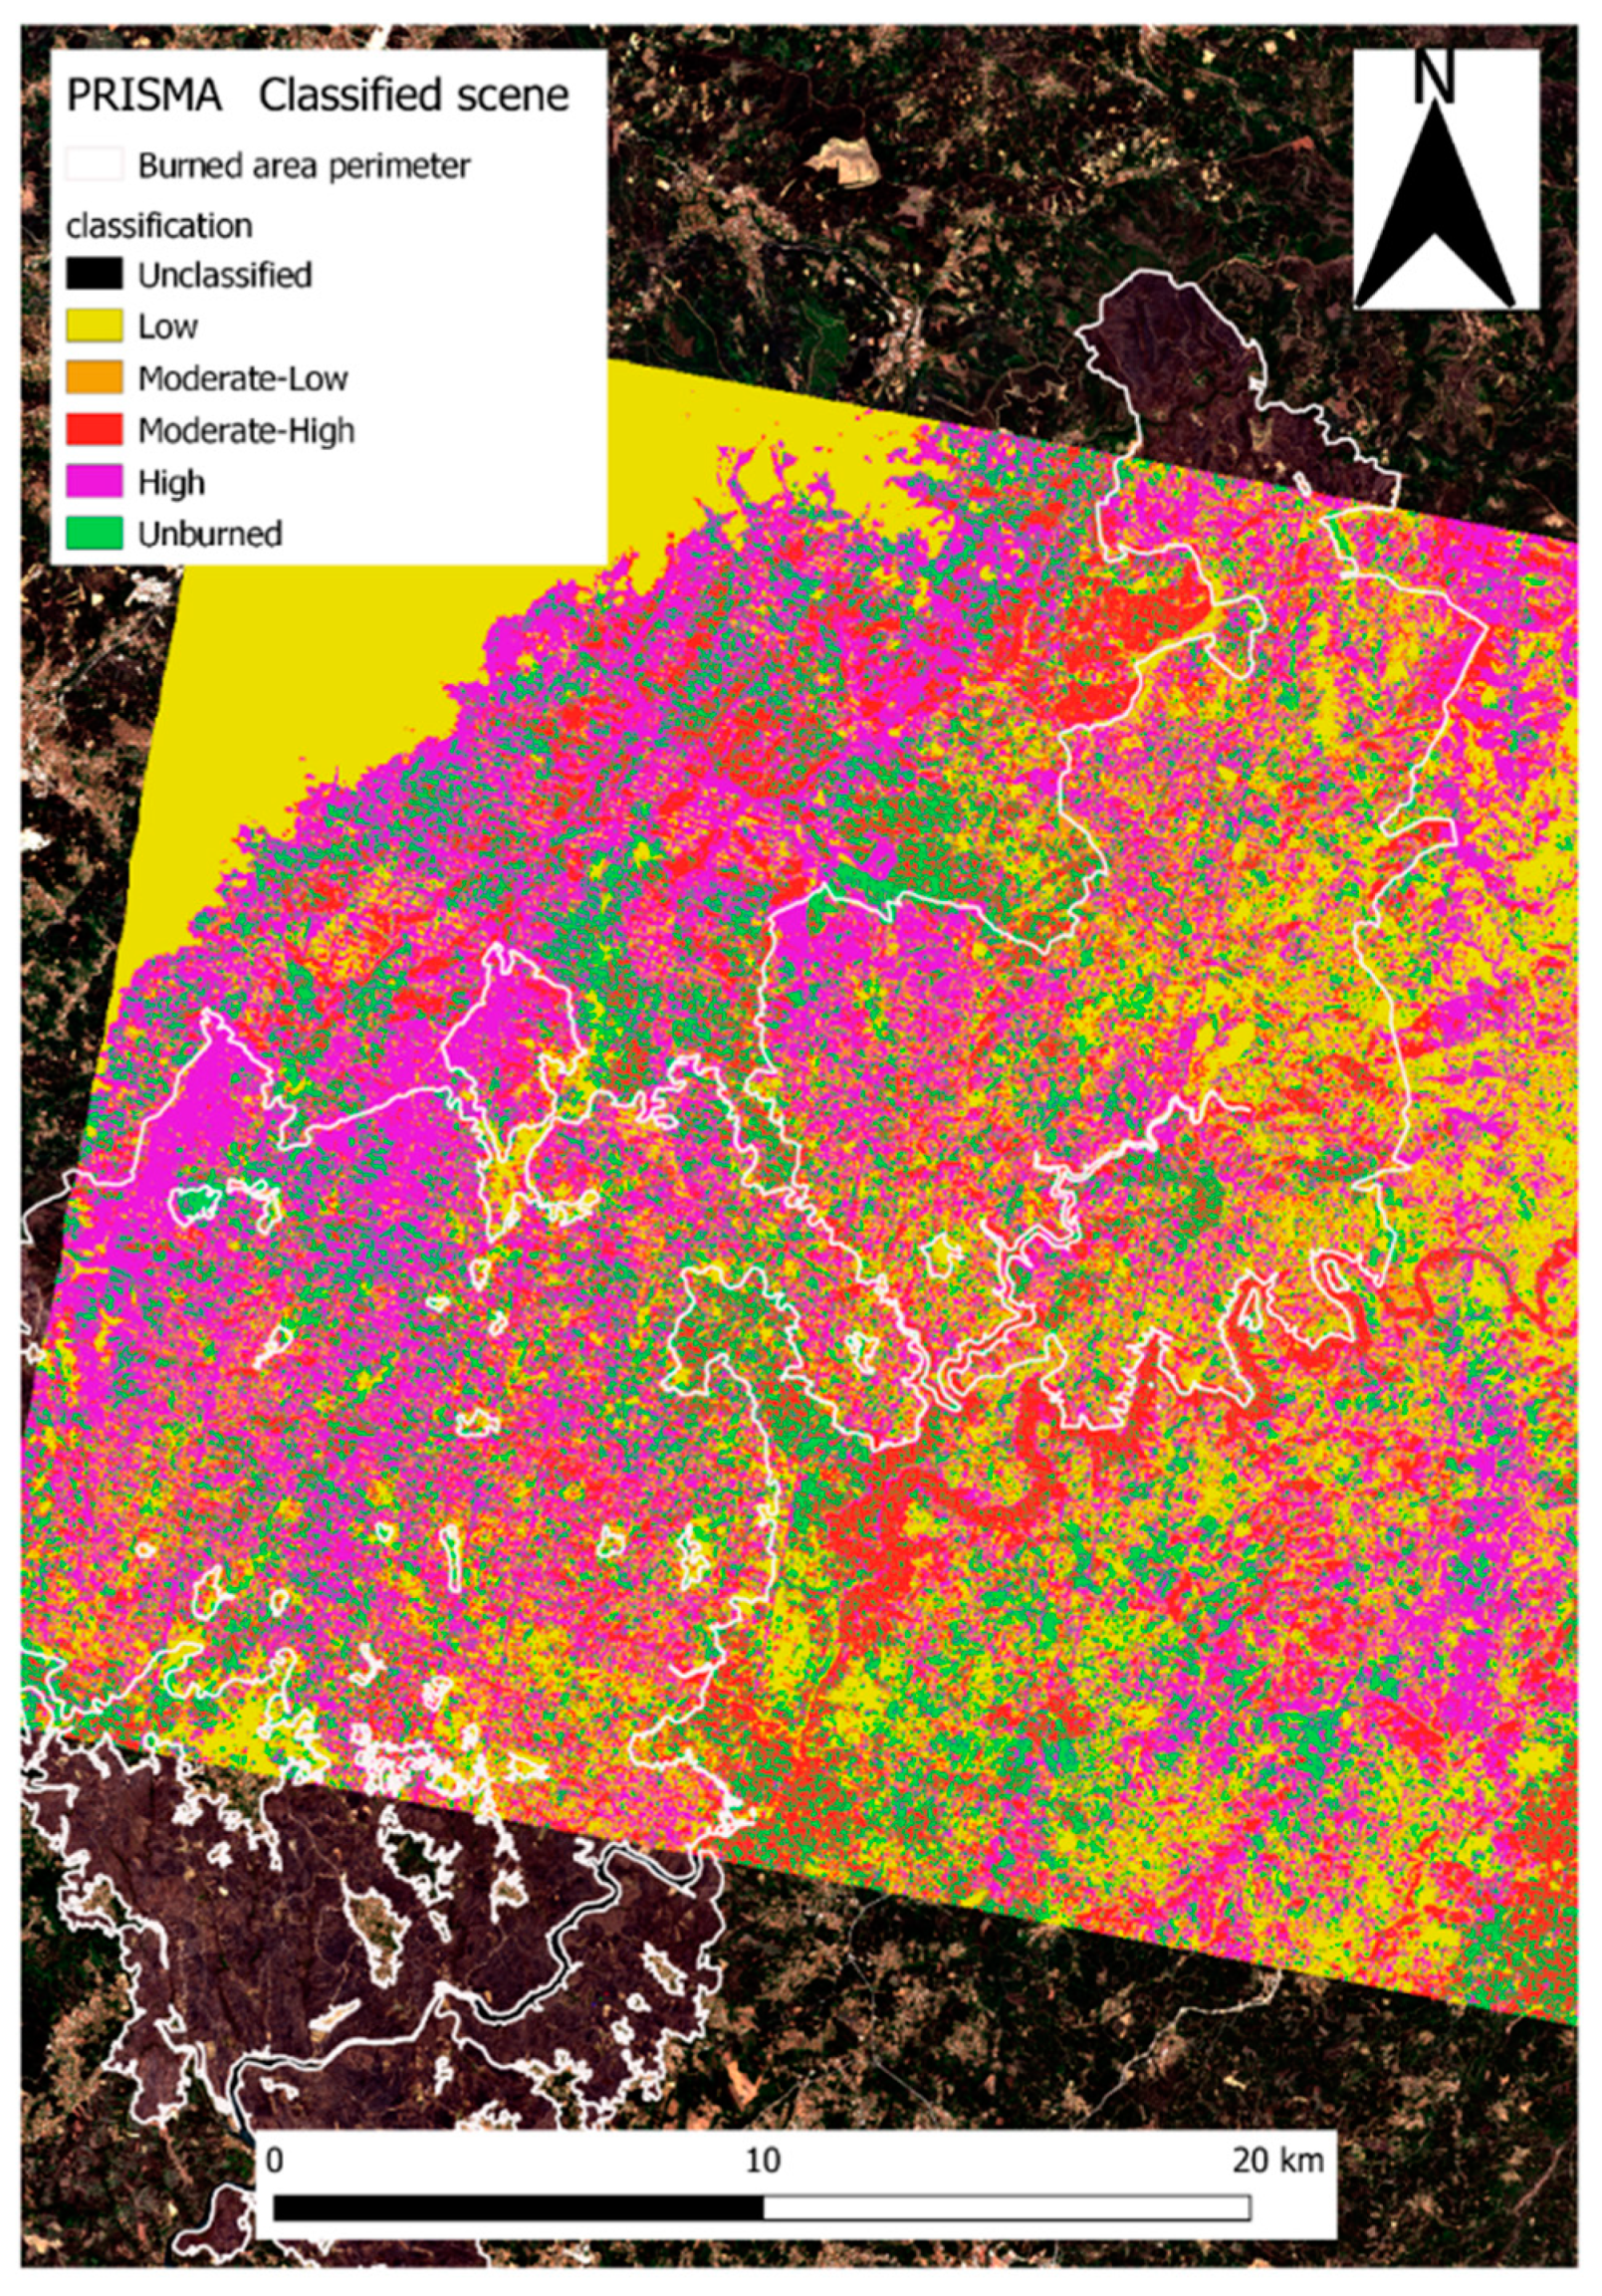
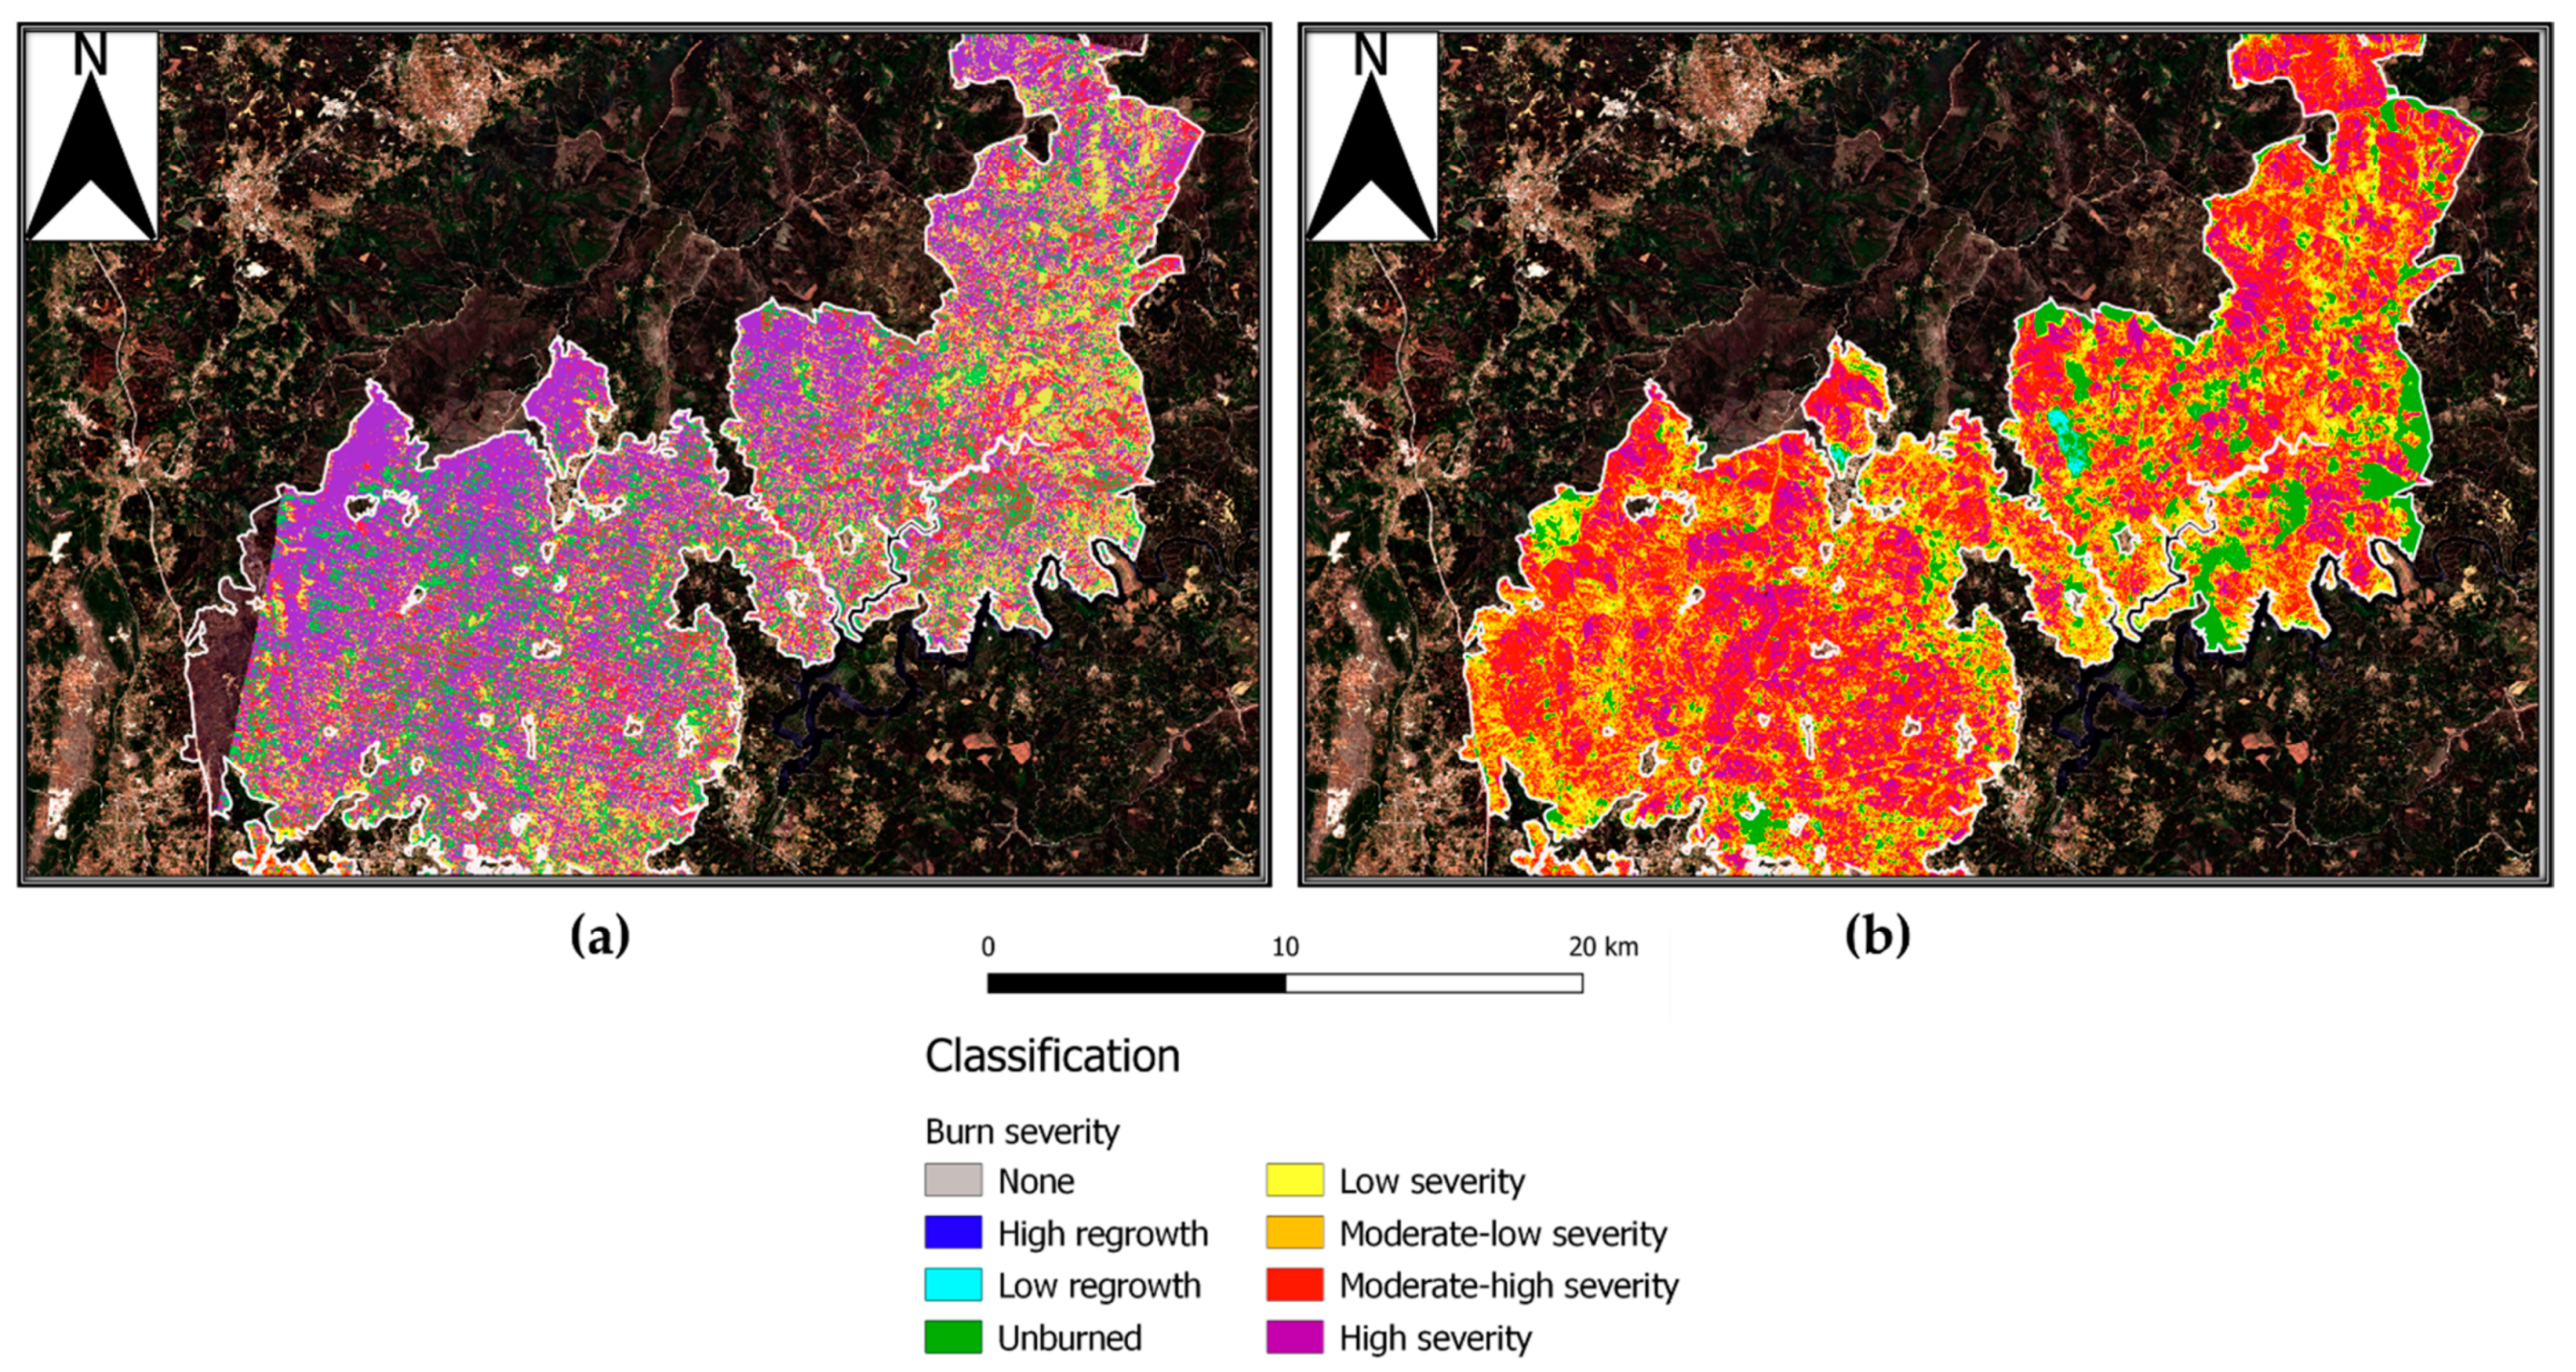
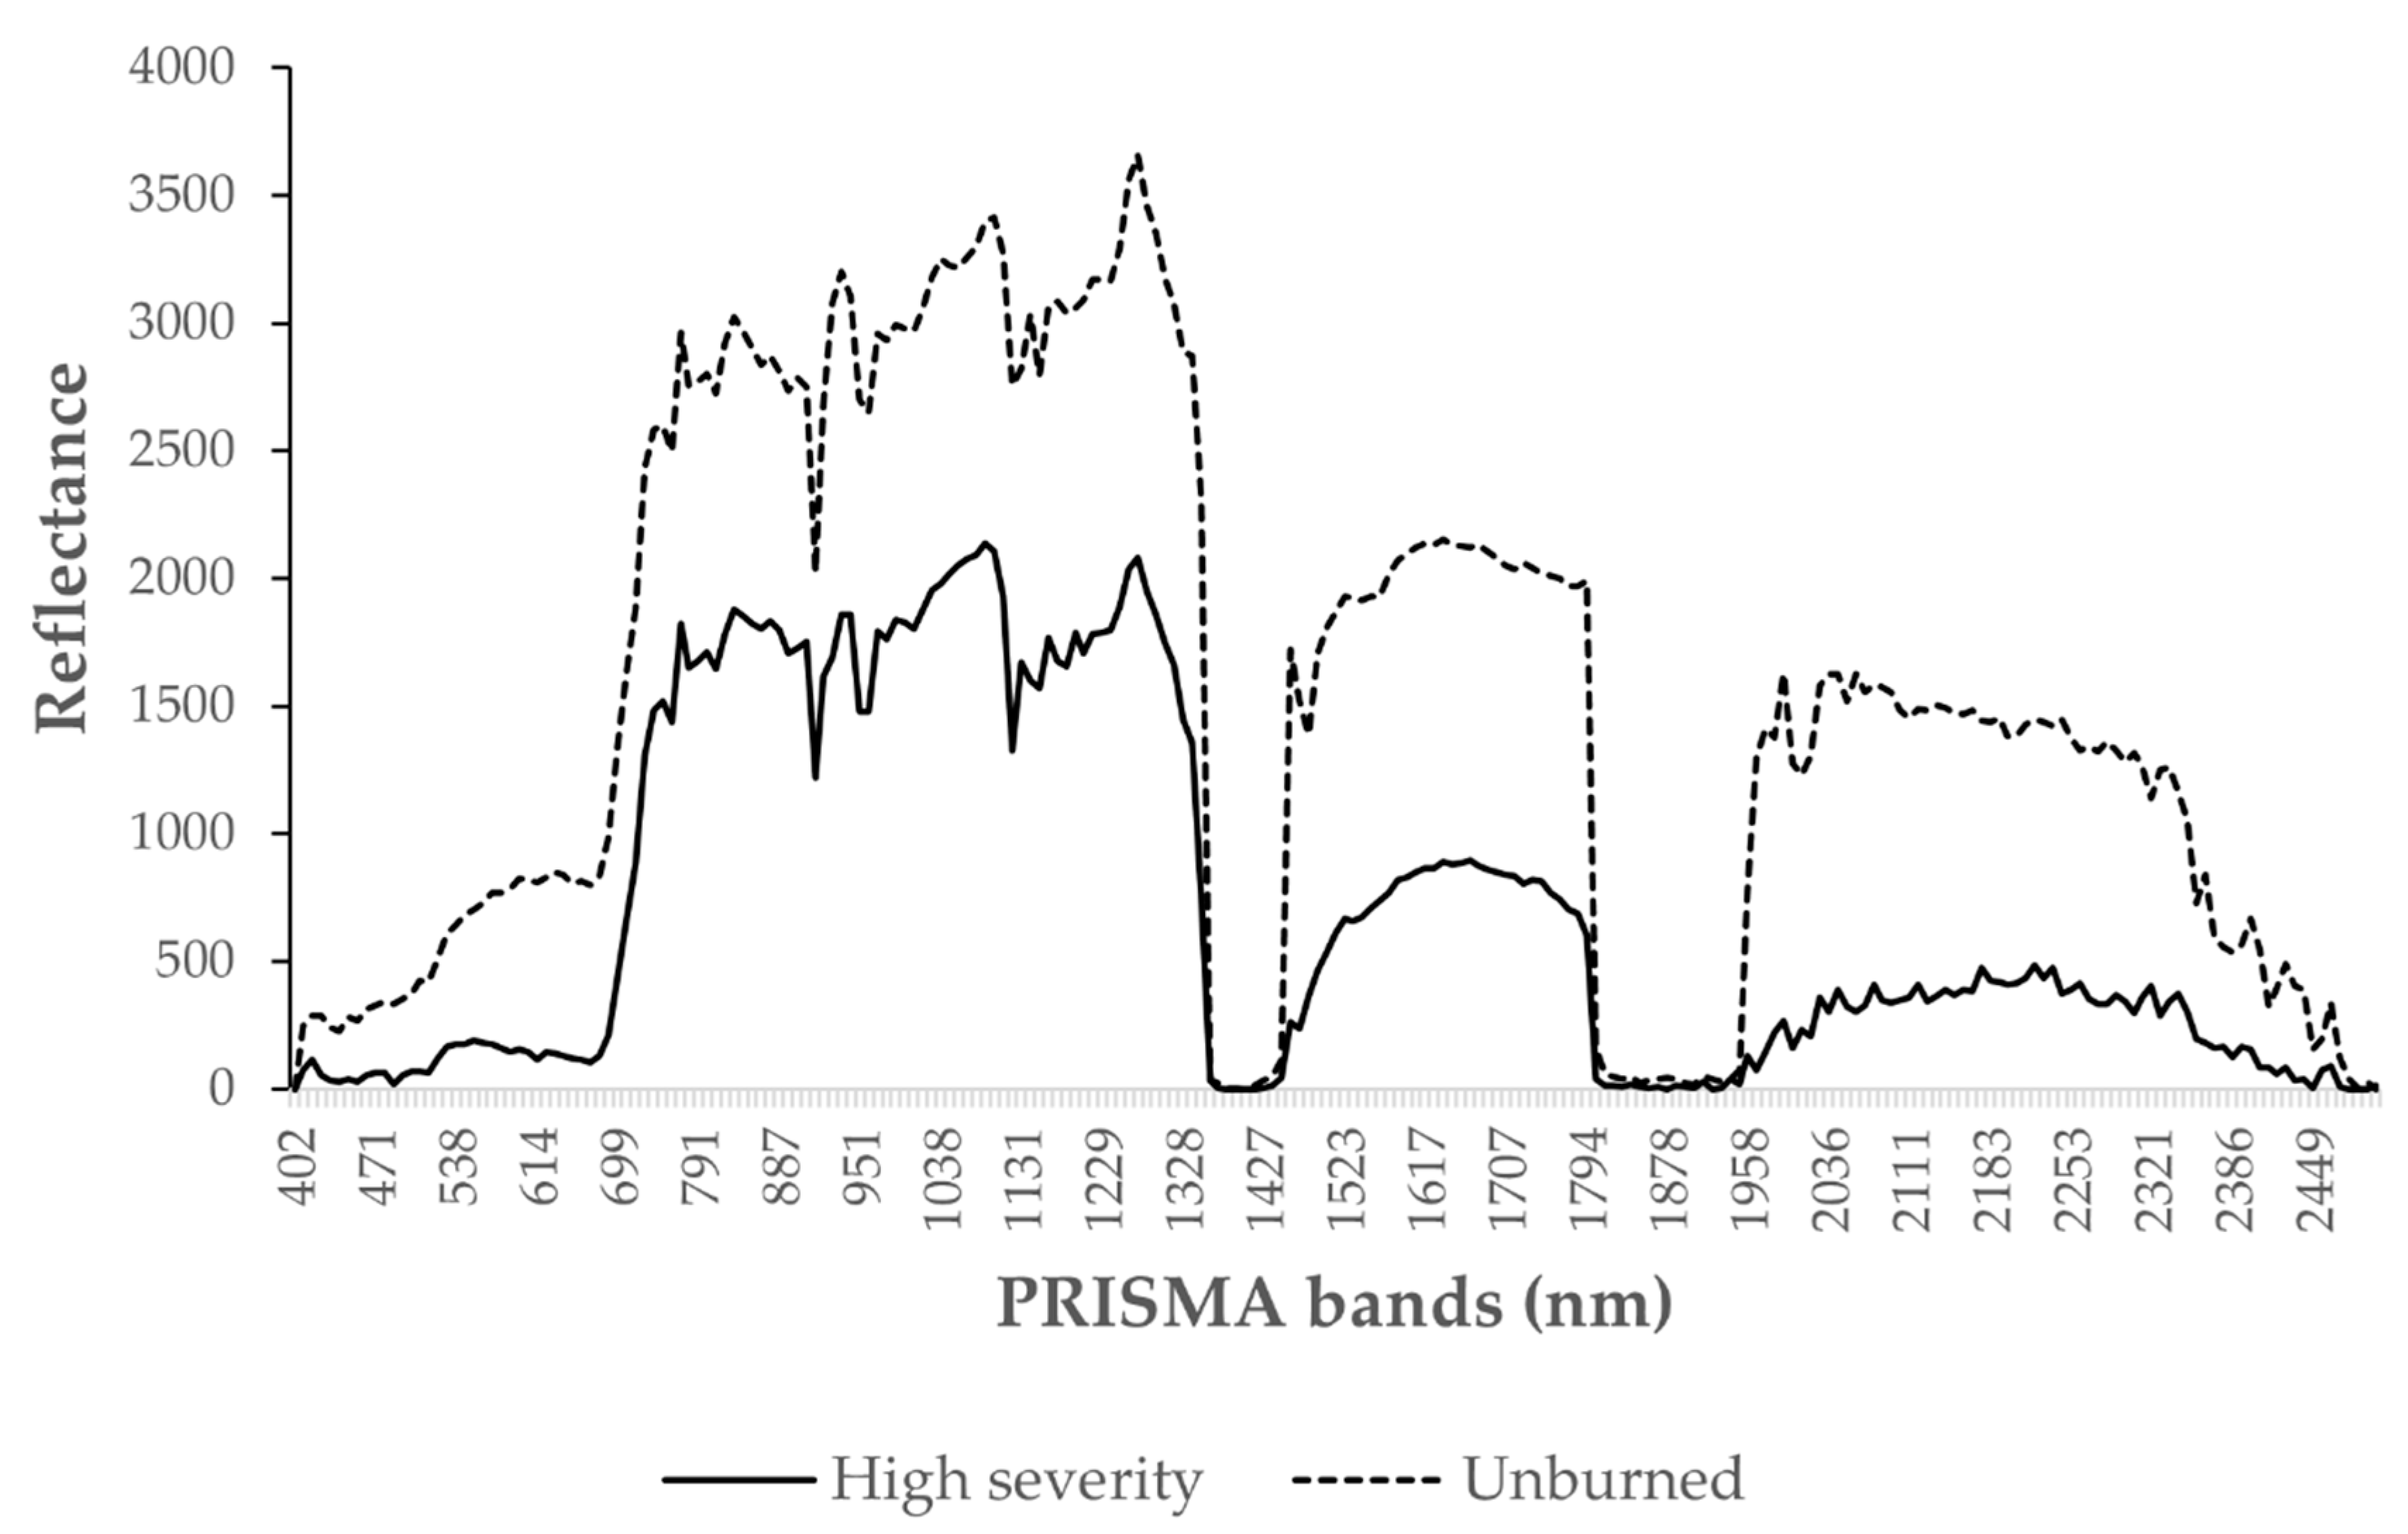
5.1.3. Hyperspectral Burned Scar Detection Assessment
5.2. Study Site 2
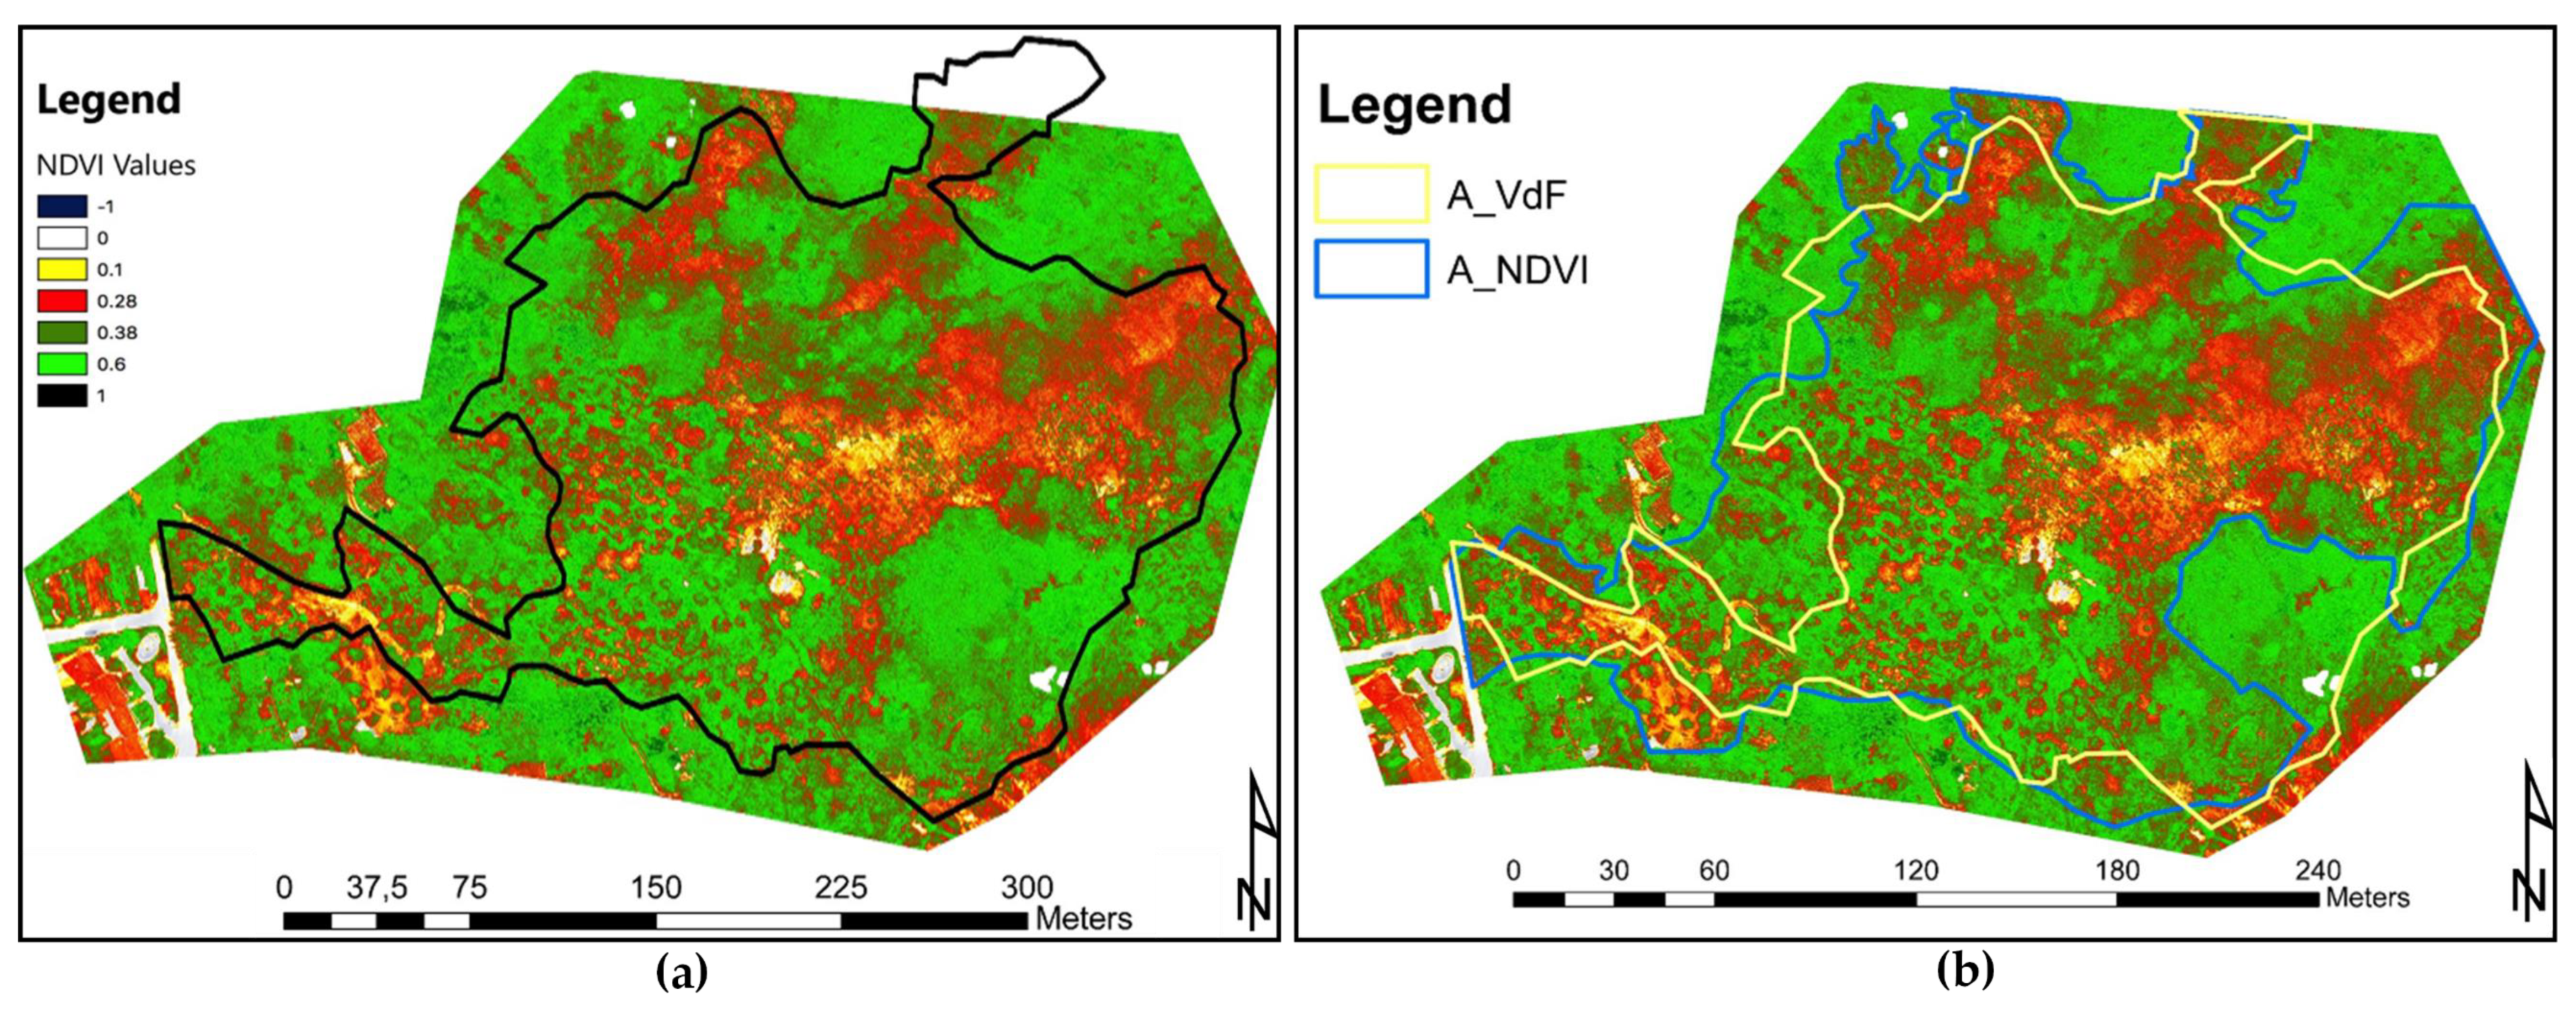
UAV NDVI Burned Area Mapping
6. Discussion
6.1. Study Site 1
6.2. Study Site 2
6.3. Comparison of Satellite and UAV Results and Future Developments
7. Conclusions
Author Contributions
Funding
Institutional Review Board Statement
Informed Consent Statement
Data Availability Statement
Acknowledgments
Conflicts of Interest
References
- Carrión, J.S.; Yll, E.; Walker, M.J.; Legaz, A.J.; Chaín, C.; López, A. Glacial refugia of temperate, Mediterranean and Ibero-North African flora in south-eastern Spain: New evidence from cave pollen at two Neanderthal man sites. Glob. Ecol. Biogeogr. 2003, 12, 119–129. [Google Scholar] [CrossRef]
- Walker, M.J.; Anesin, D.; Angelucci, D.E.; Avilés-Fernández, A.; Berna, F.; Buitrago-López, A.T.; Fernández-Jalvo, Y.; Haber-Uriarte, M.; López-Jiménez, A.; López-Martínez, M.; et al. Combustion at the late Early Pleistocene site of Cueva Negra del Estrecho del Río Quípar (Murcia, Spain). Antiquity 2016, 90, 571–589. [Google Scholar] [CrossRef]
- Shakesby, R.A. Post-wildfire soil erosion in the Mediterranean: Review and future research directions. Earth-Sci. Rev. 2011, 105, 71–100. [Google Scholar] [CrossRef]
- Department of Biodiversity Conservation, Government of Western Australia. Fuel Loads and Fire Intensity. Available online: Https://www.google.com/search?q=Department+of+Biodiversity+Conservation%2C+Government+of+Western+Australia%2C+%282019%29.+Fuel+loads+and+fire+intensity.&sxsrf=ALeKk01G9ZWIsBvgSGNZjL8DxAk9J6FDVw%3A1621088233415&ei=6defYL_hGIKcsAeqyY6QCQ&oq=Department+of+Bi (accessed on 15 May 2021).
- The DRIVER+ Project and CMINE. CMINE Task Group Wildfire Management Final Report; CMINE: Genk, Belgium, 2020. [Google Scholar]
- Wotton, B.M.; Nock, C.A.; Flannigan, M.D. Forest fire occurrence and climate change in Canada. Int. J. Wildl. Fire 2010, 19, 253–271. [Google Scholar] [CrossRef]
- Lazzeri, G. Explorative Use of Drone (UAV) Remotely Sensed Data for Quick Mapping of Wildfire Burnt Areas. Bachelor’s Thesis, Università degli Studi di Firenze, Firenze, Italy, 2018. Unpublished. [Google Scholar]
- Chuvieco, E.; Riaño, D.; Danson, F.M.; Martin, P. Use of a radiative transfer model to simulate the postfire spectral response to burn severity. J. Geophys. Res. Biogeosci. 2006, 111, 4–9. [Google Scholar] [CrossRef]
- Pereira, J.M.C.; Sá, A.C.L.; Sousa, A.M.O.; Silva, J.M.N.; Santos, T.N.; Carreiras, J.M.B. Spectral characterisation and discrimination of burnt areas. In Remote Sensing of Large Wildfires; Springer: Berlin/Heidelberg, Germany, 1999; pp. 123–138. [Google Scholar]
- Shakesby, R.A.; Doerr, S.H. Wildfire as a hydrological and geomorphological agent. Earth-Sci. Rev. 2006, 74, 269–307. [Google Scholar] [CrossRef]
- Beatty, S.M.; Smith, J.E. Dynamic soil water repellency and infiltration in post-wildfire soils. Geoderma 2013, 192, 160–172. [Google Scholar] [CrossRef]
- Jensen, J.R.; Brigham Young University. Remote Sensing of the Environment: An Earth Resource Perspective, 2nd ed.; Pearson: Upper Saddle River, NJ, USA, 2007; ISBN 978-0131889507. [Google Scholar]
- Epting, J.; Verbyla, D.; Sorbel, B. Evaluation of remotely sensed indices for assessing burn severity in interior Alaska using Landsat TM and ETM+. Remote Sens. Environ. 2005, 96, 328–339. [Google Scholar] [CrossRef]
- Chuvieco, E.; Mouillot, F.; van der Werf, G.R.; San Miguel, J.; Tanasse, M.; Koutsias, N.; García, M.; Yebra, M.; Padilla, M.; Gitas, I.; et al. Historical background and current developments for mapping burned area from satellite Earth observation. Remote Sens. Environ. 2019, 225, 45–64. [Google Scholar] [CrossRef]
- Seiler, W.; Crutzen, P.J. Estimates of gross and net fluxes of carbon between the biosphere and the atmosphere from biomass burning. Clim. Chang. 1980, 2, 207–247. [Google Scholar] [CrossRef]
- Reilly, J.; Prinn, R.; Harnisch, J.; Fitzmaurice, J.; Jacoby, H.; Kicklighter, D.; Melillo, J.; Stone, P.; Sokolov, A.; Wang, C. Multi-gas assessment of the Kyoto Protocol. Nature 1999, 401, 549–555. [Google Scholar] [CrossRef]
- Pearson, L.; Pelling, M. The UN Sendai Framework for Disaster Risk Reduction 2015–2030: Negotiation Process and Prospects for Science and Practice. J. Extrem. Events 2015, 2, 1571001. [Google Scholar] [CrossRef]
- Protezione Civile. Description of the Fire Risk. Available online: http://www.protezionecivile.gov.it/jcms/it/descrizione_incendi (accessed on 15 May 2021).
- Aschbacher, J.; Milagro-Pérez, M.P. The European Earth monitoring (GMES) programme: Status and perspectives. Remote Sens. Environ. 2012, 120, 3–8. [Google Scholar] [CrossRef]
- ESA. Sentinel-2 User Handbook; ESA: Paris, France, 2013. [Google Scholar]
- European Space Agency (ESA). Sentinel-2 Spectral Response Functions (S2-SRF); Version 3.0; ESA: Paris, France, 2017. [Google Scholar]
- Filipponi, F. BAIS2: Burned Area Index for Sentinel-2. Proceedings 2018, 2, 364. [Google Scholar] [CrossRef]
- Stavrakoudis, D.G.; Katagis, T.; Minakou, C.; Gitas, I.Z. Towards a fully automatic processing chain for operationally mapping burned areas countrywide exploiting Sentinel-2 imagery. In Proceedings of the Seventh International Conference on Remote Sensing and Geoinformation of the Environment (RSCy2019), Paphos, Cyprus, 18–21 March 2019; Volume 11174, p. 1117405. [Google Scholar]
- Pepe, M.; Parente, C. Burned area recognition by change detection analysis using images derived from Senti-nel-2 satellite: The case study of Sor-rento Peninsula, Italy. J. Appl. Eng. Sci. 2018, 16, 225–232. [Google Scholar] [CrossRef]
- Roteta, E.; Bastarrika, A.; Padilla, M.; Storm, T.; Chuvieco, E. Development of a Sentinel-2 burned area algorithm: Generation of a small fire database for sub-Saharan Africa. Remote Sens. Environ. 2019, 222, 1–17. [Google Scholar] [CrossRef]
- Roy, D.P.; Huang, H.; Boschetti, L.; Giglio, L.; Yan, L.; Zhang, H.H.; Li, Z. Landsat-8 and Sentinel-2 burned area mapping—A combined sensor multi-temporal change detection approach. Remote Sens. Environ. 2019, 231, 111254. [Google Scholar] [CrossRef]
- Quintano, C.; Fernández-Manso, A.; Fernández-Manso, O. Combination of Landsat and Sentinel-2 MSI data for initial assessing of burn severity. Int. J. Appl. Earth Obs. Geoinf. 2018, 64, 221–225. [Google Scholar] [CrossRef]
- Loizzo, R.; Guarini, R.; Longo, F.; Scopa, T.; Formaro, R.; Facchinetti, C.; Varacalli, G. Prisma: The Italian hyperspectral mission. In Proceedings of the International Geoscience and Remote Sensing Symposium (IGARSS), Valencia, Spain, 22–27 July 2018; pp. 175–178. [Google Scholar]
- Smith, D. Abstracts of the 44th Mineral Deposits Study Group Annual Winter Meeting held virtually on 14th December 2020. Appl. Earth Sci. 2021, 130, 68–80. [Google Scholar] [CrossRef]
- Vangi, E.; D’amico, G.; Francini, S.; Giannetti, F.; Lasserre, B.; Marchetti, M.; Chirici, G. The new hyperspectral satellite prisma: Imagery for forest types discrimination. Sensors 2021, 21, 1182. [Google Scholar] [CrossRef]
- Cusworth, D.H.; Duren, R.M.; Thorpe, A.K.; Pandey, S.; Maasakkers, J.D.; Aben, I.; Jervis, D.; Varon, D.J.; Jacob, D.J.; Randles, C.A.; et al. Multisatellite Imaging of a Gas Well Blowout Enables Quantification of Total Methane Emissions. Geophys. Res. Lett. 2021, 48, e2020GL090864. [Google Scholar] [CrossRef]
- Sharpe, J.R. The Forest Resources of Ontario, 1930; Ontario Department of Lands and Forests, Forestry Branch: Toronto, ON, Canada, 1931. [Google Scholar]
- Kolden, C.A.; Weisberg, P.J. Assessing Accuracy of Manually-mapped Wildfire Perimeters in Topographically Dissected Areas. Fire Ecol. 2007, 3, 22–31. [Google Scholar] [CrossRef]
- Hitchcock, H.C.; Hoffer, R.M. Mapping a recent forest fire with ERTS-1 MSS data. In Proceedings of the Remote Sensing of Earth Resources: Volume 3—Third Conference on Earth Resources Observation and Information Analysis System, Tullahoma, TN, USA, 25–27 March 1974. [Google Scholar]
- Filipponi, F. Exploitation of sentinel-2 time series to map burned areas at the national level: A case study on the 2017 Italy wildfires. Remote Sens. 2019, 11, 622. [Google Scholar] [CrossRef]
- Filipponi, F.; Manfron, G. Observing Post-Fire Vegetation Regeneration Dynamics Exploiting High-Resolution Sentinel-2 Data. Proceedings 2019, 18, 10. [Google Scholar] [CrossRef]
- Sobrino, J.A.; Llorens, R.; Fernández, C.; Fernández-Alonso, J.M.; Vega, J.A. Relationship between forest fires severity measured in situ and through remotely sensed spectral indices. Forests 2019, 10, 457. [Google Scholar] [CrossRef]
- García-Llamas, P.; Suárez-Seoane, S.; Fernández-Guisuraga, J.M.; Fernández-García, V.; Fernández-Manso, A.; Quintano, C.; Taboada, A.; Marcos, E.; Calvo, L. Evaluation and comparison of Landsat 8, Sentinel-2 and Deimos-1 remote sensing indices for assessing burn severity in Mediterranean fire-prone ecosystems. Int. J. Appl. Earth Obs. Geoinf. 2019, 80, 137–144. [Google Scholar] [CrossRef]
- Bonis, R.D.; Laneve, G. Development of a Vegetation Damage Severity Index for the Italian Hyperspectral Sensor PRISMA. Available online: https://www.semanticscholar.org/paper/Development-of-a-vegetation-damage-severity-index-Bonis-Laneve/7590a757055c279a2bc07896da2fa522dadce414 (accessed on 20 May 2020).
- Chen, D.; Loboda, T.V.; Hall, J.V. A systematic evaluation of influence of image selection process on remote sensing-based burn severity indices in North American boreal forest and tundra ecosystems. ISPRS J. Photogramm. Remote Sens. 2020, 159, 63–77. [Google Scholar] [CrossRef]
- Suresh Babu, K.V.; Roy, A.; Aggarwal, R. Mapping of forest fire burned severity using the Sentinel datasets. ISPRS Int. Arch. Photogramm. Remote Sens. Spat. Inf. Sci. 2018, XLII-5, 469–474. [Google Scholar] [CrossRef]
- Cocke, A.E.; Fulé, P.Z.; Crouse, J.E. Comparison of burn severity assessments using Differenced Normalized Burn Ratio and ground data. Int. J. Wildl. Fire 2005, 14, 189–198. [Google Scholar] [CrossRef]
- Samiappan, S.; Hathcock, L.; Turnage, G.; McCraine, C.; Pitchford, J.; Moorhead, R. Remote sensing of wildfire using a small unmanned aerial system: Post-fire mapping, vegetation recovery and damage analysis in grand bay, Mississippi/Alabama, USA. Drones 2019, 3, 43. [Google Scholar] [CrossRef]
- Fernández-Guisuraga, J.M.; Sanz-Ablanedo, E.; Suárez-Seoane, S.; Calvo, L. Using unmanned aerial vehicles in postfire vegetation survey campaigns through large and heterogeneous areas: Opportunities and challenges. Sensors 2018, 18, 586. [Google Scholar] [CrossRef]
- Fernández-Manso, A.; Fernández-Manso, O.; Quintano, C. SENTINEL-2A red-edge spectral indices suitability for discriminating burn severity. Int. J. Appl. Earth Obs. Geoinf. 2016, 50, 170–175. [Google Scholar] [CrossRef]
- Curran, P.J.; Dungan, J.L.; Gholz, H.L. Exploring the relationship between reflectance red edge and chlorophyll content in slash pine. Tree Physiol. 1990, 7, 33–48. [Google Scholar] [CrossRef]
- Demattê, J.A.M.; da Silva Terra, F. Spectral pedology: A new perspective on evaluation of soils along pedogenetic alterations. Geoderma 2014, 217–218, 190–200. [Google Scholar] [CrossRef]
- ASI. Hyperspectral Satellite, Capable of Observing from the Optical to the Near Infrared. Available online: https://www.asi.it/en/earth-science/prisma/ (accessed on 17 April 2021).
- Barducci, A.; Di Ninni, P.; Guzzi, D.; Lastri, C.; Nardino, V.; Pippi, I.; Raimondi, V. The OPTIMA project: Data simulation and correction procedures for PRISMA mission products. In Proceedings of the Sensors, Systems, and Next-Generation Satellites XVIII, Amsterdam, The Netherlands, 22–25 September 2014; Volume 9241, p. 92411X. [Google Scholar]
- Vermeulen, C.; Lejeune, P.; Lisein, J.; Sawadogo, P.; Bouché, P. Unmanned Aerial Survey of Elephants. PLoS ONE 2013, 8, e54700. [Google Scholar] [CrossRef] [PubMed]
- Puliti, S.; Ørka, H.O.; Gobakken, T.; Næsset, E. Inventory of small forest areas using an unmanned aerial system. Remote Sens. 2015, 7, 9632–9654. [Google Scholar] [CrossRef]
- Rossi, G.; Nocentini, M.; Lombardi, L.; Vannocci, P.; Tanteri, L.; Dotta, G.; Bicocchi, G.; Scaduto, G.; Salvatici, T.; Tofani, V.; et al. Integration of multicopter drone measurements and ground-based data for landslide monitoring. In Landslides and Engineered Slopes. Experience, Theory and Practice; CRC Press: London, UK, 2019; pp. 1745–1750. [Google Scholar]
- Gupta, S.K.; Shukla, D.P. Application of drone for landslide mapping, dimension estimation and its 3D reconstruction. J. Indian Soc. Remote Sens. 2018, 46, 903–914. [Google Scholar] [CrossRef]
- Rossi, G.; Tanteri, L.; Tofani, V.; Vannocci, P.; Moretti, S.; Casagli, N. Brief Communication: Use of multicopter drone optical images for landslide mapping and characterization. Nat. Hazards Earth Syst. Sci. Discuss 2017. [Google Scholar] [CrossRef]
- Drones Imaging. NDVI Cameras. Available online: https://www.dronesimaging.com/en/solutions/ndvi-cameras/ (accessed on 25 March 2021).
- Meddens, A.J.H.; Kolden, C.A.; Lutz, J.A. Detecting unburned areas within wildfire perimeters using Landsat and ancillary data across the northwestern United States. Remote Sens. Environ. 2016, 186, 275–285. [Google Scholar] [CrossRef]
- Rossi, G.; Tanteri, L.; Tofani, V.; Vannocci, P.; Moretti, S.; Casagli, N. Multitemporal UAV surveys for landslide mapping and characterization. Landslides 2018, 15, 1045–1052. [Google Scholar] [CrossRef]
- Dawson, T.P.; North, P.R.J.; Plummer, S.E.; Curran, P.J. Forest ecosystem chlorophyll content: Implications for remotely sensed estimates of net primary productivity. Int. J. Remote Sens. 2003, 24, 611–617. [Google Scholar] [CrossRef]
- García, M.J.L.; Caselles, V. Mapping burns and natural reforestation using thematic mapper data. Geocarto Int. 1991, 6, 31–37. [Google Scholar] [CrossRef]
- Basso, B.; Cammarano, D.; De Vita, P. Remotely sensed vegetation indices: Theory and applications for crop management. Riv. Ital. Agrometeorol. 2004, 1, 36–53. [Google Scholar]
- Parks, S.A.; Dillon, G.K.; Miller, C. A new metric for quantifying burn severity: The relativized burn ratio. Remote Sens. 2014, 6, 1827–1844. [Google Scholar] [CrossRef]
- Miller, J.D.; Thode, A.E. Quantifying burn severity in a heterogeneous landscape with a relative version of the delta Normalized Burn Ratio (dNBR). Remote Sens. Environ. 2007, 109, 66–80. [Google Scholar] [CrossRef]
- Serco Italia SPA. Burned Area Mapping with Sentinel-2 (SNAP), Portugal (Version 1.2). Retrieved from RUS Lectures. Available online: https://rus-copernicus.eu/portal/the-rus-library/learn-by-yourself/ (accessed on 17 May 2021).
- Pan, H.; Chen, Z.; Ren, J.; Li, H.; Wu, S. Modeling Winter Wheat Leaf Area Index and Canopy Water Content with Three Different Approaches Using Sentinel-2 Multispectral Instrument Data. IEEE J. Sel. Top. Appl. Earth Obs. Remote Sens. 2019, 12, 482–492. [Google Scholar] [CrossRef]
- Zuhlke, M.; Fomferra, N.; Brockmann, C.; Peters, M.; Veci, L.; Malik, J.; Regner, P. SNAP (Sentinel Application Platform) and the ESA Sentinel 3 Toolbox—NASA/ADS. In Proceedings of the Sentinel-3 for Science Workshop, Venice, Italy, 2–5 June 2015. [Google Scholar]
- QGIS.org. QGIS Geographic Information System. Available online: https://guides.nyu.edu/gis/qgis (accessed on 17 May 2021).
- Weiss, M.; Baret, F. S2ToolBox Level 2 Products: LAI, FAPAR, FCOVER; Institut National de la Recherche Agronomique: Avignon, France, 2016; Available online: https://step.esa.int/docs/extra/ATBD_S2ToolBox_L2B_V1.1.pdf (accessed on 17 May 2021).
- DGADR. Direção-Geral de Agricultura e Desenvolvimento Rural. Available online: https://www.dgadr.gov.pt/index.php?option=com_content&view=article&id=342 (accessed on 17 May 2021).
- Climate-Data.org. Castanheira de Pera Climate. Available online: https://en.climate-data.org/europe/portugal/castanheira-de-pera/castanheira-de-pera-882485/ (accessed on 17 May 2021).
- Vega, J.A.; Fontúrbel, T.; Merino, A.; Fernández, C.; Ferreiro, A.; Jiménez, E. Testing the ability of visual indicators of soil burn severity to reflect changes in soil chemical and microbial properties in pine forests and shrubland. Plant Soil 2013, 369, 73–91. [Google Scholar] [CrossRef]
- Regione Toscana. Incendio Boschivo a Vinchiana, Lucca—Toscana Notizie. Available online: https://www.toscana-notizie.it/-/incendio-boschivo-a-vinchiana-lucca (accessed on 17 August 2019).
- Climate-Data.org. Clima Lucca: Temperatura, Medie Climatiche, Pioggia Lucca. Grafico Pioggia e Grafico Temperatura Lucca—Climate-Data.org. Available online: https://it.climate-data.org/europa/italia/tuscany/lucca-718595/ (accessed on 17 May 2021).
- EU. Copernicus programme European Digital Elevation Model (EU-DEM); Version 1.1; EU: Brussels, Belgium, 2016. [Google Scholar]
- Sentinel Hub. Copernicus Sentinel-2 Modified Data, Processed with EO. Available online: https://apps.sentinel-hub.com/eo-browser/?zoom=11&lat=39.97107&lng=-8.22395&themeId=WILDFIRES-NORMAL-MODE&visualizationUrl=https%3A%2F%2Fservices.sentinel-hub.com%2Fogc%2Fwms%2Faae18701-6b25-4001-8b2a-b98a1b3806c1&datasetId=S2L2A&fromTime=2017-07-29T00%3A00%3A00.000Z&toTime=2017-07-29T23%3A59%3A59.999Z&layerId=BURNED-AREAS-DETECTION (accessed on 17 May 2021).
- EU. Copernicus Programme Corine Land Cover (CLC) 2012; Version 2020_20u1; EU: Brussels, Belgium, 2020. [Google Scholar]
- EU. Copernicus Programme Corine Land Cover (CLC) Classes. Available online: https://land.copernicus.eu/Corinelandcoverclasses.eps.75dpi.png/image_view_fullscreen (accessed on 20 May 2021).
- Regione Toscana. Uso e Copertura del Suolo, UCS10k 2019—Total Rendering. 2019. Available online: http://www502.regione.toscana.it/geoscopio/servizi/wms/USO_E_COPERTURA_DEL_SUOLO.htm (accessed on 20 May 2021).
- van der Linden, S.; Rabe, A.; Held, M.; Jakimow, B.; Leitão, P.J.; Okujeni, A.; Schwieder, M.; Suess, S.; Hostert, P. The EnMAP-box-A toolbox and application programming interface for EnMAP data processing. Remote Sens. 2015, 7, 11249–11266. [Google Scholar] [CrossRef]
- McFeeters, S.K. The use of the Normalized Difference Water Index (NDWI) in the delineation of open water features. Int. J. Remote Sens. 1996, 17, 1425–1432. [Google Scholar] [CrossRef]
- UN-SPIDER. Knowledge Portal Normalized Burn Ratio (NBR). Available online: https://un-spider.org/advisory-support/recommended-practices/recommended-practice-burn-severity/in-detail/normalized-burn-ratio (accessed on 20 December 2020).
- Kokaly, R.F.; Rockwell, B.W.; Haire, S.L.; King, T.V.V. Characterization of post-fire surface cover, soils, and burn severity at the Cerro Grande Fire, New Mexico, using hyperspectral and multispectral remote sensing. Remote Sens. Environ. 2007, 106, 305–325. [Google Scholar] [CrossRef]
- Agisoft. PhotoScan—Photogrammetric Processing of Digital Images and 3D Spatial Data Generation. 2018. Available online: https://www.agisoft.com/ (accessed on 20 May 2020).
- Veraverbeke, S.; Dennison, P.; Gitas, I.; Hulley, G.; Kalashnikova, O.; Katagis, T.; Kuai, L.; Meng, R.; Roberts, D.; Stavros, N. Hyperspectral remote sensing of fire: State-of-the-art and future perspectives. Remote Sens. Environ. 2018, 216, 105–121. [Google Scholar] [CrossRef]
- Pausas, J.G.; Fernández-Muñoz, S. Fire regime changes in the Western Mediterranean Basin: From fuel-limited to drought-driven fire regime. Clim. Chang. 2012, 110, 215–226. [Google Scholar] [CrossRef]
- Robichaud, P.R.; Lewis, S.A.; Laes, D.Y.M.; Hudak, A.T.; Kokaly, R.F.; Zamudio, J.A. Postfire soil burn severity mapping with hyperspectral image unmixing. Remote Sens. Environ. 2007, 108, 467–480. [Google Scholar] [CrossRef]
- Whitehead, K.; Hugenholtz, C.H. Remote sensing of the environment with small unmanned aircraft systems (Uass), part 1: A review of progress and challenges. J. Unmanned Veh. Syst. 2014, 2, 69–85. [Google Scholar] [CrossRef]
- Fraser, R.H.; van der Sluijs, J.; Hall, R.J. Calibrating satellite-based indices of burn severity from UAV-derived metrics of a burned boreal forest in NWT, Canada. Remote Sens. 2017, 9, 279. [Google Scholar] [CrossRef]
- Shin, J.I.; Seo, W.W.; Kim, T.; Park, J.; Woo, C.S. Using UAV multispectral images for classification of forest burn severity—A case study of the 2019 Gangneung forest fire. Forests 2019, 10, 1025. [Google Scholar] [CrossRef]
- Ambrosia, V.G.; Wegener, S.; Zajkowski, T.; Sullivan, D.V.; Buechel, S.; Enomoto, F.; Lobitz, B.; Johan, S.; Brass, J.; Hinkley, E. The Ikhana unmanned airborne system (UAS) western states fire imaging missions: From concept to reality (2006–2010). Geocarto Int. 2011, 26, 85–101. [Google Scholar] [CrossRef]
- Sankey, T.; Donager, J.; McVay, J.; Sankey, J.B. UAV lidar and hyperspectral fusion for forest monitoring in the southwestern USA. Remote Sens. Environ. 2017, 195, 30–43. [Google Scholar] [CrossRef]
- Espinoza, C.Z.; Khot, L.R.; Sankaran, S.; Jacoby, P.W. High resolution multispectral and thermal remote sensing-based water stress assessment in subsurface irrigated grapevines. Remote Sens. 2017, 9, 961. [Google Scholar] [CrossRef]
- Frodella, W.; Elashvili, M.; Spizzichino, D.; Gigli, G.; Adikashvili, L.; Vacheishvili, N.; Kirkitadze, G.; Nadaraia, A.; Margottini, C.; Casagli, N. Combining infrared thermography and UAV digital photogrammetry for the protection and conservation of rupestrian cultural heritage sites in Georgia: A methodological application. Remote Sens. 2020, 12, 892. [Google Scholar] [CrossRef]
- Frodella, W.; Lazzeri, G.; Moretti, S.; Keizer, J.; Verheijen, F.G.A. Applying infrared thermography to soil surface temperature monitoring: Case study of a high-resolution 48 h survey in a vineyard (Anadia, Portugal). Sensors 2020, 20, 2444. [Google Scholar] [CrossRef]
- Lourenco, L.; Nunes, A.; Bento-Goncalves, A.; Vieir, A. Soil Erosion After Wildfires in Portugal: What Happens When Heavy Rainfall Events Occur? In Research on Soil Erosion; InTech: London, UK, 2012. [Google Scholar]
- Araújo Santos, L.M.; Correia, A.J.P.M.; Coelho, P.A.L.F. Post-wildfire slope stability effects and mitigation: A case study from hilly terrains with unmanaged forest. SN Appl. Sci. 2020, 2, 1–21. [Google Scholar] [CrossRef]
- Ozturk, U.; Tarakegn, Y.A.; Longoni, L.; Brambilla, D.; Papini, M.; Jensen, J. A simplified early-warning system for imminent landslide prediction based on failure index fragility curves developed through numerical analysis. Geomat. Nat. Hazards Risk 2016, 7, 1406–1425. [Google Scholar] [CrossRef]
- Agee, J.K. Fire Ecology of Pacific Northwest Forests; Island Press: Washington, DC, USA, 1993. [Google Scholar]
- Cao, C.Y.; Lam, N. Understanding the scale and resolution effects in remote sensing and GIS. In Scale in Remote Sensing and GIS; Quattrocchi, D.A., Goodchild, M.F., Eds.; Lewis Publisher: Boca Raton, FL, USA, 1997; pp. 57–72. ISBN 9781566701044. [Google Scholar]
- Bian, L. Multiscale nature of spatial data in scaling up environmental models. In Scale in Remote Sensing and GIS; Quattrocchi, D.A., Goodchild, M.F., Eds.; Lewis Publisher: Boca Raton, FL, USA, 1997; pp. 13–26. ISBN 9781566701044. [Google Scholar]
- Finke, P.A.; Bierkens, M.F.; De Willigen, P. Upscaling and Downscaling Methods for Environmental Research; IAHS Publisher: Wageningen, The Netherlands, 2002; Volume 273. [Google Scholar]
- Hufkens, K.; Bogaert, J.; Dong, Q.H.; Lu, L.; Huang, C.L.; Ma, M.G.; Che, T.; Li, X.; Veroustraete, F.; Ceulemans, R. Impacts and uncertainties of upscaling of remote-sensing data validation for a semi-arid woodland. J. Arid Environ. 2008, 72, 1490–1505. [Google Scholar] [CrossRef]
- Su, L.; Li, X.; Liang, S.; Strahler, A.H. Simulation of scaling effects of thermal emission from non-isothermal pixels with the typical three-dimensional structure. Int. J. Remote Sens. 2003, 24, 3743–3753. [Google Scholar] [CrossRef]
- Jiang, Z.; Huete, A.R.; Chen, J.; Chen, Y.; Li, J.; Yan, G.; Zhang, X. Analysis of NDVI and scaled difference vegetation index retrievals of vegetation fraction. Remote Sens. Environ. 2006, 101, 366–378. [Google Scholar] [CrossRef]
- Wu, H.; Li, Z.L. Scale issues in remote sensing: A review on analysis, processing and modeling. Sensors 2009, 9, 1768–1793. [Google Scholar] [CrossRef]


| Nr. | Name | Start WL | Middle WL | End WL | Spectral Rn. | Spatial Res. | Purpose |
|---|---|---|---|---|---|---|---|
| 1 | 1 | 433 | 443 | 453 | 20 | 60 | Atmospheric correction (aerosol scattering) |
| 2 | 2 | 458 | 490 | 522 | 65 | 10 | Sensitive to vegetation senescing, carotenoid, browning, and soil background; atmospheric correction (aerosol scattering) |
| 3 | 3 | 543 | 560 | 577 | 35 | 10 | Green peak; sensitive to total chlorophyll in vegetation |
| 4 | 4 | 650 | 665 | 680 | 30 | 10 | Maximum chlorophyll absorption |
| 5 | 5 | 698 | 705 | 712 | 15 | 20 | Position of red edge; consolidation of atmospheric corrections–fluorescence baseline |
| 6 | 6 | 733 | 740 | 747 | 15 | 20 | Position of red edge, atmospheric correction; retrieval of aerosol load |
| 7 | 7 | 773 | 783 | 793 | 20 | 20 | LAI, edge of the NIR plateau |
| 8 | 8 | 785 | 842 | 899 | 115 | 10 | LAI |
| 9 | 8a | 855 | 865 | 875 | 20 | 20 | NIR plateau; sensitive to total chlorophyll, biomass, LAI, and protein; water vapor absorption reference; retrieval of aerosol load and type |
| 10 | 9 | 935 | 945 | 955 | 20 | 60 | Water vapor absorption; atmospheric correction |
| 11 | 10 | 1360 | 1375 | 1390 | 30 | 60 | Detection of thin cirrus for atmospheric correction |
| 12 | 11 | 1565 | 1610 | 1655 | 90 | 20 | Sensitive to lignin, starch, and forest aboveground biomass; snow–ice–cloud separation |
| 13 | 12 | 2100 | 2190 | 2280 | 180 | 20 | Assessment of Mediterranean vegetation conditions; distinction of clay soils for the monitoring of soil erosion; distinction between live biomass, dead biomass, and soil (e.g., for burn scars mapping) |
| PRISMA Sensors Characteristics | |
|---|---|
| Swath/FOV | 30 km/2.45° |
| GSD | Hyperspectral 30 m |
| Panchromatic 5 m | |
| Spatial pixels | Hyperspectral: 1000 |
| Panchromatic: 6000 | |
| Spectral range | VNIR: 400–1010 nm |
| SWIR: 920–2505 | |
| Spectral resolution | ≤12 nm |
| Spectral bands | VNIR: 66 |
| SWIR: 171 | |
| Radiometric quantization | 12 bit |
| Absolute radiometric accuracy | Better than 5% |
| Acquisition Date | Couplet |
|---|---|
| 04/06/2017 * | J_J_17 |
| 04/07/2017 | |
| 03/08/2017 | A_S_17 |
| 12/09/2017 | |
| 21/12/2017 | D_J_18 |
| 30/01/2018 | |
| 25/04/2018 | A_J_18 |
| 29/07/2018 | |
| 07/10/2018 | O_J_19 |
| 25/01/2019 | |
| 05/05/2019 | M_A_19 |
| 03/08/2019 |
| Severity Level | dNBR Range (Not Scaled) |
|---|---|
| Enhanced regrowth, high (post-fire) | −0.500 to −0.251 |
| Enhanced regrowth, low (post-fire) | −0.250 to −0.101 |
| Unburned | −0.100 to +0.99 |
| Low severity | +0.100 to +0.269 |
| Moderate–low severity | +0.270 to +0.439 |
| Moderate–high severity | +0.440 to +0.659 |
| High severity | +0.660 to +1.300 |
Publisher’s Note: MDPI stays neutral with regard to jurisdictional claims in published maps and institutional affiliations. |
© 2021 by the authors. Licensee MDPI, Basel, Switzerland. This article is an open access article distributed under the terms and conditions of the Creative Commons Attribution (CC BY) license (https://creativecommons.org/licenses/by/4.0/).
Share and Cite
Lazzeri, G.; Frodella, W.; Rossi, G.; Moretti, S. Multitemporal Mapping of Post-Fire Land Cover Using Multiplatform PRISMA Hyperspectral and Sentinel-UAV Multispectral Data: Insights from Case Studies in Portugal and Italy. Sensors 2021, 21, 3982. https://doi.org/10.3390/s21123982
Lazzeri G, Frodella W, Rossi G, Moretti S. Multitemporal Mapping of Post-Fire Land Cover Using Multiplatform PRISMA Hyperspectral and Sentinel-UAV Multispectral Data: Insights from Case Studies in Portugal and Italy. Sensors. 2021; 21(12):3982. https://doi.org/10.3390/s21123982
Chicago/Turabian StyleLazzeri, Giacomo, William Frodella, Guglielmo Rossi, and Sandro Moretti. 2021. "Multitemporal Mapping of Post-Fire Land Cover Using Multiplatform PRISMA Hyperspectral and Sentinel-UAV Multispectral Data: Insights from Case Studies in Portugal and Italy" Sensors 21, no. 12: 3982. https://doi.org/10.3390/s21123982
APA StyleLazzeri, G., Frodella, W., Rossi, G., & Moretti, S. (2021). Multitemporal Mapping of Post-Fire Land Cover Using Multiplatform PRISMA Hyperspectral and Sentinel-UAV Multispectral Data: Insights from Case Studies in Portugal and Italy. Sensors, 21(12), 3982. https://doi.org/10.3390/s21123982