
Grouping and Sponsoring Centric Green Coverage Model for Internet of Things

 ,
,  ,
,  ,
,  ,
,  and
and
Abstract
:1. Introduction
- Firstly, a network model for coverage redundancy management of sensors is presented considering the smart campus centric IoT environment.
- Secondly, a distributed fast converging grouping method is developed for optimal overlapping of active sensor management in coordinated network scenarios.
- Thirdly, a sponsoring aware sectorial coverage model is derived focusing on local group knowledge about redundant sensors and their coverage ranges.
- Finally, comparative performance evaluation of the proposed framework is carried out focusing on analytical, simulation, and hardware-based implementations and critical result discussions considering some recent literature in IoT.
2. Related Work
3. Grouping and Sponsoring Centric Green Computing for IoT
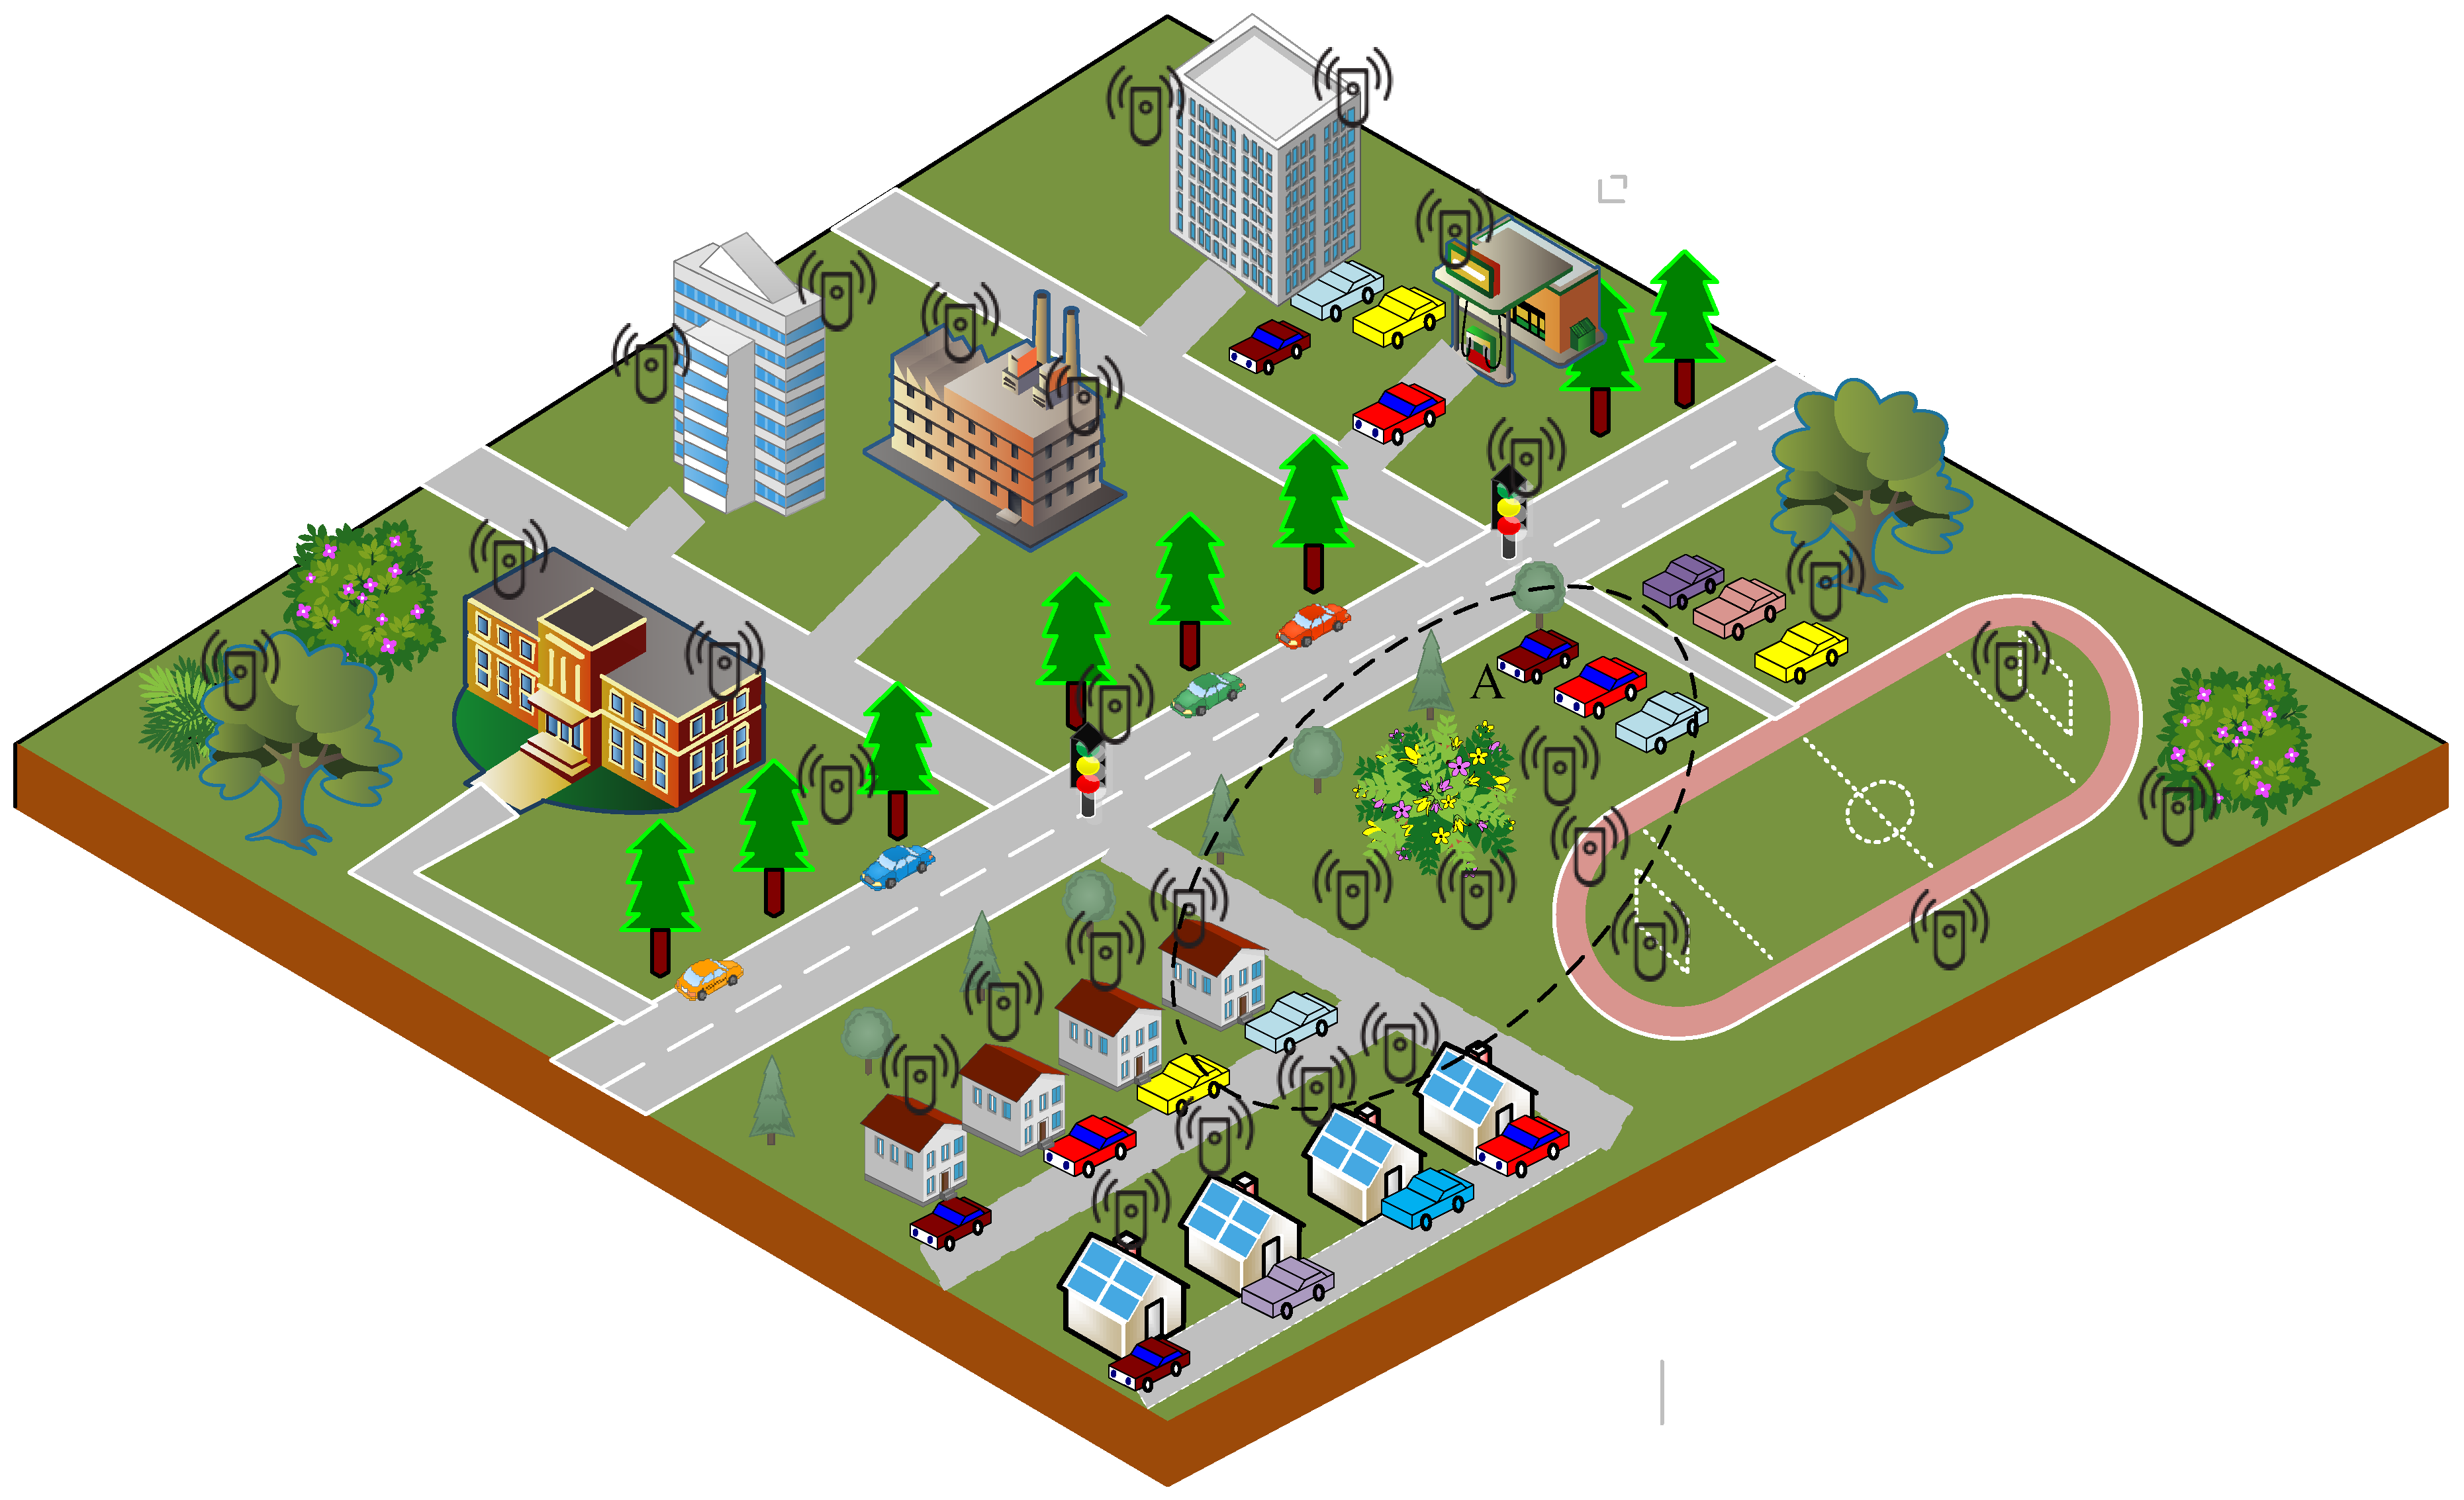
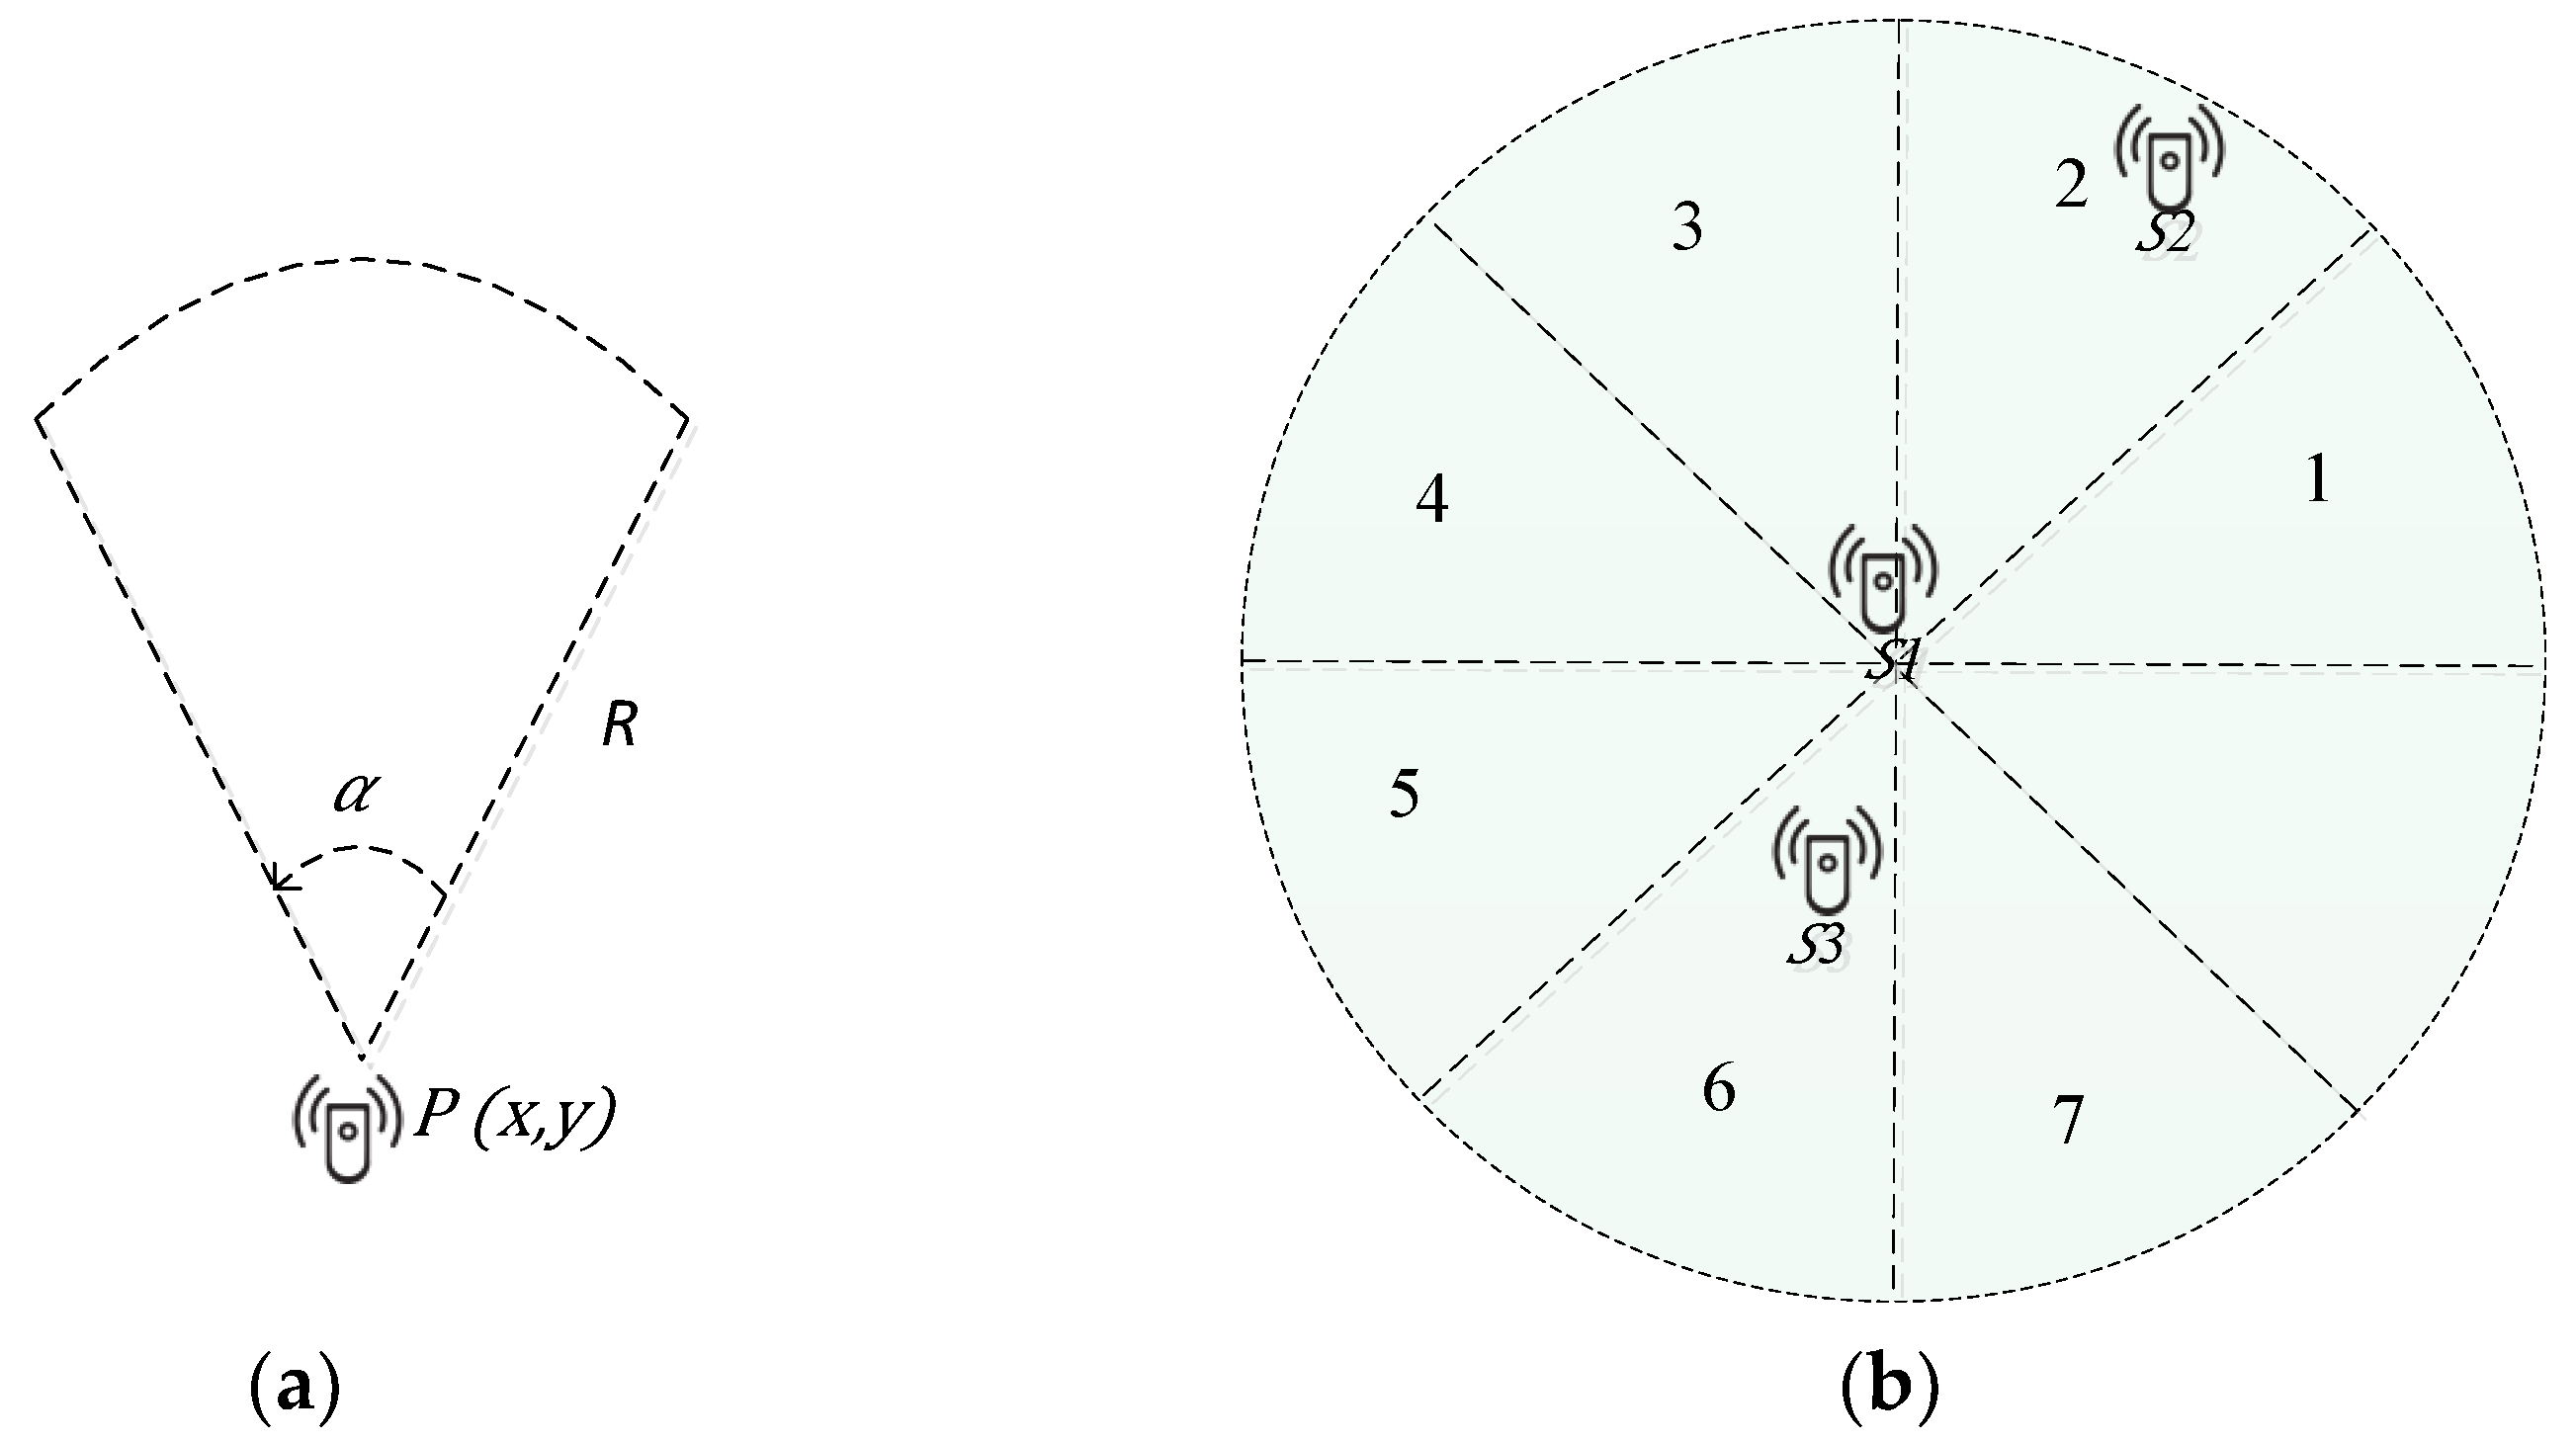
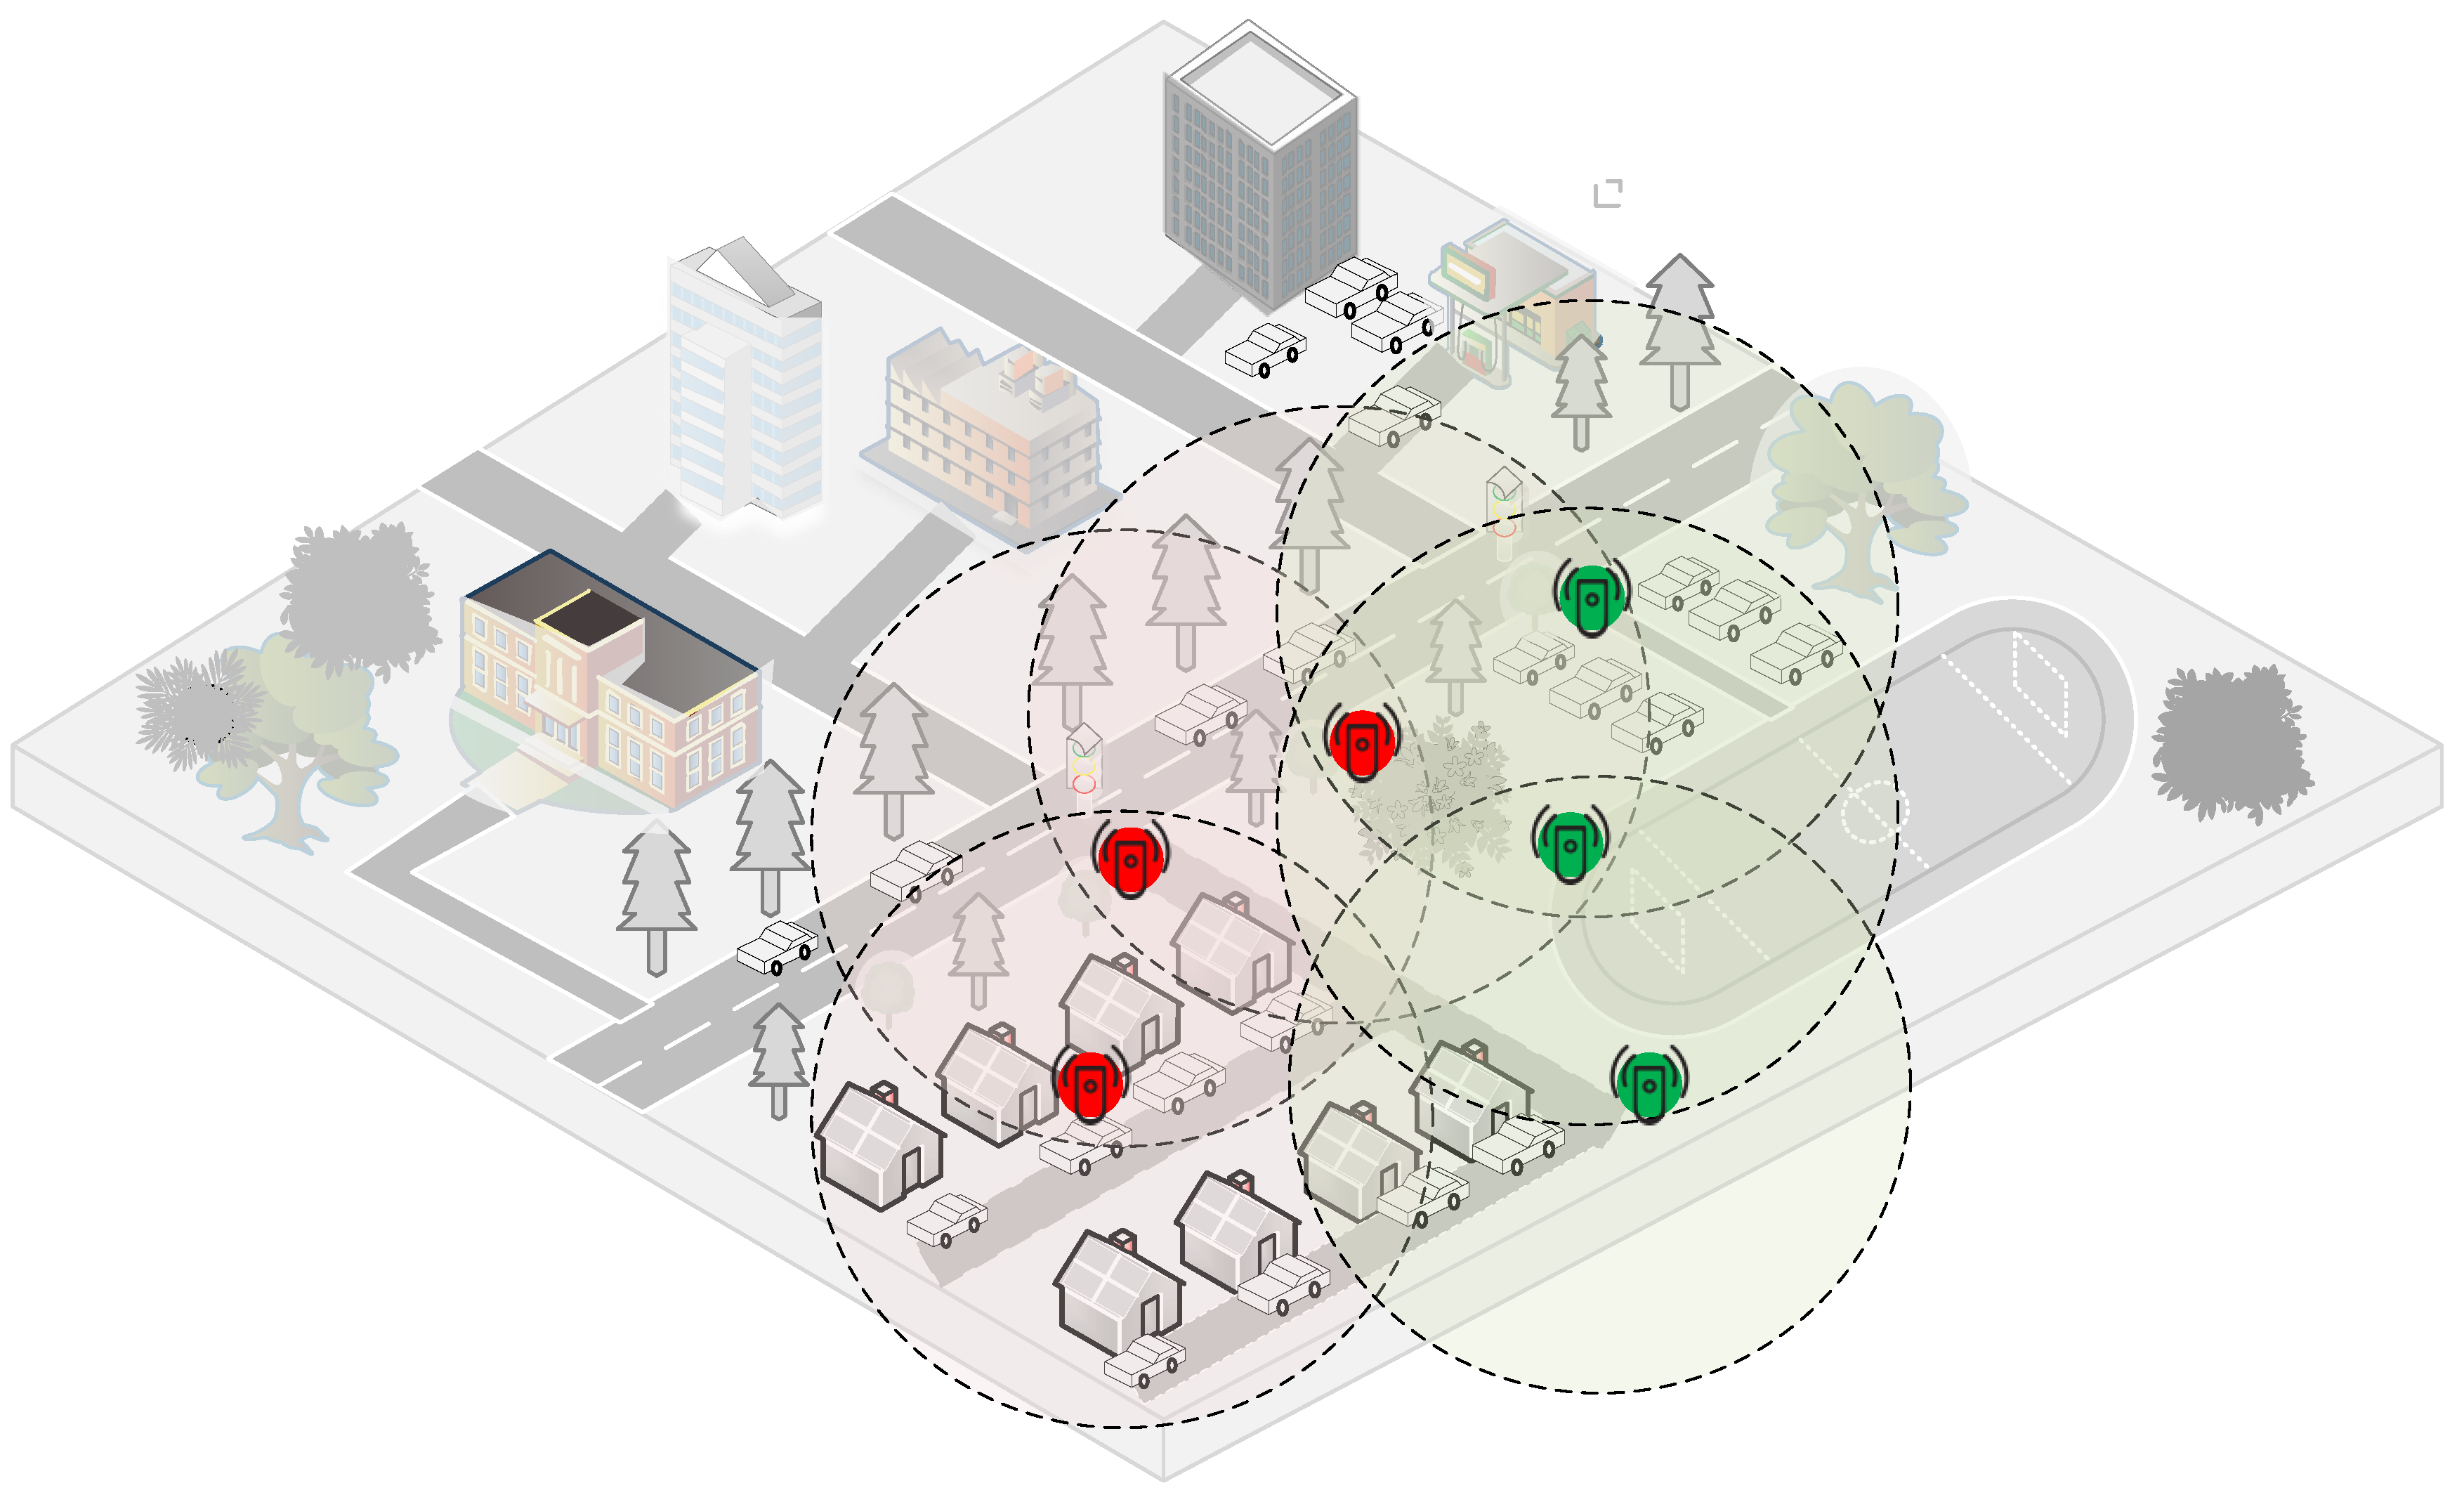
3.1. Network Model
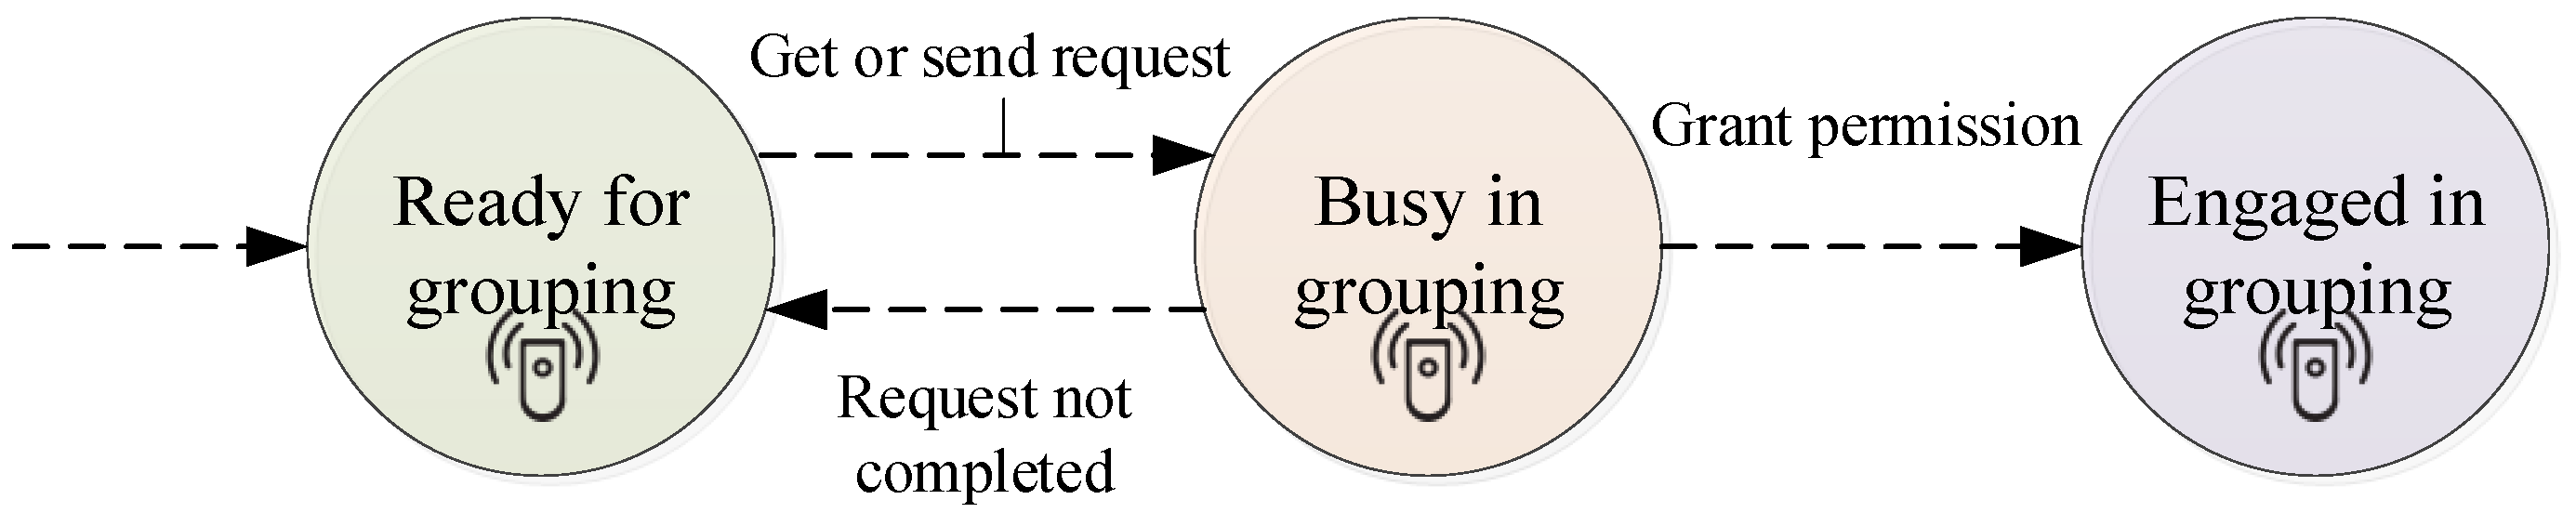
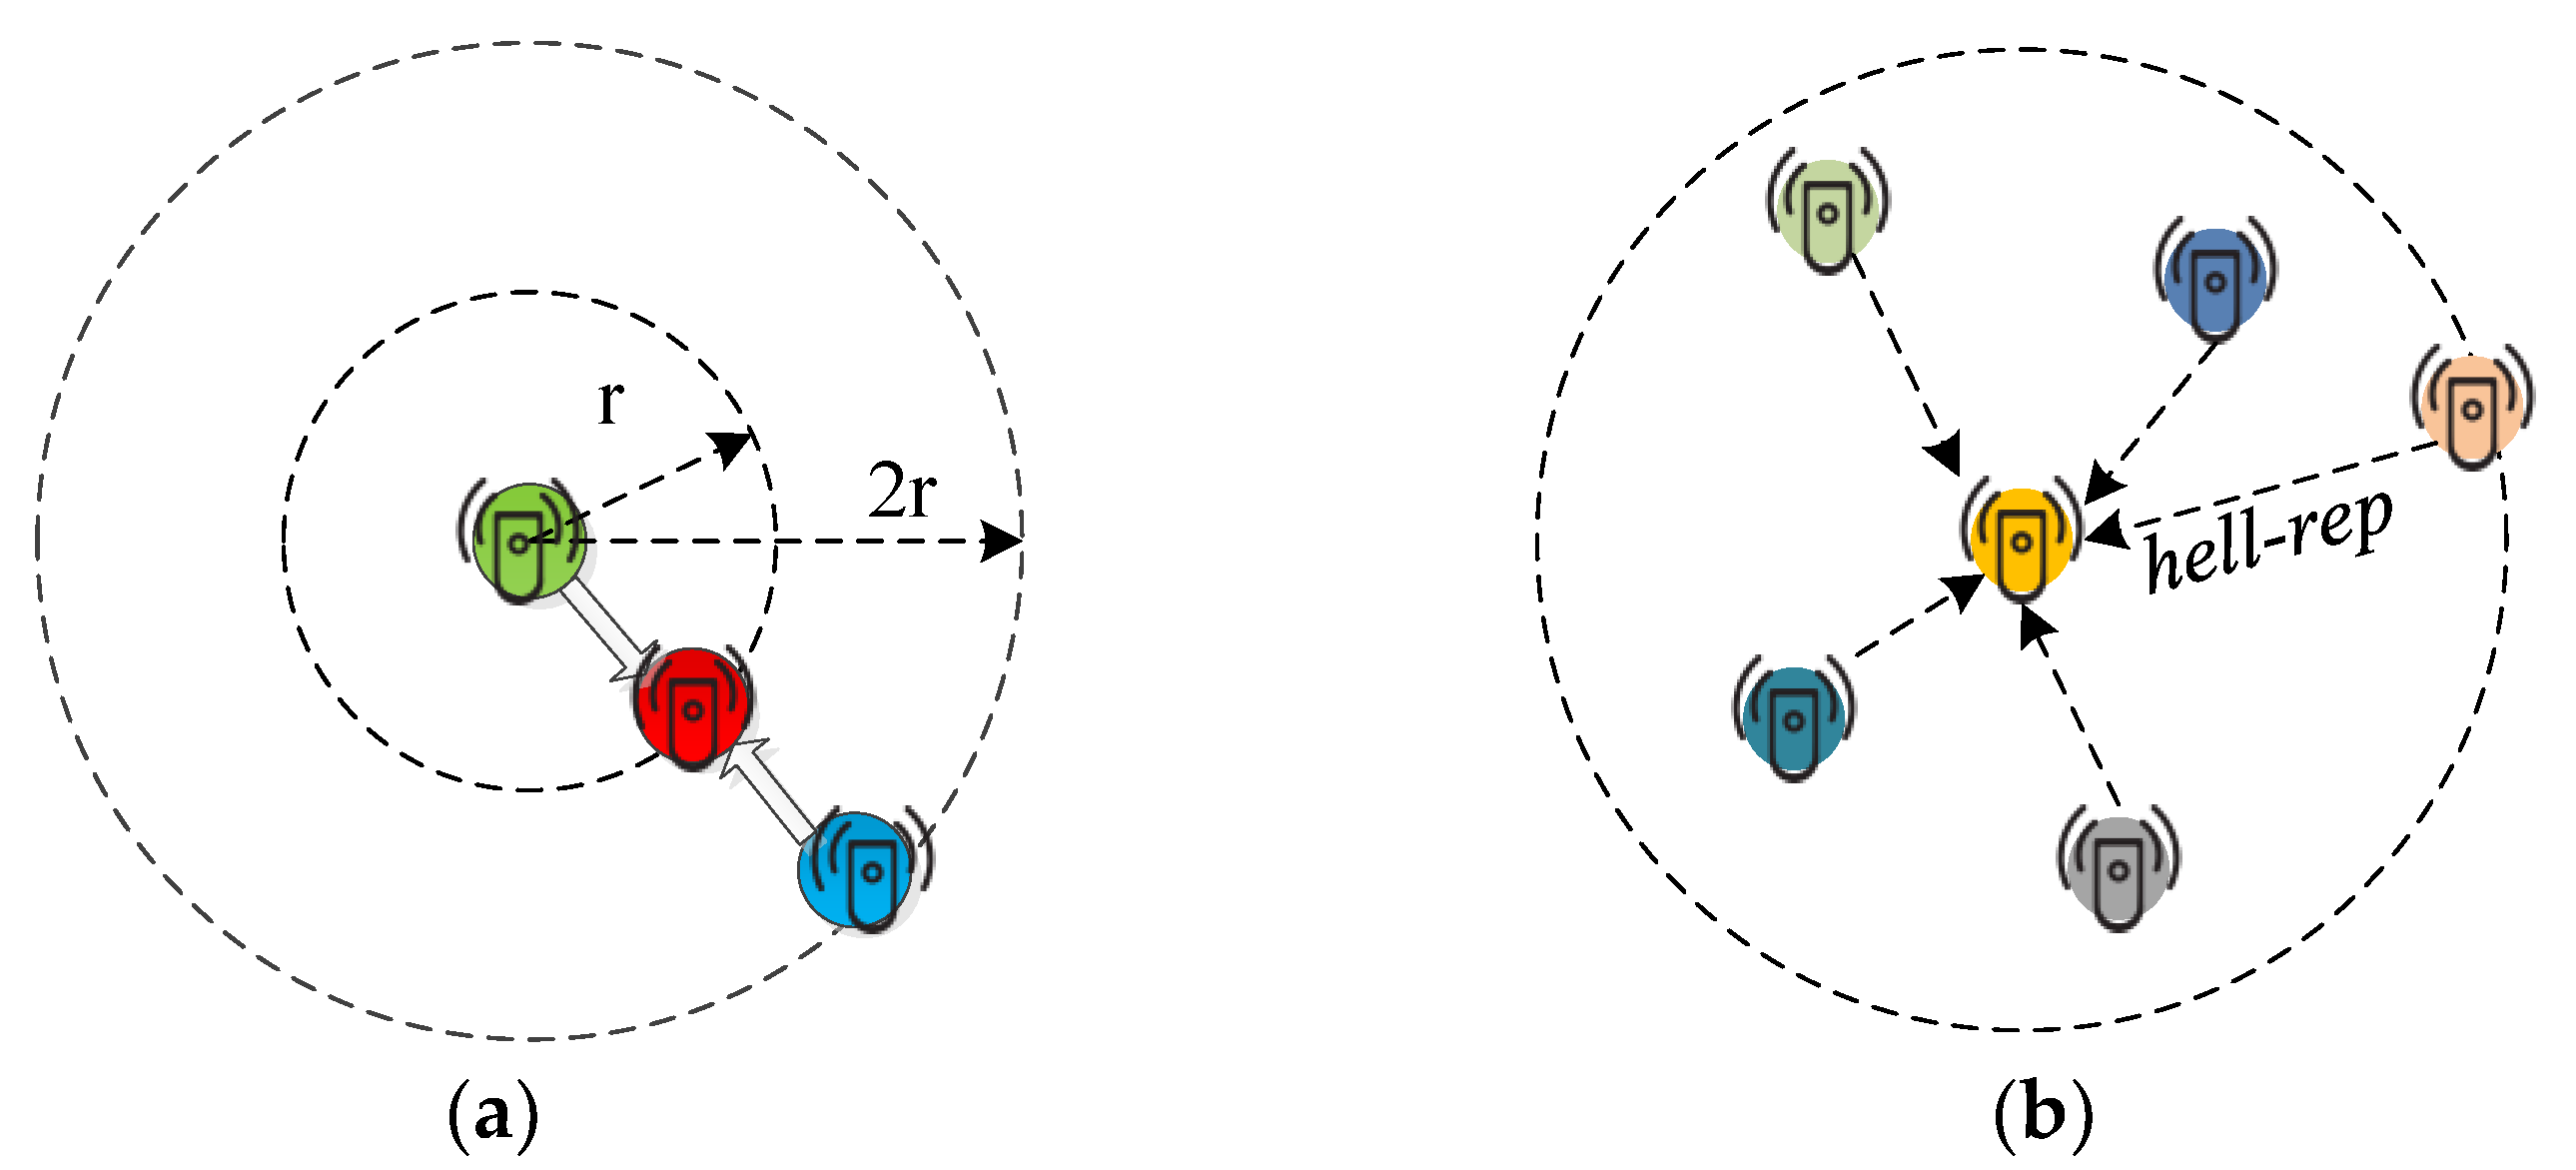
3.2. Fast Converging Grouping
| Algorithm 1: Fast Converging Grouping (FCG) |
|
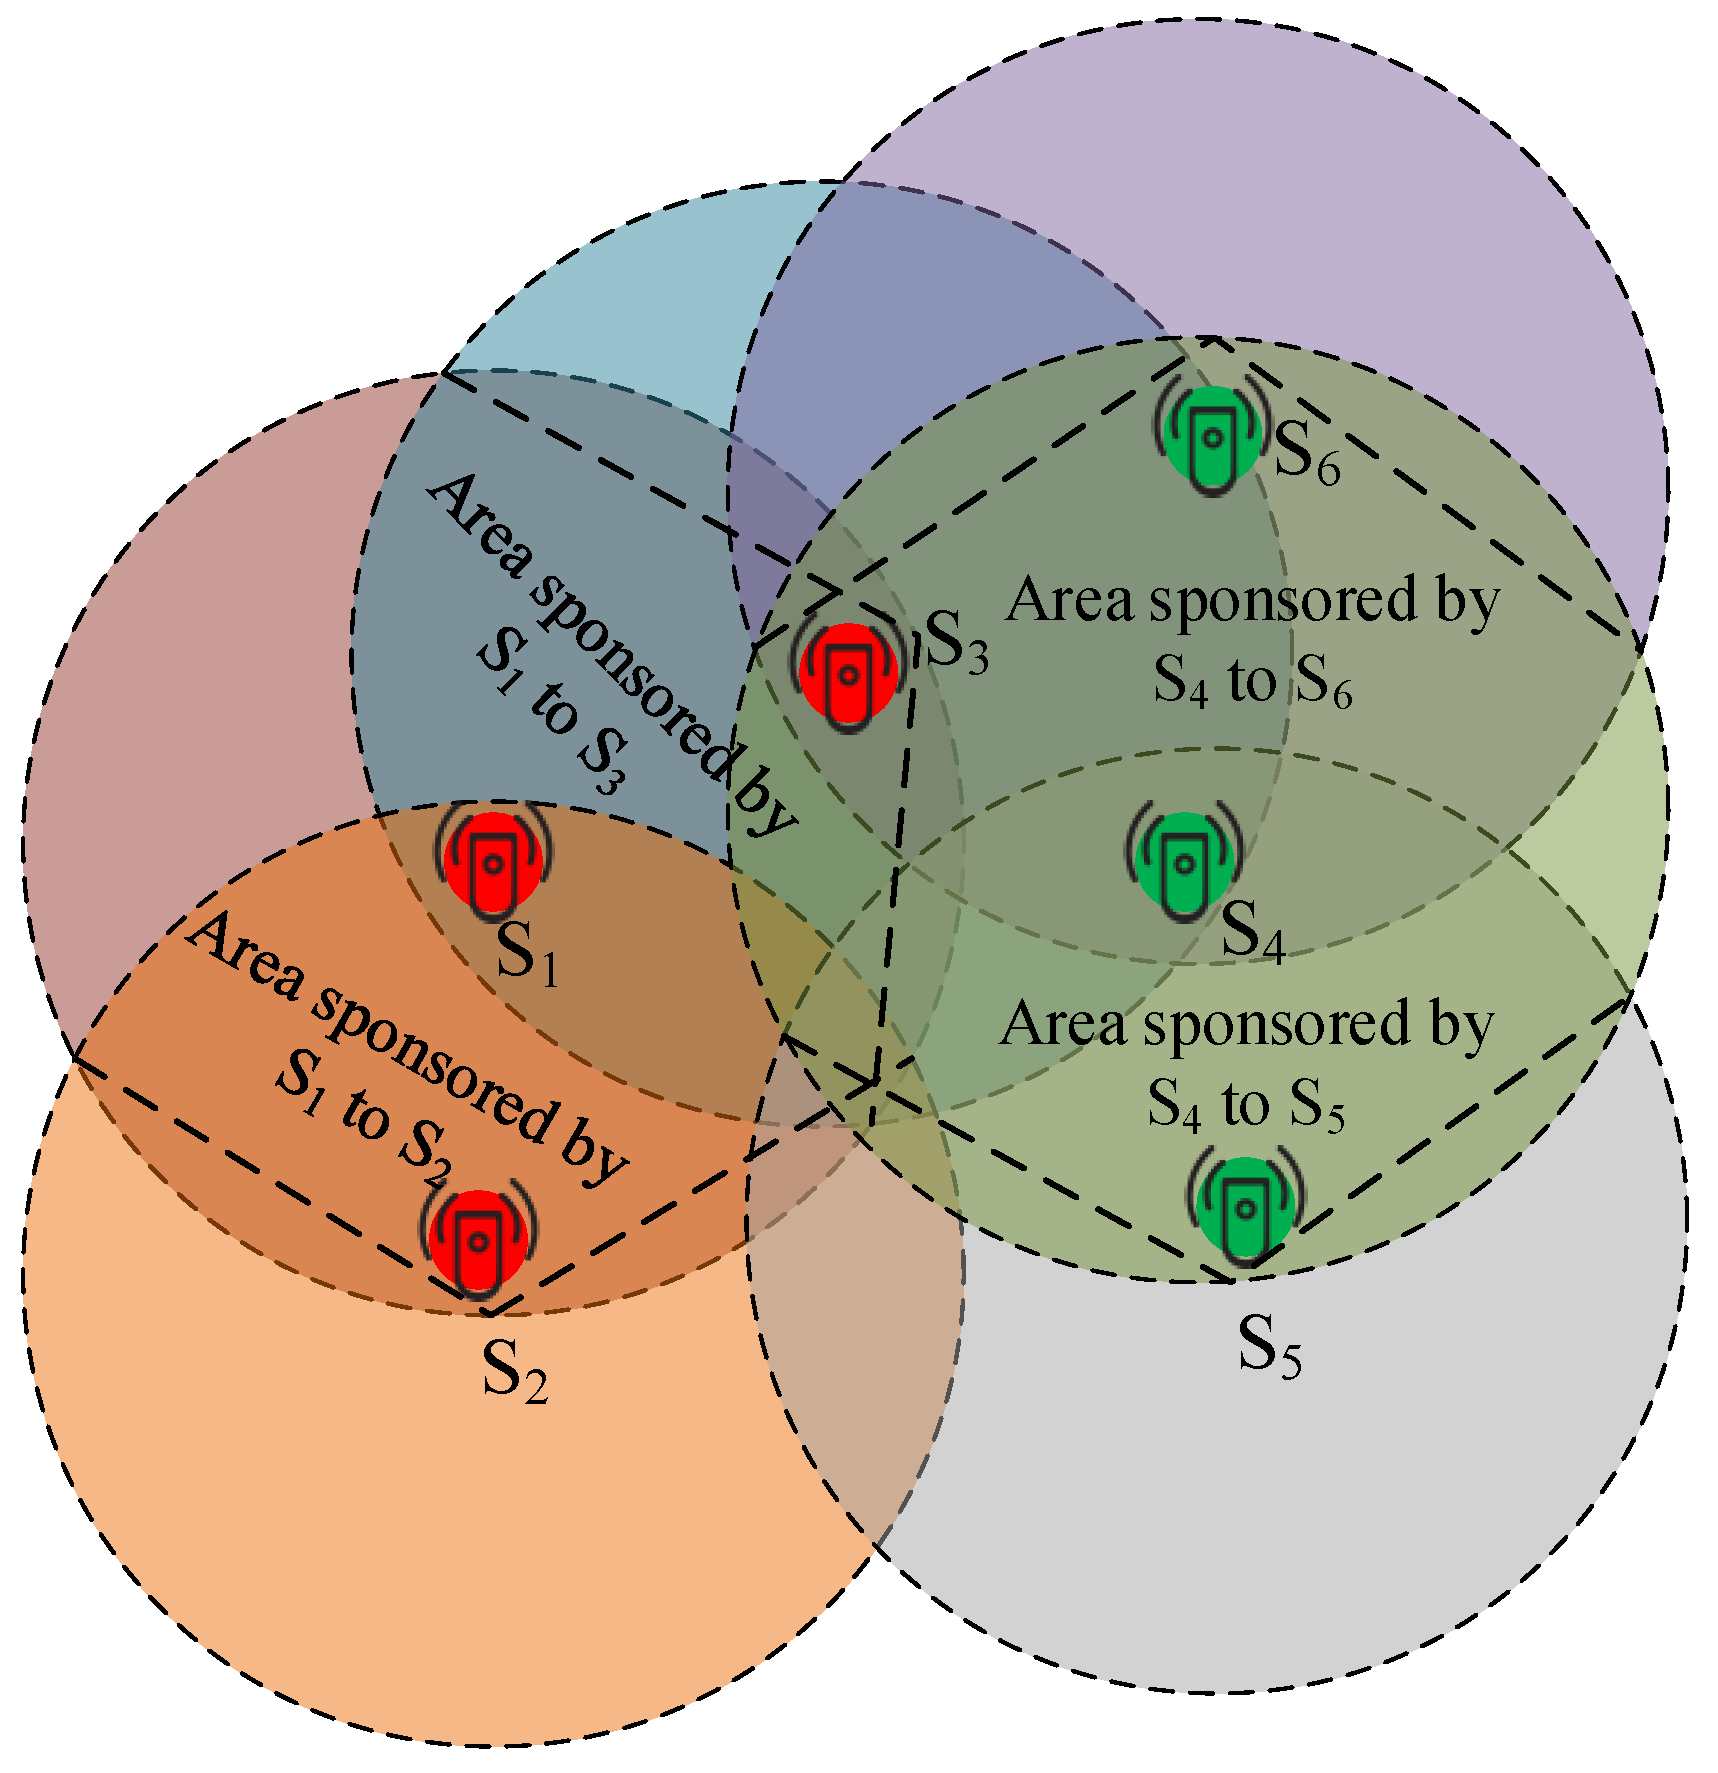
3.3. Sponsoring Aware Sectorial Coverage
3.4. Complexity Analysis
| Algorithm 2: Sponsoring Aware Sectorial Coverage (SSC) |
|
4. Performance Evaluation and Analysis of Experimental Results
4.1. Environmental Settings
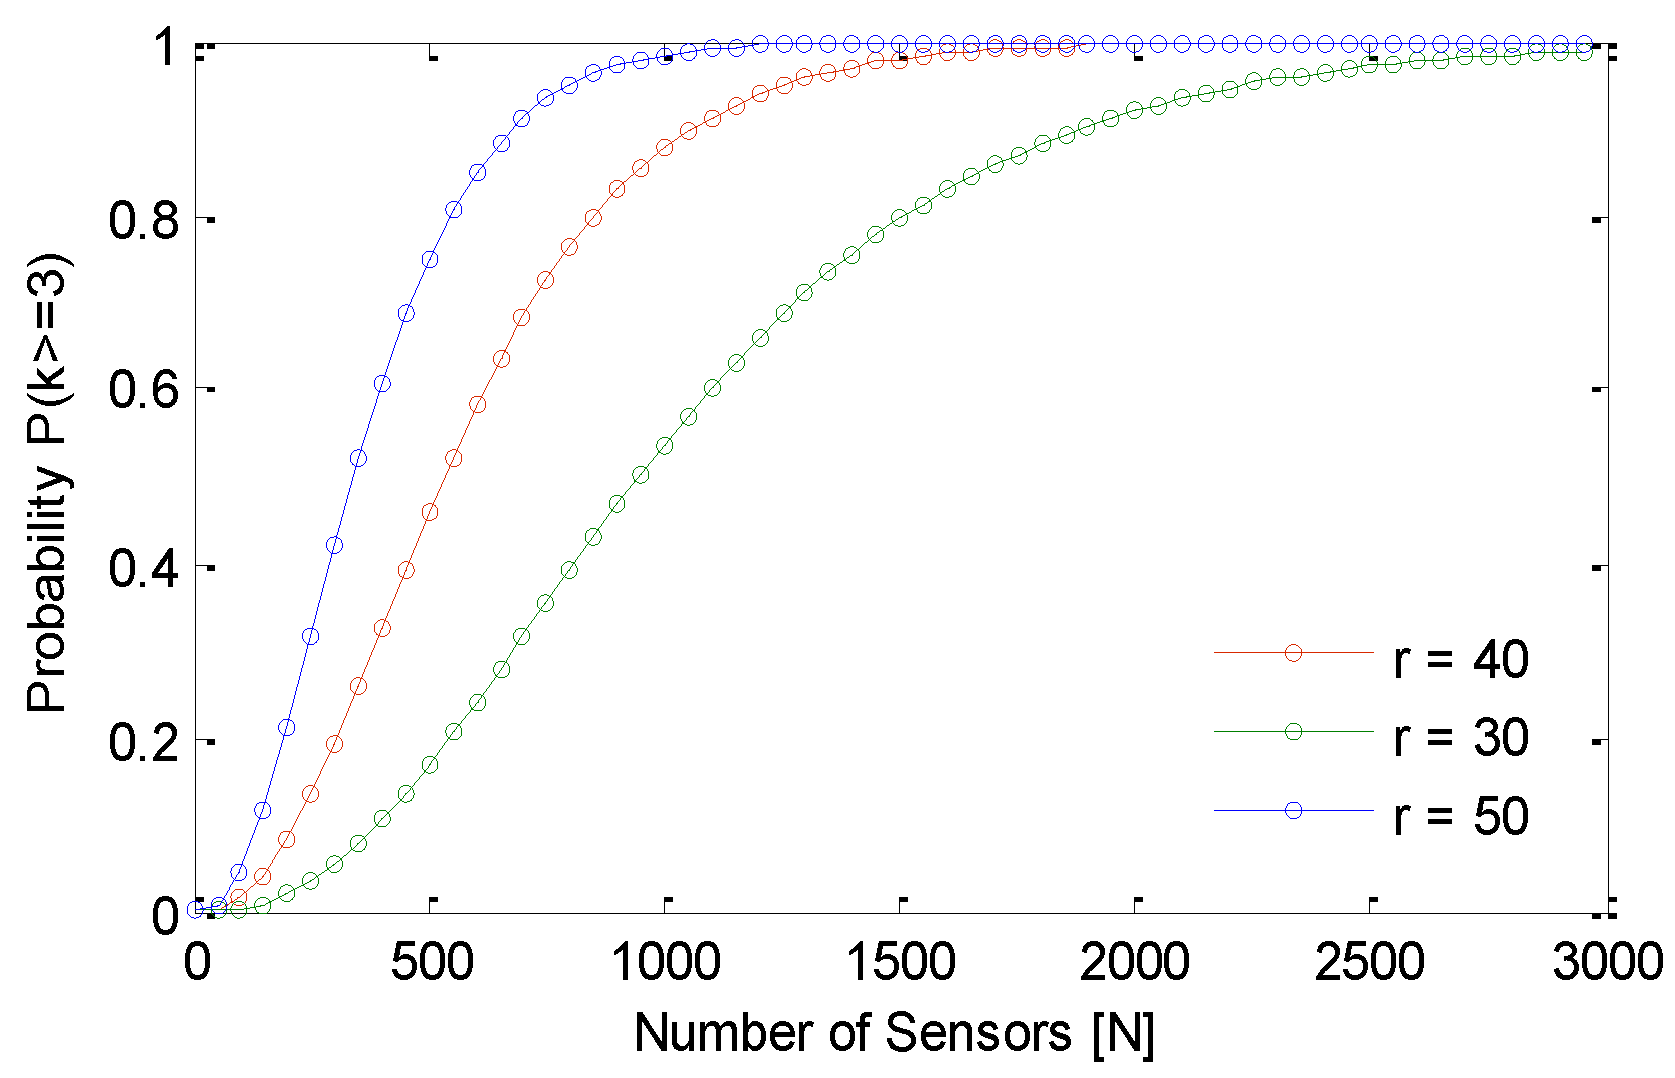
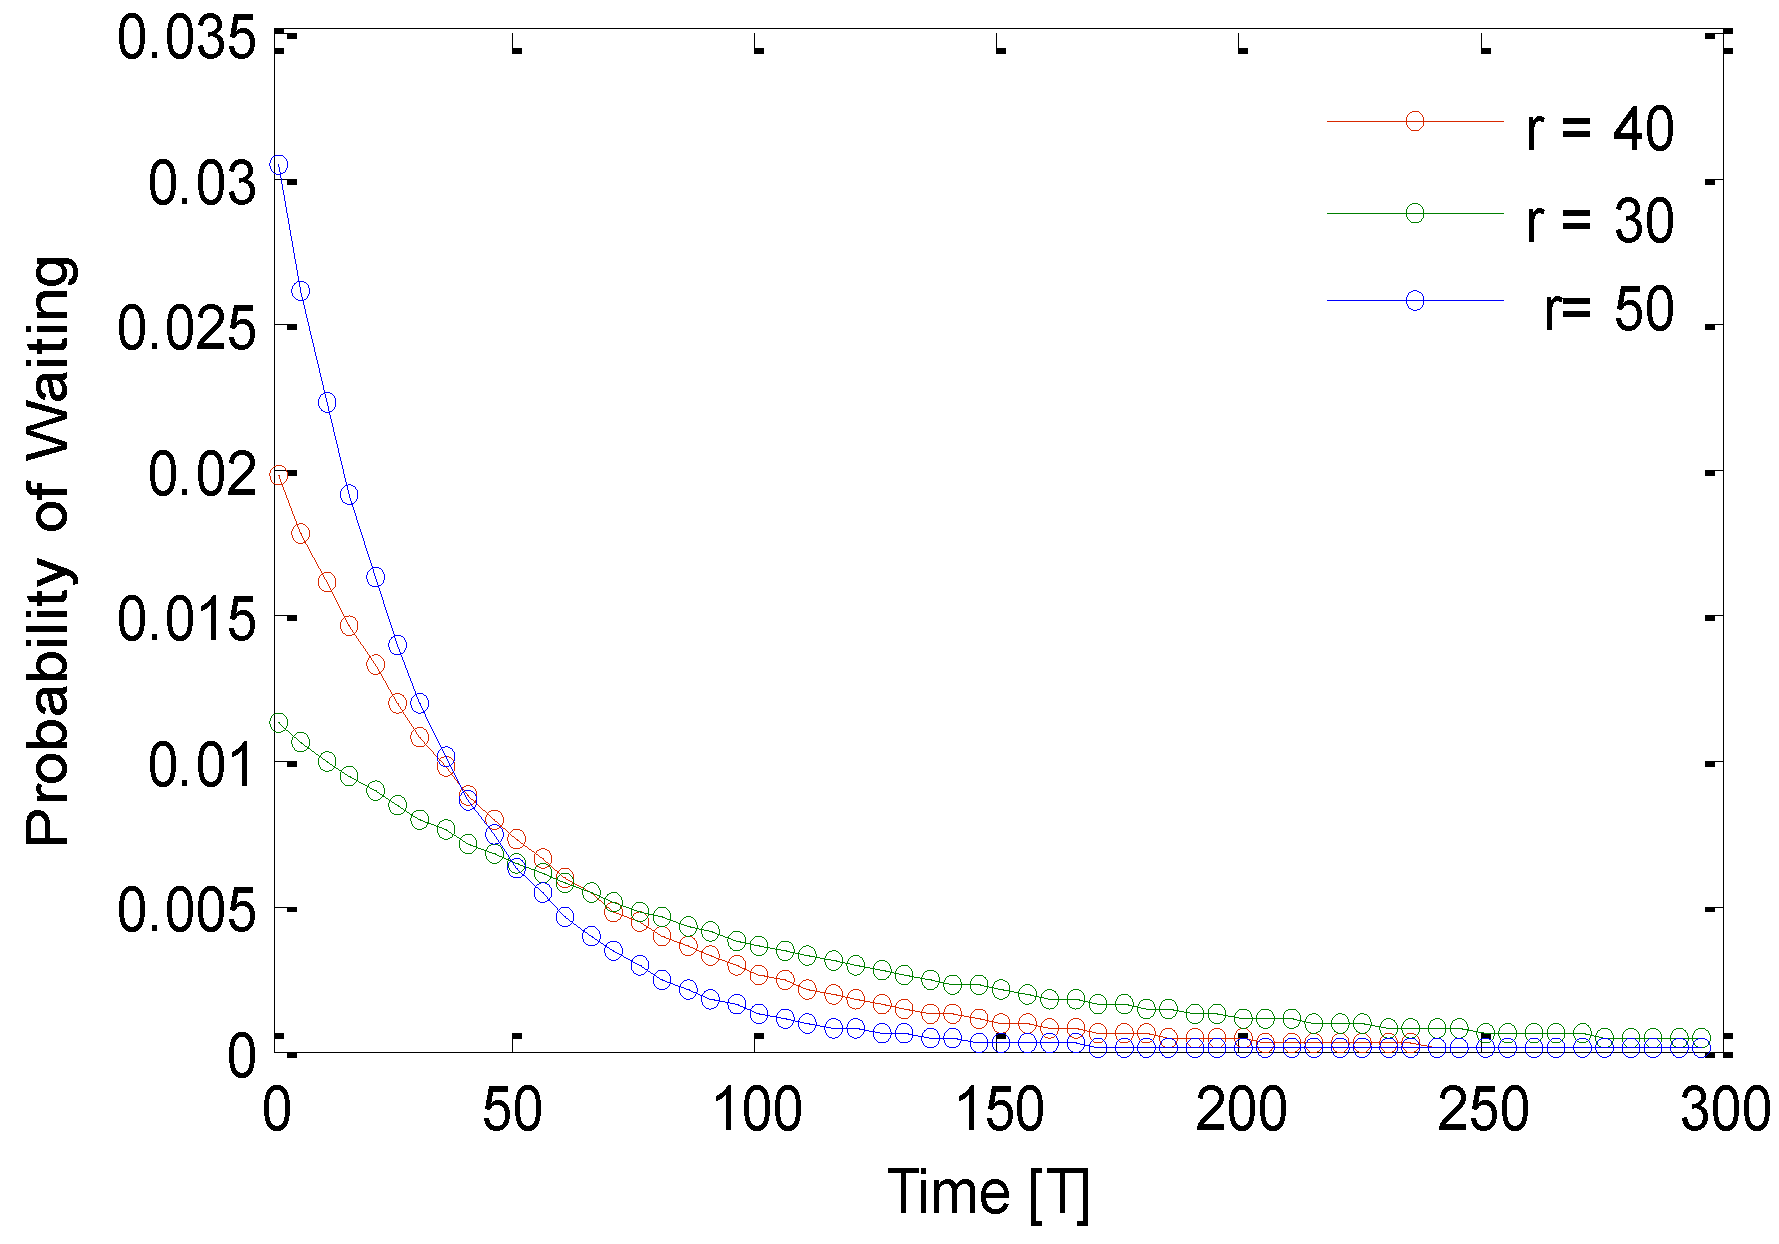
4.2. Analytical Result Discussion
4.3. Simulation Results Discussion
4.4. Hardware Result Discussion
4.5. Summary of Experimental Observations
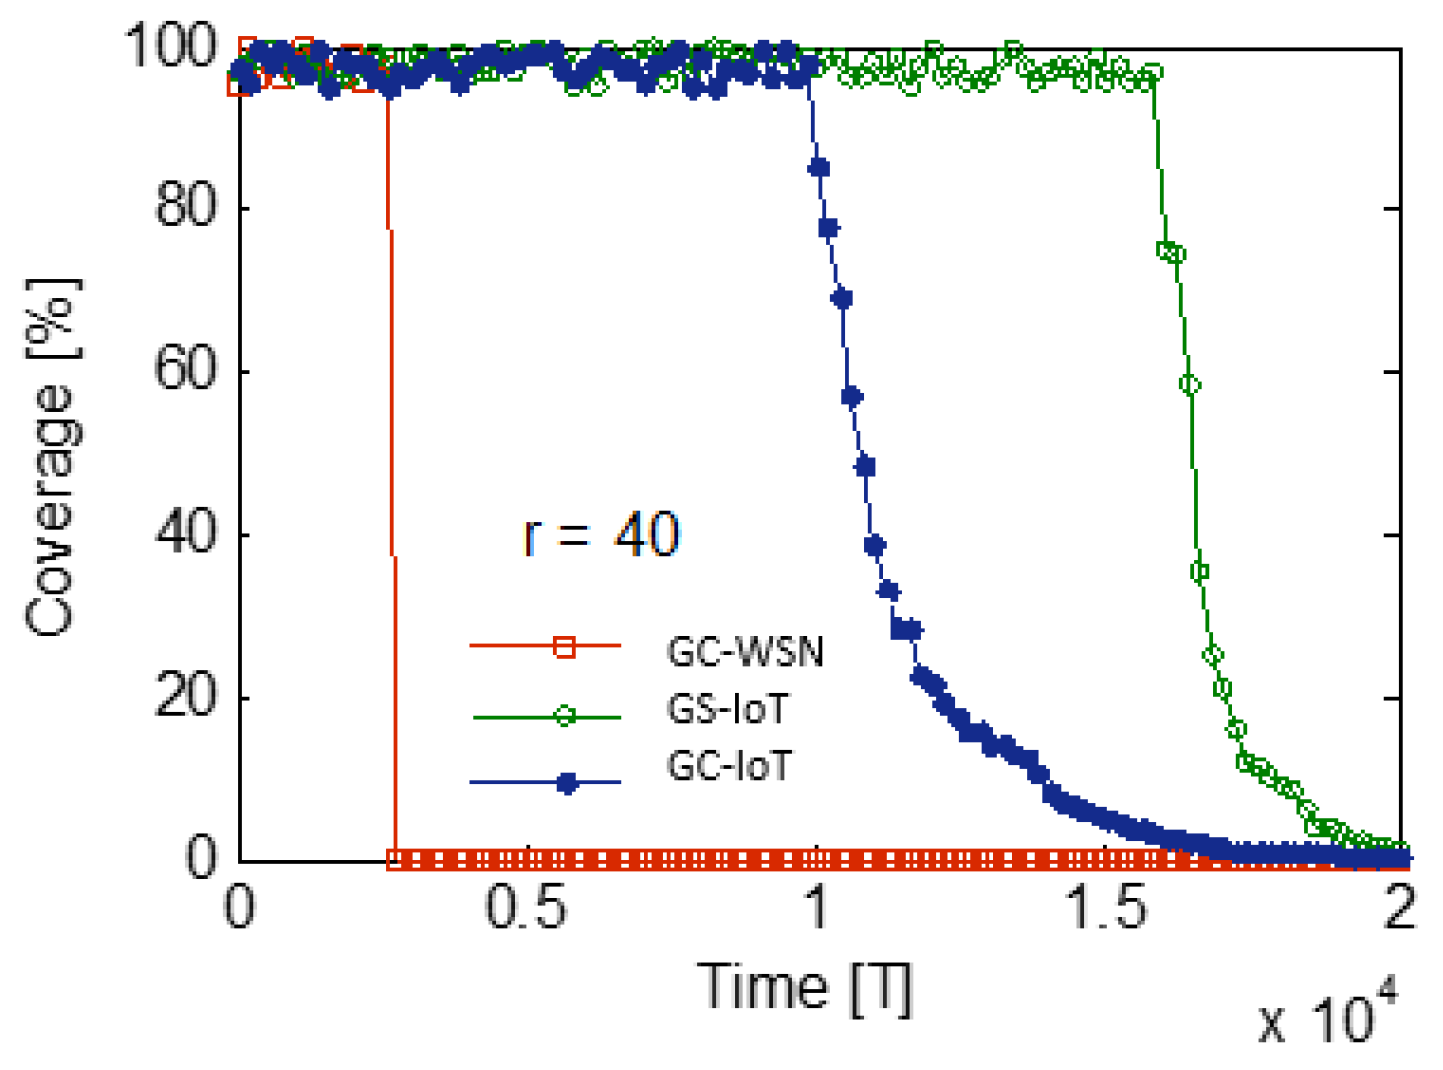
- GS-IoT increases the life span of network about 1.54 times that of GC-IoT, as it lacks intra-group and inter-group overlapping prevention policy.
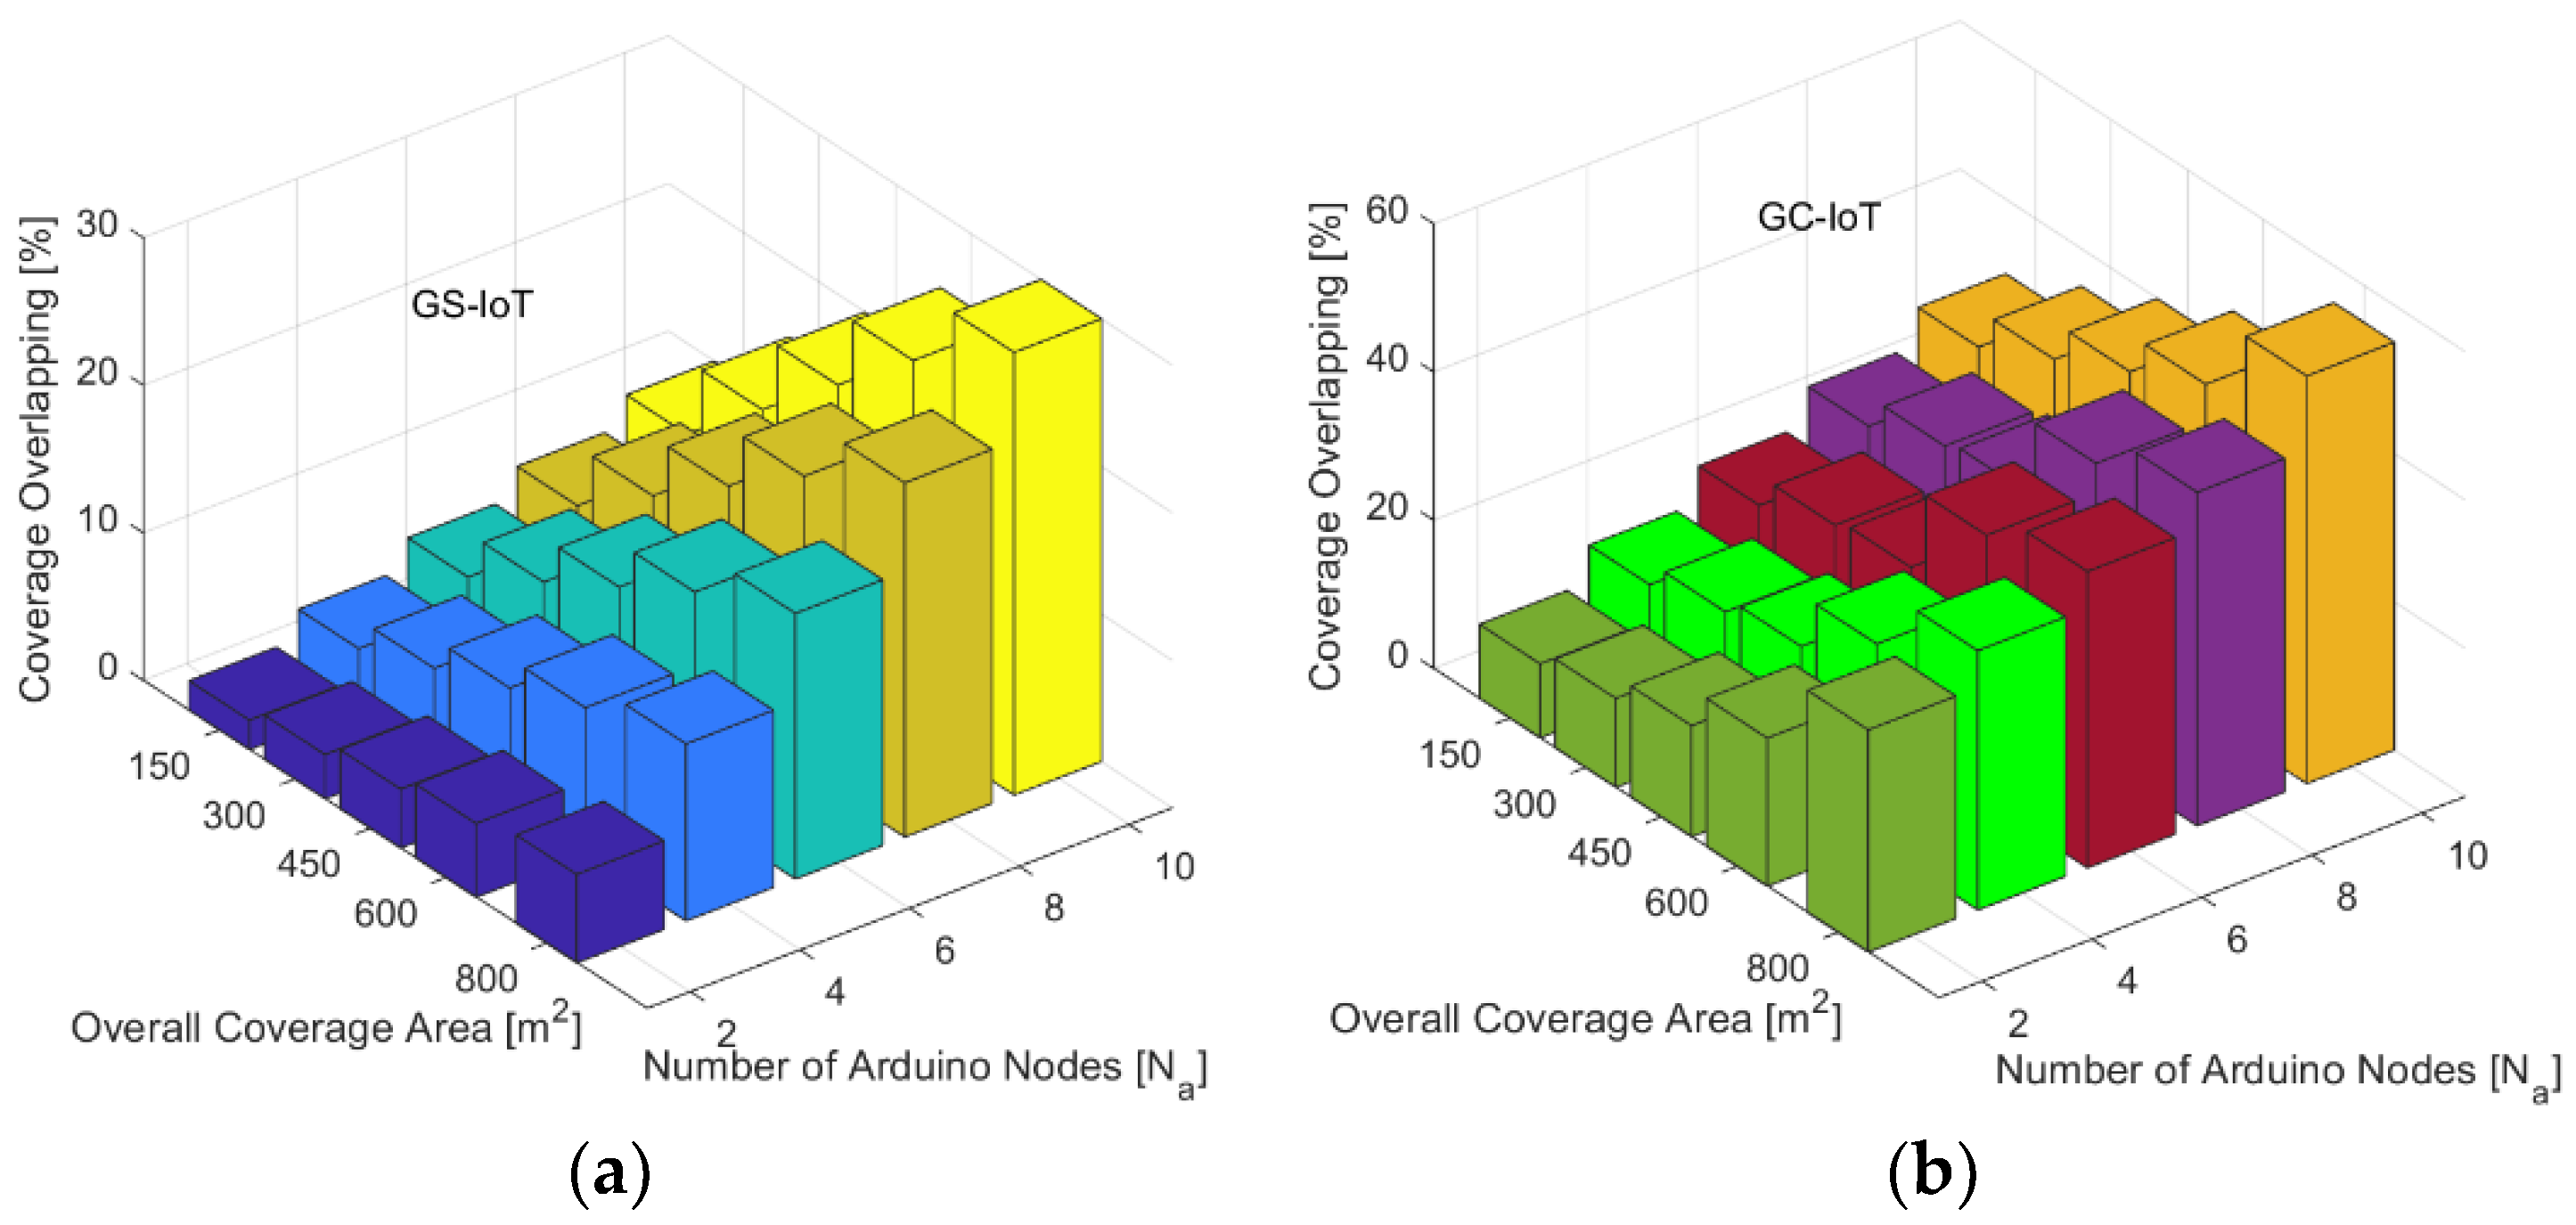
- The coverage overlapping rate gradually increases with an increasing number of hardware nodes. It is less than 20% for up to six hardware nodes and reaches approximately 30% with 10 hardware nodes.
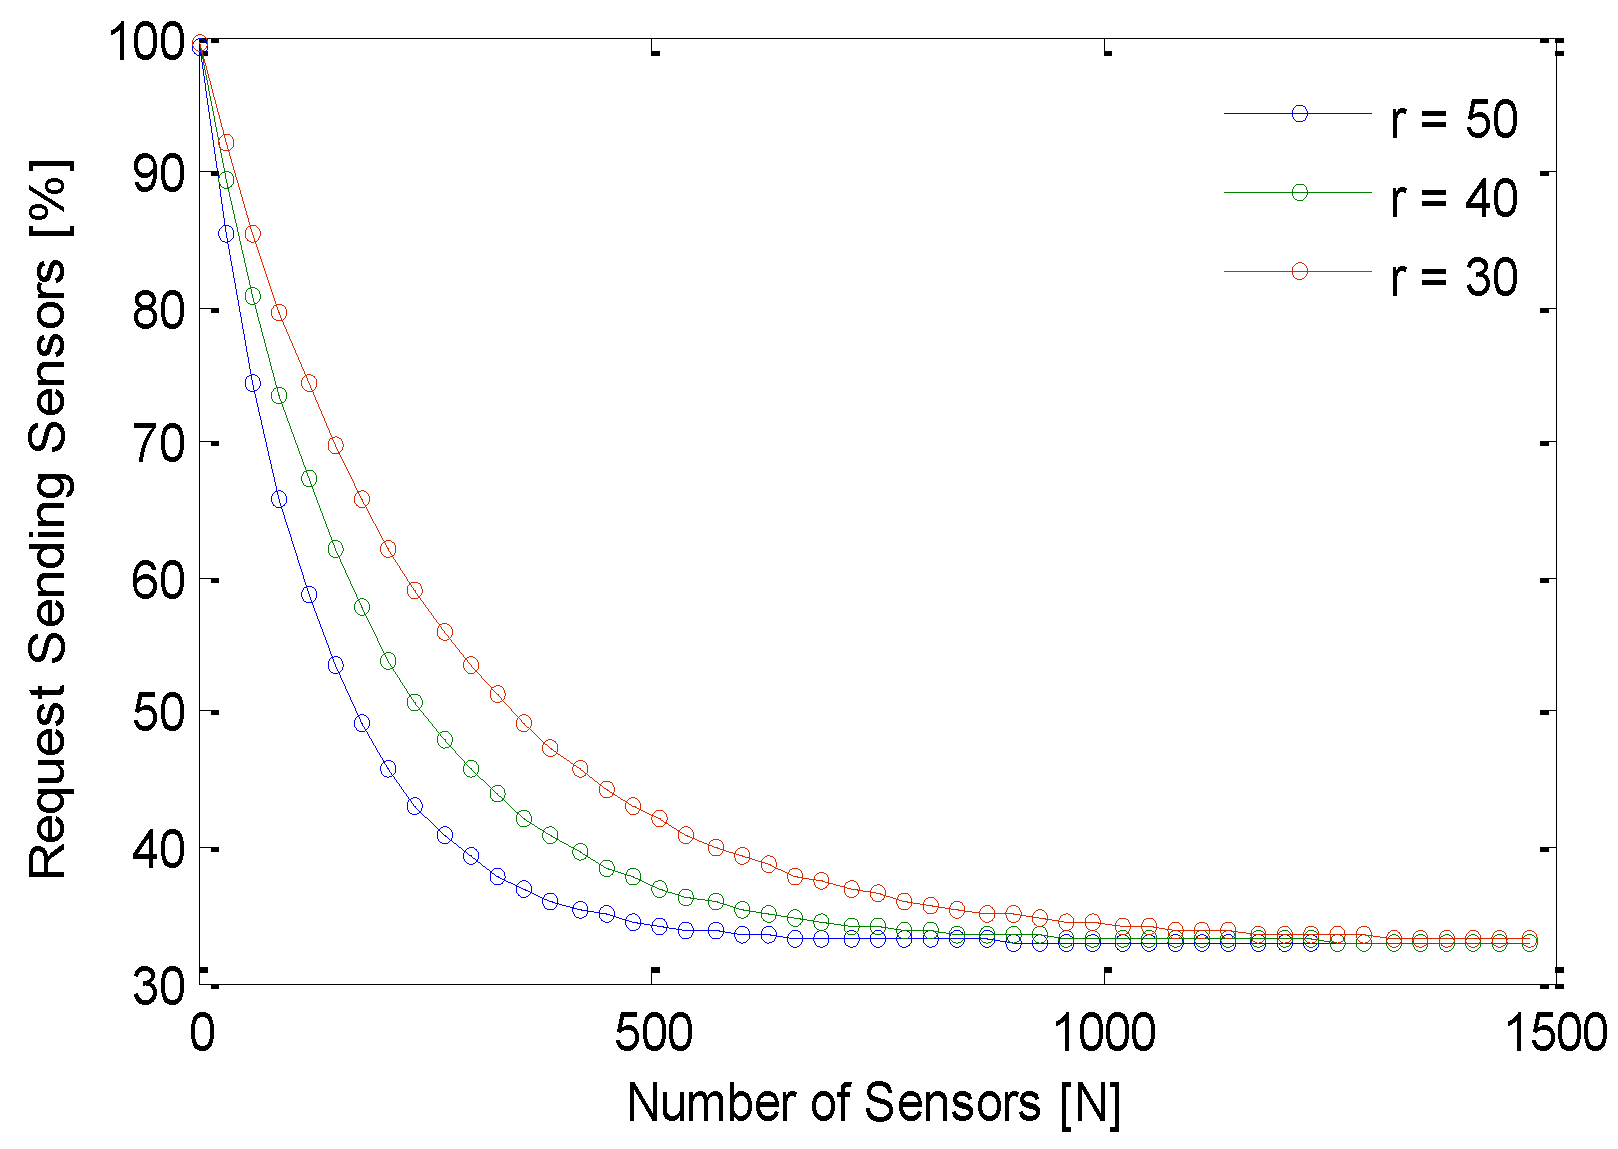
- As the number of sensors increases, the percentage of request sending sensors decreases. For example, it converges about 35%. This is because of small group size.
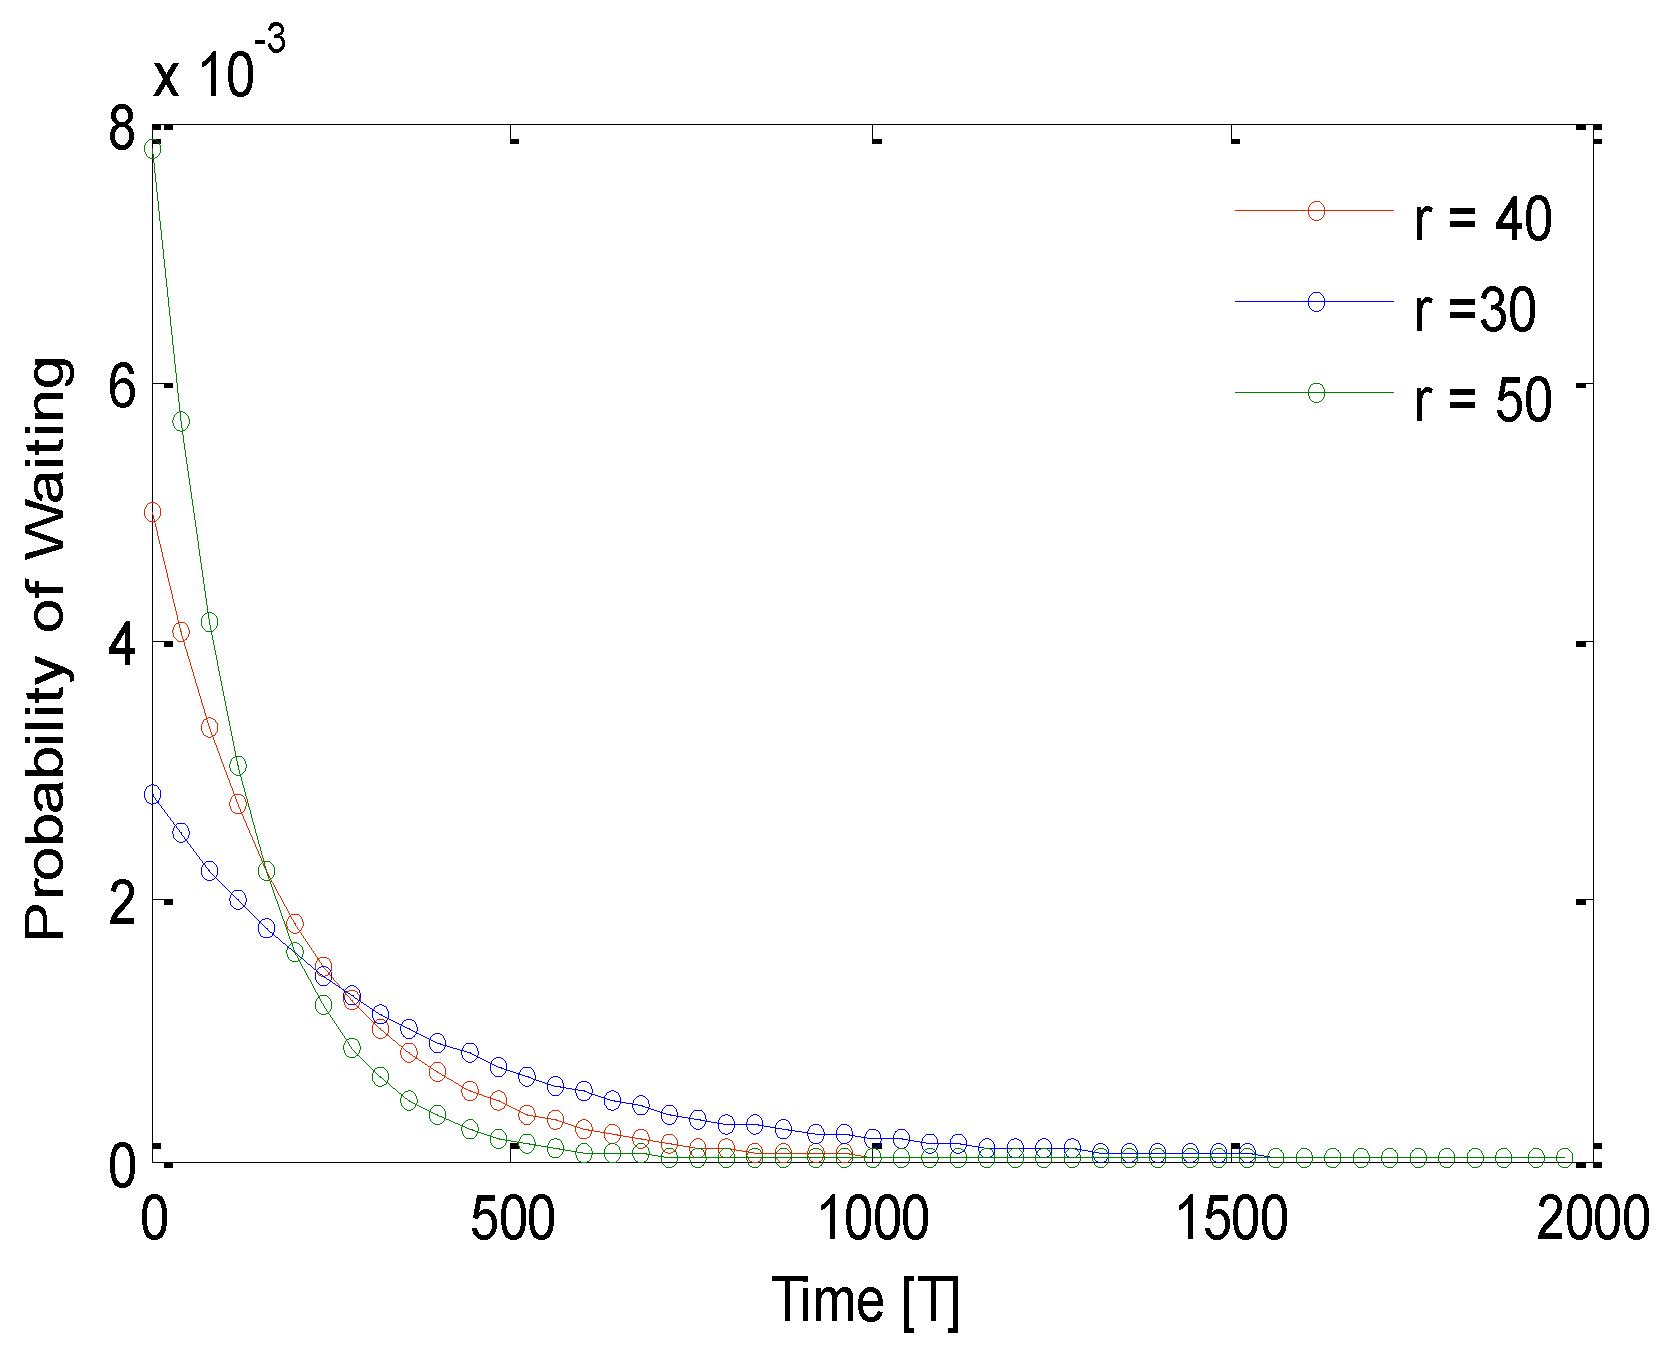
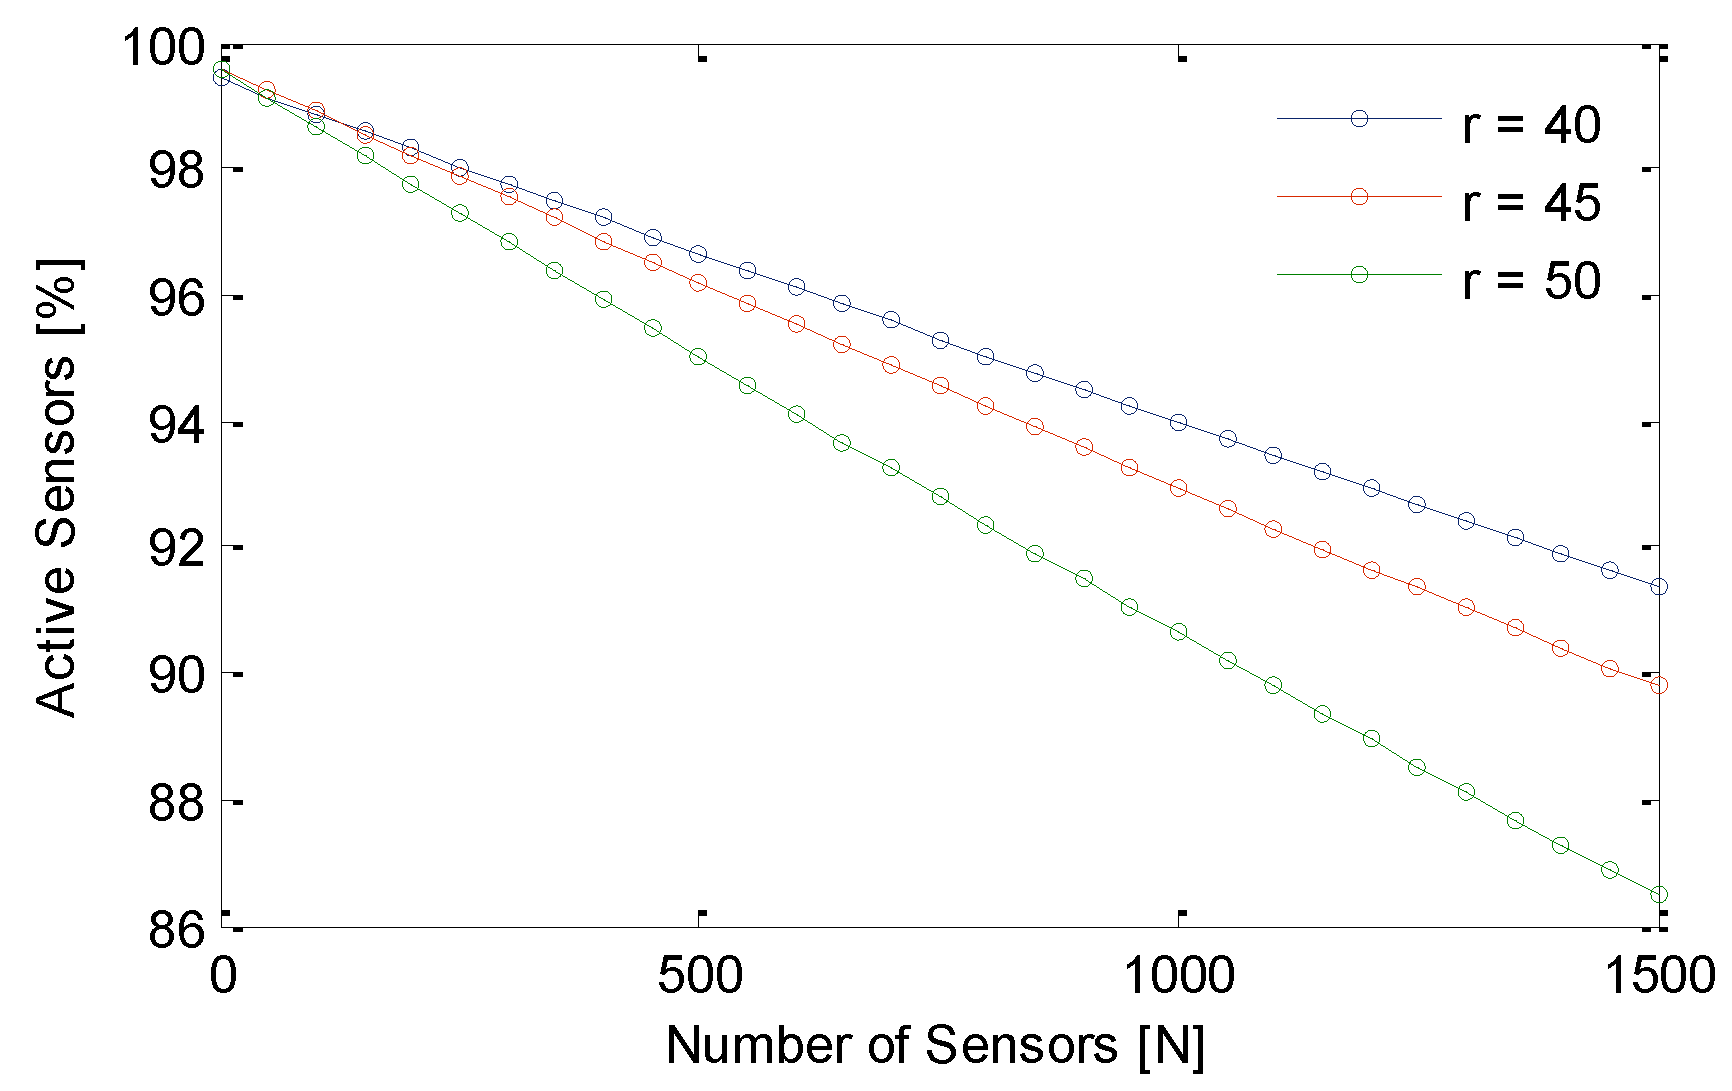
- For sensing range and for number of sensors, approximately 9% of sensors are switched to sleep mode. For sensing range, this percentage is 13.
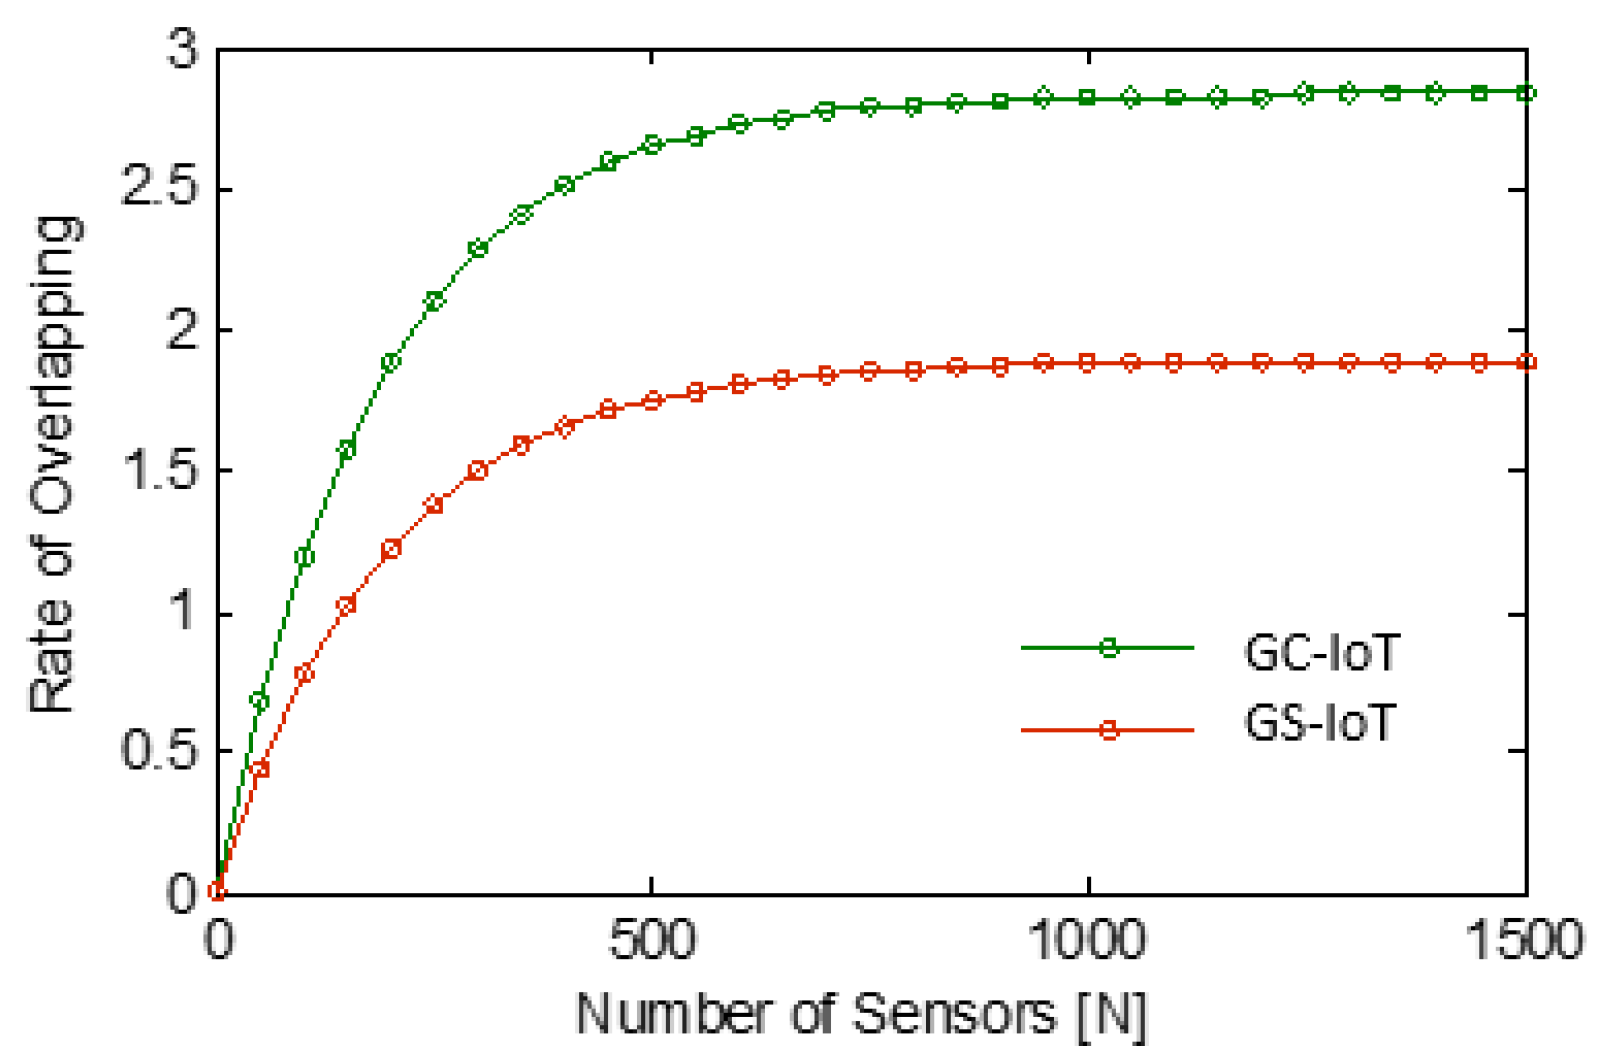
- We observe that, for and sensing range, the rate of overlapping is about 29% for GC-WSN. It is about 2.9% in case of GC-IoT and 1.8% for GS-IoT.
5. Conclusions and Future Work
Author Contributions
Funding
Acknowledgments
Conflicts of Interest
References
- Jaiswal, A.; Kumar, S.; Kaiwartya, O.; Kumar, N.; Song, H.; Lloret, J. Secrecy Rate Maximization in Virtual-MIMO Enabled SWIPT for 5G Centric IoT Applications. IEEE Syst. J. 2020, 1–12. [Google Scholar] [CrossRef]
- Kumar, K.; Kumar, S.; Kaiwartya, O.; Cao, Y.; Lloret, J.; Aslam, N. Cross-Layer Energy Optimization for IoT Environments: Technical Advances and Opportunities. Energies 2017, 10, 2073. [Google Scholar] [CrossRef] [Green Version]
- Kumar, S.; Kumar, V.; Kaiwartya, O.; Dohare, U.; Kumar, N.; Lloret, J. Towards green communication in wireless sensor network: GA enabled distributed zone approach. Ad Hoc Netw. 2019, 93, 101903. [Google Scholar] [CrossRef]
- Jaiswal, A.; Kumar, S.; Kaiwartya, O.; Prasad, M.; Kumar, N.; Song, H. Green computing in IoT: Time slotted simultaneous wireless information and power transfer. Comput. Commun. 2021, 168, 155–169. [Google Scholar] [CrossRef]
- Jaiswal, A.; Kumar, S.; Kaiwartya, O.; Kashyap, P.K.; Kanjo, E.; Kumar, N.; Song, H. Quantum Learning Enabled Green Communication for Next Generation Wireless Systems. IEEE Trans. Green Commun. Netw. 2021. [Google Scholar] [CrossRef]
- Khasawneh, A.M.; Kaiwartya, O.; Khalifeh, A.; Abualigah, L.M.; Lloret, J. Green Computing in Underwater Wireless Sensor Networks Pressure Centric Energy Modeling. IEEE Syst. J. 2020, 14, 4735–4745. [Google Scholar] [CrossRef]
- Kumar, S.; Kaiwartya, O.; Rathee, M.; Kumar, N.; Lloret, J. Toward Energy-Oriented Optimization for Green Communication in Sensor Enabled IoT Environments. IEEE Syst. J. 2020, 14, 4663–4673. [Google Scholar] [CrossRef]
- Kaiwartya, O.; Abdullah, A.; Cao, Y.; Rao, R.S.; Kumar, S.; Lobiyal, D.K.; Isnin, I.F.; Liu, X.; Shah, R.R. T-MQM: Testbed based Multi-metric Quality Measurement of Sensor Deployment for Precision Agriculture-A Case Study. IEEE Sens. J. 2016, 16, 1. [Google Scholar] [CrossRef]
- Rani, R.; Kumar, S.; Kaiwartya, O.; Khasawneh, A.; Lloret, J.; Al-Khasawneh, M.; Mahmoud, M.; Alarood, A. Towards Green Computing Oriented Security: A Lightweight Postquantum Signature for IoE. Sensors 2021, 21, 1883. [Google Scholar] [CrossRef]
- Kaiwartya, O.; Kumar, S. Cache agent-based geocasting in VANETs. Int. J. Inf. Commun. Technol. 2015, 7, 562. [Google Scholar] [CrossRef]
- Cao, Y.; Jiang, T.; Kaiwartya, O.; Sun, H.; Zhou, H.; Wang, R. Toward Pre-Empted EV Charging Recommendation Through V2V-Based Reservation System. IEEE Trans. Syst. Man. Cybern. Syst. 2021, 51, 3026–3039. [Google Scholar] [CrossRef] [Green Version]
- Kasana, R.; Kumar, S.; Kaiwartya, O.; Yan, W.; Cao, Y.; Abdullah, A.H. Location error resilient geographical routing for vehicular ad-hoc networks. IET Intell. Transp. Syst. 2017, 11, 450–458. [Google Scholar] [CrossRef] [Green Version]
- Verma, G.K.; Singh, B.B.; Kumar, G.; Kaiwartya, O.; Obaidat, M.S. PFCBAS: Pairing Free and Provable Certificate-Based Aggregate Signature Scheme for the e-Healthcare Monitoring System. IEEE Syst. J. 2020, 14, 1704–1715. [Google Scholar] [CrossRef]
- Ullah, F.; Abdullah, A.H.; Kaiwartya, O.; Lloret, J.; Arshad, M.M. EETP-MAC: Energy efficient traffic prioritization for medium access control in wireless body area networks. Telecommun. Syst. 2017, 75, 181–203. [Google Scholar] [CrossRef]
- Farhan, L.; Kaiwartya, O.; Alzubaidi, L.; Gheth, W.; Dimla, E.; Kharel, R. Toward Interference Aware IoT Framework: Energy and Geo-Location-Based-Modeling. IEEE Access 2019, 7, 56617–56630. [Google Scholar] [CrossRef]
- Farhan, L.; Kharel, R.; Kaiwartya, O.; Quiroz-Castellanos, M.; Alissa, A.; Abdulsalam, M. A Concise Review on Internet of Things (IoT) -Problems, Challenges and Opportunities. In Proceedings of the 2018 11th International Symposium on Communication Systems, Networks & Digital Signal Processing (CSNDSP); Institute of Electrical and Electronics Engineers (IEEE), Budapest, Hungary, 18–20 July 2018; pp. 1–6. [Google Scholar]
- Kaiwartya, O.; Abdullah, A.H.; Cao, Y.; Lloret, J.; Kumar, S.; Shah, R.R.; Prasad, M.; Prakash, S. Virtualization in Wireless Sensor Networks: Fault Tolerant Embedding for Internet of Things. IEEE Internet Things J. 2018, 5, 571–580. [Google Scholar] [CrossRef] [Green Version]
- Aanchal, A.; Kumar, S.; Kaiwartya, O.; Abdullah, A.H. Green computing for wireless sensor networks: Optimization and Huffman coding approach. Peer-to-Peer Netw. Appl. 2016, 10, 592–609. [Google Scholar] [CrossRef]
- Attea, B.A.; Khalil, E.A.; Ozdemir, S.; Yıldız, O. A Multi-objective Disjoint Set Covers for Reliable Lifetime Maximization of Wireless Sensor Networks. Wirel. Pers. Commun. 2014, 81, 819–838. [Google Scholar] [CrossRef]
- Shan, A.; Xu, X.; Cheng, Z. Target Coverage in Wireless Sensor Networks with Probabilistic Sensors. Sensors 2016, 16, 1372. [Google Scholar] [CrossRef] [Green Version]
- Zhou, H.; Liang, T.; Xu, C.; Xie, J. Multiobjective Coverage Control Strategy for Energy-Efficient Wireless Sensor Networks. Int. J. Distrib. Sens. Netw. 2012, 8, 1–10. [Google Scholar] [CrossRef] [Green Version]
- Yu, J.; Chen, Y.; Ma, L.; Huang, B.; Cheng, X. On Connected Target k-Coverage in Heterogeneous Wireless Sensor Networks. Sensors 2016, 16, 104. [Google Scholar] [CrossRef] [Green Version]
- Hacioglu, G.; Kand, V.F.A.; Sesli, E. Multi objective clustering for wireless sensor networks. Expert Syst. Appl. 2016, 59, 86–100. [Google Scholar] [CrossRef]
- Wang, Z.; Chen, Y.; Liu, B.; Yang, H.; Su, Z.; Zhu, Y. A sensor node scheduling algorithm for heterogeneous wireless sensor networks. Int. J. Distrib. Sens. Netw. 2019, 15, 1550147719826311. [Google Scholar] [CrossRef] [Green Version]
- Wasim, S.; Kashino, Z.; Nejat, G.; Benhabib, B. Directional-Sensor Network Deployment Planning for Mobile-Target Search. Robotics 2020, 9, 82. [Google Scholar] [CrossRef]
- Tripathi, A.; Gupta, H.P.; Dutta, T.; Mishra, R.; Shukla, K.K.; Jit, S. Coverage and Connectivity in WSNs: A Survey, Research Issues and Challenges. IEEE Access 2018, 6, 26971–26992. [Google Scholar] [CrossRef]
- Luo, C.; Hong, Y.; Li, D.; Wang, Y.; Chen, W.; Hu, Q. Maximizing network lifetime using coverage sets scheduling in wireless sensor networks. Ad Hoc Netw. 2020, 98, 102037. [Google Scholar] [CrossRef]
- Hajjej, F.; Hamdi, M.; Ejbali, R.; Zaied, M. A distributed coverage hole recovery approach based on reinforcement learning for Wireless Sensor Networks. Ad Hoc Netw. 2020, 101, 102082. [Google Scholar] [CrossRef]
- Charr, J.-C.; Deschinkel, K.; Mansour, R.H.; Hakem, M. Lifetime optimization for partial coverage in heterogeneous sensor networks. Ad Hoc Netw. 2020, 107, 102264. [Google Scholar] [CrossRef]
- Maduranga, M.; Saengudomlert, P.; Bandara, H.D. Redundant Node Management in Wireless Sensor Networks with Multiple Sensor Types. In Proceedings of the 2018 National Information Technology Conference (NITC), Colombo, Sri Lanka, 2–4 October 2018; pp. 1–6. [Google Scholar]
- Al-Fuhaidi, B.; Mohsen, A.M.; Ghazi, A.; Yousef, W.M. An Efficient Deployment Model for Maximizing Coverage of Heterogeneous Wireless Sensor Network Based on Harmony Search Algorithm. J. Sens. 2020, 2020, 1–18. [Google Scholar] [CrossRef]
- Farhan, L.; Kharel, R.; Kaiwartya, O.; Hammoudeh, M.A.; Adebisi, B. Towards green computing for Internet of things: Energy oriented path and message scheduling approach. Sustain. Cities Soc. 2018, 38, 195–204. [Google Scholar] [CrossRef] [Green Version]
- Khatri, A.; Kumar, S.; Kaiwartya, O.; Aslam, N.; Meena, N.; Abdullah, A.H. Towards green computing in wireless sensor networks: Controlled mobility-aided balanced tree approach. Int. J. Commun. Syst. 2018, 31, e3463. [Google Scholar] [CrossRef]
- Lloret, J.; Garcia, M.; Bri, D.; Diaz, J.R. A cluster-based architecture to structure the topology of parallel wireless sensor networks. Sensors 2009, 9, 10513–10544. [Google Scholar] [CrossRef] [PubMed]
- Fortino, G.; Savaglio, C.; Spezzano, G.; Zhou, M. Internet of Things as System of Systems: A Review of Methodologies, Frameworks, Platforms, and Tools. IEEE Trans. Syst. Man, Cybern. Syst. 2021, 51, 223–236. [Google Scholar] [CrossRef]
- Albreem, M.A.M.; El-Saleh, A.A.; Isa, M.; Salah, W.; Jusoh, M.; Azizan, M.; Ali, A. Green internet of things (IoT): An overview. In Proceedings of the 2017 IEEE 4th International Conference on Smart Instrumentation, Measurement and Application (ICSIMA), Putrajaya, Malaysia, 28–30 November 2017; pp. 1–6. [Google Scholar]
- Arshad, R.; Zahoor, S.; Shah, M.A.; Wahid, A.; Yu, H. Green IoT: An Investigation on Energy Saving Practices for 2020 and Beyond. IEEE Access 2017, 5, 15667–15681. [Google Scholar] [CrossRef]
- Benedetti, P.; Femminella, M.; Reali, G.; Steenhaut, K. Experimental Analysis of the Application of Serverless Computing to IoT Platforms. Sensors 2021, 21, 928. [Google Scholar] [CrossRef]
- Theodorou, T.; Mamatas, L. CORAL-SDN: A software-defined networking solution for the Internet of Things. In Proceedings of the 2017 IEEE Conference on Network Function Virtualization and Software Defined Networks (NFV-SDN), Berlin, Germany, 6–8 November 2017; pp. 1–2. [Google Scholar]
- Lloret, J.; Garcia, M.; Tomas, J.; Boronat, F. GBP-WAHSN: A Group-Based Protocol for Large Wireless Ad Hoc and Sensor Networks. J. Comput. Sci. Technol. 2008, 23, 461–480. [Google Scholar] [CrossRef]
- Makarfi, A.U.; Rabie, K.M.; Kaiwartya, O.; Badarneh, O.S.; Li, X.; Kharel, R. Reconfigurable Intelligent Surface Enabled IoT Networks in Generalized Fading Channels. In Proceedings of the ICC 2020–2020 IEEE International Conference on Communications (ICC), Dublin, Ireland, 7–11 June 2020; pp. 1–6. [Google Scholar]
- Lloret, J.; Palau, C.; Boronat, F.; Tomás, J. Improving networks using group-based topologies. Comput. Commun. 2008, 31, 3438–3450. [Google Scholar] [CrossRef]


| Simulation Parameter | Value Considered in Simulation |
|---|---|
| Sensing fied as campus | 1500 m2 |
| Radius of tranmission (Rt) | 40 m |
| Radiusof sensing in nodes (Rs) | 50 m |
| Initial enery in sensor nodes (Ei) | 5j |
| Network lifetime of nodes | 1st no event report |
| Number of sensor nodes | 1500–2500 |
| Number of sink nodes | 30–40 |
| Energy expenditure (Eele) | 40 nj/bit/signal |
| Length of data packet (header and payload) | 4000 bits |
| Exponent of pathloss (Φ) | 2 |
| sensing packets size | 2000 bits |
| Data agregation energy | 5 nj/bit/signal |
| Grouping size of sensors | 6–8 |
| Overlapping factor | 2–3 |
Publisher’s Note: MDPI stays neutral with regard to jurisdictional claims in published maps and institutional affiliations. |
© 2021 by the authors. Licensee MDPI, Basel, Switzerland. This article is an open access article distributed under the terms and conditions of the Creative Commons Attribution (CC BY) license (https://creativecommons.org/licenses/by/4.0/).
Share and Cite
Kumar, V.; Kumar, S.; AlShboul, R.; Aggarwal, G.; Kaiwartya, O.; Khasawneh, A.M.; Lloret, J.; Al-Khasawneh, M.A. Grouping and Sponsoring Centric Green Coverage Model for Internet of Things. Sensors 2021, 21, 3948. https://doi.org/10.3390/s21123948
Kumar V, Kumar S, AlShboul R, Aggarwal G, Kaiwartya O, Khasawneh AM, Lloret J, Al-Khasawneh MA. Grouping and Sponsoring Centric Green Coverage Model for Internet of Things. Sensors. 2021; 21(12):3948. https://doi.org/10.3390/s21123948
Chicago/Turabian StyleKumar, Vinod, Sushil Kumar, Rabah AlShboul, Geetika Aggarwal, Omprakash Kaiwartya, Ahmad M. Khasawneh, Jaime Lloret, and Mahmoud Ahmad Al-Khasawneh. 2021. "Grouping and Sponsoring Centric Green Coverage Model for Internet of Things" Sensors 21, no. 12: 3948. https://doi.org/10.3390/s21123948
APA StyleKumar, V., Kumar, S., AlShboul, R., Aggarwal, G., Kaiwartya, O., Khasawneh, A. M., Lloret, J., & Al-Khasawneh, M. A. (2021). Grouping and Sponsoring Centric Green Coverage Model for Internet of Things. Sensors, 21(12), 3948. https://doi.org/10.3390/s21123948