
Radar Sensing for Activity Classification in Elderly People Exploiting Micro-Doppler Signatures Using Machine Learning

 , ,
, ,  , ,
, ,  and
and 
Abstract
1. Introduction
2. Related work
3. Methodology
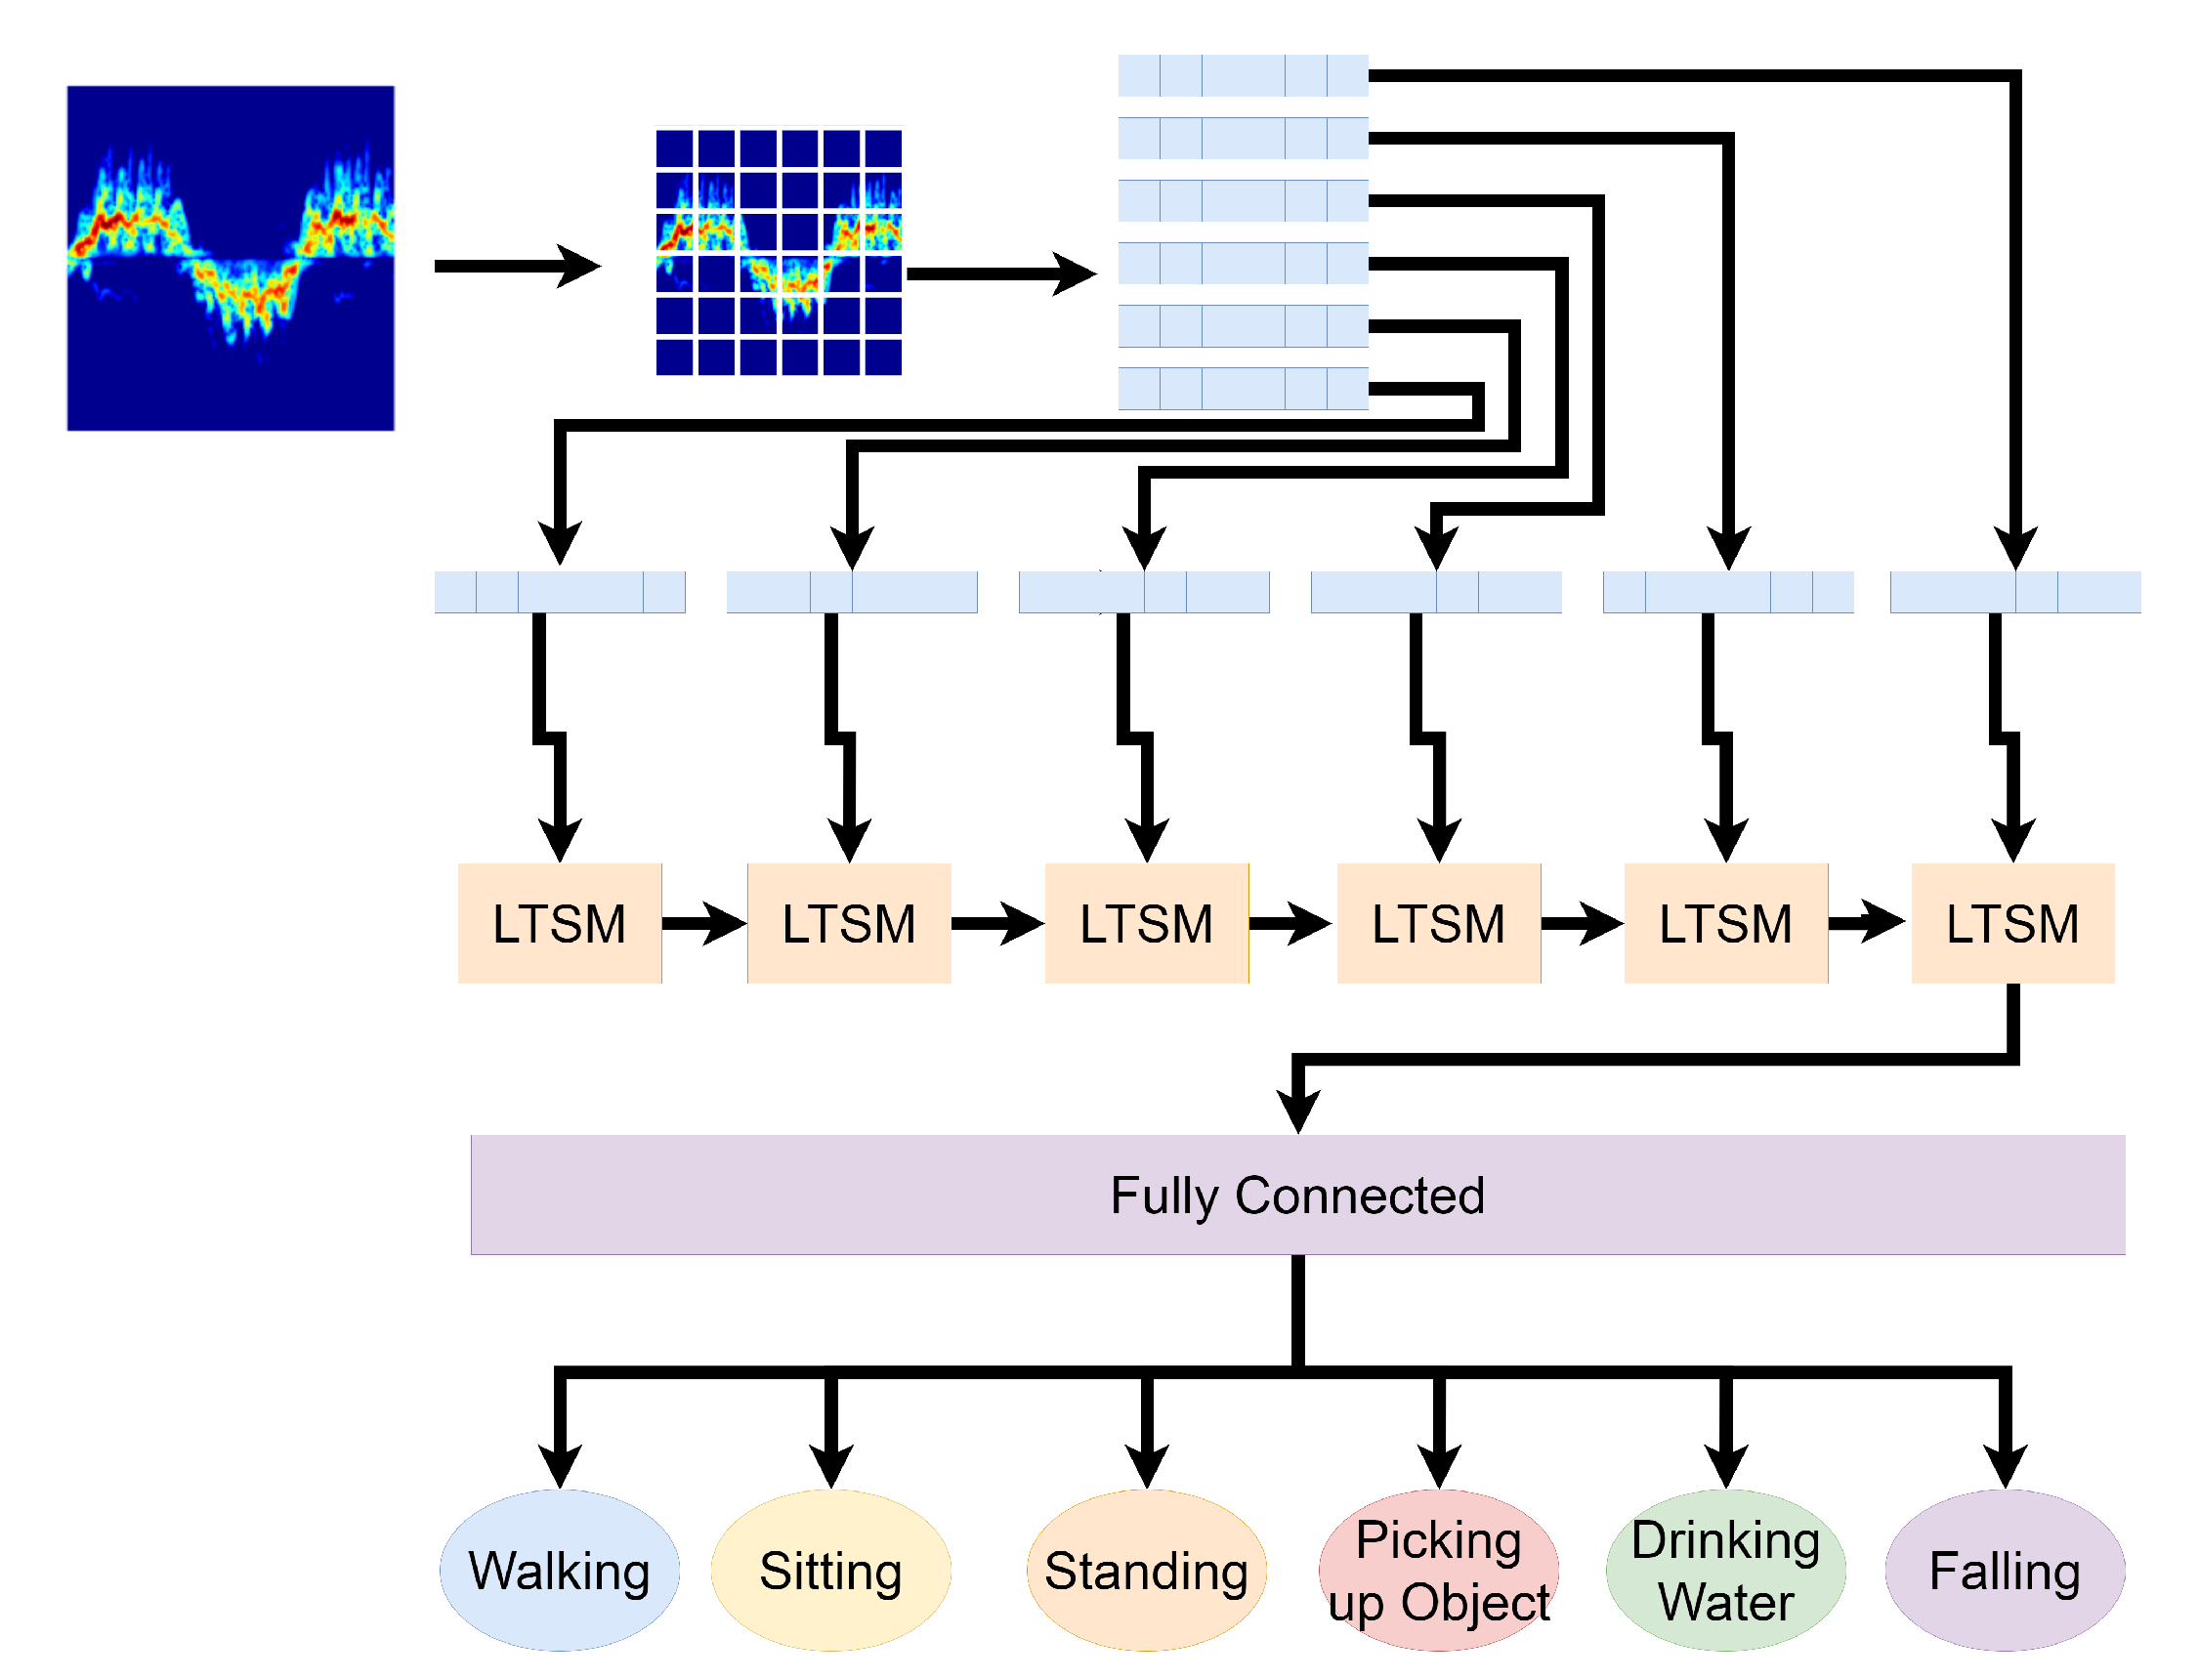
Machine Learning
4. Results and Discussion
4.1. Original Dataset
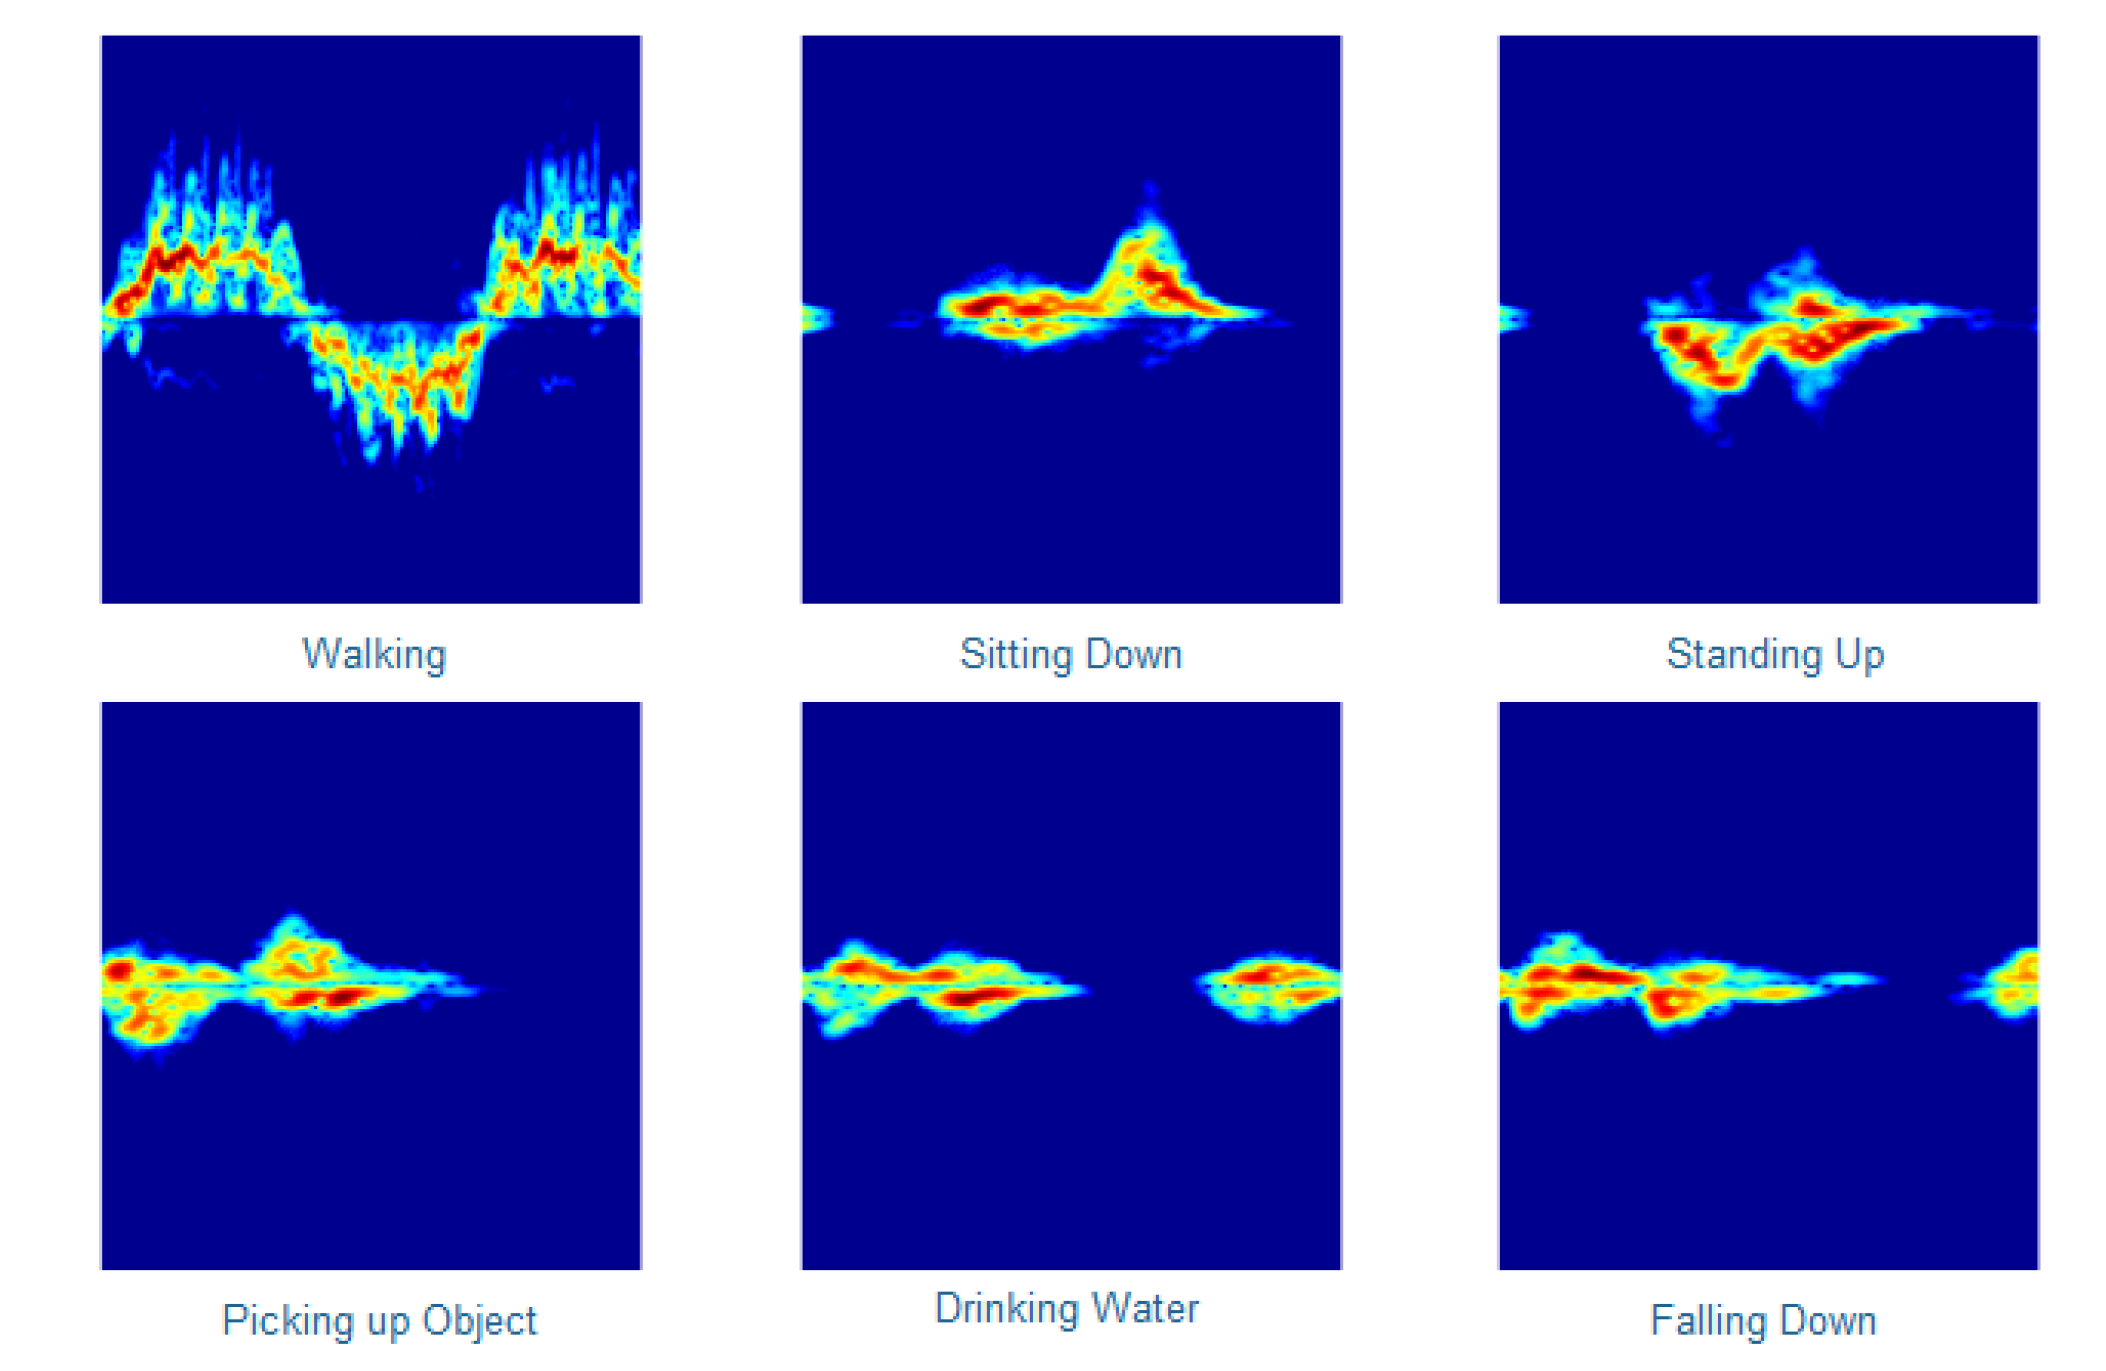
4.1.1. Raw Images
4.1.2. Principal Component Analysis
4.2. Data Augmentation
4.2.1. Raw Images
4.2.2. Principal Component Analysis
4.3. Ablation Studies
5. Comparison to State-of-the-Art Approaches
6. Conclusions
Author Contributions
Funding
Institutional Review Board Statement
Informed Consent Statement
Data Availability Statement
Acknowledgments
Conflicts of Interest
References
- Woll, A.; Bratteteig, T. A trajectory for technology-supported elderly care work. Comput. Support. Coop. Work. (CSCW) 2019, 28, 127–168. [Google Scholar] [CrossRef]
- Yang, X.; Ren, X.; Chen, M.; Wang, L.; Ding, Y. Human Posture Recognition in Intelligent Healthcare. J. Phys. Conf. Ser. 2020, 1437, 012014. [Google Scholar] [CrossRef]
- Abbasi, Q.H.; Rehman, M.U.; Qaraqe, K.; Alomainy, A. Advances in Body-Centric Wireless Communication: Applications and State-of-the-Art; Institution of Engineering and Technology: London, UK, 2016; ISBN 9781849199896. [Google Scholar]
- Taylor, W.; Shah, S.A.; Dashtipour, K.; Zahid, A.; Abbasi, Q.H.; Imran, M.A. An Intelligent Non-Invasive Real-Time Human Activity Recognition System for Next-Generation Healthcare. Sensors 2020, 20, 2653. [Google Scholar] [CrossRef]
- Grossi, G.; Lanzarotti, R.; Napoletano, P.; Noceti, N.; Odone, F. Positive technology for elderly well-being: A review. Pattern Recognit. Lett. 2019, 137, 61–70. [Google Scholar] [CrossRef]
- De Miguel, K.; Brunete, A.; Hernando, M.; Gambao, E. Home camera-based fall detection system for the elderly. Sensors 2017, 17, 2864. [Google Scholar] [CrossRef]
- Yang, L.; Ren, Y.; Zhang, W. 3D depth image analysis for indoor fall detection of elderly people. Digit. Commun. Netw. 2016, 2, 24–34. [Google Scholar] [CrossRef]
- Taramasco, C.; Rodenas, T.; Martinez, F.; Fuentes, P.; Munoz, R.; Olivares, R.; De Albuquerque, V.H.C.; Demongeot, J. A novel monitoring system for fall detection in older people. IEEE Access 2018, 6, 43563–43574. [Google Scholar] [CrossRef]
- Tsinganos, P.; Skodras, A. A smartphone-based fall detection system for the elderly. In Proceedings of the 10th International Symposium on Image and Signal Processing and Analysis, Ljubljana, Slovenia, 18–20 September 2017; pp. 53–58. [Google Scholar]
- Ou, Y.; Ambalathankandy, P.; Shimada, T.; Kamishima, T.; Ikebe, M. Automatic Radiographic Quantification of Joint Space Narrowing Progression in Rheumatoid Arthritis Using POC. In Proceedings of the 2019 IEEE 16th International Symposium on Biomedical Imaging (ISBI 2019), Venice, Italy, 8–11 April 2019; pp. 1183–1187. [Google Scholar]
- Hussain, F.; Umair, M.B.; Ehatisham-ul Haq, M.; Pires, I.M.; Valente, T.; Garcia, N.M.; Pombo, N. An Efficient Machine Learning-based Elderly Fall Detection Algorithm. arXiv 2019, arXiv:1911.11976. [Google Scholar]
- Santiago, J.; Cotto, E.; Jaimes, L.G.; Vergara-Laurens, I. Fall detection system for the elderly. In Proceedings of the 2017 IEEE 7th Annual Computing and Communication Workshop and Conference (CCWC), Las Vegas, NV, USA, 9–11 January 2017; pp. 1–4. [Google Scholar]
- Sehairi, K.; Chouireb, F.; Meunier, J. Elderly fall detection system based on multiple shape features and motion analysis. In Proceedings of the 2018 International Conference on Intelligent Systems and Computer Vision (ISCV), Fez, Morocco, 2–4 April 2018; pp. 1–8. [Google Scholar]
- Daher, M.; Diab, A.; El Najjar, M.E.B.; Khalil, M.A.; Charpillet, F. Elder tracking and fall detection system using smart tiles. IEEE Sens. J. 2016, 17, 469–479. [Google Scholar] [CrossRef]
- Okumura, N.; Yamanoi, Y.; Kato, R.; Yamamura, O. Fall detection and walking estimation using floor vibration for solitary elderly people. In Proceedings of the 2019 IEEE International Conference on Systems, Man and Cybernetics (SMC), Bari, Italy, 6–9 October 2019; pp. 1437–1442. [Google Scholar]
- Soni, P.K.; Choudhary, A. Automated Fall Detection From a Camera Using Support Vector Machine. In Proceedings of the 2019 Second International Conference on Advanced Computational and Communication Paradigms (ICACCP), Gangtok, India, 25–28 February 2019; pp. 1–6. [Google Scholar]
- Erol, B.; Amin, M.G.; Boashash, B. Range-Doppler radar sensor fusion for fall detection. In Proceedings of the 2017 IEEE Radar Conference (RadarConf), Seattle, WA, USA, 8–12 May 2017; pp. 0819–0824. [Google Scholar]
- Shah, S.A.; Fioranelli, F. Human activity recognition: Preliminary results for dataset portability using FMCW Radar. In Proceedings of the 2019 International Radar Conference (RADAR), Toulon, France, 23–27 September 2019; pp. 1–4. [Google Scholar]
- Jokanovic, B.; Amin, M.; Ahmad, F. Radar fall motion detection using deep learning. In Proceedings of the 2016 IEEE radar conference (RadarConf), Philadelphia, PA, USA, 1–6 May 2016; pp. 1–6. [Google Scholar]
- Erol, B.; Amin, M.G.; Boashash, B.; Ahmad, F.; Zhang, Y.D. Wideband radar based fall motion detection for a generic elderly. In Proceedings of the 2016 50th Asilomar Conference on Signals, Systems and Computers, Pacific Grove, CA, USA, 6–9 November 2016; pp. 1768–1772. [Google Scholar]
- Wang, M.; Zhang, Y.D.; Cui, G. Human motion recognition exploiting radar with stacked recurrent neural network. Digit. Signal Process. 2019, 87, 125–131. [Google Scholar] [CrossRef]
- Erol, B.; Amin, M. Generalized pca fusion for improved radar human motion recognition. In Proceedings of the 2019 IEEE Radar Conference (RadarConf), Boston, MA, USA, 22–26 April 2019; pp. 1–5. [Google Scholar]
- Qi, R.; Li, X.; Zhang, Y.; Li, Y. Multi-Classification Algorithm for Human Motion Recognition Based on IR-UWB Radar. IEEE Sens. J. 2020, 20, 12848–12858. [Google Scholar] [CrossRef]
- Han, T.; Kang, W.; Choi, G. IR-UWB Sensor Based Fall Detection Method Using CNN Algorithm. Sensors 2020, 20, 5948. [Google Scholar] [CrossRef] [PubMed]
- Bouchard, K.; Maitre, J.; Bertuglia, C.; Gaboury, S. Activity recognition in smart homes using UWB radars. Procedia Comput. Sci. 2020, 170, 10–17. [Google Scholar] [CrossRef]
- Chowdhury, A.; Das, T.; Rani, S.; Khasnobish, A.; Chakravarty, T. Activity recognition using ultra wide band range-time scan. In Proceedings of the 2020 28th European Signal Processing Conference (EUSIPCO), Amsterdam, The Netherlands, 24–28 August 2020; pp. 1338–1342. [Google Scholar]
- Maitre, J.; Bouchard, K.; Bertuglia, C.; Gaboury, S. Recognizing activities of daily living from UWB radars and deep learning. Expert Syst. Appl. 2021, 164, 113994. [Google Scholar] [CrossRef]
- Van der Walt, S.; Schönberger, J.L.; Nunez-Iglesias, J.; Boulogne, F.; Warner, J.D.; Yager, N.; Gouillart, E.; Yu, T.; The Scikit-Image Contributors. Scikit-image: Image processing in Python. PeerJ 2014, 2, e453. [Google Scholar] [CrossRef]
- Güneş, A.; Kalkan, H.; Durmuş, E. Optimizing the color-to-grayscale conversion for image classification. Signal Image Video Process. 2016, 10, 853–860. [Google Scholar] [CrossRef]
- Bui, H.M.; Lech, M.; Cheng, E.; Neville, K.; Burnett, I.S. Using grayscale images for object recognition with convolutional-recursive neural network. In Proceedings of the 2016 IEEE Sixth International Conference on Communications and Electronics (ICCE), Ha-Long City, Quang Ninh, Vietnam, 27–29 July 2016; pp. 321–325. [Google Scholar]
- Sakamoto, T. Personal identification using ultrawideband radar measurement of walking and sitting motions and a convolutional neural network. arXiv 2020, arXiv:2008.02182. [Google Scholar]
- Jolliffe, I.T.; Cadima, J. Principal component analysis: A review and recent developments. Philos. Trans. R. Soc. A Math. Phys. Eng. Sci. 2016, 374, 20150202. [Google Scholar] [CrossRef]
- Aït-Sahalia, Y.; Xiu, D. Principal component analysis of high-frequency data. J. Am. Stat. Assoc. 2019, 114, 287–303. [Google Scholar] [CrossRef]
- Xie, Q.; Dai, Z.; Hovy, E.; Luong, M.T.; Le, Q.V. Unsupervised data augmentation. arXiv 2019, arXiv:1904.12848. [Google Scholar]
- Hao, J.; Ho, T.K. Machine Learning Made Easy: A Review of Scikit-learn Package in Python Programming Language. J. Educ. Behav. Stat. 2019, 44, 348–361. [Google Scholar] [CrossRef]
- Vishal, B.L.; Pragathi, M.; Amulya, P.K.; Kumar, N.S. Image Classification Using Neural Networks and Tensor-Flow; The Mattingley Publishing Co., Inc.: Oakland, CA, USA, 2020. [Google Scholar]
- Shaikhina, T.; Lowe, D.; Daga, S.; Briggs, D.; Higgins, R.; Khovanova, N. Decision tree and random forest models for outcome prediction in antibody incompatible kidney transplantation. Biomed. Signal Process. Control 2019, 52, 456–462. [Google Scholar] [CrossRef]
- Saçlı, B.; Aydınalp, C.; Cansız, G.; Joof, S.; Yilmaz, T.; Çayören, M.; Önal, B.; Akduman, I. Microwave dielectric property based classification of renal calculi: Application of a kNN algorithm. Comput. Biol. Med. 2019, 112, 103366. [Google Scholar] [CrossRef] [PubMed]
- Li, K.; Gu, Y.; Zhang, P.; An, W.; Li, W. Research on KNN Algorithm in Malicious PDF Files Classification under Adversarial Environment. In Proceedings of the 2019 4th International Conference on Big Data and Computing, Guangzhou, China, 10–12 May 2019; pp. 156–159. [Google Scholar]
- Huang, S.; Cai, N.; Pacheco, P.P.; Narrandes, S.; Wang, Y.; Xu, W. Applications of support vector machine (SVM) learning in cancer genomics. Cancer Genom. Proteom. 2018, 15, 41–51. [Google Scholar]
- Jain, M.; Narayan, S.; Balaji, P.; Bhowmick, A.; Muthu, R.K. Speech emotion recognition using support vector machine. arXiv 2020, arXiv:2002.07590. [Google Scholar]
- Wang, J.; Yang, Y.; Mao, J.; Huang, Z.; Huang, C.; Xu, W. Cnn-rnn: A unified framework for multi-label image classification. In Proceedings of the IEEE Conference on Computer Vision and Pattern Recognition, Las Vegas, NV, USA, 27–30 June 2016; pp. 2285–2294. [Google Scholar]
- Wang, S.; Wang, X.; Wang, S.; Wang, D. Bi-directional long short-term memory method based on attention mechanism and rolling update for short-term load forecasting. Int. J. Electr. Power Energy Syst. 2019, 109, 470–479. [Google Scholar] [CrossRef]
- Chang, P.D.; Kuoy, E.; Grinband, J.; Weinberg, B.D.; Thompson, M.; Homo, R.; Chen, J.; Abcede, H.; Shafie, M.; Sugrue, L.; et al. Hybrid 3D/2D convolutional neural network for hemorrhage evaluation on head CT. Am. J. Neuroradiol. 2018, 39, 1609–1616. [Google Scholar] [CrossRef] [PubMed]
- Ren, A.; Zahid, A.; Zoha, A.; Shah, S.A.; Imran, M.A.; Alomainy, A.; Abbasi, Q.H. Machine learning driven approach towards the quality assessment of fresh fruits using non-invasive sensing. IEEE Sens. J. 2019, 20, 2075–2083. [Google Scholar] [CrossRef]
- Elbayad, M.; Besacier, L.; Verbeek, J. Pervasive attention: 2d convolutional neural networks for sequence-to-sequence prediction. arXiv 2018, arXiv:1808.03867. [Google Scholar]
- Azamfar, M.; Singh, J.; Bravo-Imaz, I.; Lee, J. Multisensor data fusion for gearbox fault diagnosis using 2-D convolutional neural network and motor current signature analysis. Mech. Syst. Signal Process. 2020, 144, 106861. [Google Scholar] [CrossRef]


| Algorithm | Number of Samples |
|---|---|
| Walking | 286 |
| Sitting Down | 289 |
| Standing Up | 287 |
| Picking Up an Object | 287 |
| Drinking Water | 286 |
| Falling | 198 |
| Total | 1633 |
| Algorithm | Accuracy | Precision | Recall | F1-Score |
|---|---|---|---|---|
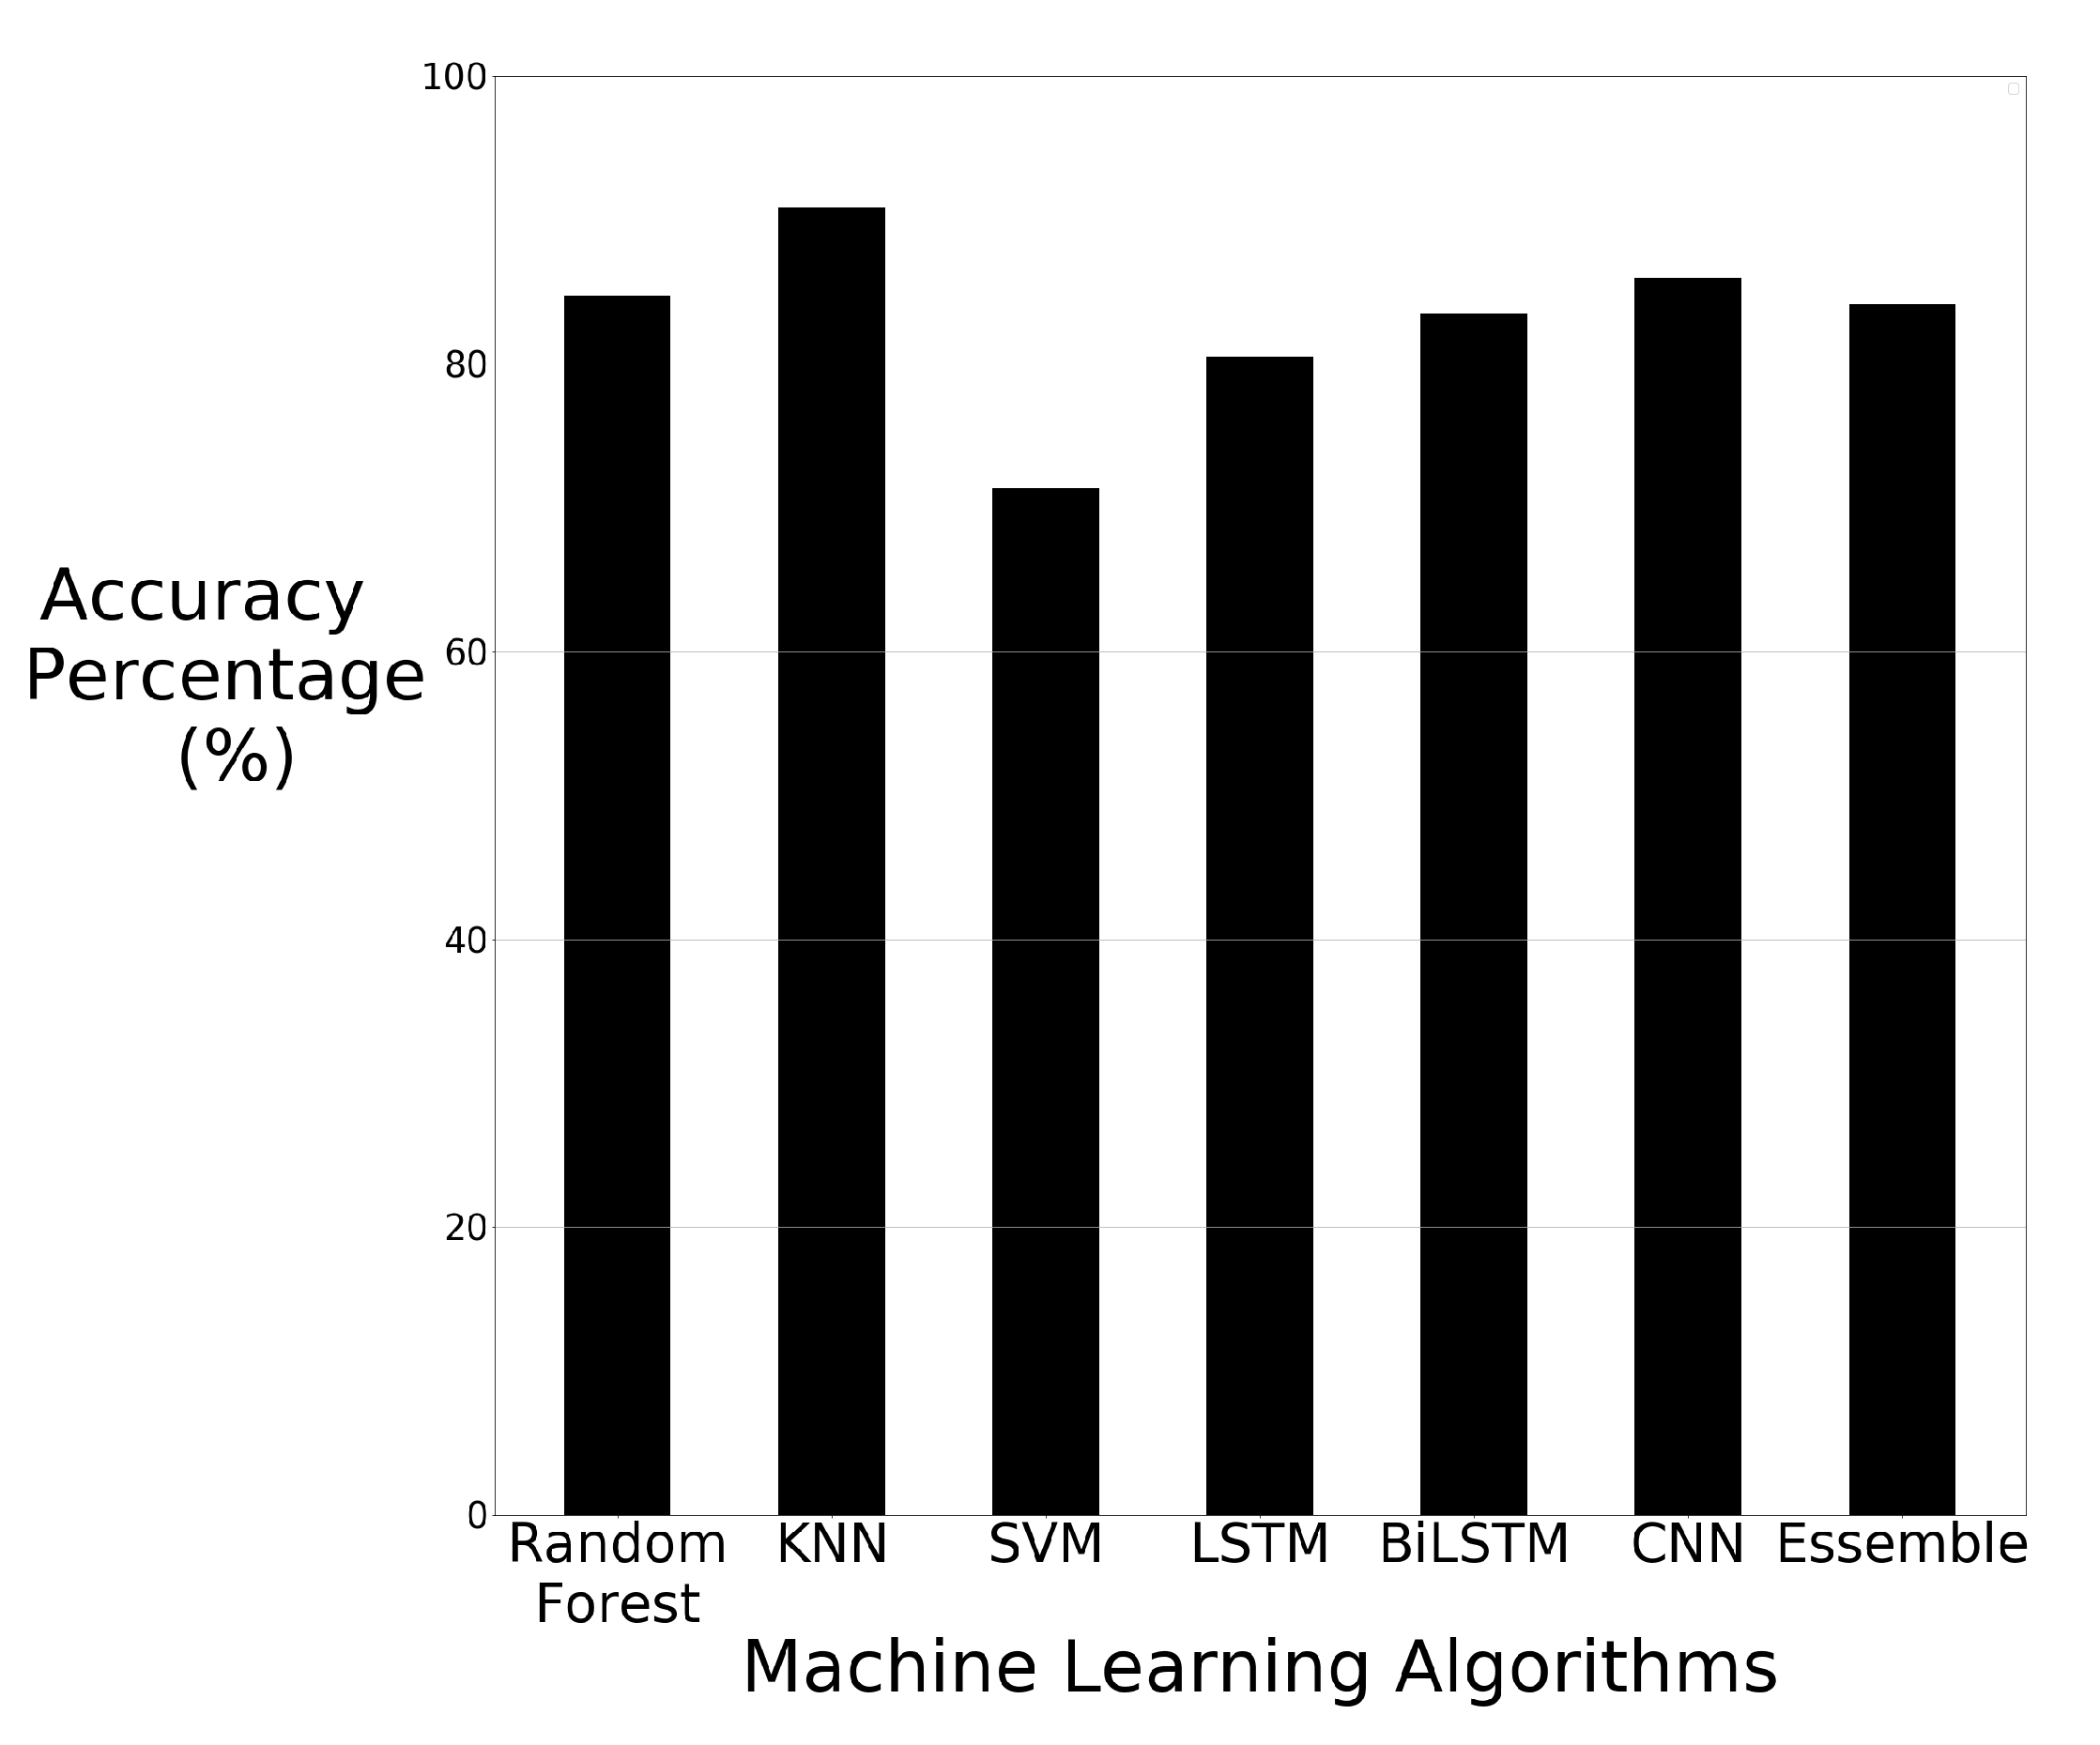
| Random Forest | 84.75% | 0.86 | 0.85 | 0.85 |
| KNN | 90.85% | 0.91 | 0.91 | 0.91 |
| SVM | 71.34% | 0.74 | 0.71 | 0.71 |
| LSTM | 80.48% | 0.83 | 0.80 | 0.80 |
| BiLSTM | 83.53% | 0.87 | 0.84 | 0.84 |
| CNN | 85.97 % | 0.86 | 0.86 | 0.86 |
| Algorithm | Accuracy | Precision | Recall | F1-Score |
|---|---|---|---|---|
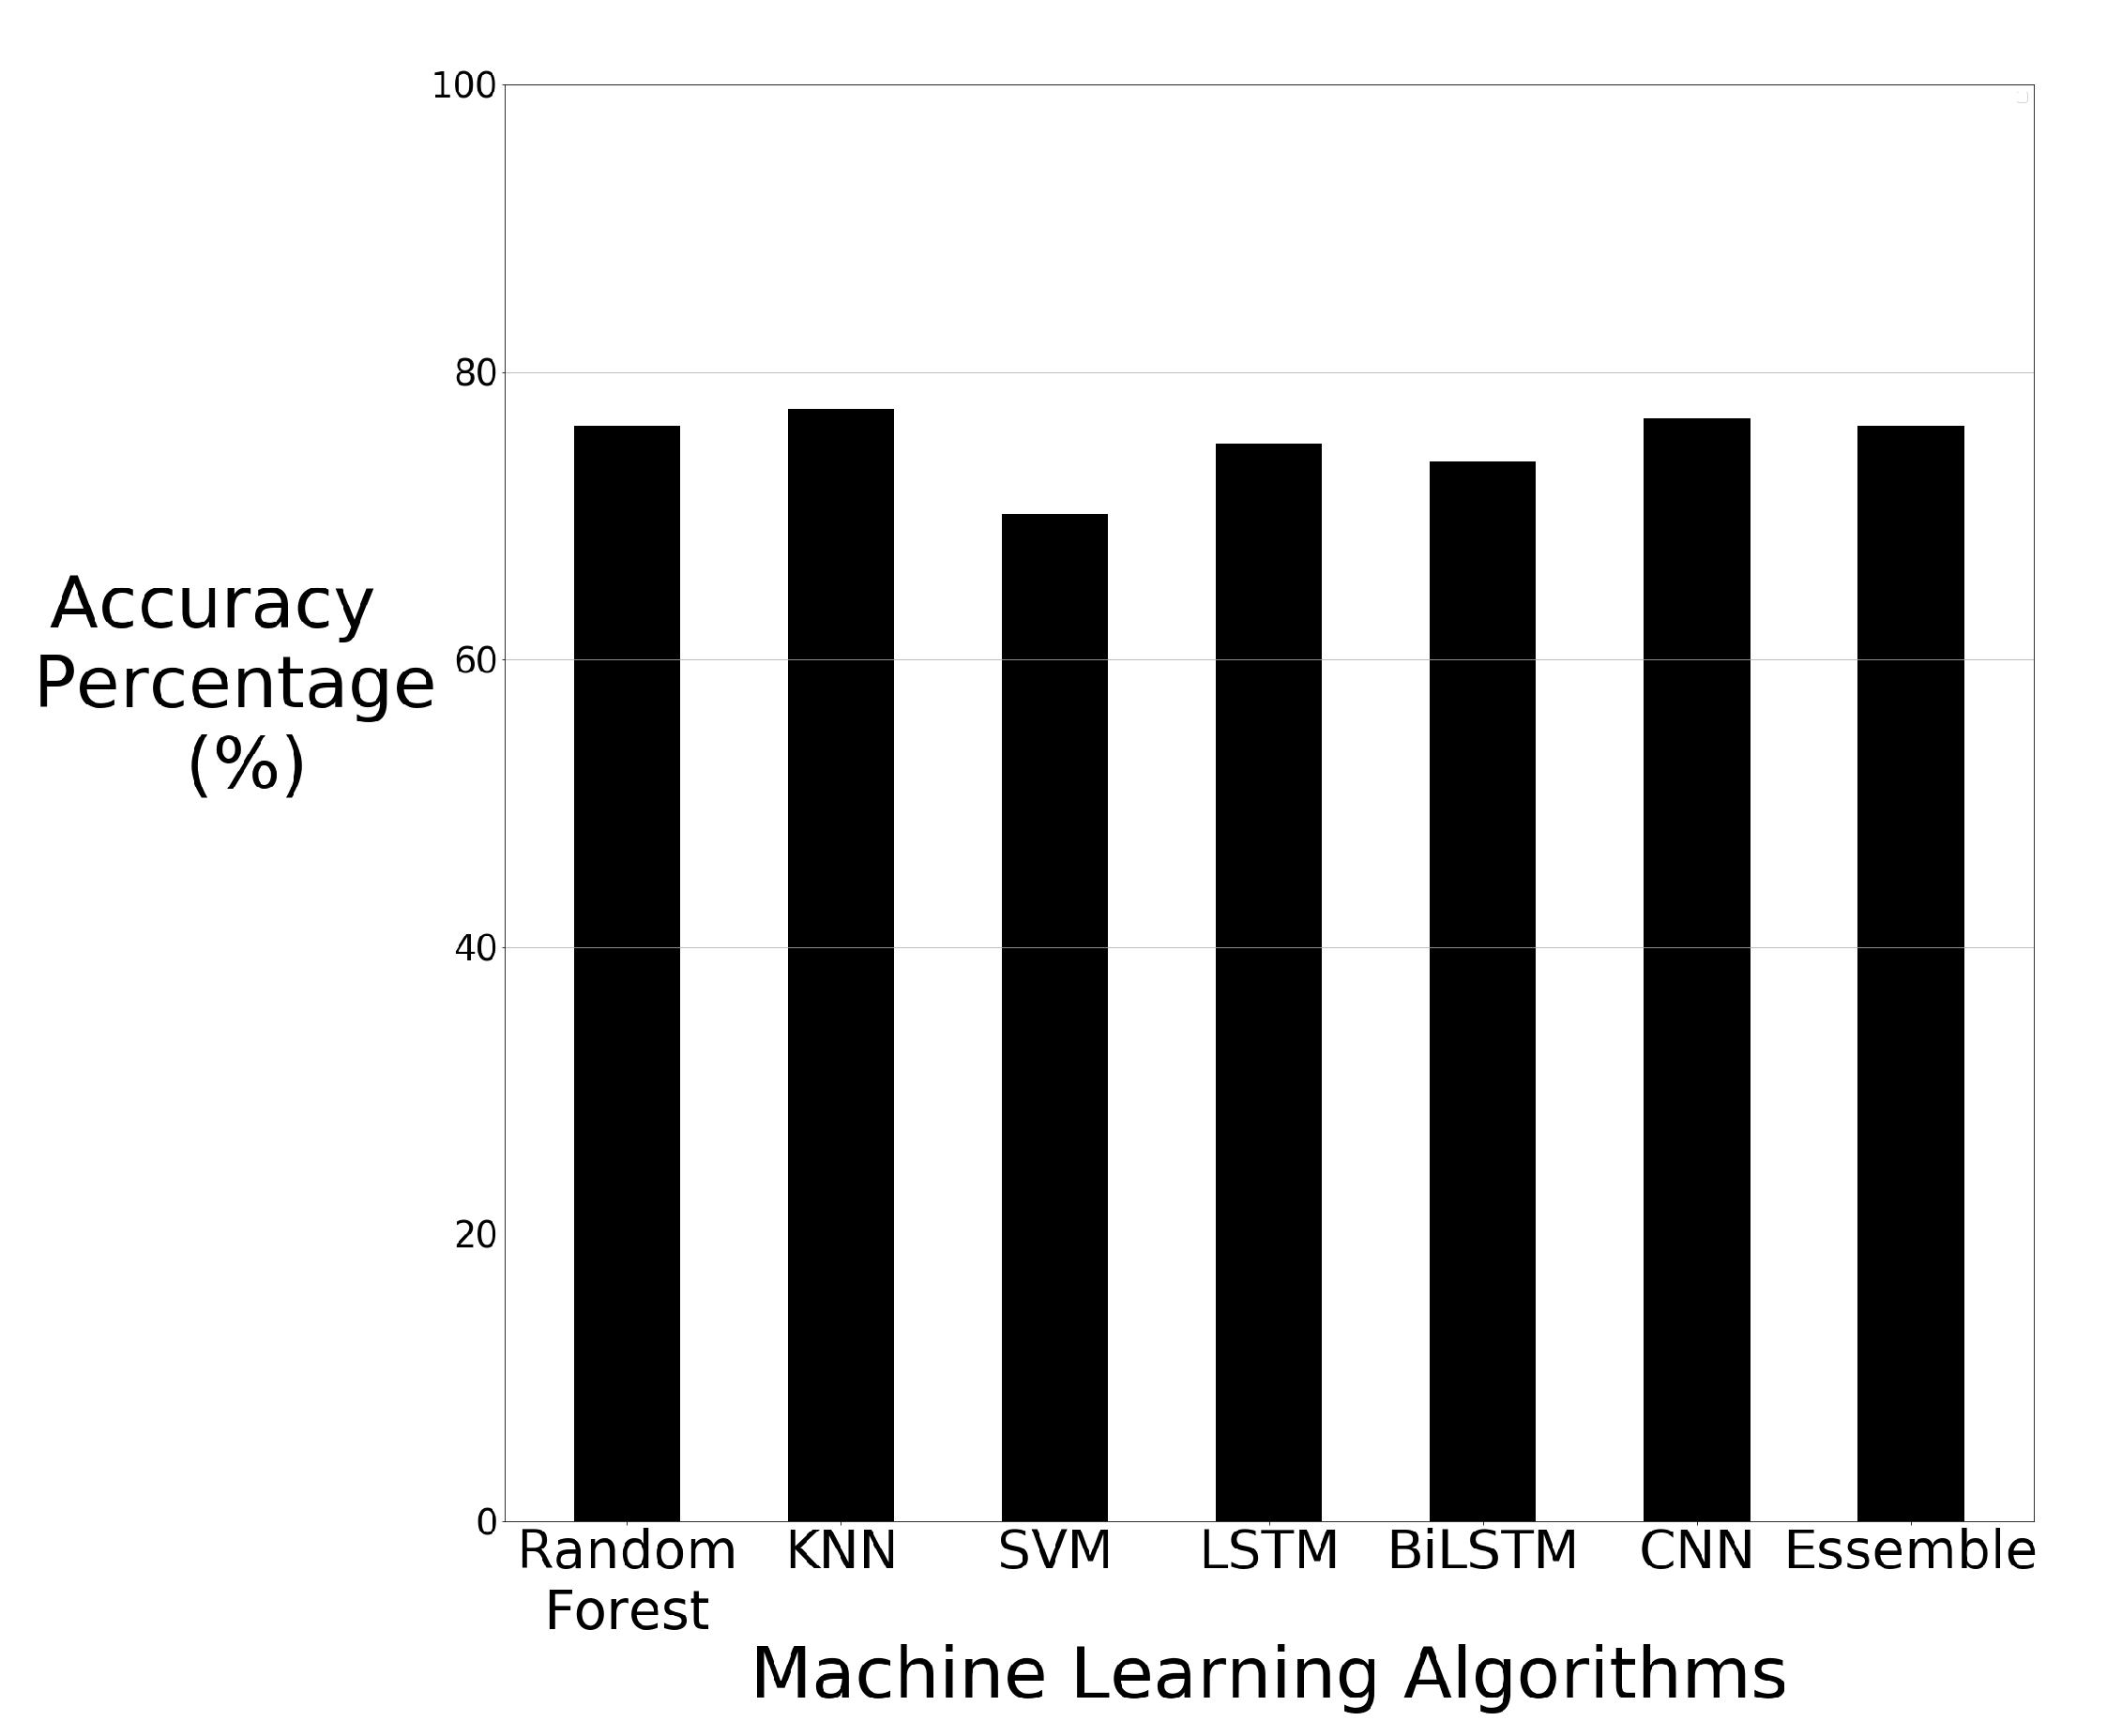
| Random Forest + PCA | 76.21% | 0.78 | 0.76 | 0.76 |
| KNN + PCA | 77.43% | 0.78 | 0.77 | 0.77 |
| SVM + PCA | 70.12 % | 0.71 | 0.70 | 0.70 |
| LSTM + PCA | 75.00% | 0.76 | 0.75 | 0.75 |
| BiLSTM + PCA | 73.78% | 0.74 | 0.74 | 0.74 |
| CNN + PCA | 76.82% | 0.78 | 0.77 | 0.77 |
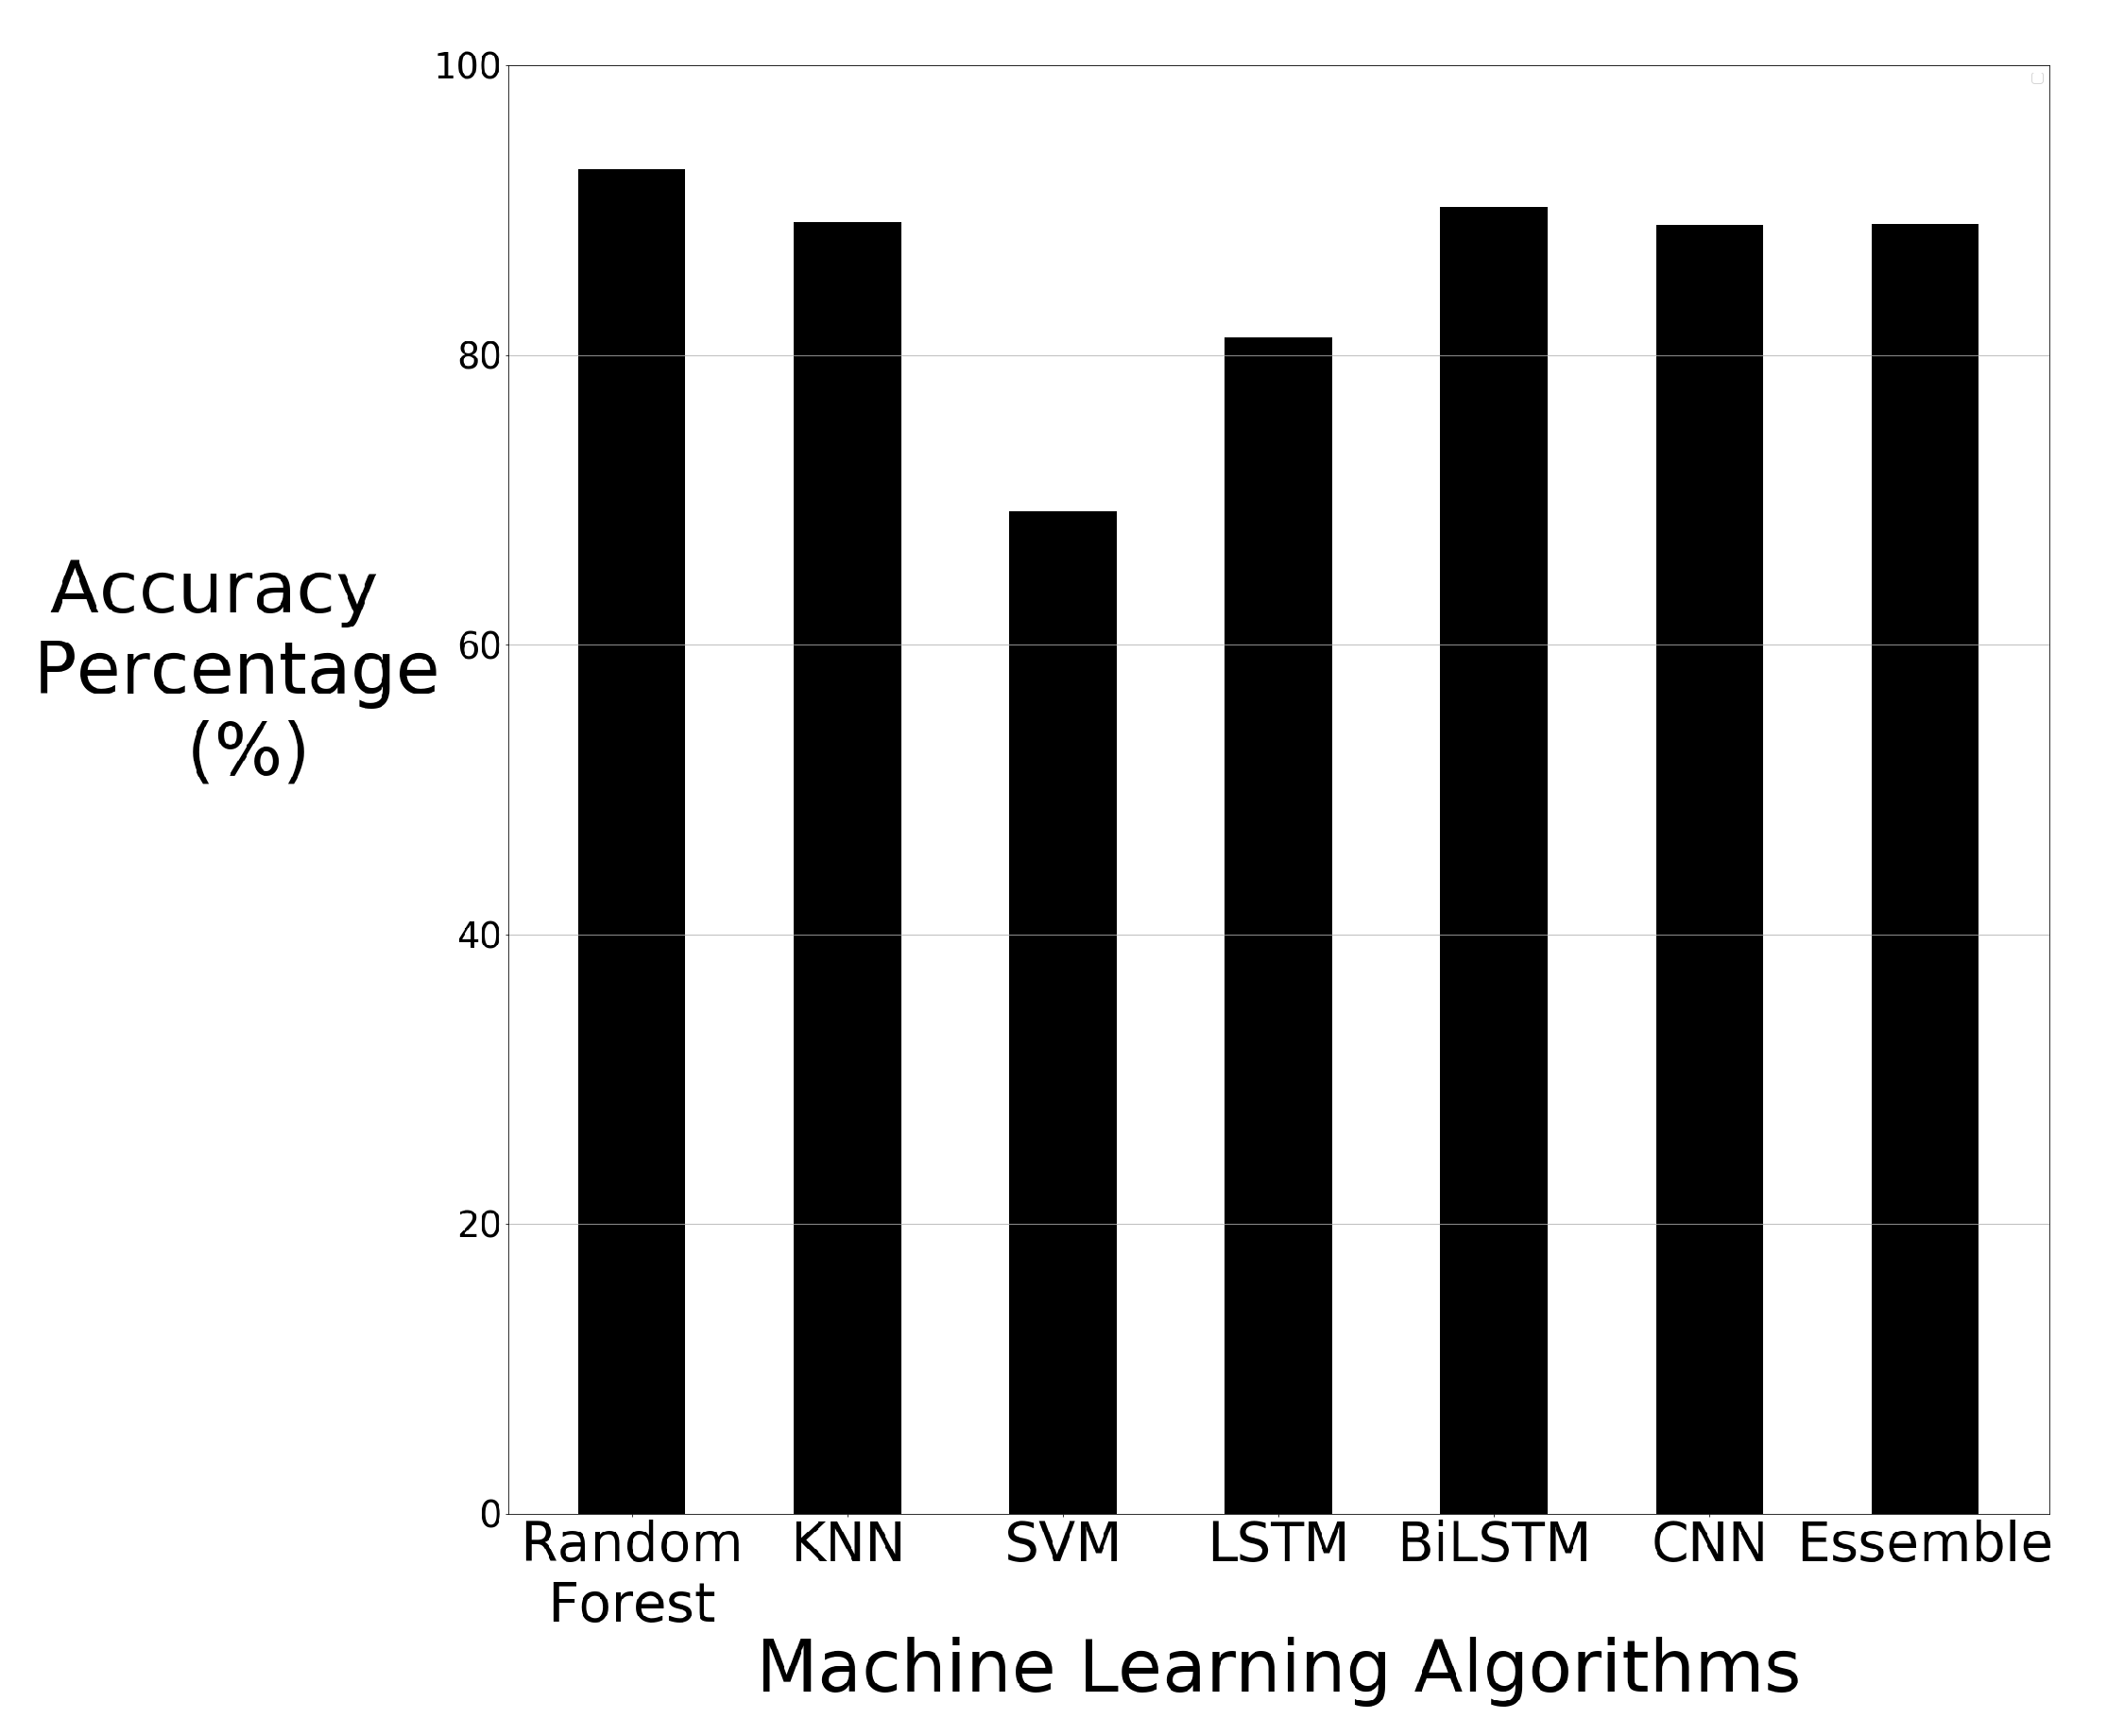
| Algorithm | Accuracy | Precision | Recall | F1-Score |
|---|---|---|---|---|
| Random Forest | 92.85% | 0.93 | 0.93 | 0.93 |
| KNN | 89.18% | 0.89 | 0.89 | 0.89 |
| SVM | 69.18% | 0.70 | 0.69 | 0.69 |
| LSTM | 81.22% | 0.83 | 0.81 | 0.81 |
| BiLSTM | 90.20% | 0.90 | 0.90 | 0.90 |
| CNN | 88.97% | 0.91 | 0.89 | 0.89 |
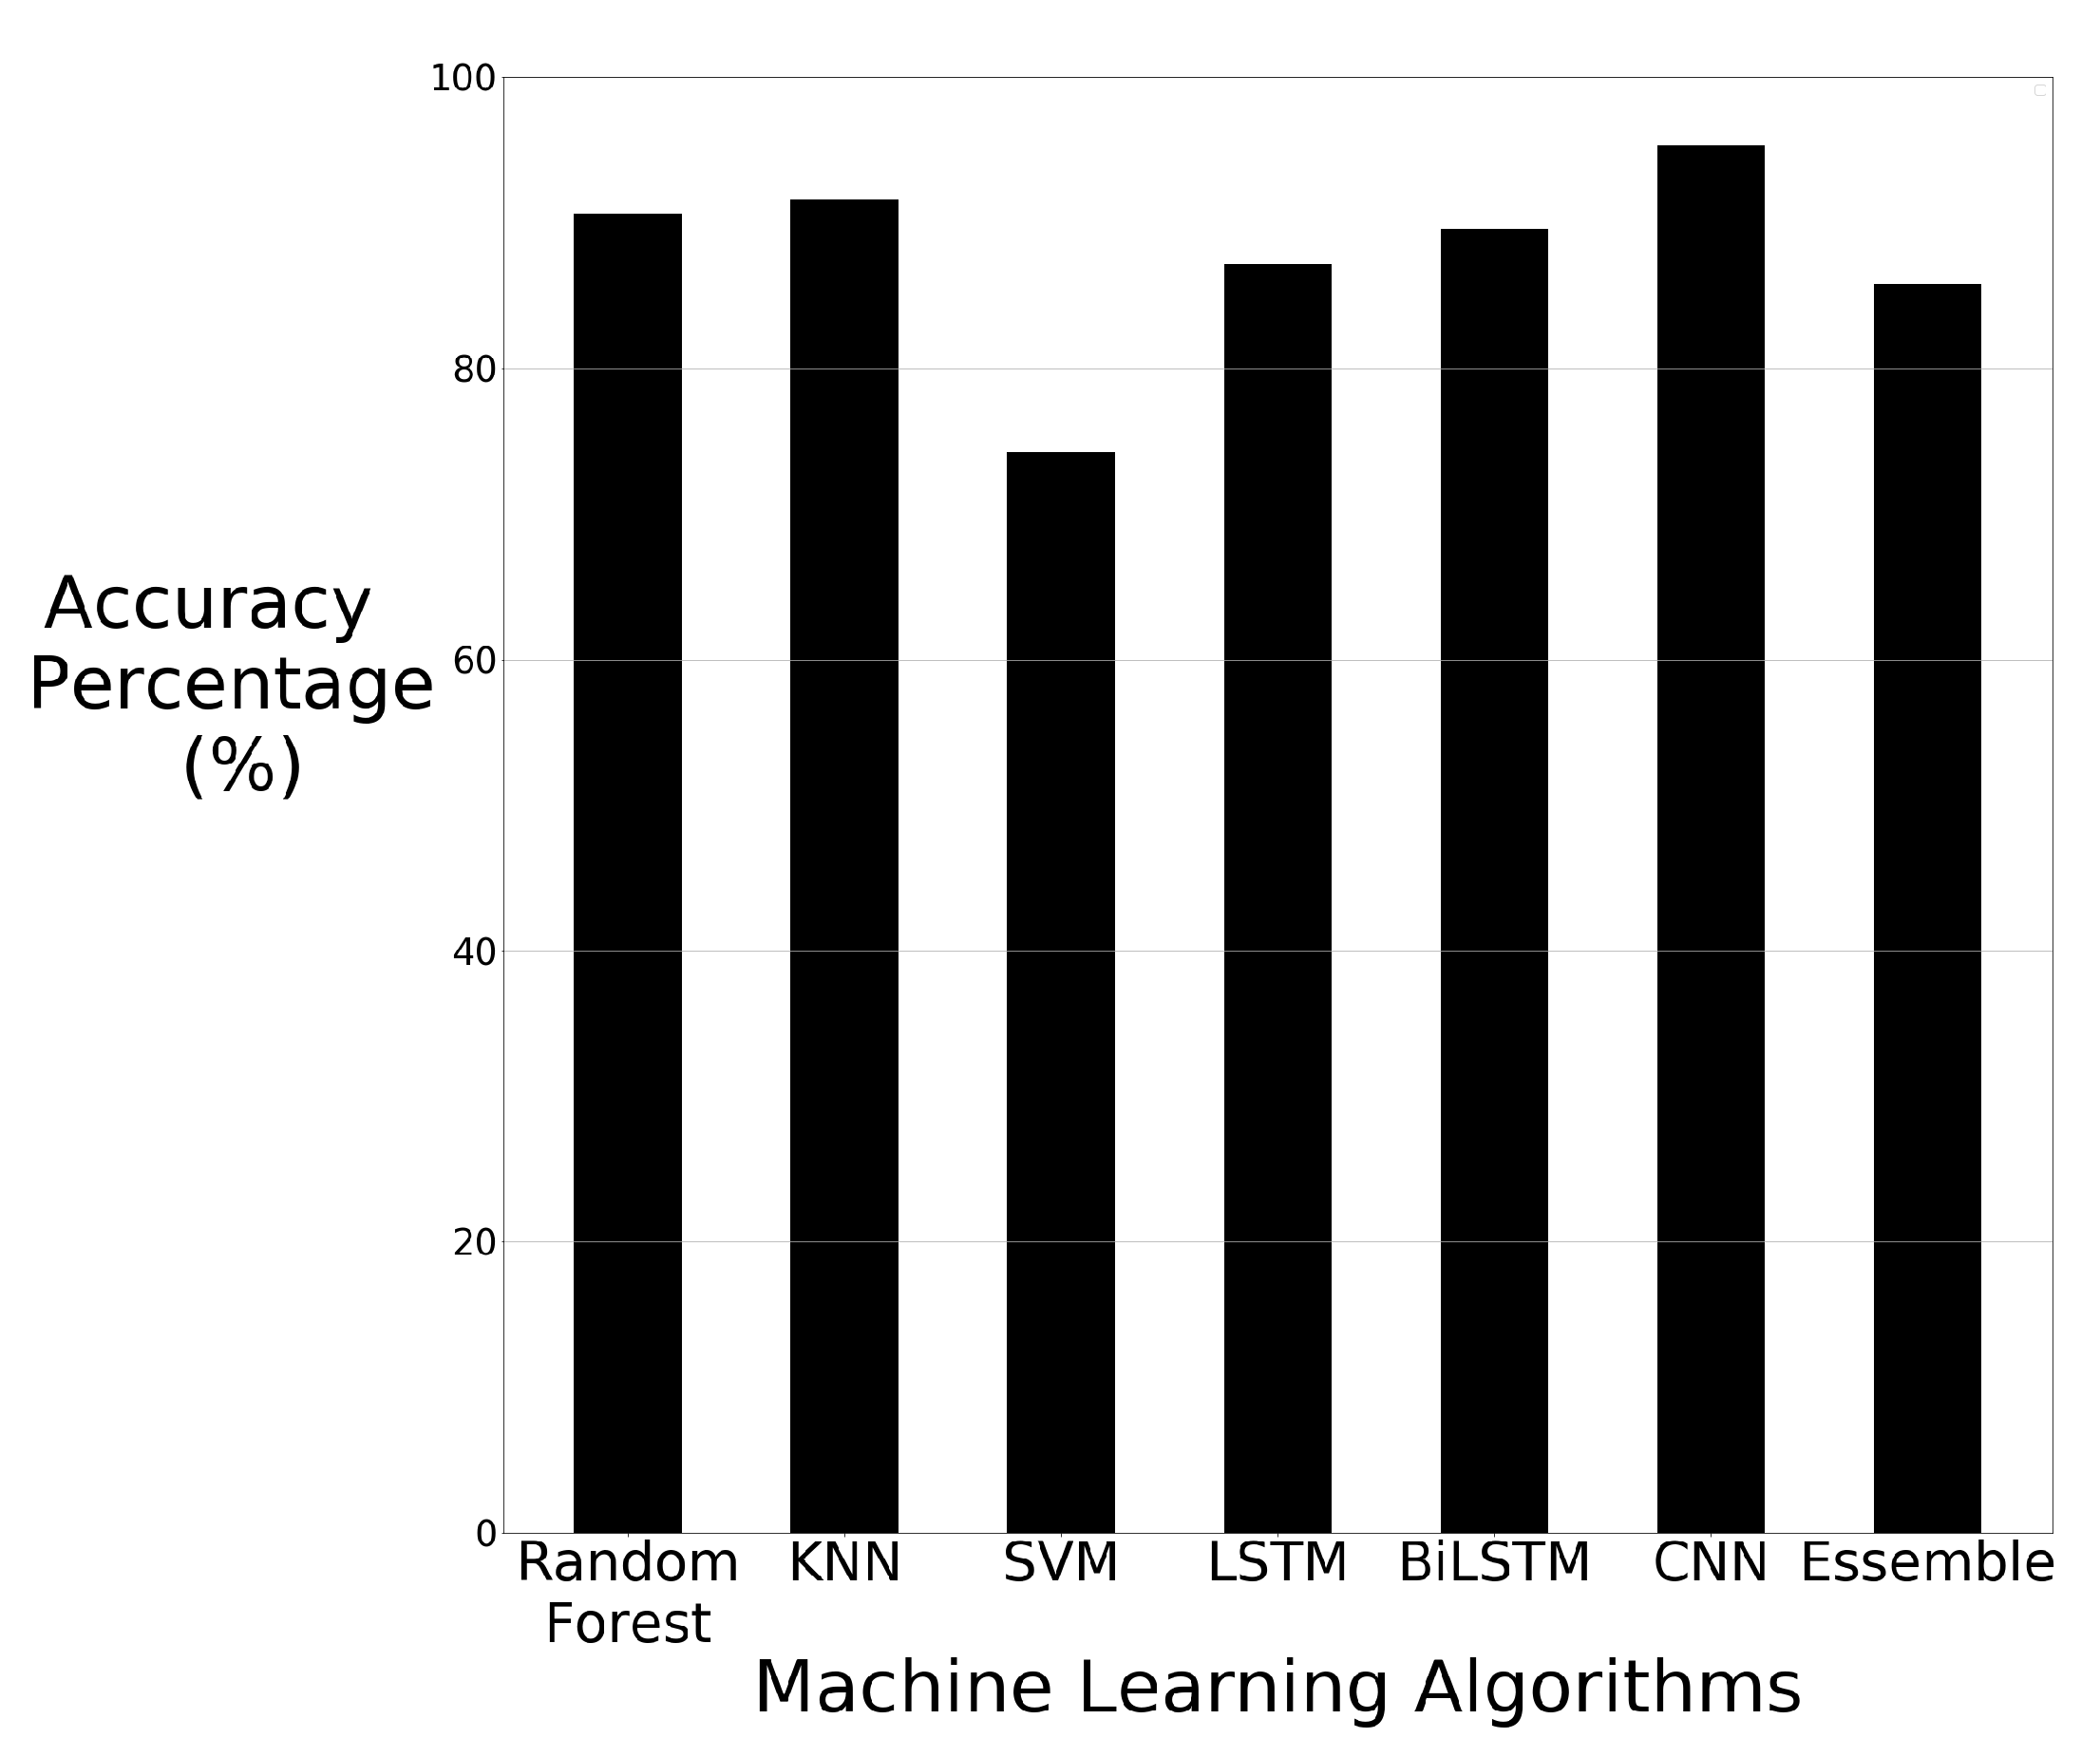
| Algorithm | Accuracy | Precision | Recall | F1-Score |
|---|---|---|---|---|
| Random Forest + PCA | 90.61% | 0.91 | 0.91 | 0.91 |
| KNN + PCA | 91.63 % | 0.92 | 0.92 | 0.92 |
| SVM + PCA | 74.28 % | 0.75 | 0.74 | 0.74 |
| LSTM + PCA | 87.14% | 0.88 | 0.87 | 0.87 |
| BiLSTM + PCA | 89.59% | 0.90 | 0.90 | 0.90 |
| CNN + PCA | 95.30% | 0.95 | 0.95 | 0.95 |
Publisher’s Note: MDPI stays neutral with regard to jurisdictional claims in published maps and institutional affiliations. |
© 2021 by the authors. Licensee MDPI, Basel, Switzerland. This article is an open access article distributed under the terms and conditions of the Creative Commons Attribution (CC BY) license (https://creativecommons.org/licenses/by/4.0/).
Share and Cite
Taylor, W.; Dashtipour, K.; Shah, S.A.; Hussain, A.; Abbasi, Q.H.; Imran, M.A. Radar Sensing for Activity Classification in Elderly People Exploiting Micro-Doppler Signatures Using Machine Learning. Sensors 2021, 21, 3881. https://doi.org/10.3390/s21113881
Taylor W, Dashtipour K, Shah SA, Hussain A, Abbasi QH, Imran MA. Radar Sensing for Activity Classification in Elderly People Exploiting Micro-Doppler Signatures Using Machine Learning. Sensors. 2021; 21(11):3881. https://doi.org/10.3390/s21113881
Chicago/Turabian StyleTaylor, William, Kia Dashtipour, Syed Aziz Shah, Amir Hussain, Qammer H. Abbasi, and Muhammad A. Imran. 2021. "Radar Sensing for Activity Classification in Elderly People Exploiting Micro-Doppler Signatures Using Machine Learning" Sensors 21, no. 11: 3881. https://doi.org/10.3390/s21113881
APA StyleTaylor, W., Dashtipour, K., Shah, S. A., Hussain, A., Abbasi, Q. H., & Imran, M. A. (2021). Radar Sensing for Activity Classification in Elderly People Exploiting Micro-Doppler Signatures Using Machine Learning. Sensors, 21(11), 3881. https://doi.org/10.3390/s21113881