Article

A Highly Sensitive Refractive Index Sensor Based on a V-Shaped Photonic Crystal Fiber with a High Refractive Index Range

State Key Laboratory of Synthetical Automation for Process Industries, College of Information Science and Engineering, Northeastern University, Shenyang 110819, China
*
Author to whom correspondence should be addressed.
Sensors 2021, 21(11), 3782; https://doi.org/10.3390/s21113782
Submission received: 11 May 2021 / Revised: 26 May 2021 / Accepted: 27 May 2021 / Published: 29 May 2021
(This article belongs to the Section Optical Sensors)

Abstract

:
This paper proposes a highly sensitive surface plasmon resonance (SPR) refractive index sensor based on the photonic crystal fiber (PCF). The optical properties of the PCF are investigated by modulating the refractive index of a liquid analyte. The finite element method (FEM) is used to calculate and analyze the PCF structure. After optimization, the fiber can achieve high linearity of 0.9931 and an average refractive index sensitivity of up to 14,771.4 nm/RIU over a refractive index range from 1.47 to 1.52, with the maximum wavelength sensitivity of 18,000.5 nm/RIU. The proposed structure can be used in various sensing applications, including biological monitoring, environmental monitoring, and chemical production with the modification and analysis of the proposed structure.

1. Introduction

The waveguide characteristics and structural controllability of photonic crystal fibers (PCFs) [1] have led to the high popularity of the PCF-based surface plasmon resonance (SPR) devices. With the development of the SPR sensors, more of its peculiarity has been discovered and discussed. The SPR-based optical fiber sensor has the advantages of ultra-high sensitivity [2] and resolution [3], fast response speed [4], small size [5], and real-time detection capability [6], and they have been widely applied to the environmental monitoring, disease diagnosis, biological analysis [7], and many other fields [8,9,10,11]. Fiber SPR sensors generally have higher refractive index (RI) sensitivities than the RI sensors based on the fiber grating or interferometer, and thus have been widely applied to many fields [12]. Commonly, to increase the evanescent wave outside an optical fiber, a certain amount of or the entire optical fiber cladding is deployed on a traditional SPR optical fiber sensor [13].
In recent years, many studies on improving the sensors’ performances have been conducted. Liang et al. [14] proposed a D-shaped PCF-RI sensor with a different coating combination and added Graphene and Zinc Oxide above silver as a plasmonic exciton source material, thus achieving an average sensitivity of 6000 nm/RIU in the refractive index range of 1.37–1.41. This sensor has excellent stability and a good specialty for oxidation resistance, but its sensitivity is two times lower than the proposed sensor and its detection range is also small. Al Mahfuz et al. [15] designed a highly sensitive PCF-SPR biosensor having a maximum wavelength sensitivity of 12,000 nm/RIU in the measurement range from 1.33 to 1.40 for both gold and silver as plasmonic materials, this sensor has high sensitivity and the advantage of being easy to prepare. Wang et al. [16] proposed a refractive index sensor based on PCF with ultra-wide detection range from 1.29 to 1.49, which filled the central air holes with analyte and preformed the fiber with gold wires. This sensor has a wide detection range and stability, but to realize this fiber, the requirements of temperature, pressure and tension are very high. Yang et al. [17] presented a graphene-Au coated PCF sensor with a side-polish D-shaped plane, where graphene on gold helped to enhance the sensor’s sensitivity because it could stably adsorb biomolecules and increase the propagation constant of the surface plasmon polarization.
In this paper, a V-shaped highly-sensitive SPR-PCF refractive index sensor is proposed. The finite element method (FEM) is used to calculate and analyze the PCF structure [18]. A nano-level gold film is coated on the second layer of the proposed structure to excite the SPR, and an analyte liquid is infused in the second, third and fourth V-shaped layers. The simulation results show that the resonance wavelength of the loss curve follows a linear fitting rule [19] within the detecting range. After optimization, high sensitivity of up to 14,771.4 nm/RIU is obtained.

2. Proposed Structure Design and Working Principle

The two-dimension (2D) cross-sectional view of the proposed SPR-PCF refractive index sensor is shown in Figure 1a, where it can be seen that the proposed structure has four layers of air holes. In the y-axis lattice, two adjacent air-holes center-to-center distance, which is defined as a lattice constant p1 is 1.7 μm, and in the x-axis lattice, the center-to-center distance is defined as a lattice constant p2, and p2 = 2.0 μm. The diameter d1 is 1.4 μm, and the inner diameter of the hole having the metal layer d2 is 1.6 μm. A thin gold layer is used as a plasmonic material, and its diameter tg is 30 nm. The dielectric constant of gold is characterized by the Drude-Lorentz model, and the middle diameter denoted as d3 is 0.7 μm, while the diameter d4 is 1.7 μm. A V-shaped structure is used to fill in an analyte liquid, and to minimize the air holes between the fiber core and metal layer.
The proposed design uses the partial filling technology [20] to infuse refractive index sensitive liquid materials selectively into the second, third and fourth layers of air holes closest to the gold coated layer so that the surface plasmons can efficiently and effectively propagate through the metal-dielectric surface. First, the UV glue carried by the mental tip is aligned with the air holes of the target PCF. Second, a UV lamp is used to irradiate the end face of the PCF. Third, the end face of the PCF is inserted into the analyte, and a gas pump is used to pump it into the five air holes. Fourth, the first and second steps are reused to seal the five air holes filled with the analyte liquid. If all the air holes are filled with analyte liquid, then the fiber can’t have total reflection because of the high RI range of the analyte. The fused silica is selected in the proposed structure as the background material, and the diameter of the silica layer is 17 μm. To demonstrate the RI of fused silica, the well-known Sellmeier mathematical model is used, which is a distinct detail in the perfectly matched layer (PML) [21]; the thickness of PML is 1.0 μm, and the RI of the PML is set to be 0.03 higher than the RI of the substrate material—SiO2; the scattering boundary condition (SBC) is applied to the external section of the sensing analyte to avoid reflected echoes, and to absorb the energy of outward radiation. In the simulation, finer meshing elements were used to map the smaller air holes accurately. The computational domain took total triangular elements of 8992, edge elements of 1016, and vertex elements of 180.
The peak loss caused by the core mode resonantly coupled to the metal defect mode is presented in Figure 1b, where the dispersion relation between the y-polarized core-guided mode and plasmonic mode for analyte RI of 1.50 are presented by the black-dot and blue-dot lines, respectively. The refractive index curves leap reversely when the loss curve reaches the peak. Therefore, the refractive index of a measured object can be obtained based on the position of the loss peak. Then, the sensitivity of the proposed structure under different peak shifts is analyzed using software the COMSOL Multiphysics 5.2a software on a computer.
To distinguish the different conduction modes of this fiber, the energy distribution of coupling mode was analyzed at the wavelength in the range of 1600–1900 nm when the refractive index was 1.50, and the results are shown in Figure 2. The optical field distributions of the y-polarized core-guided mode, metal defect mode, and coupling of the core mode with the SPP mode are shown in Figure 2a–c, respectively. As the wavelength increases from 1600 nm to 1900 nm, the electric field strength of the core mode field changed from strong to weak and then to strong again. When the core mode and the metal defect mode were resonantly coupled, the core mode field energy was largely transferred and formed the resonant coupling mode.
The proposed fiber consists of fused silica. In the simulation process, the Sellmeier dispersion equation was used to set the scattering boundary conditions and finite element network, which was defined as [22]:
n ( λ ) = 1 + B 1 2 λ 2 C 1 + B 2 2 λ 2 C 2 + B 3 2 λ 2 C 3
where λ represented the wavelength of the free space in microns, and the other fitting constants were set as given in [23]. In this study, gold was used to excite the SPR.
The dispersion of gold can be described by the Drude-Lorentz model [24] as follows:
ε m = ε ω D 2 ω ( ω j γ D ) Δ ε · Ω L 2 ( ω 2 Ω L 2 ) j Γ L · ω
where ε = 5.9673 denotes the permittivity at infinite frequency, Δ ε = 1.09 is a weighting factor, and ω denotes the angular frequency of the guiding light, ω D and γ D   are the plasmon frequency and the damping frequency, and   ω D / 2 π = 2113.6 THz and γ D   / 2 π = 15.92 THz, respectively; Ω L and   Γ L represent the frequency and the spectral width of the Lorentz oscillator, and Ω L / 2 π = 650.07 THz and   Γ L / 2 π = 104.86 THz, respectively. The parameters of gold are given in [25].
In the calculation, a perfectly matching layer is introduced to absorb the radiation energy incident from different angles. By using the imaginary parts of effective refractive indices of the core and SPP modes, their confinement losses (LC) can be calculated by [26]:
L C = 20 ln 10 · 2 π λ · Im [ n eff ] × 10 6 ( dB / cm )
where λ denotes the wavelength expressed in μm which is proportional to the Im [ n eff ] that is the imaginary part of the effective refractive index. A large number of free electrons are present on the PCF coated metal surface and their free movements generate plasma waves near the metal surface. When the propagation constant of the incident light wave matches the propagation constant of the plasma wave on the metal surface, free-electron resonance in the metal film is caused. In the performance measurement, the focus was only on the y-polarized fundamental core mode since it had a sharper and higher loss peak in the propagation direction.

3. Simulation Result Analysis and Discussion

The sensing performance of the proposed structure was studied in the refractive index range from 1.470 to 1.520 with the step of 0.01. The relationship between the peak loss of the core mode versus the incident wavelength when the refractive index of the analyte increasing from 1.470 to 1.520 with the increment of 0.01 is displayed in Figure 3a. With the gradual increase in the refractive index, the resonance loss curve realized a significant red shift, and the loss value peak first gradually decreased at first and then increased. That was because the RI of SPP mode increased with the analyte’s RI, but the RI of the core mode remained unchanged, which caused the rise of the SPP mode RI curve and the red shift in the resonance wavelength. Since phase matching was satisfied between the core mode and the surface plasmon mode, the SPR was generated. The energy of the core mode was transferred to the metal surface to form a surface plasmon mode, so the core mode loss curve was generated. The increase in the refractive index of the liquid altered the phase-matching conditions. The loss matching wavelength gradually increased, and the resonance loss curve performed a significant red shift. As the refractive index of the liquid material had a high value, it was relatively prone to absorb the light. Therefore, the core loss of the fiber gradually increased with the RI of the analyte. The refractive index and peak wavelength of the linearly fitted analyte are presented in Figure 3b. Within the analyte RI range, the linear fitting result of the refractive index sensor could be expressed as y = 14,771.43x − 20,458.29, the linear fit was R2 = 0.99314, and the average sensitivity was 14,771.43 nm/RIU.
By analyzing the loss curve, the PCF sensor was reckoned that it had good refractive index sensing performance over such a high measurement range, and the lowest loss value was 2410.8 dB/cm over the test range of 1.470–1.520. Large losses could shorten the fiber’s length, making the sensor small enough to be integrated into equipment for inspection.
The wavelength sensitivity   S λ     was calculated as follows [27]:
S λ ( nm / RIU ) = Δ λ peak Δ n a
where ∆λ peak denoted the deviation between the adjacent peak wavelength shifts, and ∆na was the deviation of the analyte’s RI.
As a factor in this paper, the figure of merit (FOM) on which the sensing enactment is being influenced is discussed. The FOM was calculated as follows [28]:
FOM = S λ FWHM   ( / RIU )
where FWHM is the full width at half-maximum of the transmittance spectrum, and the FWHM of the loss curve are 41 nm, 79 nm, 135 nm, 242 nm, 252 nm and 263 nm corresponding to the RI range from 1.47 to 1.52.
An important factor of a wavelength filter is the capacity to give high wavelength selectivity, which represents a high-quality factor (Q) [29]:
Q   = λ res FWHM
where the λ res is the resonance wavelength of the core mode and the SPP mode.

3.1. Discussion on Different Structural Parameter

3.1.1. Discussion on d1 Optimal Value

As shown in Figure 4, with the increase in the analyte RI, the loss spectrum made a red shift. When d1 = 0.5 μm, the loss curves corresponding to both na = 1.48 and na = 1.49 indicated wide bandwidth, and the loss curve had a lower peak value than d1 = 0.6 μm and d1 = 0.7 μm, so it could be concluded that 0.5 μm was not a good choice for the size of d1.
The analysis results showed that d1 = 0.7 μm represented a better option than the other two parameter values since it provided a higher peak value and a lower bandwidth. The reason for this result could be the increase in the value of d1, which increased the power transmitted between the gold layer and the analyte. Under a larger value of d1, the light energy could easily penetrate into the analyte liquid, so the loss peak value was higher. When d1 > 0.7 μm, the power of light would propagate more into the second layer of analyte-filled holes, and the core mode could not resonate with the SPP mode. After optimization, d1 = 0.7 μm was selected as an optimal value of d1.

3.1.2. Discussion on d2 Optimal Value

The loss spectrum when the value of d2 varied from 0.7 μm to 0.9 μm is presented in Figure 5, where it can be seen that the loss curve showed a red shift when the refractive index of the analyte increased.
As d2 increased, the loss peak value also increased, and the loss was in direct proportion to d2. When d2 = 0.9 μm (na = 1.48), the peak value reached 3200 dB/cm, but at na = 1.49, the loss curve showed certain distortions. Using the mode field distribution map in the COMSOL software, two different plasmon modes that realized the power transmission with the core mode were observed, but these two plasmon modes’ phase matching points did not overlap. Thus, d2 = 0.9 μm did not represent an optimal solution, and d2 = 0.8 μm denoted a better option than d2 = 0.7 μm. When d2 = 0.8 μm, the loss peak value was as high as 1400 dB/cm and the bandwidth was low. Based on the analysis results comparison, d2 = 0.8 μm was selected as an optimal value for d2.

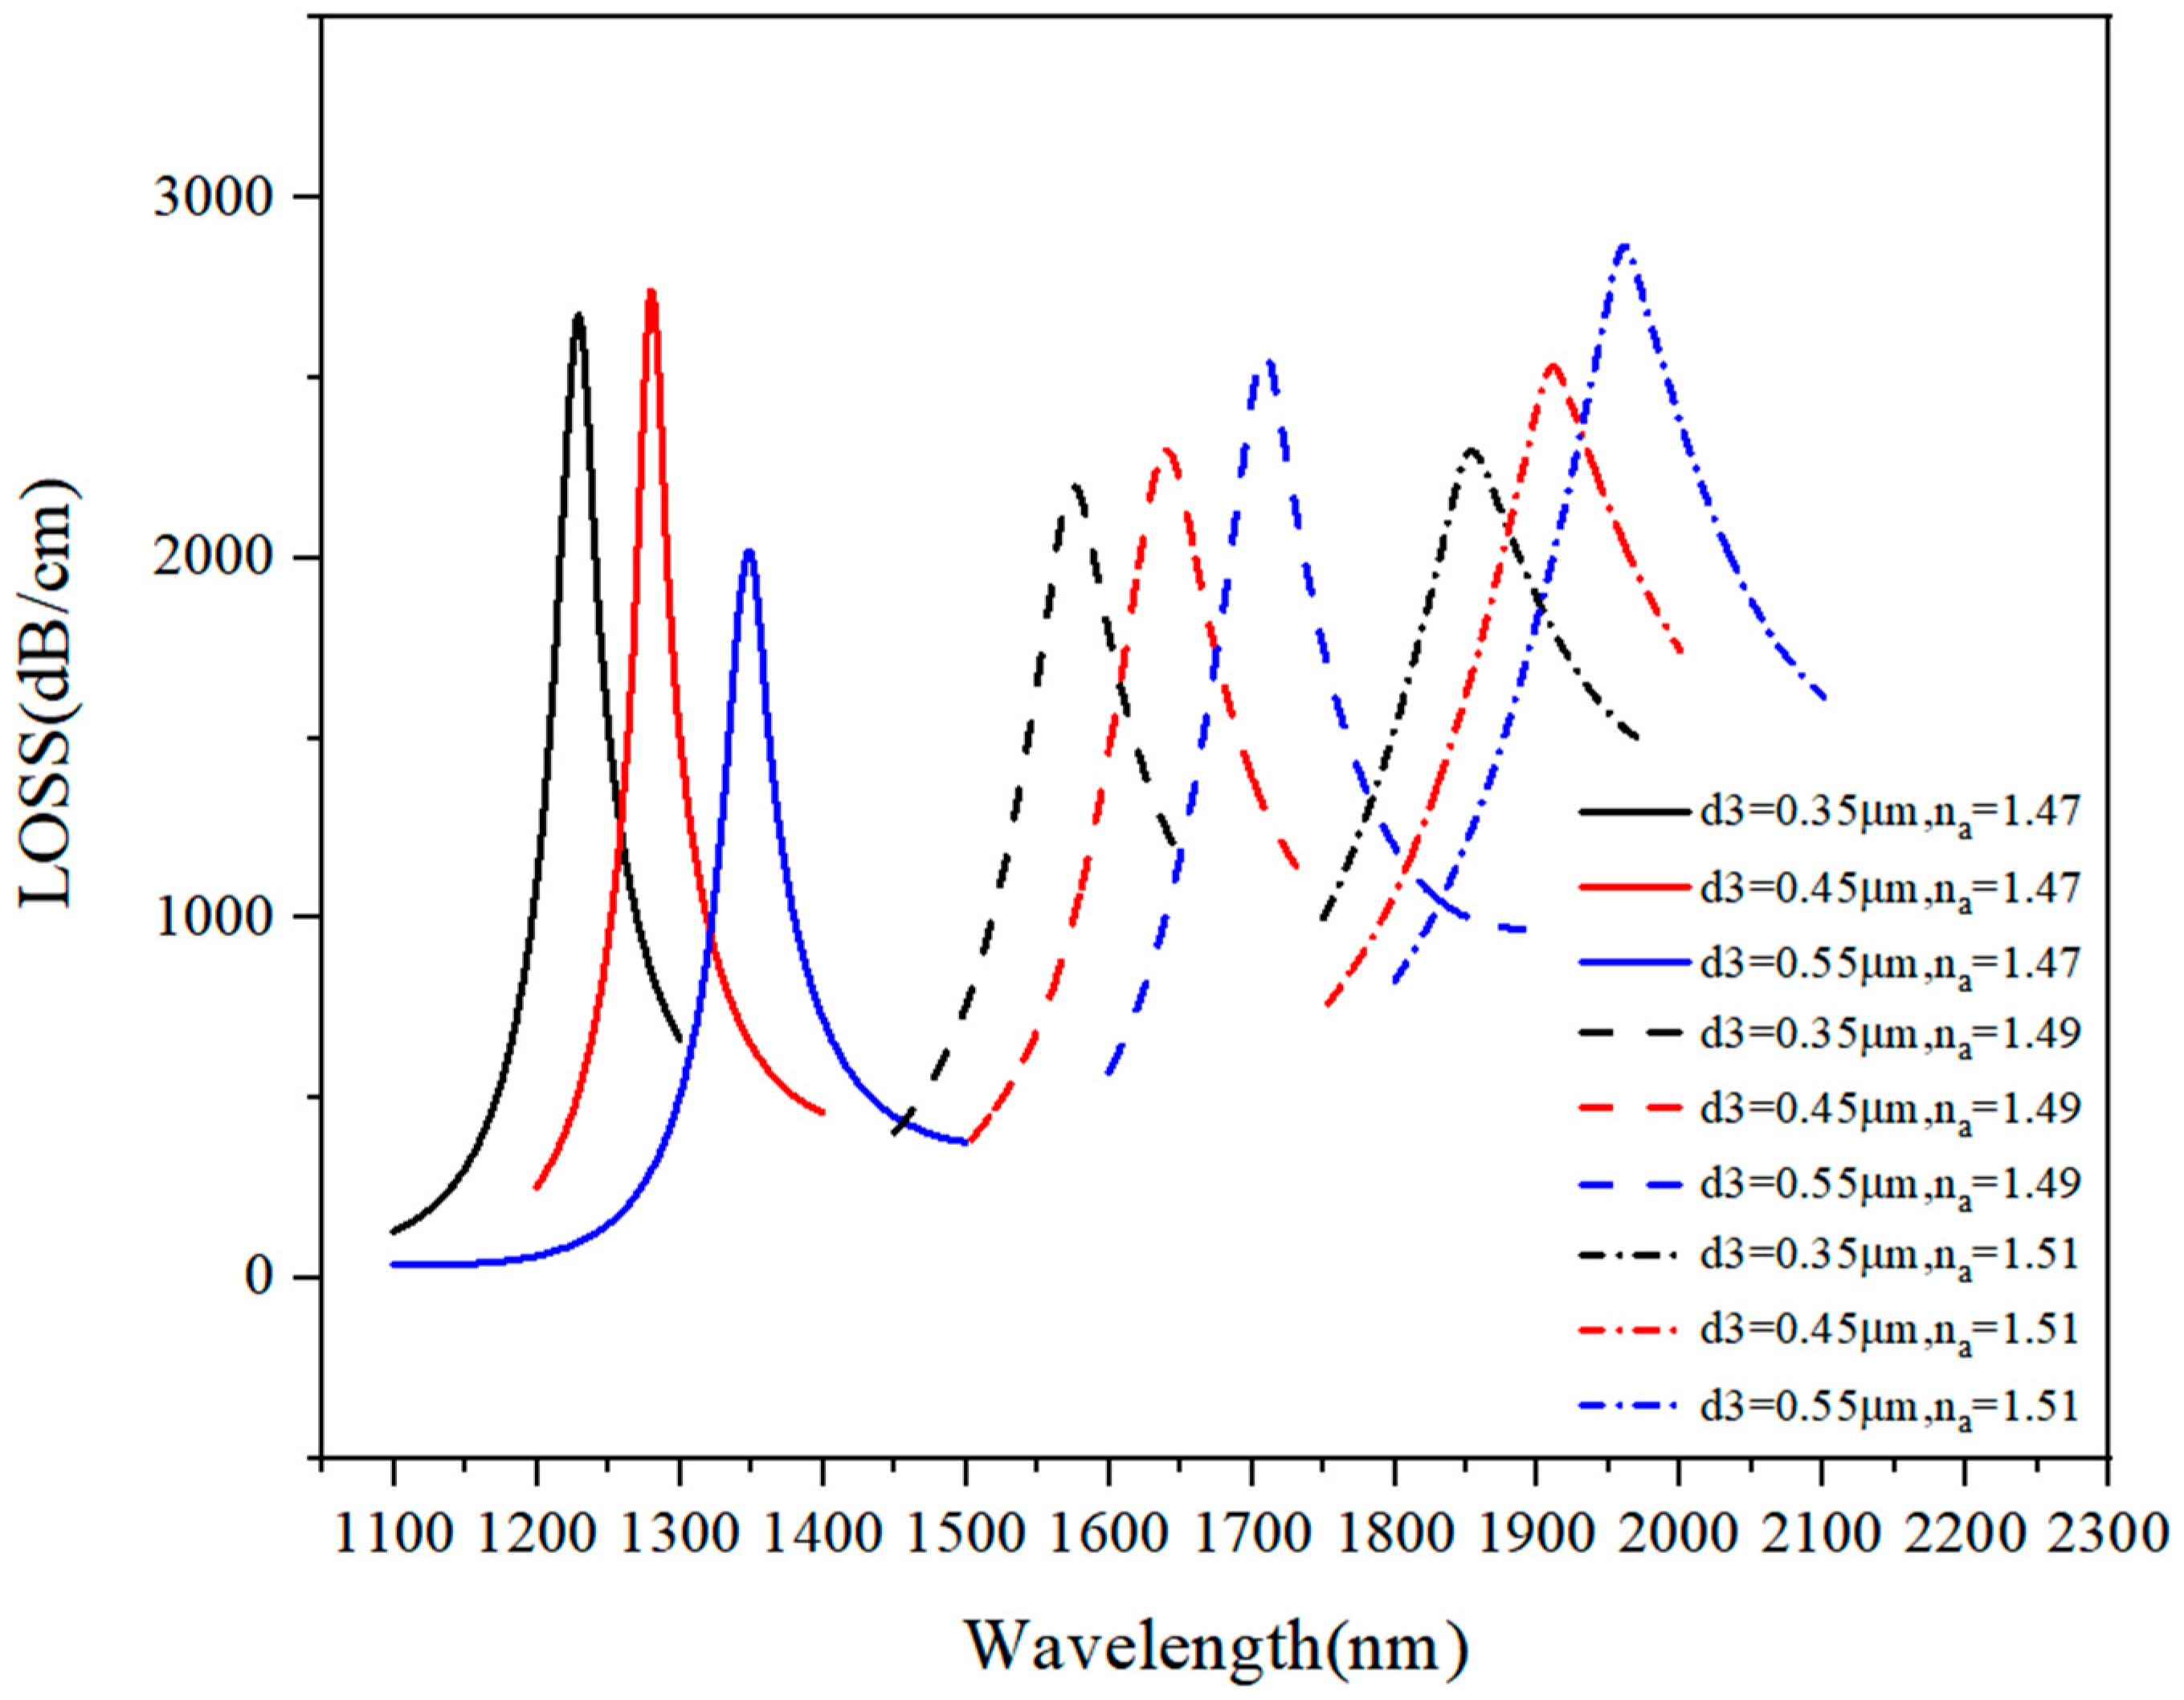
3.1.3. Discussion on d3 Optimal Value

The loss curve was also analyzed when d3 varied from 0.35 μm to 0.55 μm under na of 1.47–1.52, and the obtained results are presented in Figure 6.
When na = 1.47 and d3 = 0.55 μm, the core mode had incomplete coupling with the plasmon mode, so the loss curve had a low peak value. Besides, when d3 = 0.55 μm and d3 = 0.45 μm, the loss spectrum tended to have a higher loss peak and a lower bandwidth, but as d3 increased, the loss curve showed a red shift. The results given in Table 1, indicate that at d3 = 0.35 μm, the loss curve had a wider range (na = 1.47–1.52) than d3 = 0.45 μm and d3 = 0.55 μm, which had the range of na = 1.47–1.51; when na = 1.52, the phase matching points surpassed 2000 nm. Based on the results’ comparison, d3 = 0.35 μm was selected as an optimal value of d3.

3.1.4. Discussion on d4 Optimal Value

The loss spectrum under na of 1.47–1.52 when the d4 varied from 0.65 μm to 0.95 μm is presented in Figure 7, and the numerical results are given in Table 2, the loss curve showed a red shift when the analyte RI increased.
In contrast, when the value of d4 increased, there was no apparent shift in the loss curve. When d4 = 0.95 μm, the loss peak value reached a high value. Based on the results in Table 2, na = 1.47 was not in the sensing range, and after calculating an average sensitivity, it was found that the RI sensor had the best sensing performance when d4 = 0.85 μm. Therefore, d4 = 0.85 μm was selected as an optimal value of d4.

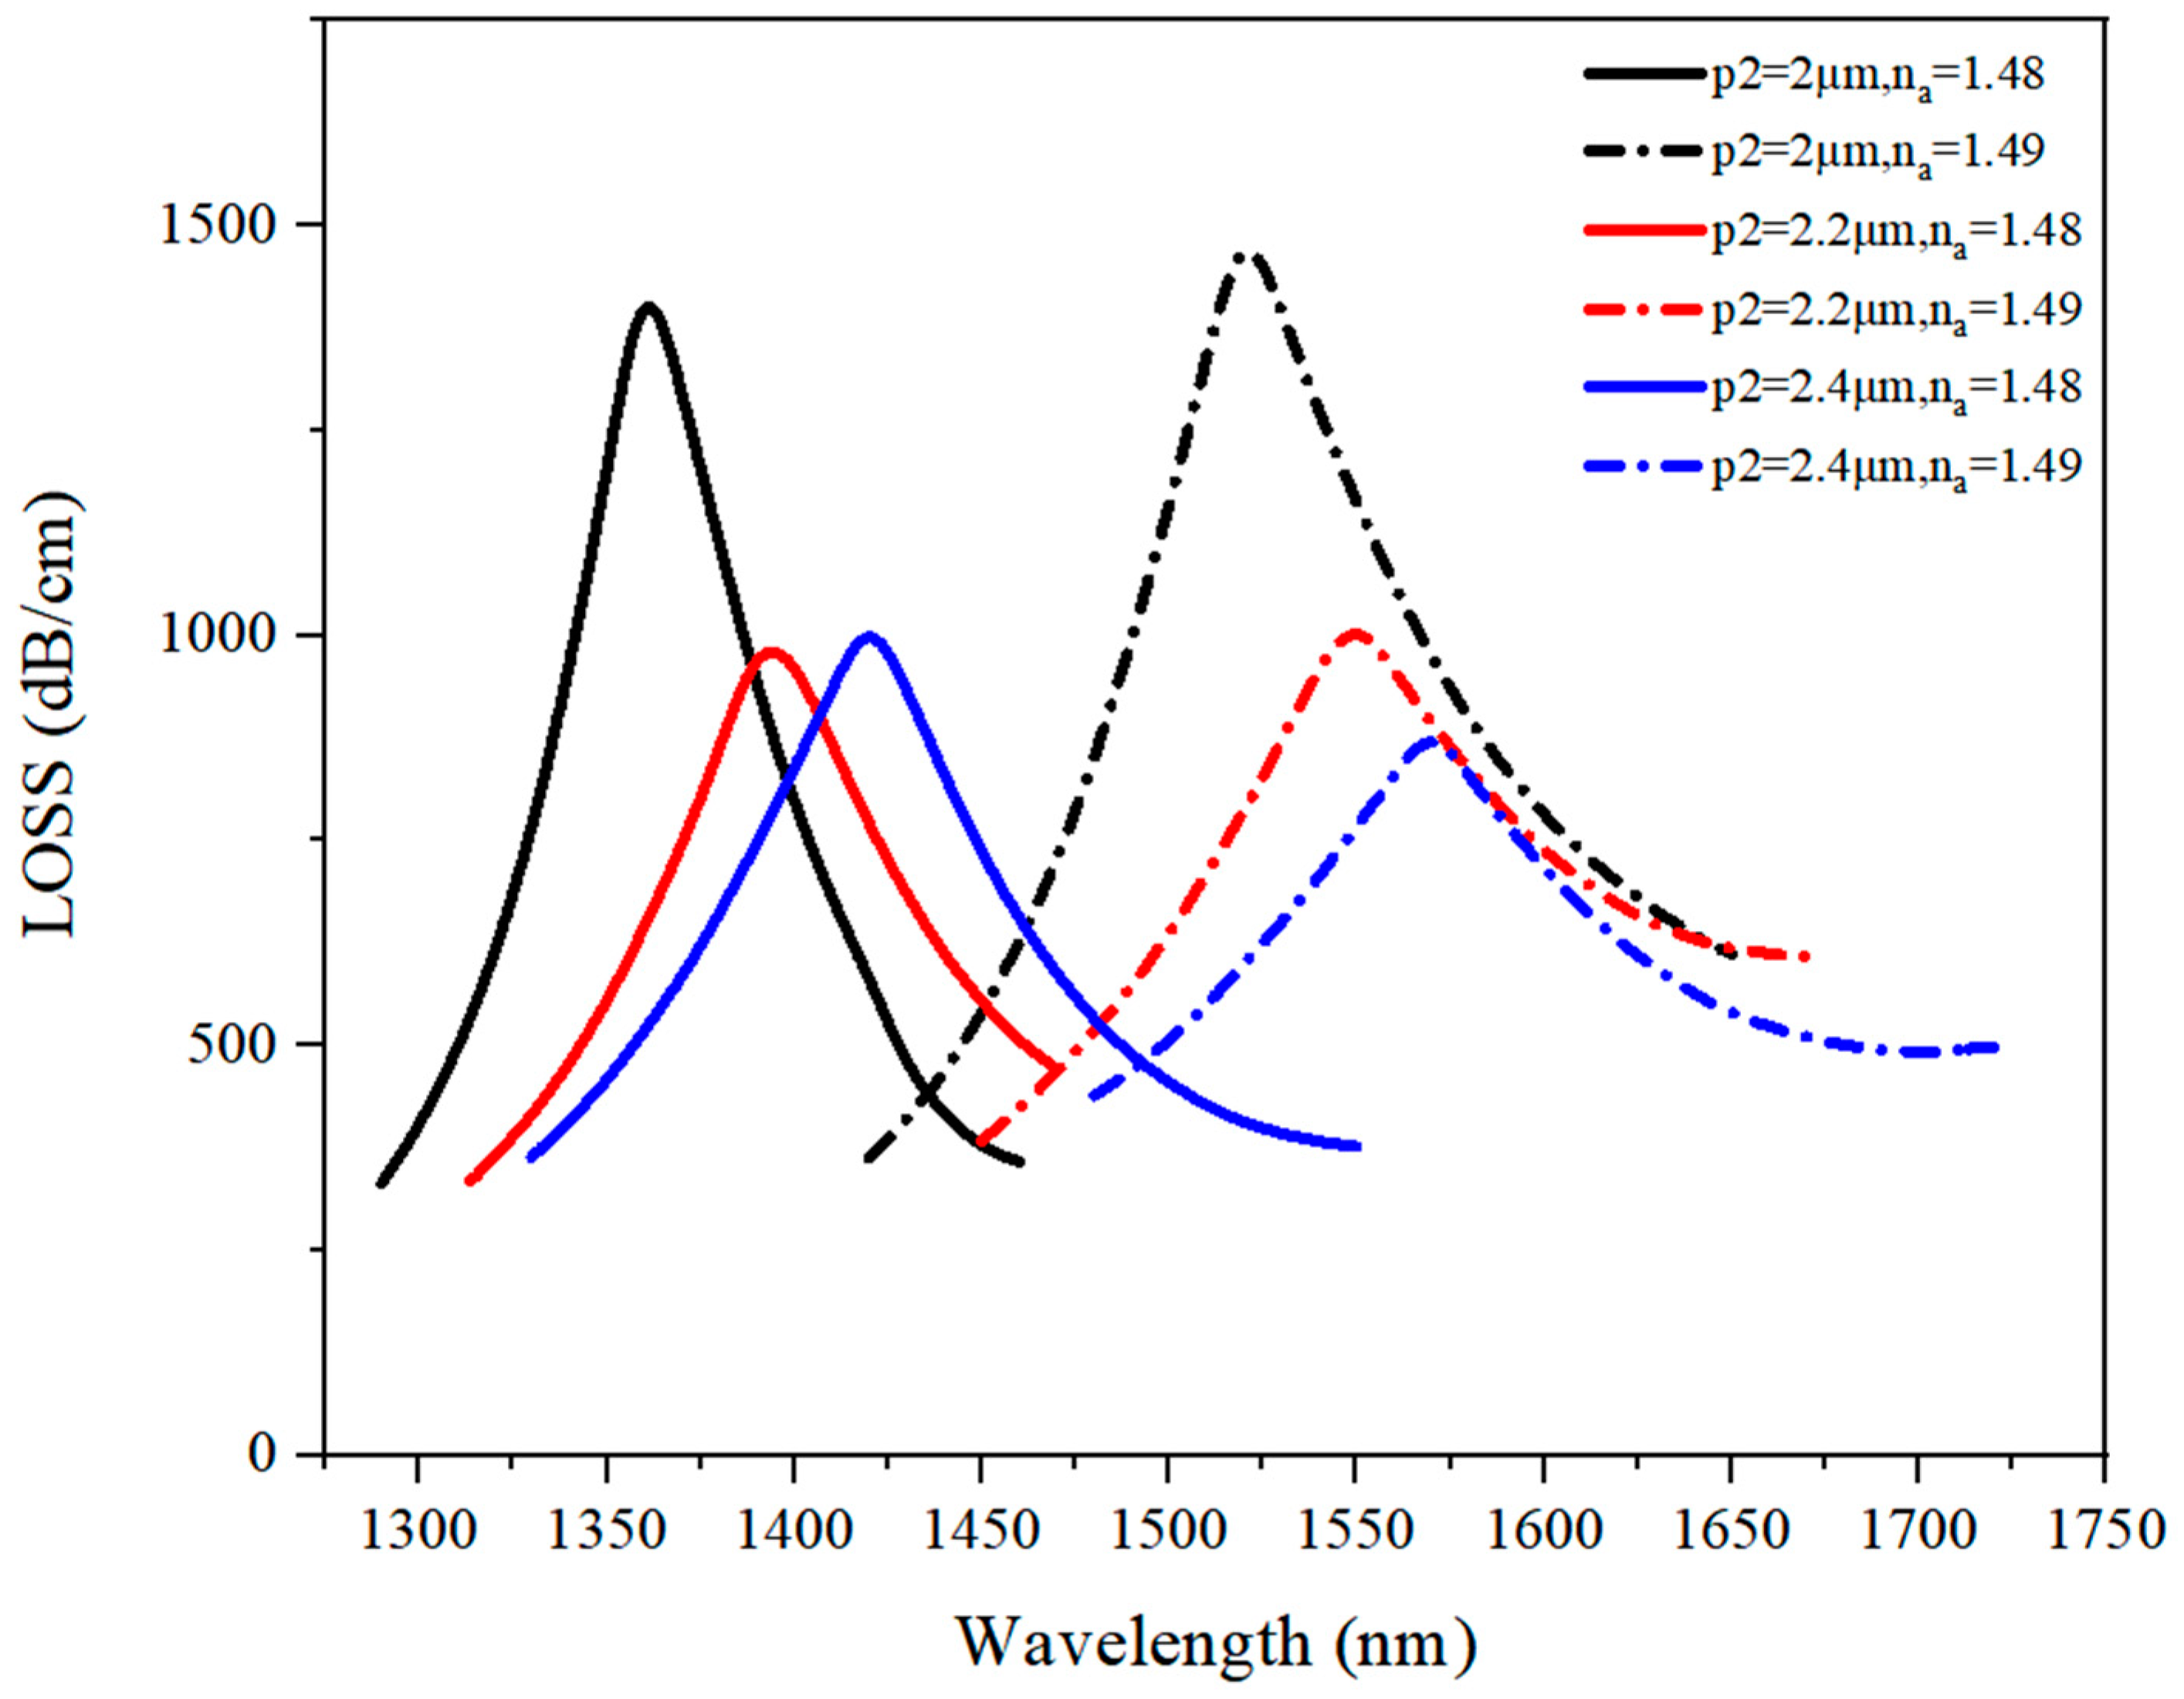
3.1.5. Discussion on p2 Optimal Value

The loss spectrum under na of 1.48–1.49 when p2 varied from 2.0 μm to 2.4 μm is presented in Figure 8.
As shown in Figure 8, the increase in both the analyte RI and the value of p2 caused the loss curve to make a red shift. When p2 = 2 μm, the loss value was higher than at p2 = 2.2 μm or p2 = 2.4 μm. Moreover, the loss curve had a lower bandwidth at p2 = 2 μm than at the other p2 values. The reason for this phenomenon was that an increase in p2 value reduced the power transmission between the gold layer and the analyte hole. As p2 increased, there was more space for the background material, fused silica, so a larger pitch reduced the surface plasmon resonance (SPR) effect.

3.1.6. Discussion on tg optimal value

The optimal value of tg was also analyzed. First, all possible values of tg from the range of 20 nm–60 nm were analyzed under na of 1.49–1.50, and the obtained results are presented in Figure 9. As shown in Figure 9, the loss curve had the highest loss peak value at tg = 50 nm, but the bandwidth was relatively large, so tg = 50 nm was discarded as a possible optimal value. Then, the loss curve was analyzed when tg value was 20 nm, 30 nm, 40 nm, and 60 nm under na of 1.48–1.53, and the obtained results are presented in Table 3. As shown in Table 4, when tg was 20 nm or 60 nm, the wavelength sensitivity was relatively low, i.e., about 12,000 nm/RIU, so only tg values of 30 nm and 40 nm were left as possible optimal values; at both of these values, the average sensitivity was at the 15,000 nm/RIU-level. Therefore, the loss corresponding to tg values of 30 nm and 40 nm were compared, and it was concluded that the loss curve corresponding to tg value of 30 nm had lower bandwidth and higher peak value than that of tg value of 40 nm, which was flatter. Consequently, a value of 30 nm was selected as an optimal tg value.

3.2. Fabrication Tolerance

During the fabrication process, it is relatively unlikely to maintain the value of the proposed structure’s parameters. Usually, the variation of ±1% in the structural parameter value during the fabrication process has been considered acceptable. However, the proposed sensor had a fabrication tolerance of ±2%, as depicted in Figure 10. The proposed optimized sensor’s parameters were d1 = 0.7 μm, d2 = 0.8 μm, d3 = 0.35 μm, d4 = 0.85 μm, tg = 30 nm, and p2 = 2 μm.
In Figure 10a,b,d, there are no obvious shifts in the loss curve, so changes in the values of tg, d1, and d4 did not have an evident effect on the loss value. As shown in Figure 10c, when the value of d2 increased, the loss curve had a tendency to perform a red shift, and the peak value also increased. Figure 10e shows that the change in the value of diameter d4 did not result in an obvious loss curve shift but affected and increased the peak value. In conclusion, the proposed sensor has an excellent fabrication tolerance ability.

4. Conclusions

In this paper, a simple PCF-based SPR sensor, which has a high sensitivity, is proposed and optimized. The analyte is deposited in a V-shape adjacent to the gold layer to minimize the fabrication complexity and improve the sensing performance. Under the optimized sensor parameters, the proposed sensor shows a maximum wavelength sensitivity of 18,005.2 nm/RIU and an average sensitivity of 14,771.42 nm/RIU in the analytes measurement range of 1.47 and 1.52. The fabrication tolerance investigation has shown that the sensor parameters vary by ±2%, but these variations have no evident impacts on the sensing performance. Due to its simple structure and outstanding sensing characteristics, the proposed biosensor can be deployed in the liquid refractive index detection field.

Author Contributions

Conceptualization, methodology, software, resources, X.Y.; data curation, investigation, formal analysis, R.F.; software, validation, T.C.; investigation, S.L. All authors have read and agreed to the published version of the manuscript.

Funding

This work was supported by the National Natural Science Foundation of China [grant number 61775032, 11604042]; Fundamental Research Funds for the Central Universities, China [grant number N170405007, N160404009] and 111 project [grant number B1009].

Institutional Review Board Statement

Not applicable.

Informed Consent Statement

Not applicable.

Data Availability Statement

No new data were created or analyzed in this study. Data sharing is not applicable to this article.

Acknowledgments

The authors would like to thank the anonymous reviewers for their valuable suggestions.

Conflicts of Interest

The authors declare no conflict of interest.

References

  1. Guo, Z.; Fan, Z.; Kong, X.; Meng, Z. Photonic crystal fiber based wide-range of refractive index sensor with phase matching between core mode and metal defect mode. Opt. Commun. 2020, 461, 125233. [Google Scholar] [CrossRef]
  2. Liu, C.; Wang, F.M.; Lv, J.W.; Sun, T.; Liu, Q.; Fu, C.F.; Mu, H.W.; Chu, P.K. A highly temperature-sensitive photonic crystalfiber based on surfaceplasmon resonance. Opt. Commun. 2016, 359, 378–382. [Google Scholar] [CrossRef]
  3. Hossain, M.B.; Mahendiran, T.V.; Abdulrazak, L.F.; Mehedi, I.M.; Hossain, M.A.; Rana, M.M. Numerical analysis of gold coating based quasi D shape dual core PCF SPR sensor. Opt. Quantum Electron. 2020, 52, 446. [Google Scholar] [CrossRef]
  4. Yan, X.; Li, B.; Cheng, T.L.; Li, S.G. Analysis of High Sensitivity Photonic Crystal Fiber Sensor Based on Surface Plasmon Resonance of Refractive Indexes of Liquids. Sensors 2018, 18, 2922. [Google Scholar] [CrossRef] [PubMed] [Green Version]
  5. Li, B.; Cheng, T.; Chen, J.; Yan, X. Graphene-Enhanced Surface Plasmon Resonance Liquid Refractive Index Sensor Based on Photonic Crystal Fiber. Sensors 2019, 19, 3666. [Google Scholar] [CrossRef] [PubMed] [Green Version]
  6. An, G.; Li, S.; Cheng, T.; Yan, X.; Zhang, X.; Zhou, X.; Yuan, Z. Ultra-stable D-shaped Optical Fiber Refractive Index Sensor with Graphene-Gold Deposited Platform. Plasmonics 2019, 14, 155–163. [Google Scholar] [CrossRef]
  7. Desmet, C.; Vindas, K.; Meza, R.A.; Garrigue, P.; Voci, S.; Sojic, N.; Maziz, A.; Courson, R.; Malaquin, L.; Leichle, L.; et al. Multiplexed Remote SPR Detection of Biological Interactions through Optical Fiber Bundles. Sensors 2020, 20, 511. [Google Scholar] [CrossRef] [Green Version]
  8. Zhang, R.; Pu, S.; Li, X. Gold-Film-Thickness Dependent SPR Refractive Index and Temperature Sensing with Hetero-Core Optical Fiber Structure. Sensors 2019, 19, 4345. [Google Scholar] [CrossRef] [PubMed] [Green Version]
  9. Singh, S.; Prajapati, Y. Highly sensitive dual-core symmetrical side-polished modified D-shaped SPR based PCF refractive index sensor with deeply etched micro openings. Optik 2021, 235, 166657. [Google Scholar] [CrossRef]
  10. Li, J.-X.; Zhang, W.-H.; Tong, Z.-R.; Liu, J.-W. Fiber optic sensor modified by graphene oxide–glucose oxidase for glucose detection. Opt. Commun. 2021, 492, 126983. [Google Scholar] [CrossRef]
  11. Butt, M.; Khonina, S.; Kazanskiy, N. Plasmonics: A Necessity in the Field of Sensing—A Review (Invited). Fiber Integr. Opt. 2021, 40, 14–47. [Google Scholar] [CrossRef]
  12. Liu, S.; Cao, S.; Zhang, Z.; Wang, Y.; Liao, C.; Wang, Y. Temperature Sensor Based on Side-Polished Fiber SPR Device Coated with Polymer. Sensors 2019, 19, 4063. [Google Scholar] [CrossRef] [Green Version]
  13. Qu, Y.; Yuan, J.; Zhou, X.; Li, F.; Yan, B.; Wu, Q.; Wang, K.; Sang, X.; Long, K.; Yu, C. Mid-infrared silicon photonic crystal fiber polarization filter based on surface plasmon resonance effect. Opt. Commun. 2020, 463, 125387. [Google Scholar] [CrossRef]
  14. Liang, H.; Shen, T.; Feng, Y.; Liu, H.C.; Han, W. A D-Shaped Photonic Crystal Fiber Refractive Index Sensor Coated with Graphene and Zinc Oxide. Sensors 2021, 21, 71. [Google Scholar] [CrossRef] [PubMed]
  15. Mahfuz, M.A.; Mollah, M.A.; Momota, M.R.; Paul, A.K.; Masud, A.; Akter, S.; Hasan, M.R. Highly sensitive photonic crystal fiber plasmonic biosensor: Design and analysis. Opt. Mater. 2019, 90, 315–321. [Google Scholar] [CrossRef]
  16. Wang, G.; Lu, Y.; Duan, L.; Yao, J. A Refractive Index Sensor Based on PCF with Ultra-Wide Detection Range. IEEE J. Sel. Top. Quantum Electron. 2020, 27, 1–8. [Google Scholar] [CrossRef]
  17. Yang, H.; Liu, M.; Chen, Y.; Guo, L.; Xiao, G.; Liu, H.; Li, J.; Yuan, L. Highly Sensitive Graphene-Au Coated Plasmon Resonance PCF Sensor. Sensors 2021, 21, 818. [Google Scholar] [CrossRef]
  18. Lou, J.; Li, S.; Cheng, T.; Yan, X.; Zhang, X.; Shao, Y. Plasmonic photonic crystal fiber polarization filter with asymmetry around Au-coated and liquid-filled air holes. Opt. Quantum Electron. 2017, 49, 415. [Google Scholar] [CrossRef]
  19. Li, C.-Y.; Song, B.-B.; Wu, J.-X.; Huang, W.; Wu, X.-J.; Jin, C. Dual-demodulation large-scope high-sensitivity refractive index sensor based on twin-core PCF. Optoelectron. Lett. 2021, 17, 193–198. [Google Scholar] [CrossRef]
  20. Qiu, S.; Yuan, J.; Zhou, X.; Qu, Y.; Yan, B.; Wu, Q.; Wang, K.; Sang, X.; Long, K.; Yu, C. Highly sensitive temperature sensing based on all-solid cladding dual-core photonic crystal fiber filled with the toluene and ethanol. Opt. Commun. 2020, 477, 126357. [Google Scholar] [CrossRef]
  21. Qu, Y.; Yuan, J.; Zhou, X.; Li, F.; Mei, C.; Yan, B.; Wu, Q.; Wang, K.; Sang, X.; Long, K.; et al. A V-shape photonic crystal fiber polarization filter based on surface plasmon resonance effect. Opt. Commun. 2019, 452, 1–6. [Google Scholar] [CrossRef]
  22. Gamal, Y.; Younis, B.; Hegazy, S.; Badr, Y.; Hameed, M.F.O.; Obayya, S. Highly efficient modified dual D-shaped PCF polarization filter. Opt. Fiber Technol. 2021, 62, 102459. [Google Scholar] [CrossRef]
  23. Akter, S.; Ahmed, K.; El-Naggar, S.A.; Taya, S.A.; Nguyen, T.K.; Dhasarathan, V. Highly Sensitive Refractive Index Sensor for Temperature and Salinity Measurement of Seawater. Opt. Int. J. Light Electron. Opt. 2020, 216, 164901. [Google Scholar] [CrossRef]
  24. Guo, X.; Han, L.; Liu, F.; Li, S. Refractive index sensing characteristics of dual-core PCF based on surface plasmon resonance. Opt. Int. J. Light Electron Opt. 2020, 218, 164796. [Google Scholar] [CrossRef]
  25. Wu, J.; Li, S.; Shi, M.; Feng, X. Photonic crystal fiber temperature sensor with high sensitivity based on surface plasmon resonance. Opt. Fiber Technol. 2018, 43, 90–94. [Google Scholar] [CrossRef]
  26. Wang, S.; Sun, X.; Luo, Y.; Peng, G. Surface plasmon resonance sensor based on D-shaped Hi-Bi photonic crystal fiber. Opt. Commun. 2020, 467, 125675. [Google Scholar] [CrossRef]
  27. Danlard, I.; Akowuah, E.K. Assaying with PCF-based SPR refractive index biosensors: From recent configurations to outstanding detection limits. Opt. Fiber Technol. 2020, 54, 102083. [Google Scholar] [CrossRef]
  28. Lou, J.; Cheng, T.; Li, S.; Zhang, X. Surface plasmon resonance photonic crystal fiber biosensor based on gold-graphene layers. Opt. Fiber Technol. 2019, 50, 206–211. [Google Scholar] [CrossRef]
  29. Chao, C.-T.C.; Chau, Y.-F.C.; Huang, H.J.; Kumara, N.T.R.N.; Kooh, M.R.R.; Lim, C.M.; Chiang, H.-P. Highly Sensitive and Tunable Plasmonic Sensor Based on a Nanoring Resonator with Silver Nanorods. Nanomaterials 2020, 10, 1399. [Google Scholar] [CrossRef]
Figure 1. The cross-section view of the proposed SPR-PCF refractive index sensor (a). Real parts of the effective refractive indices of the core-guided and plasmonic modes and the core-guided mode loss under the gold layer thickness of 30 nm and RI of 1.50 (b).
Sensors 21 03782 g001
Figure 2. Core guided mode in the y-axis at λ = 1610 nm and RI = 1.50 (a), Plasmonic mode in the y-axis at λ = 1610 nm and RI = 1.50 (b), Coupling of the core mode and the plasmonic mode in the y-axis under the resonance wavelength (λ) of 1710 nm (c).
Sensors 21 03782 g002
Figure 3. The confinement loss curve under different analyte refractive index values (a). The refractive index and the peak wavelength of the linearly-fitted analyte (b). The FOM profile for the designed structure (c). The corresponding Q-factor for RI range from 1.47 to 1.52 (d).
Sensors 21 03782 g003
Figure 4. The loss spectrum (na = 1.48, na = 1.49) when d1 varied from 0.5 μm to 0.7 μm.
Sensors 21 03782 g004
Figure 5. The loss spectrum (na = 1.48, na = 1.49) when d2 varied from 0.7 μm to 0.9 μm.
Sensors 21 03782 g005
Figure 6. The loss spectrum (na = 1.47–1.51) when d3 varied from 0.35 μm to 0.55 μm.
Sensors 21 03782 g006
Figure 7. The loss spectrum (na = 1.47–1.52) when d4 varied from 0.65 μm to 0.95 μm.
Sensors 21 03782 g007
Figure 8. The loss spectrum (na = 1.48–1.49) when p2 varied from 2.0 μm to 2.4 μm.
Sensors 21 03782 g008
Figure 9. The loss spectrum (na = 1.49–1.50) when tg varied from 30 nm to 50 nm.
Sensors 21 03782 g009
Figure 10. The loss spectrum when tg varied by ±2% (na = 1.48, na = 1.49) (a). The loss spectrum when d1 varied by ±2% (nav= 1.48, na = 1.49) (b). The loss spectrum when d2 varied by ±2% (na = 1.48, na = 1.49) (c). The loss spectrum when d3 varied by ±2% (na = 1.48, na = 1.49) (d). The loss spectrum when d4 varied by ±2% (na = 1.48, na = 1.49) (e).
Sensors 21 03782 g010
Table 1. The resonant wavelength (nm) under different RI values (na = 1.47–1.52) when d3 varied from 0.35 μm to 0.55 μm.
d3 (μm)na (RIU)
1.471.481.491.501.511.52
0.351230.31410.11570.41720.11850.71970.9
0.451280.41470.01640.31780.21910.12020.6
0.551345.61540.51710.11850.21960.92060.4
Table 2. The resonant wavelength of different RI (na = 1.47–1.52) when d4 varied from 0.65 μm to 0.95 μm.
d4 (μm)na (RIU)Average Sensitivity (nm/RIU)
1.471.481.491.501.511.52
0.651230.11370.21520.81660.71790.11900.013,571.4
0.751230.21400.71570.11710.41840.41950.114,457.1
0.851230.11410.91570.51720.61850.51970.514,771.4
0.95 1380.81550.41700.11850.51960.614,600.0
Table 3. The resonant wavelength of different RI values (na = 1.47–1.53) under tg of 20 nm, 30 nm, 40 nm, and 60 nm.
d4 (μm)na (RIU)Average Sensitivity (nm/RIU)
1.471.481.491.501.511.521.53
20 1420.41560.41690.31810.61910.92010.111,771.42
301230.11410.11570.21720.51850.41970.7 14,771.43
401205.31400.11570.11720.21850.31970.1 15,214.29
60 1350.51520.71660.41780.71890.01990.112,657.14
Table 4. Performance comparison of fiber optic sensors based on SPR.
FeatureRI Range (RIU)Average Sensitivity (nm/RIU)Maximum Sensitivity (nm/RIU)Reference
D-Shaped coated with Graphene and Zinc Oxide1.36–1.474485.76000[11]
Graphene-Enhanced Liquid Refractive Index Sensor1.3330–1.36882290-[5]
Wide-Range of Refractive Index Sensor1.35–1.461931.03-[1]
Graphene-Au Coated Plasmon Resonance PCF Sensor1.32–1.4139004200[14]
Highly sensitive photonic crystal fiber plasmonic biosensor1.33–1.40-12,000[12]
Proposed Sensor1.47–1.5214,771.418,000.5
Publisher’s Note: MDPI stays neutral with regard to jurisdictional claims in published maps and institutional affiliations.

