Measurement and Modeling of Microbial Growth Using Timelapse Video


Abstract
1. Introduction
2. Methodology
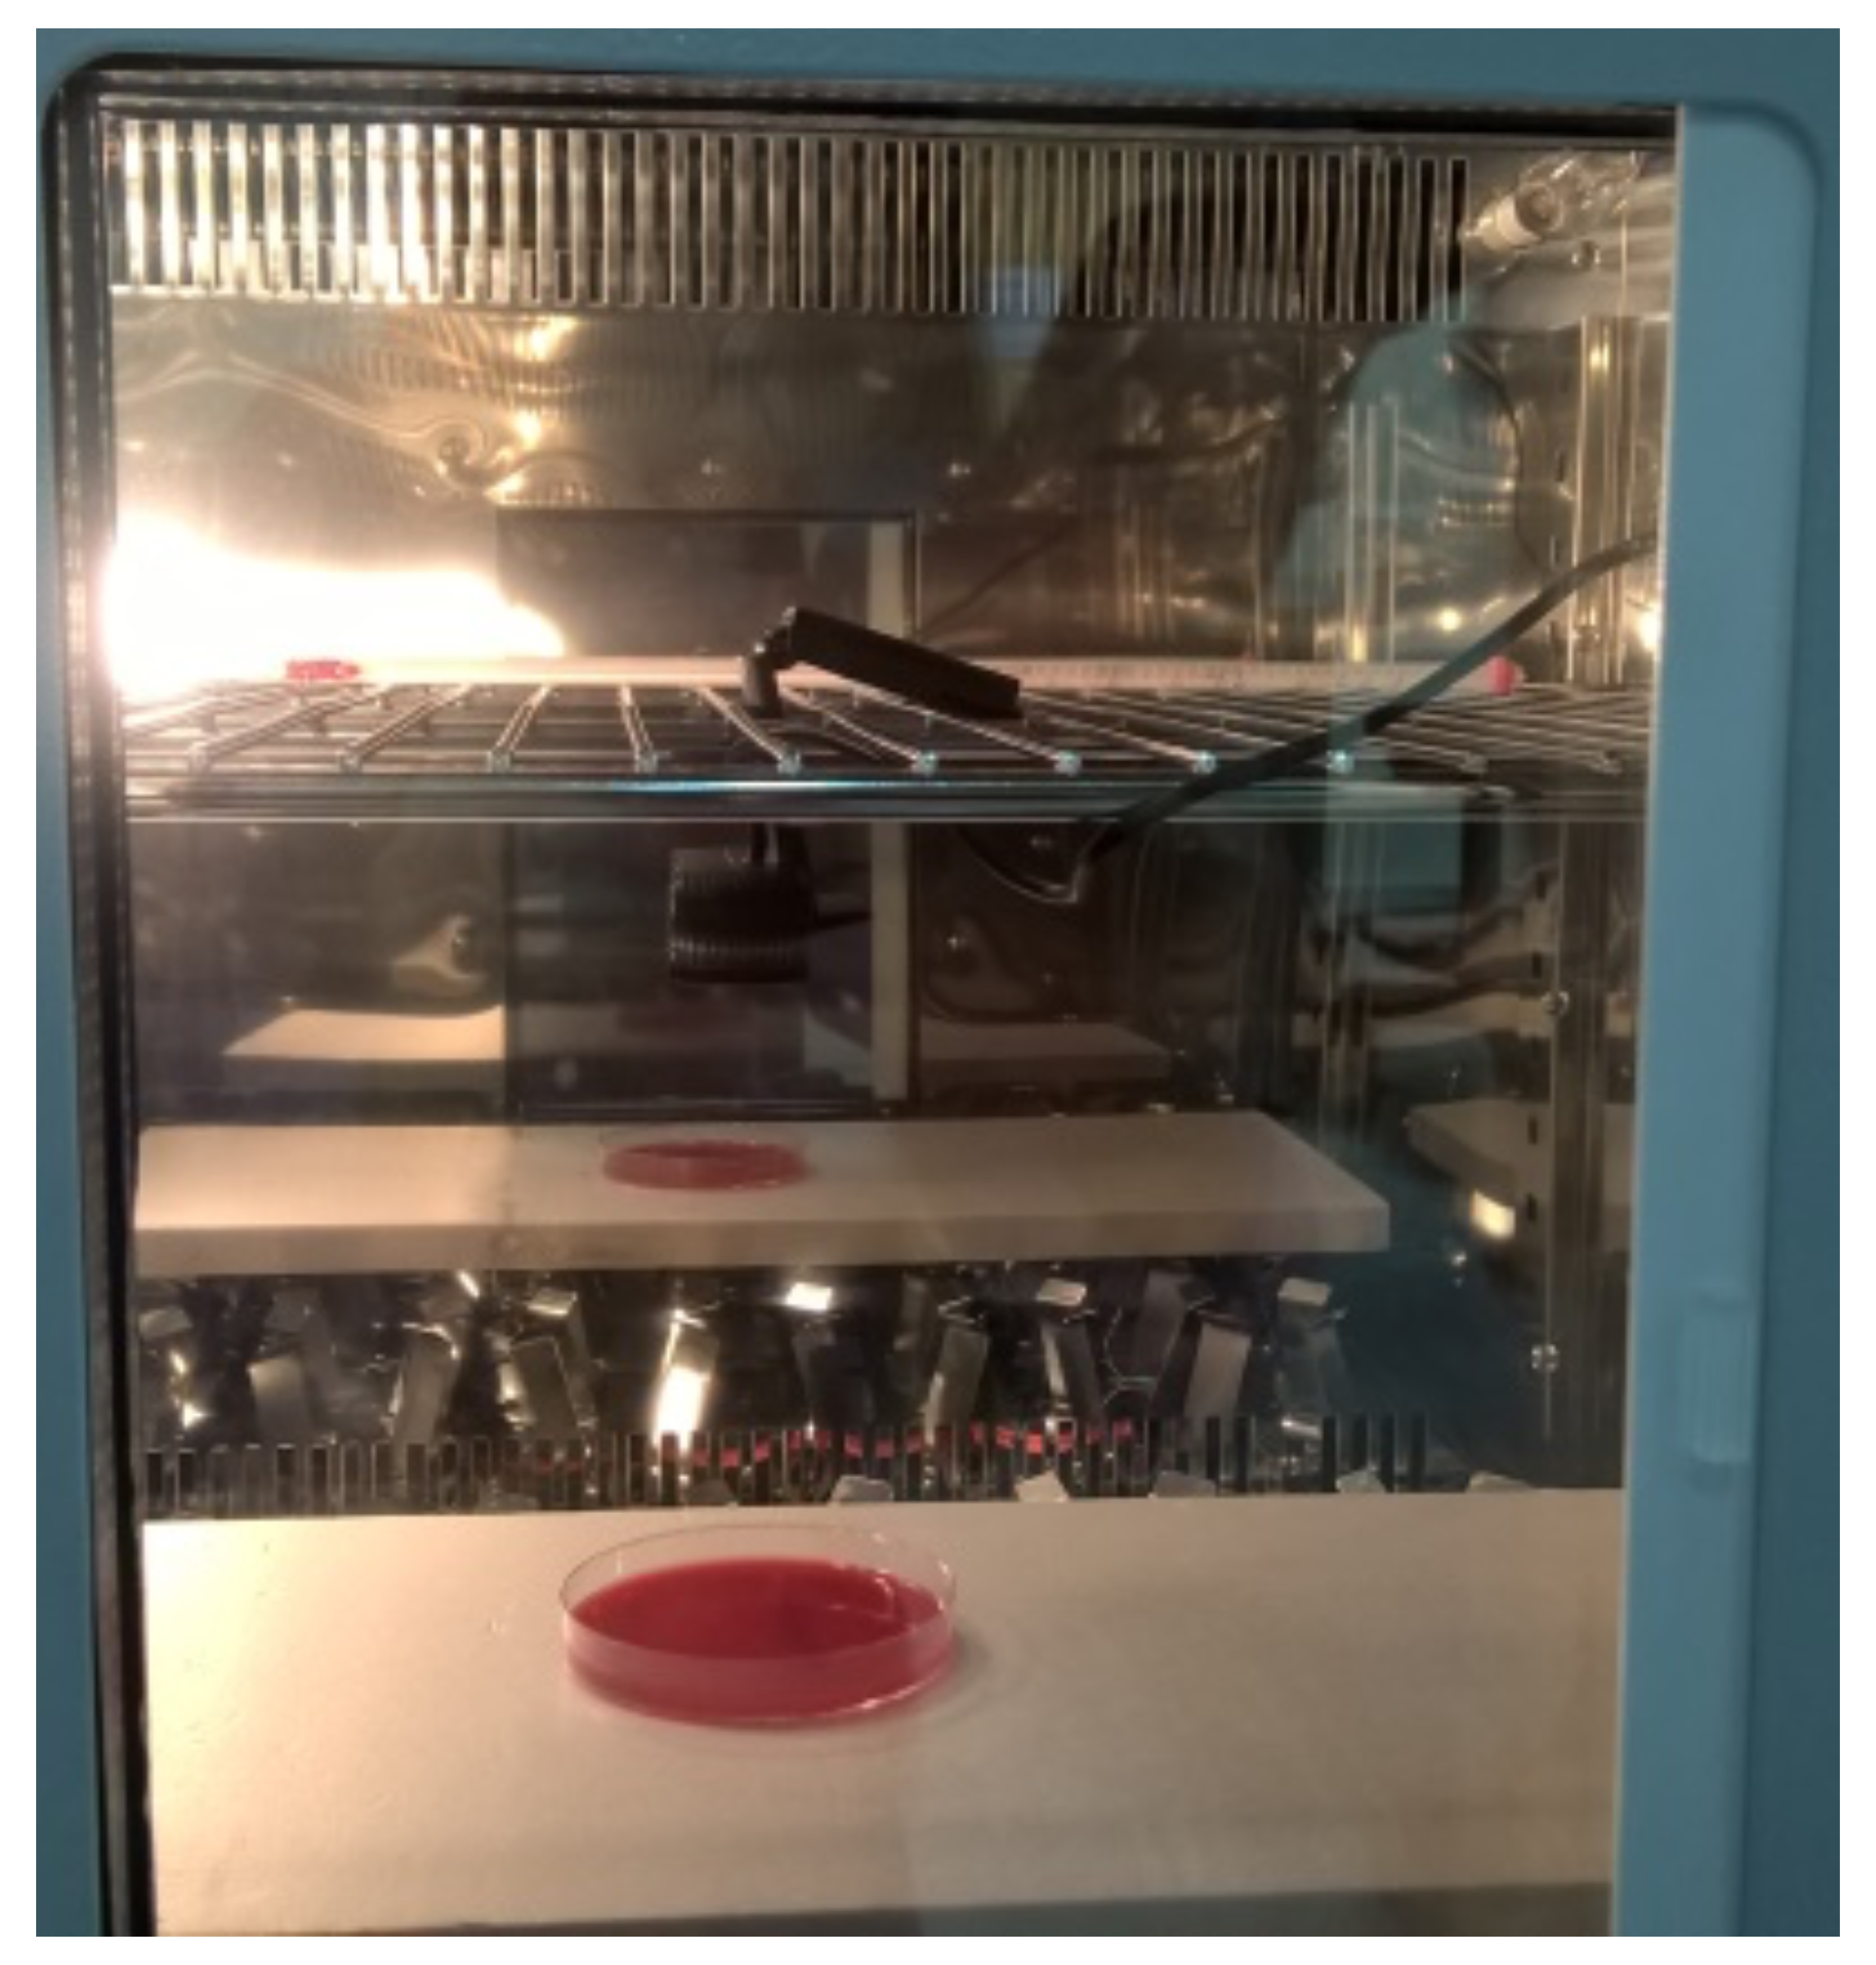
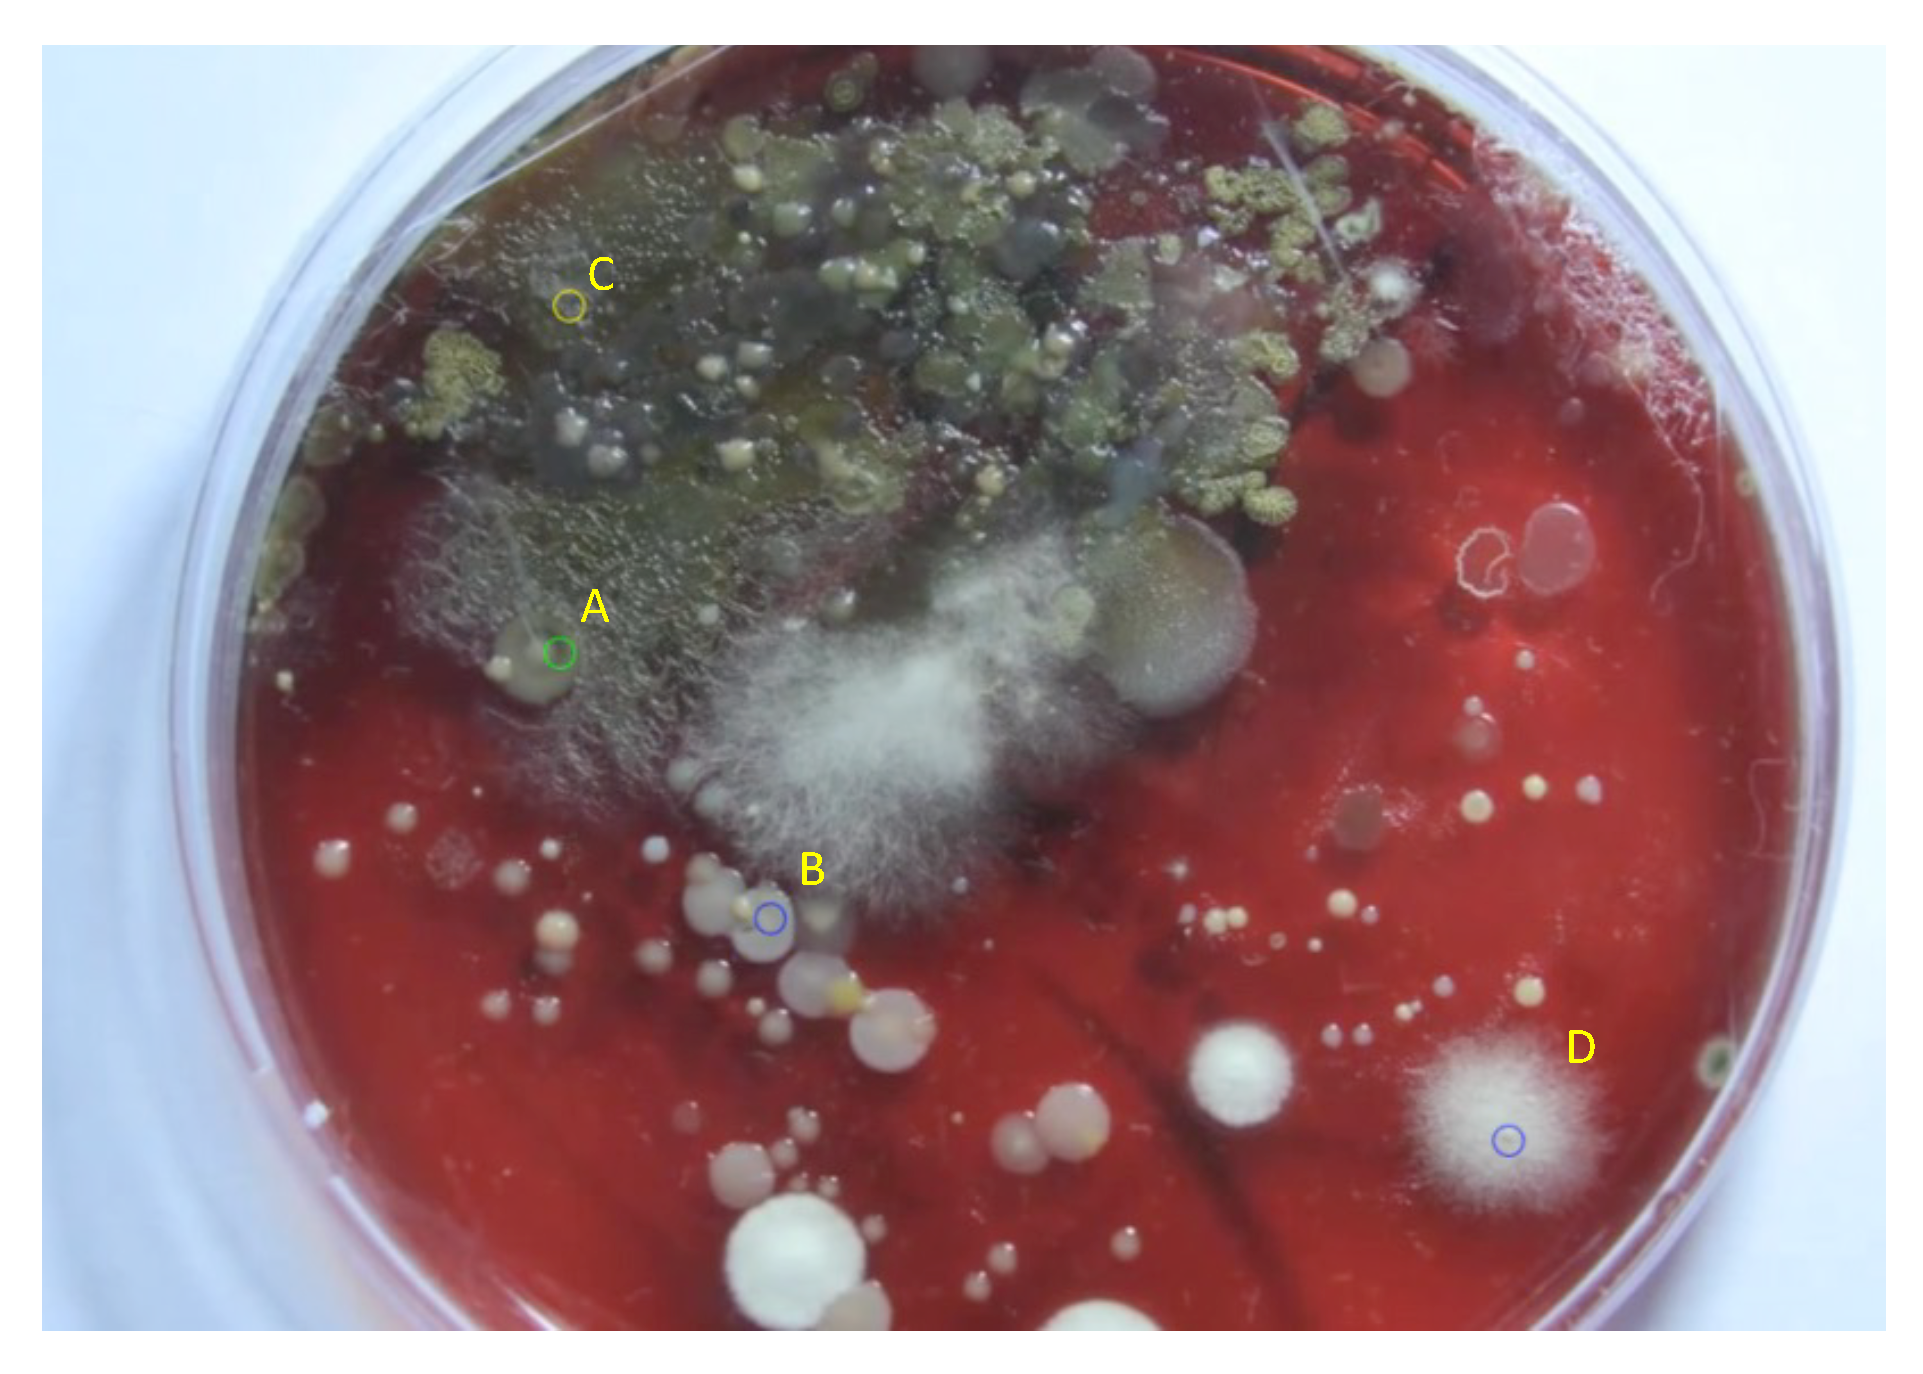
2.1. Experimental Setup
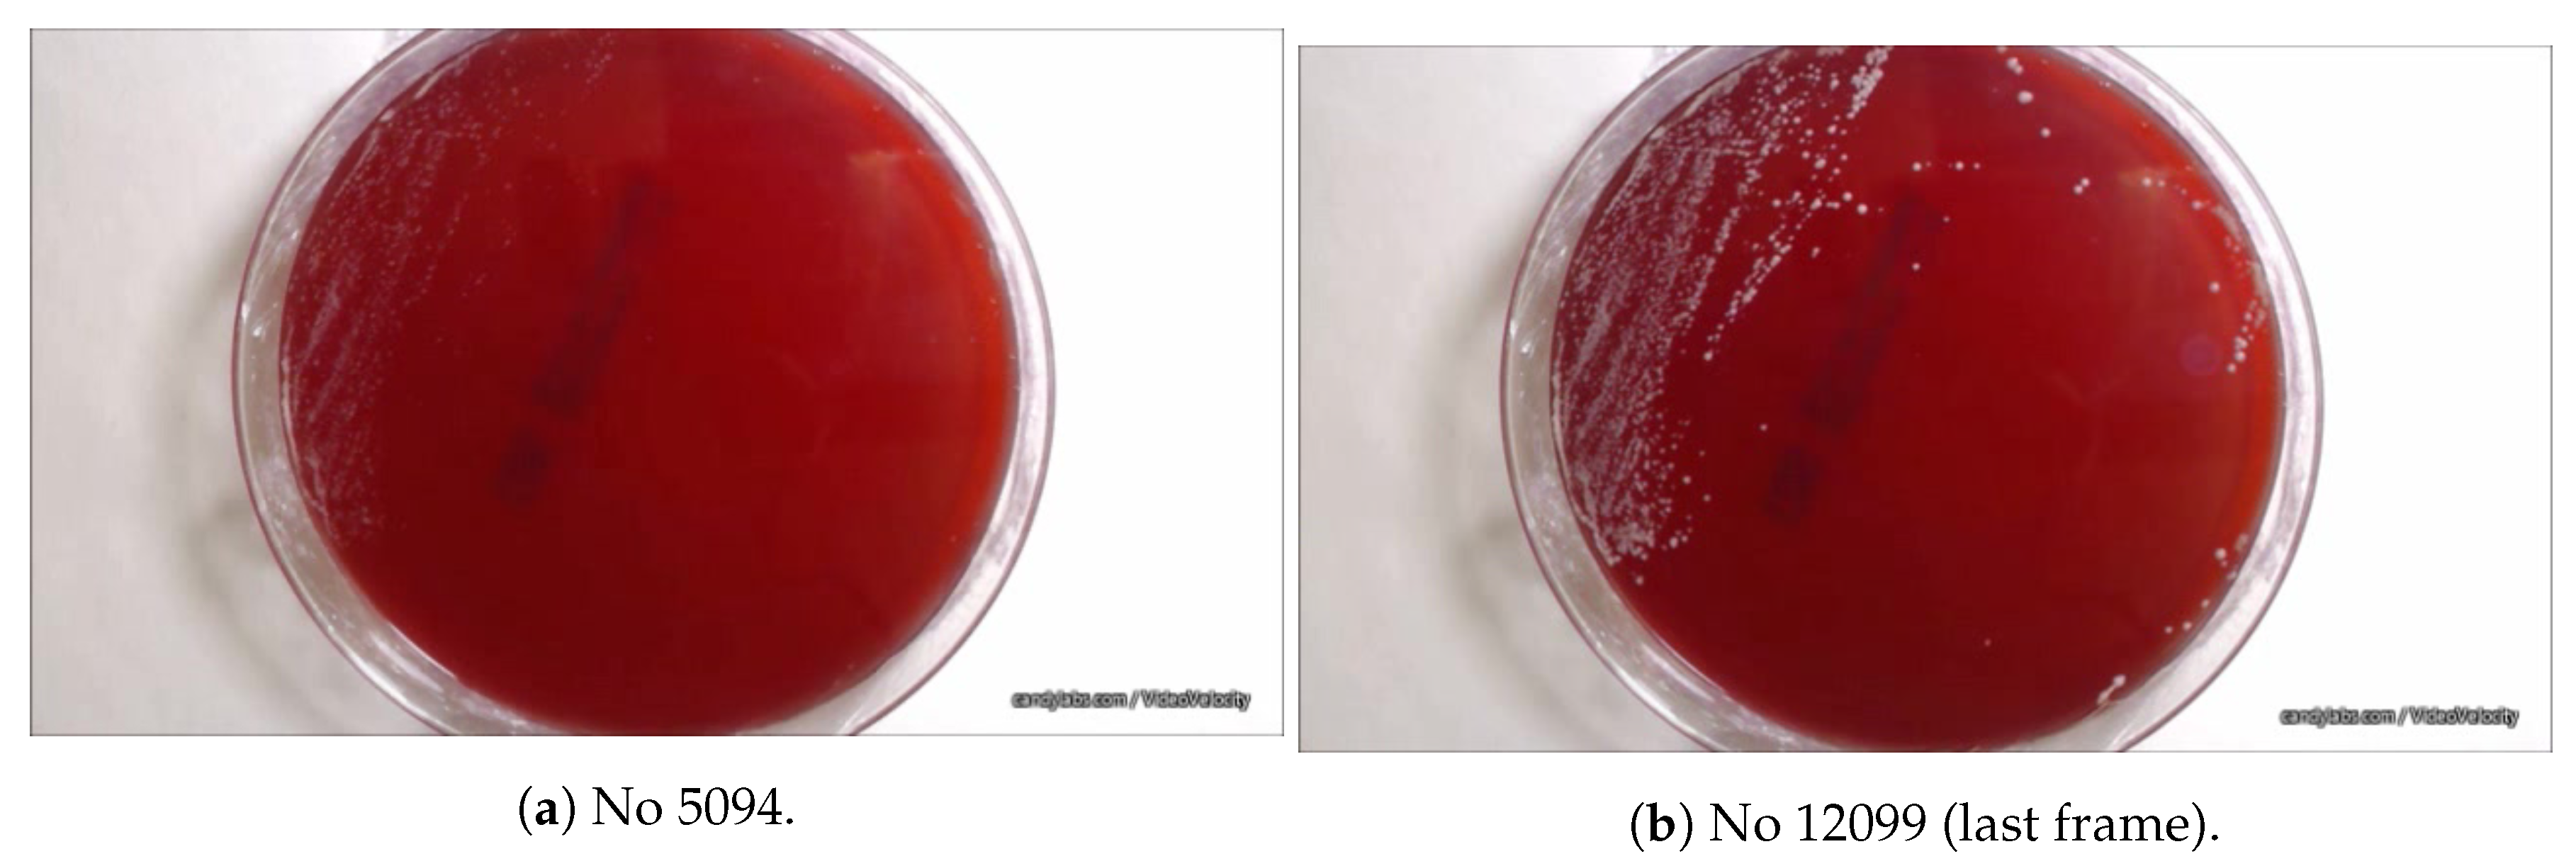
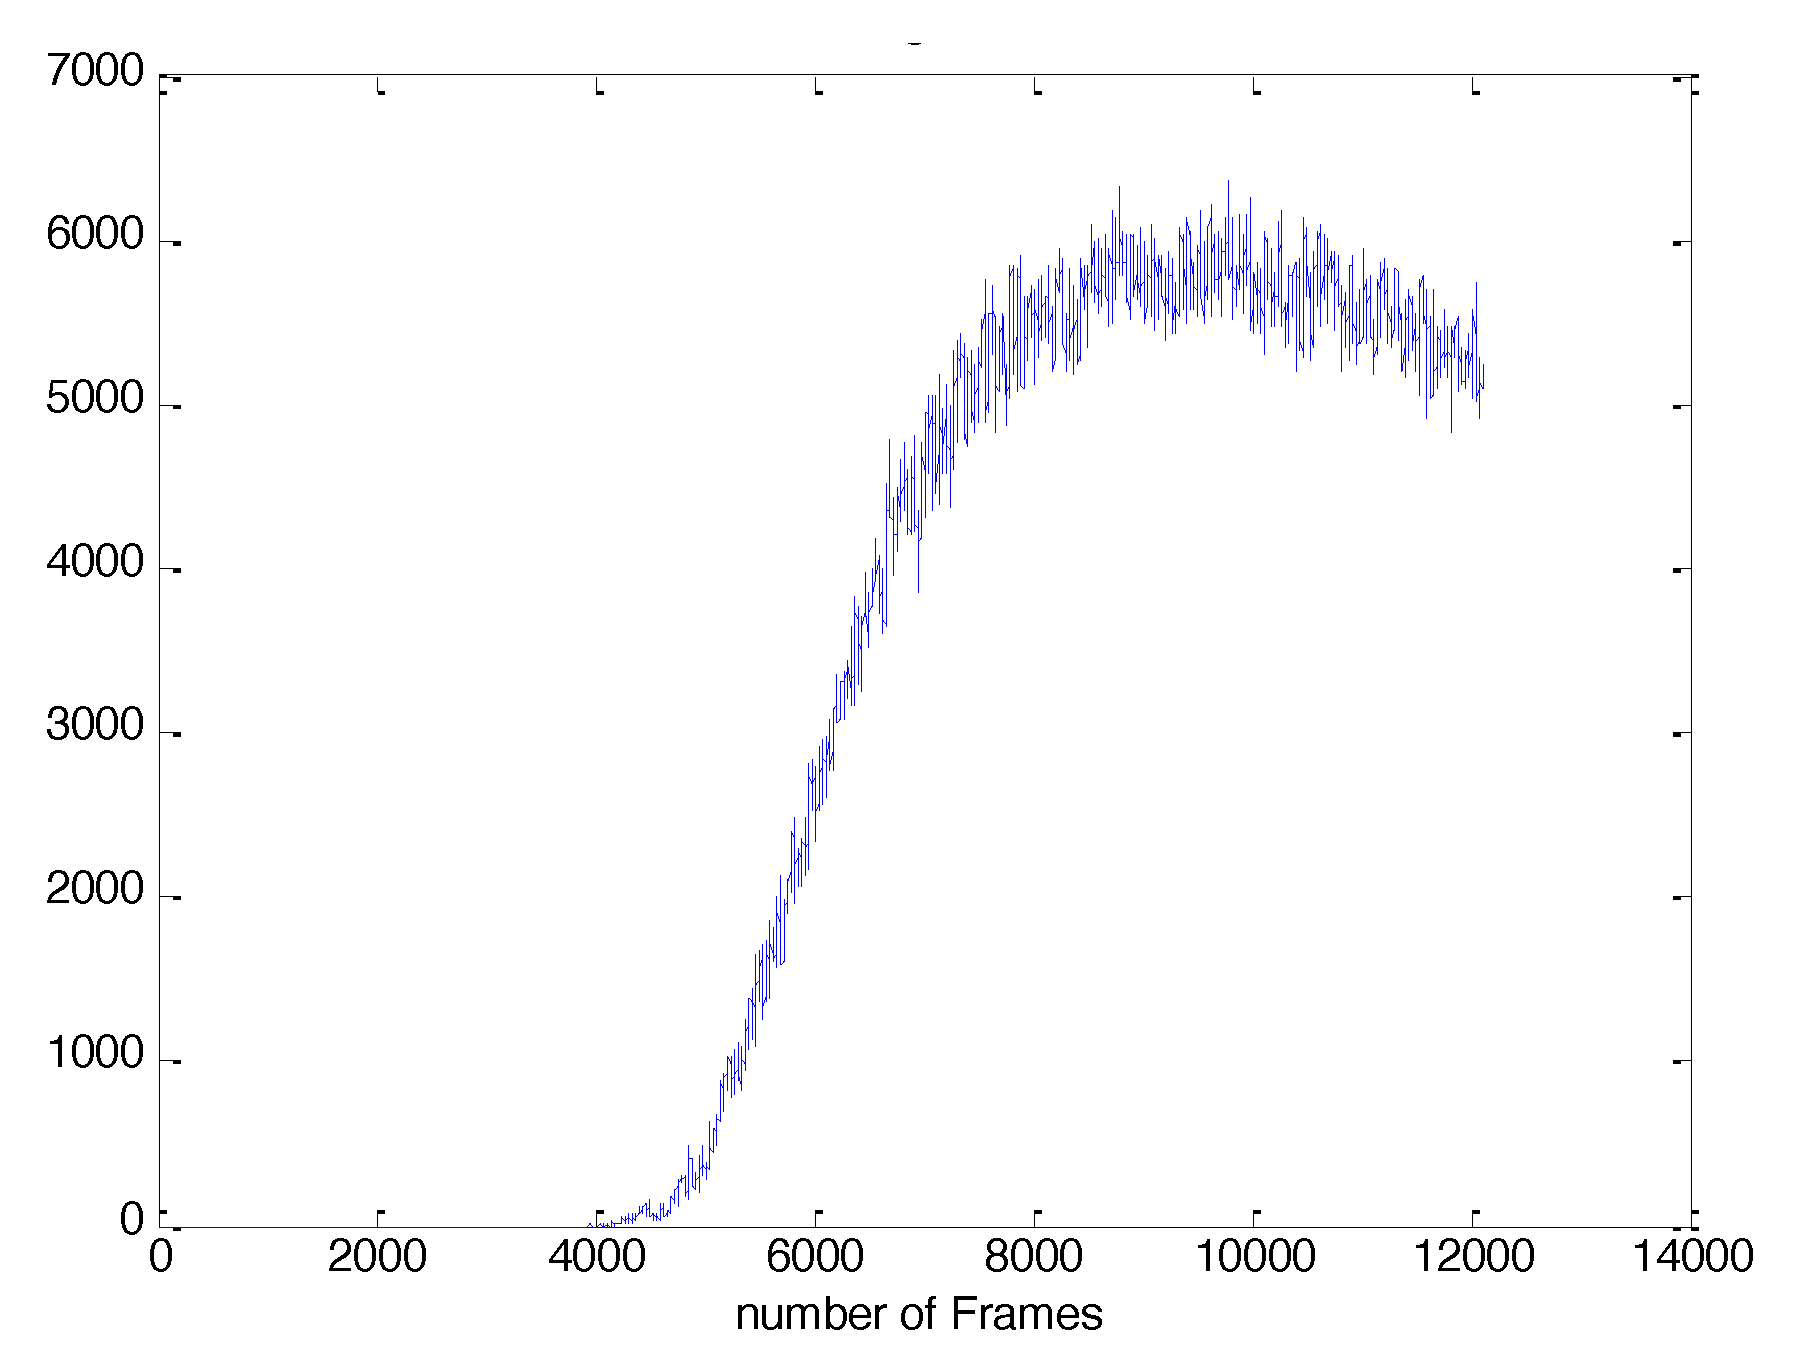
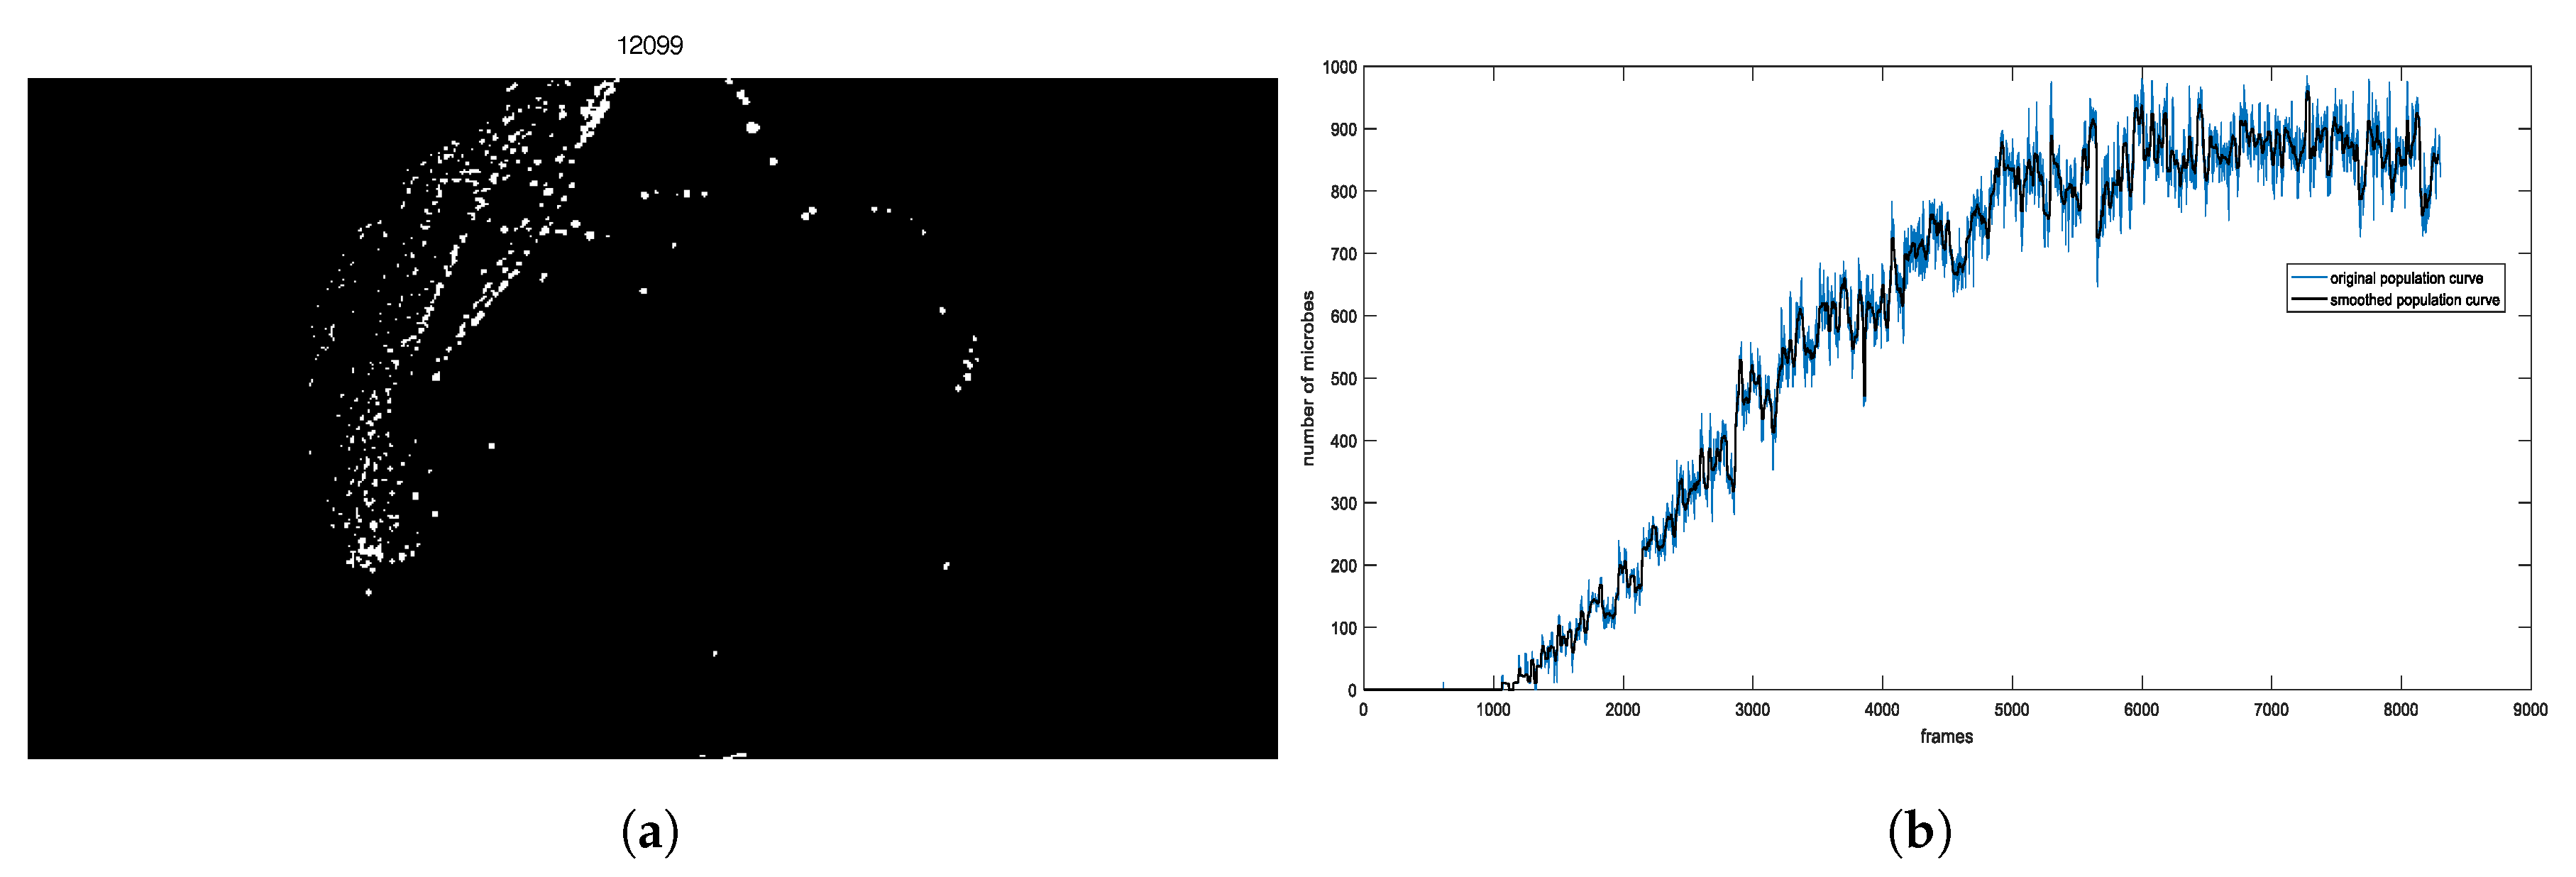
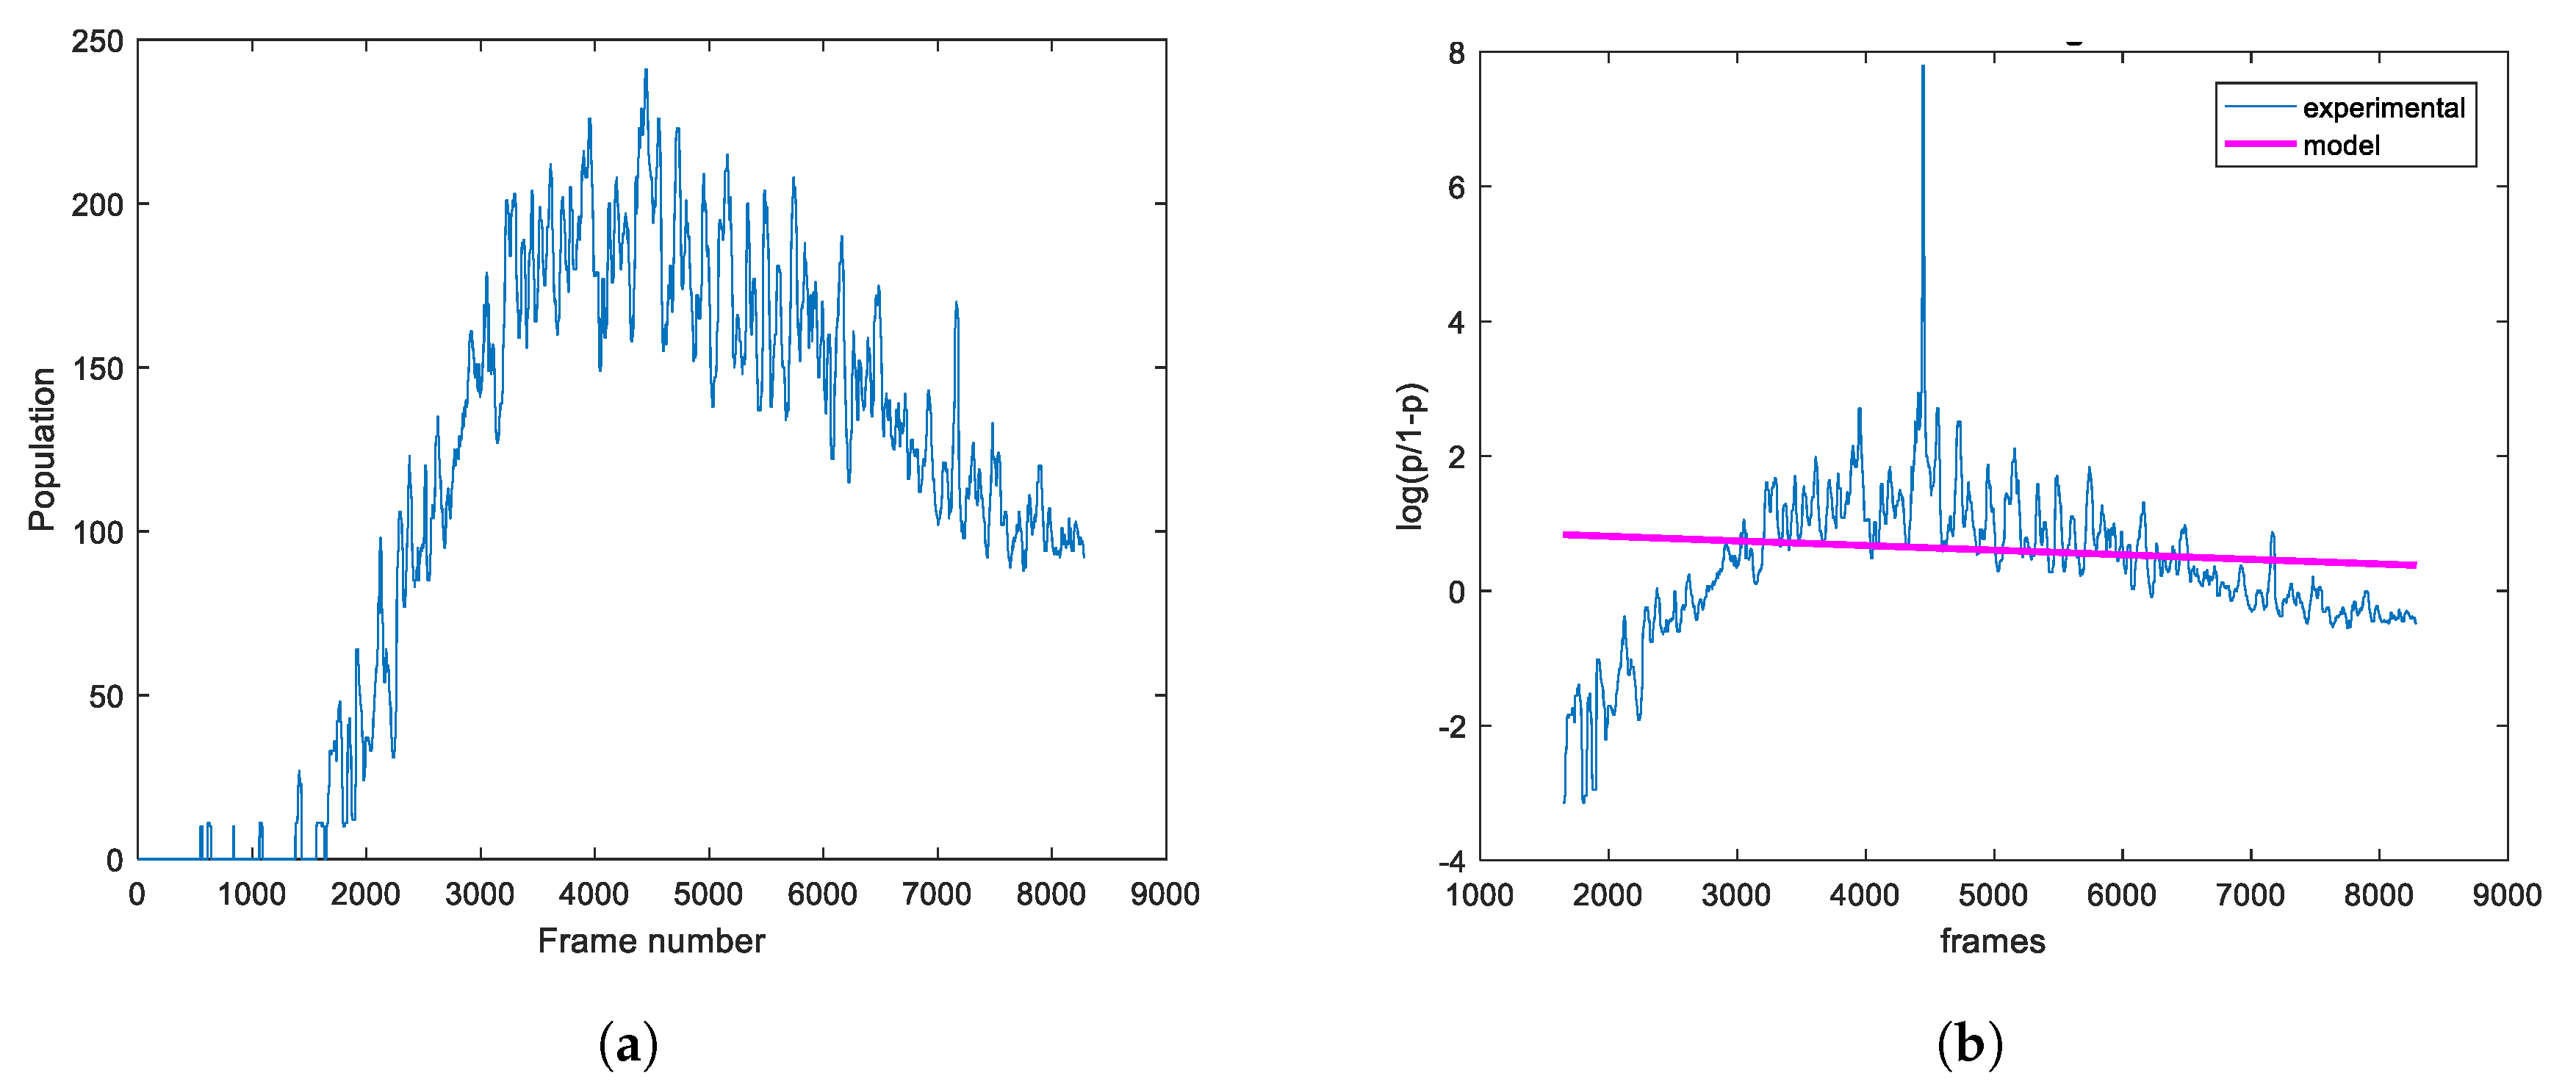
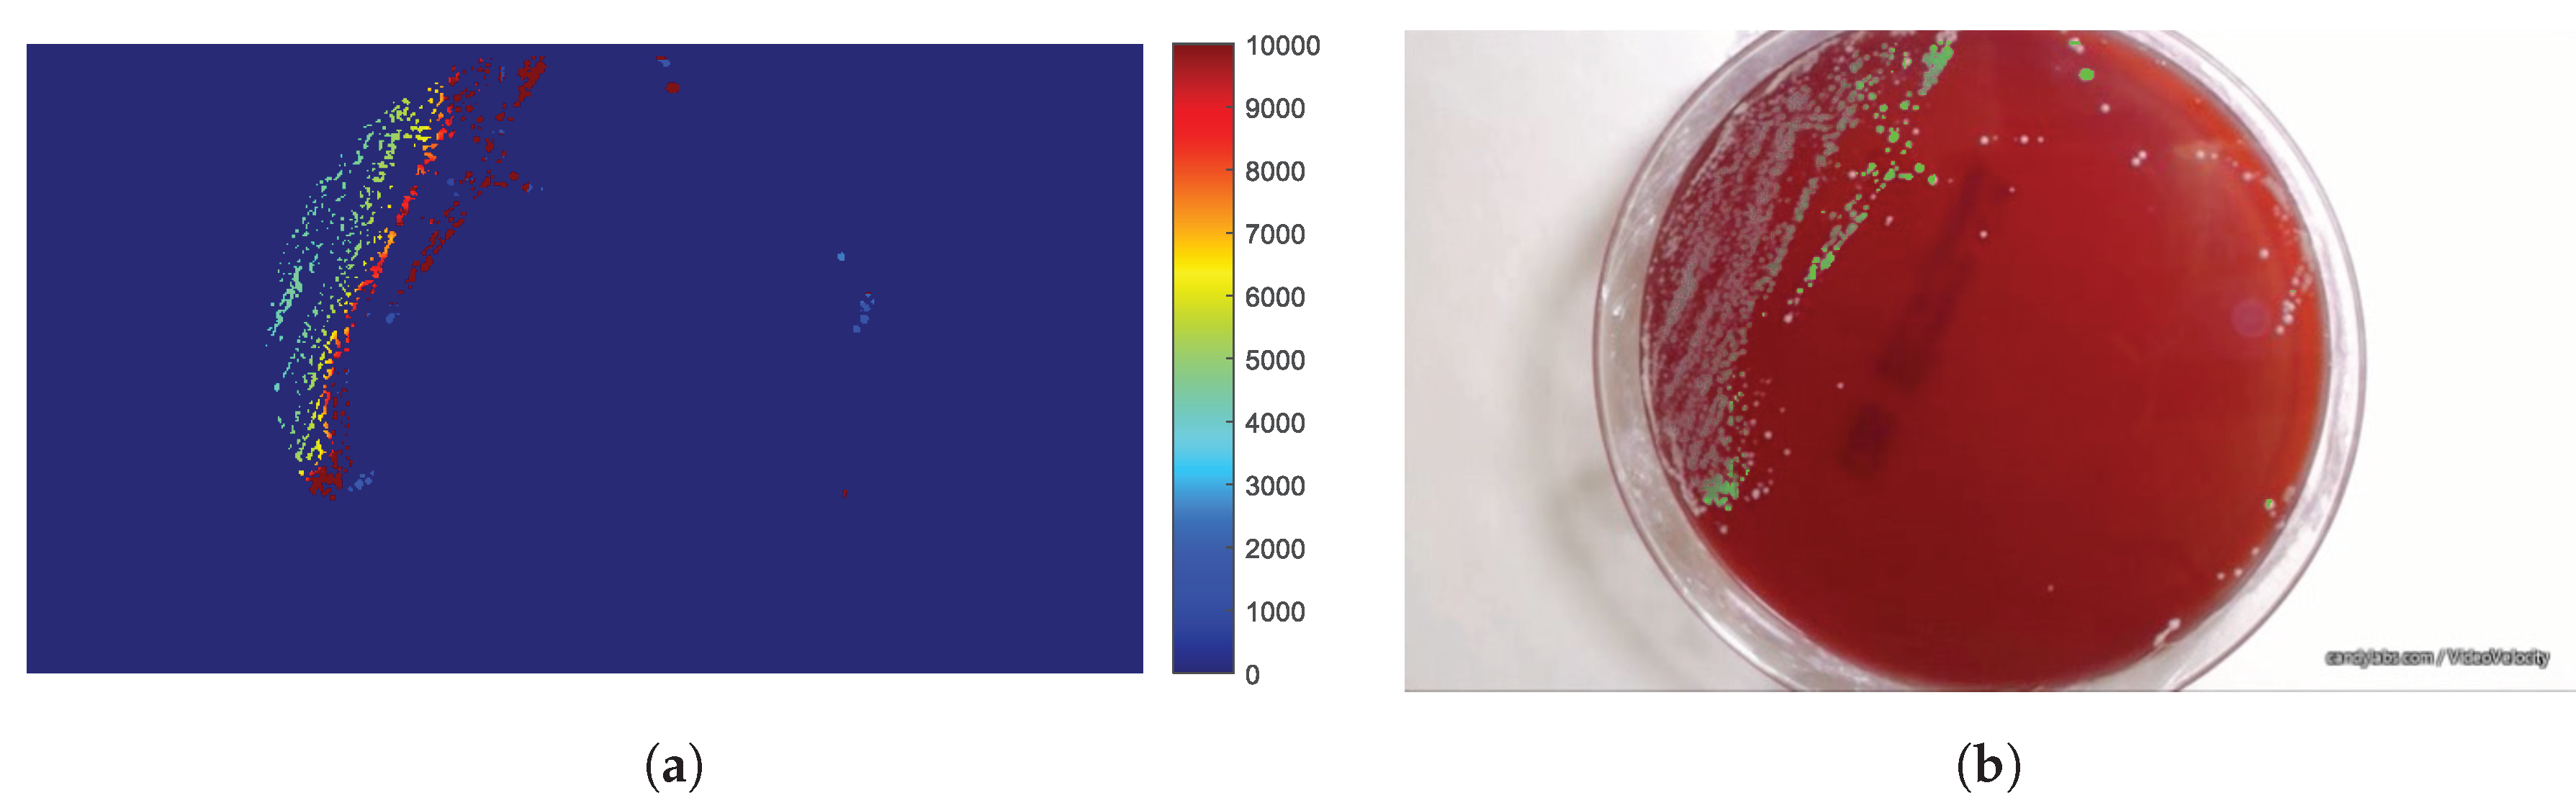
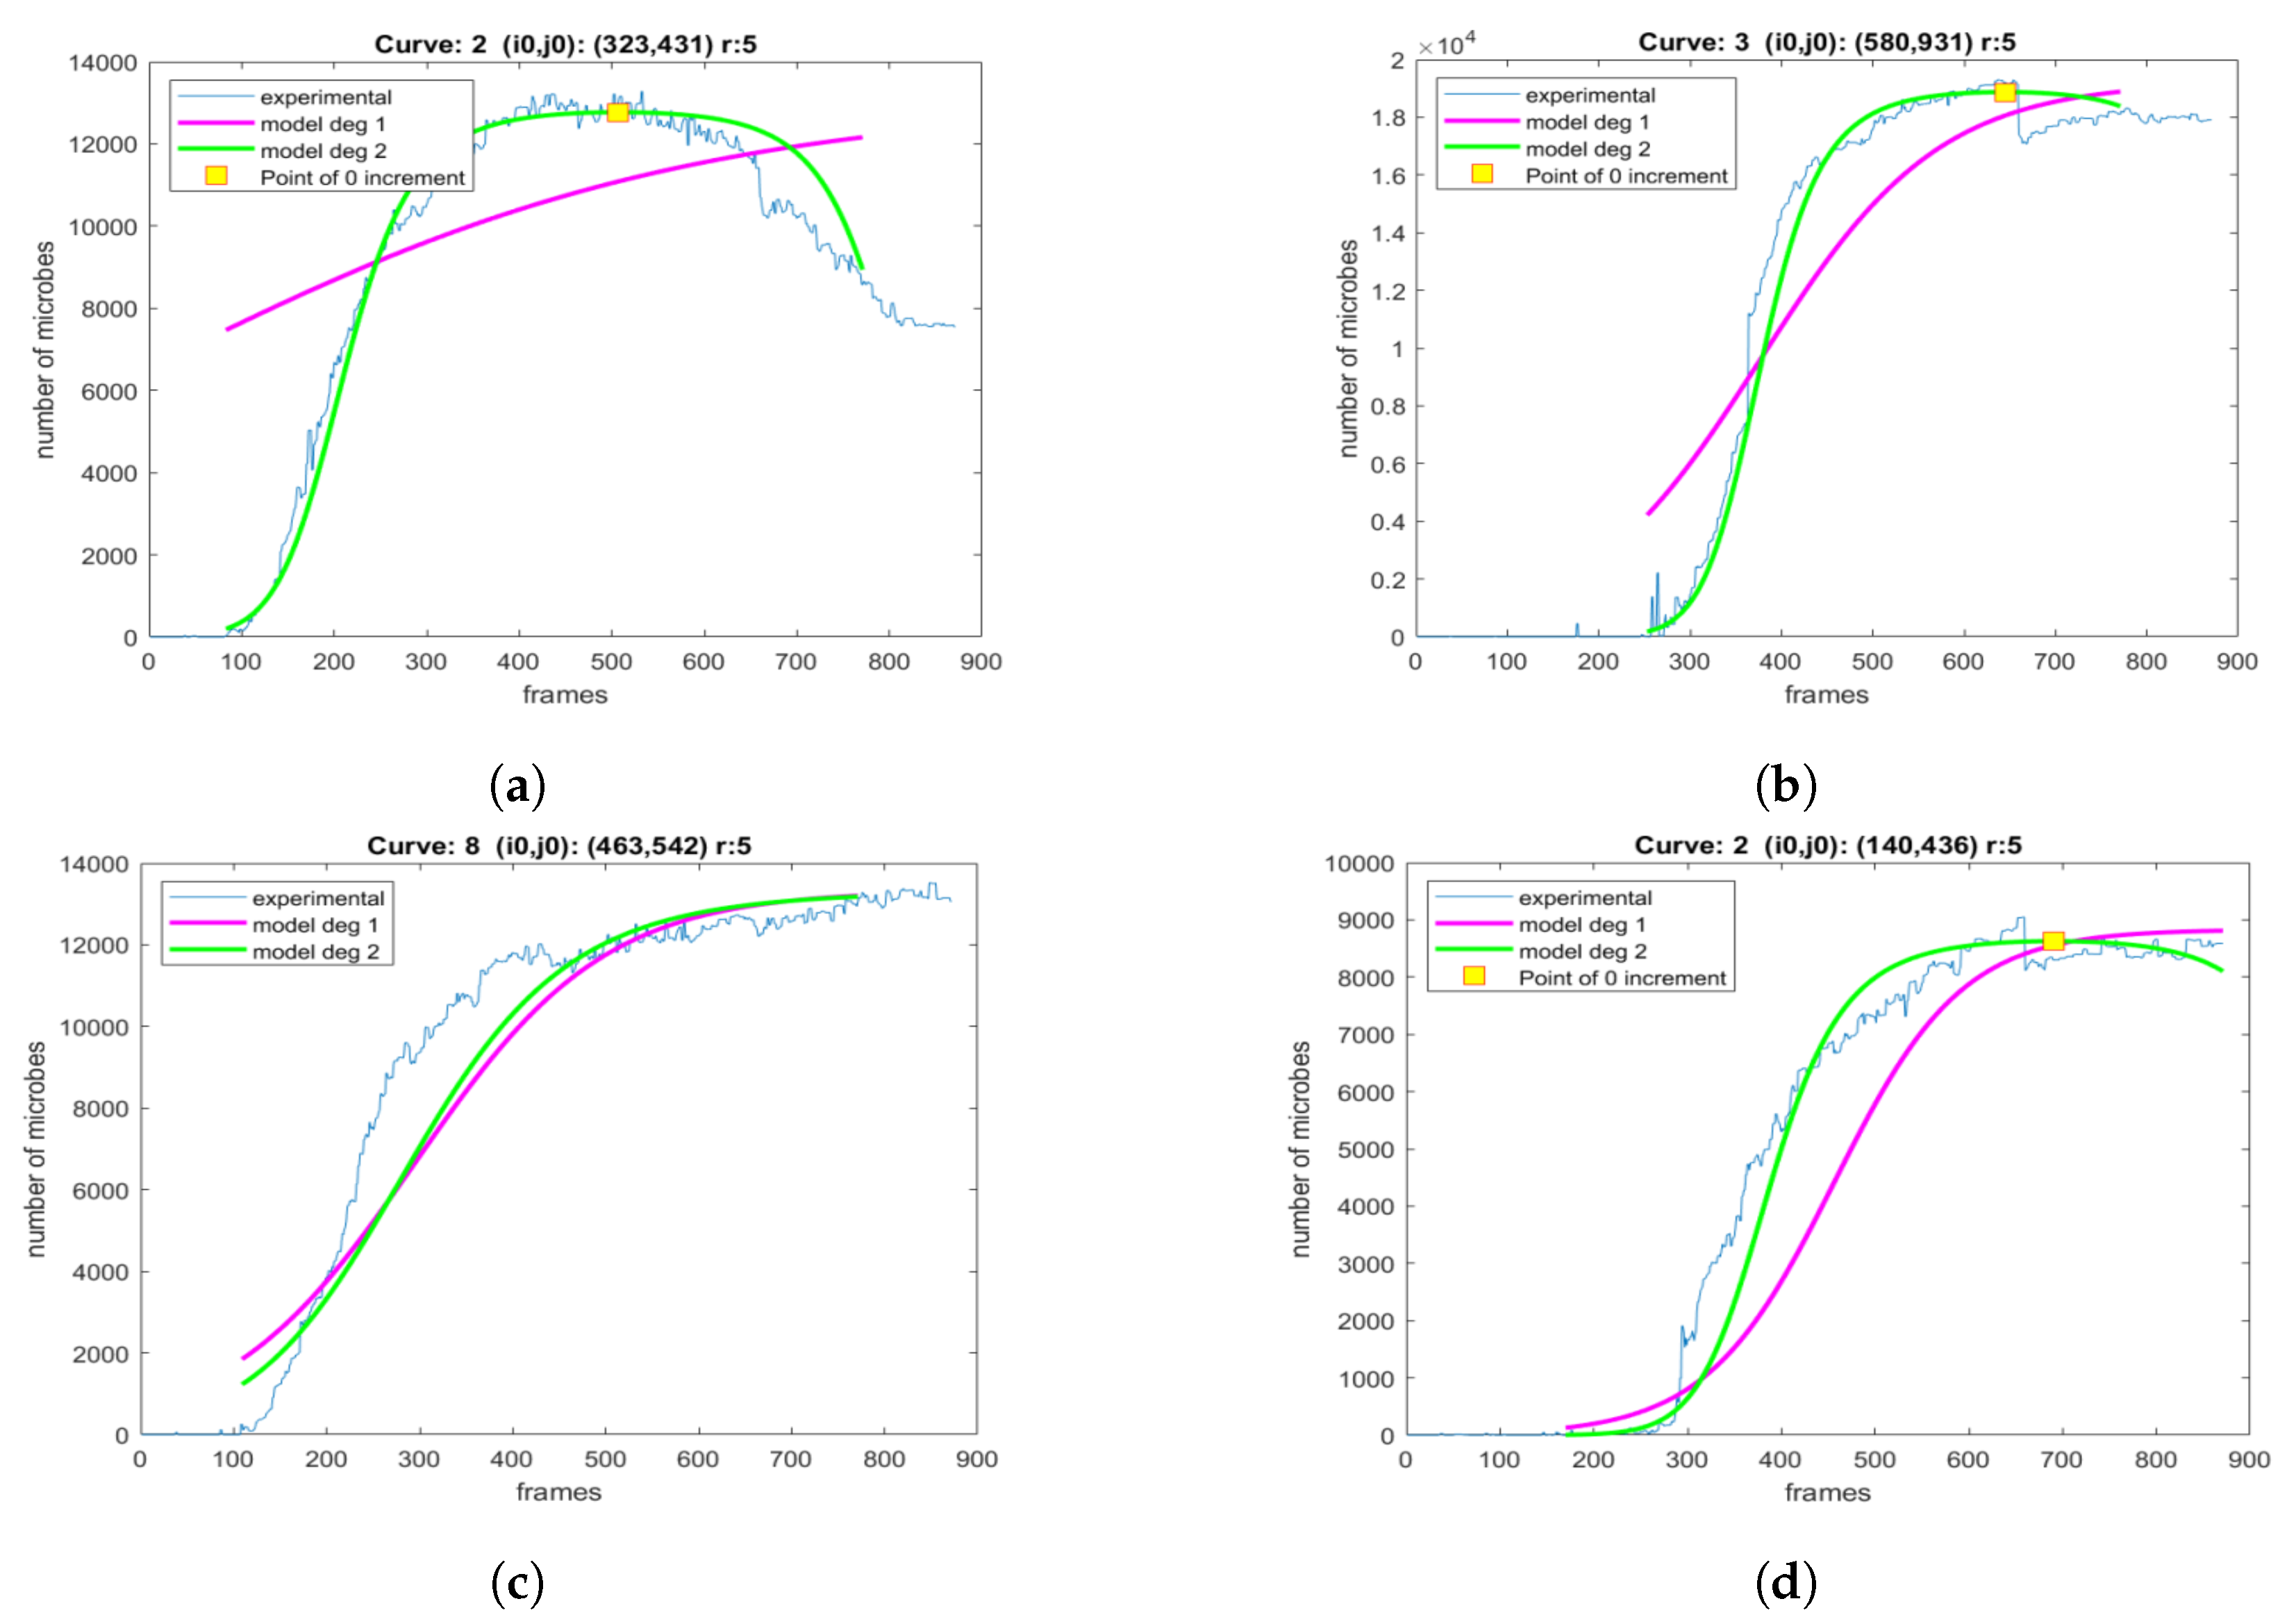
2.2. Image-Based Measurement of Microbe Population and Generation of Experimental Population Curves
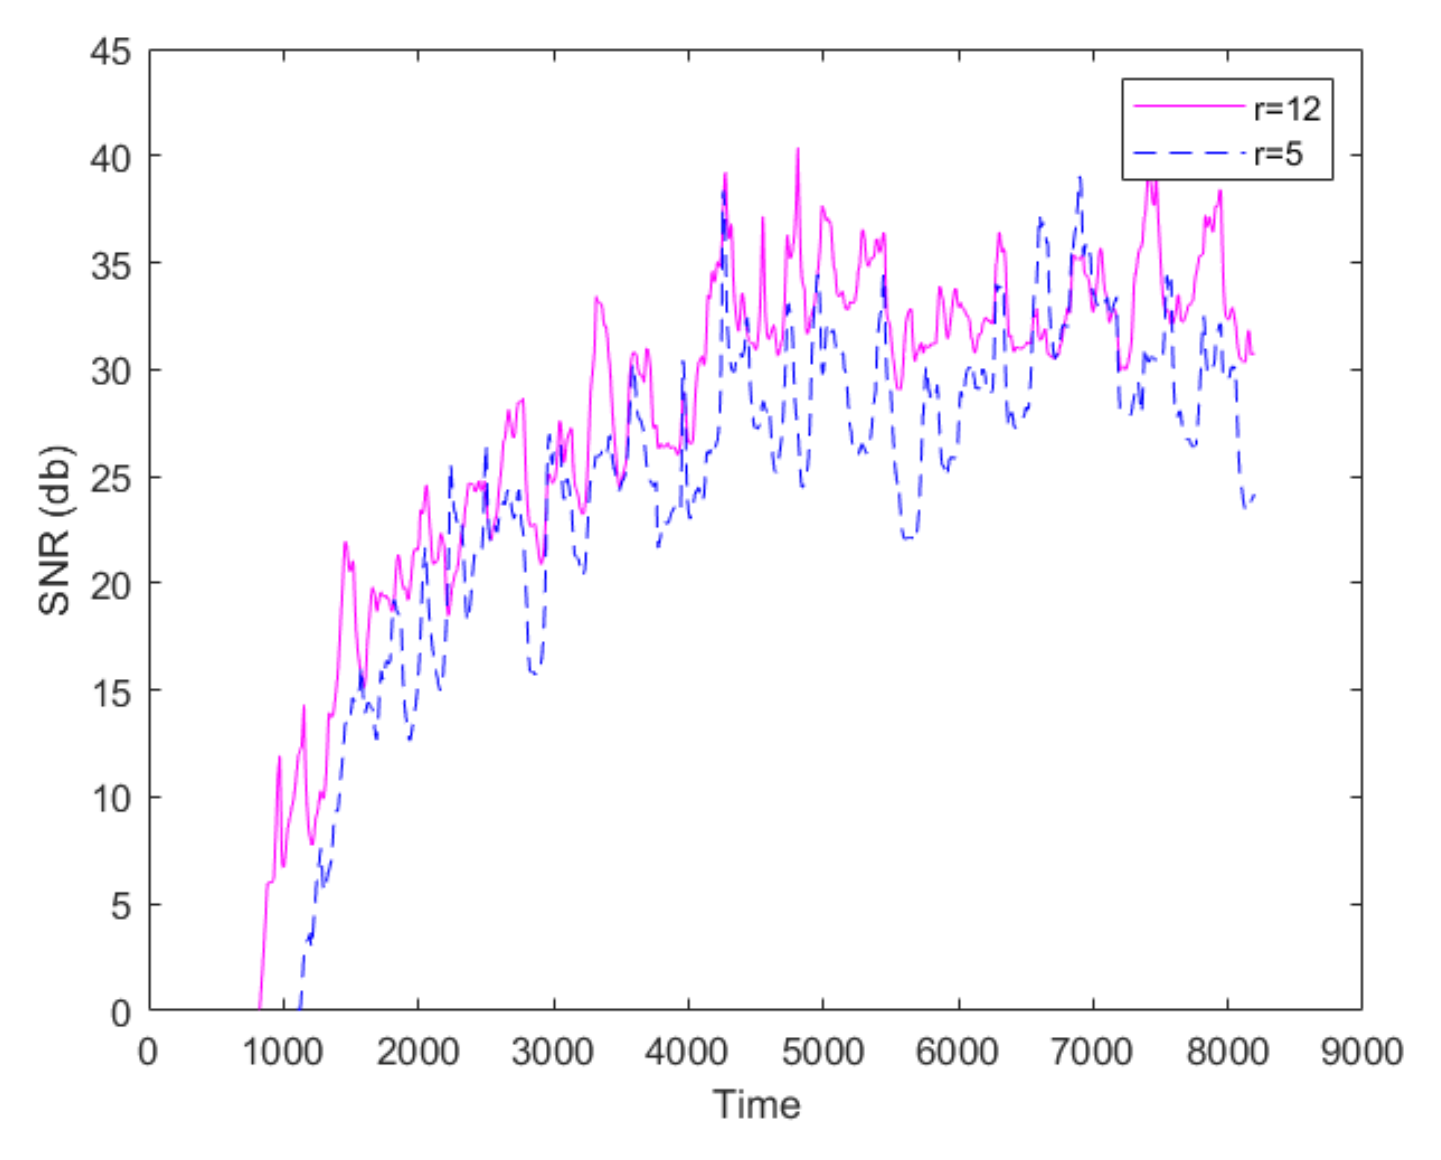
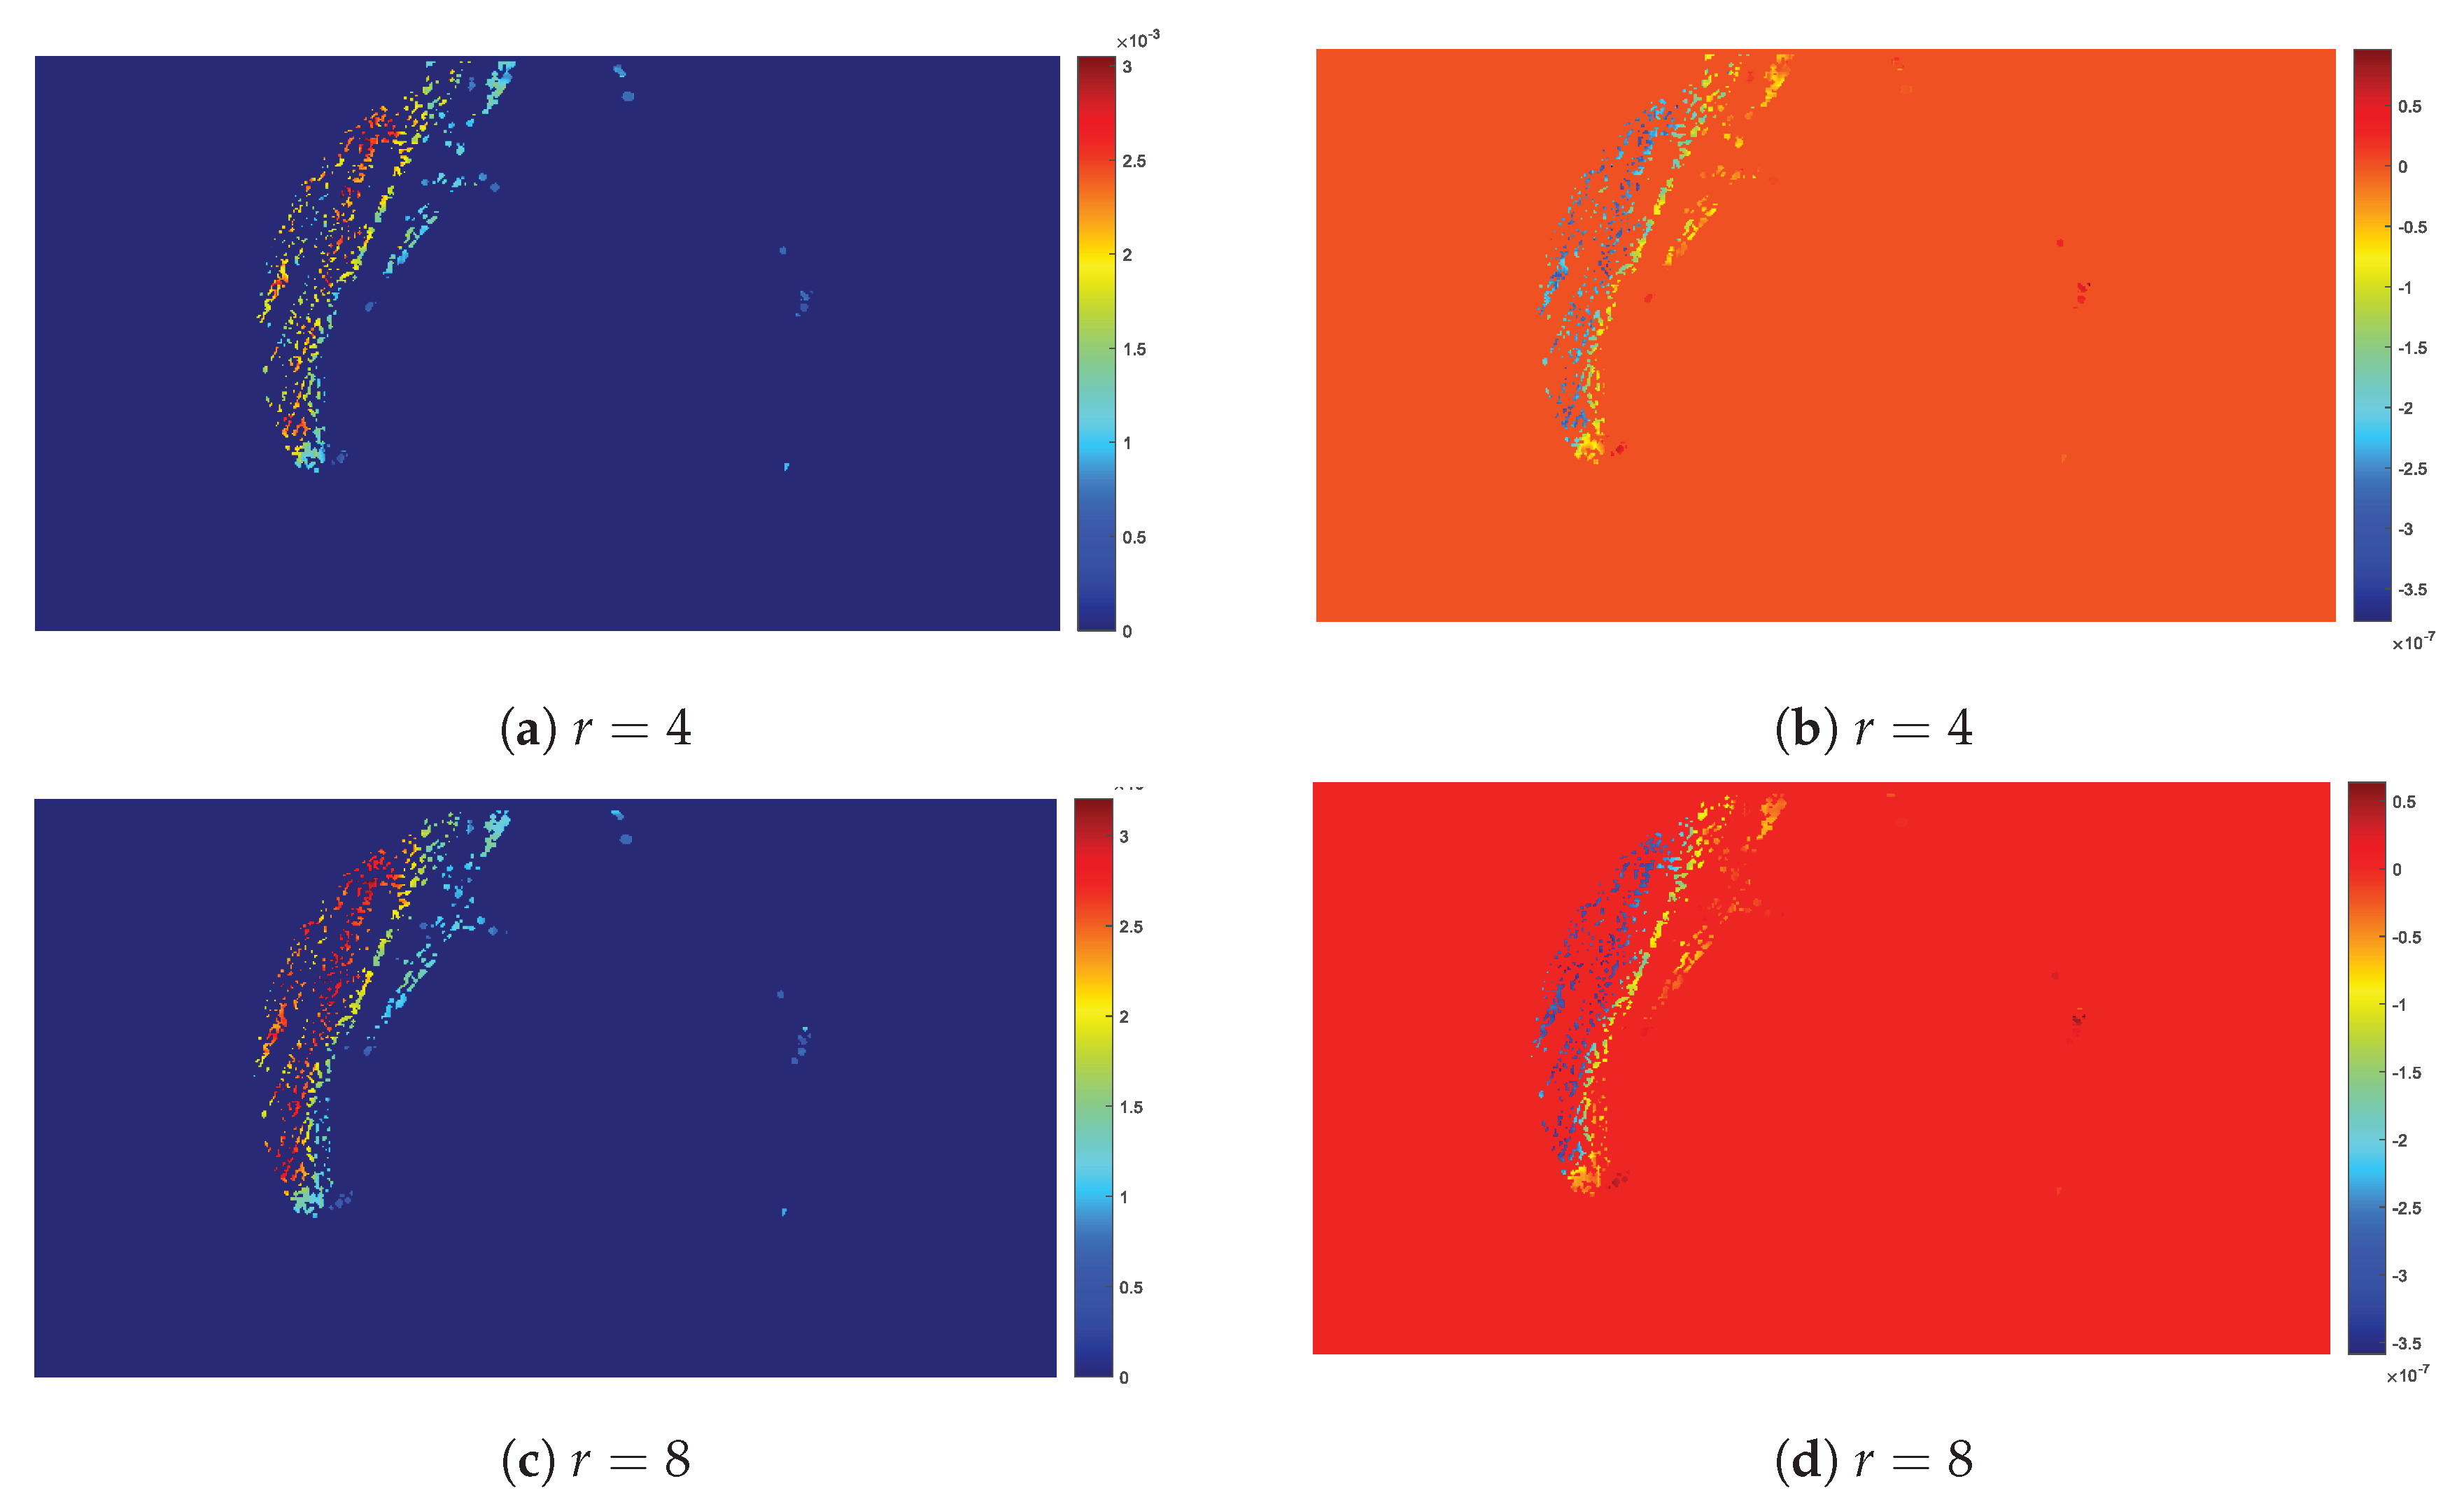
2.3. The Proposed Time-Shifted LFSD Exponent
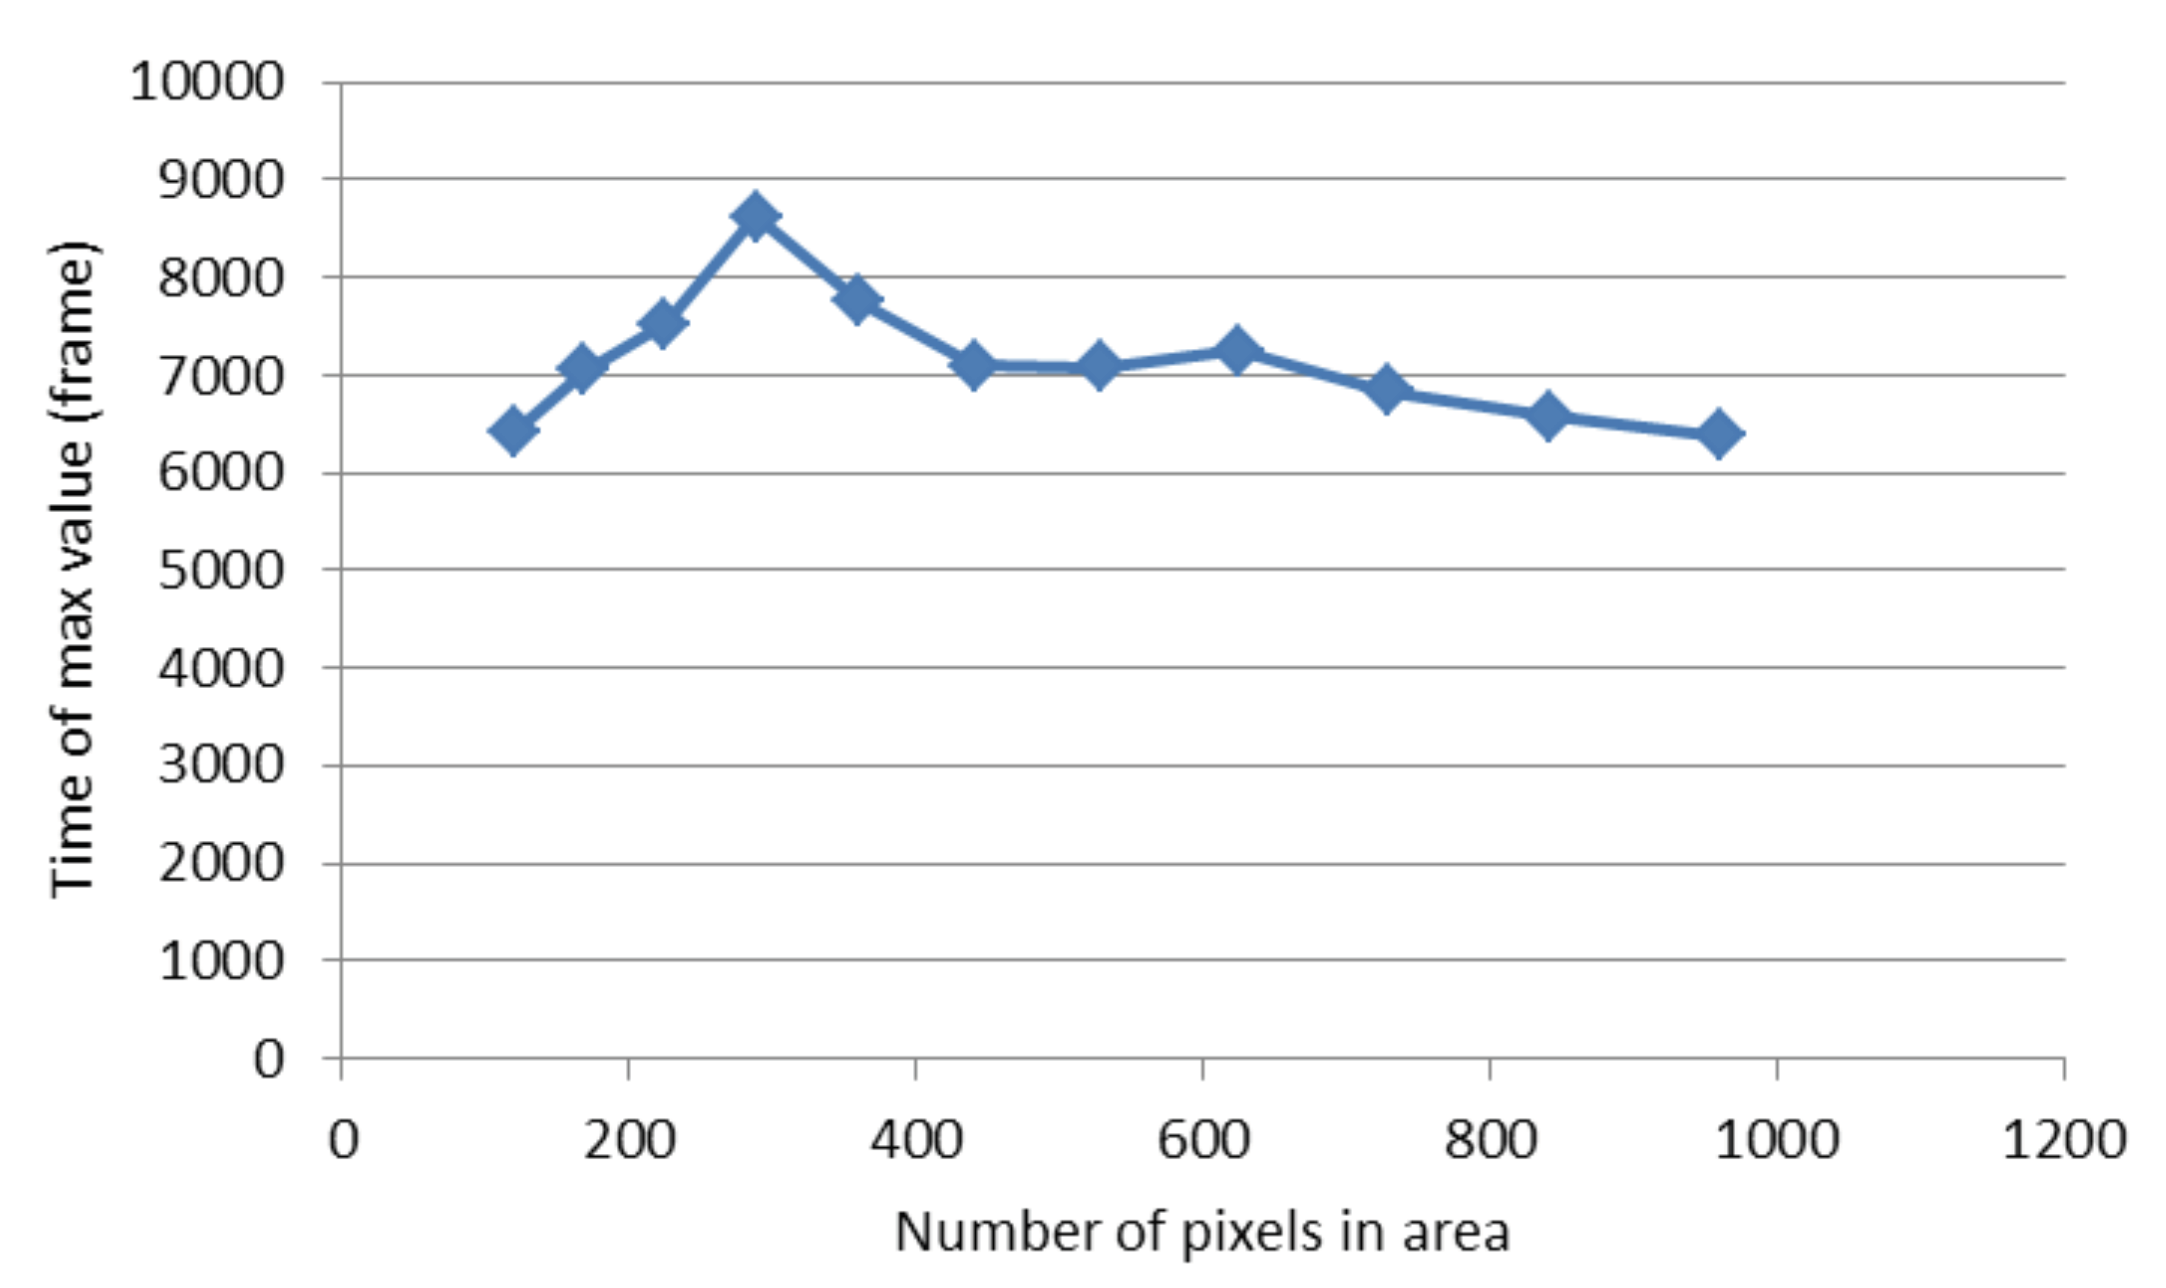
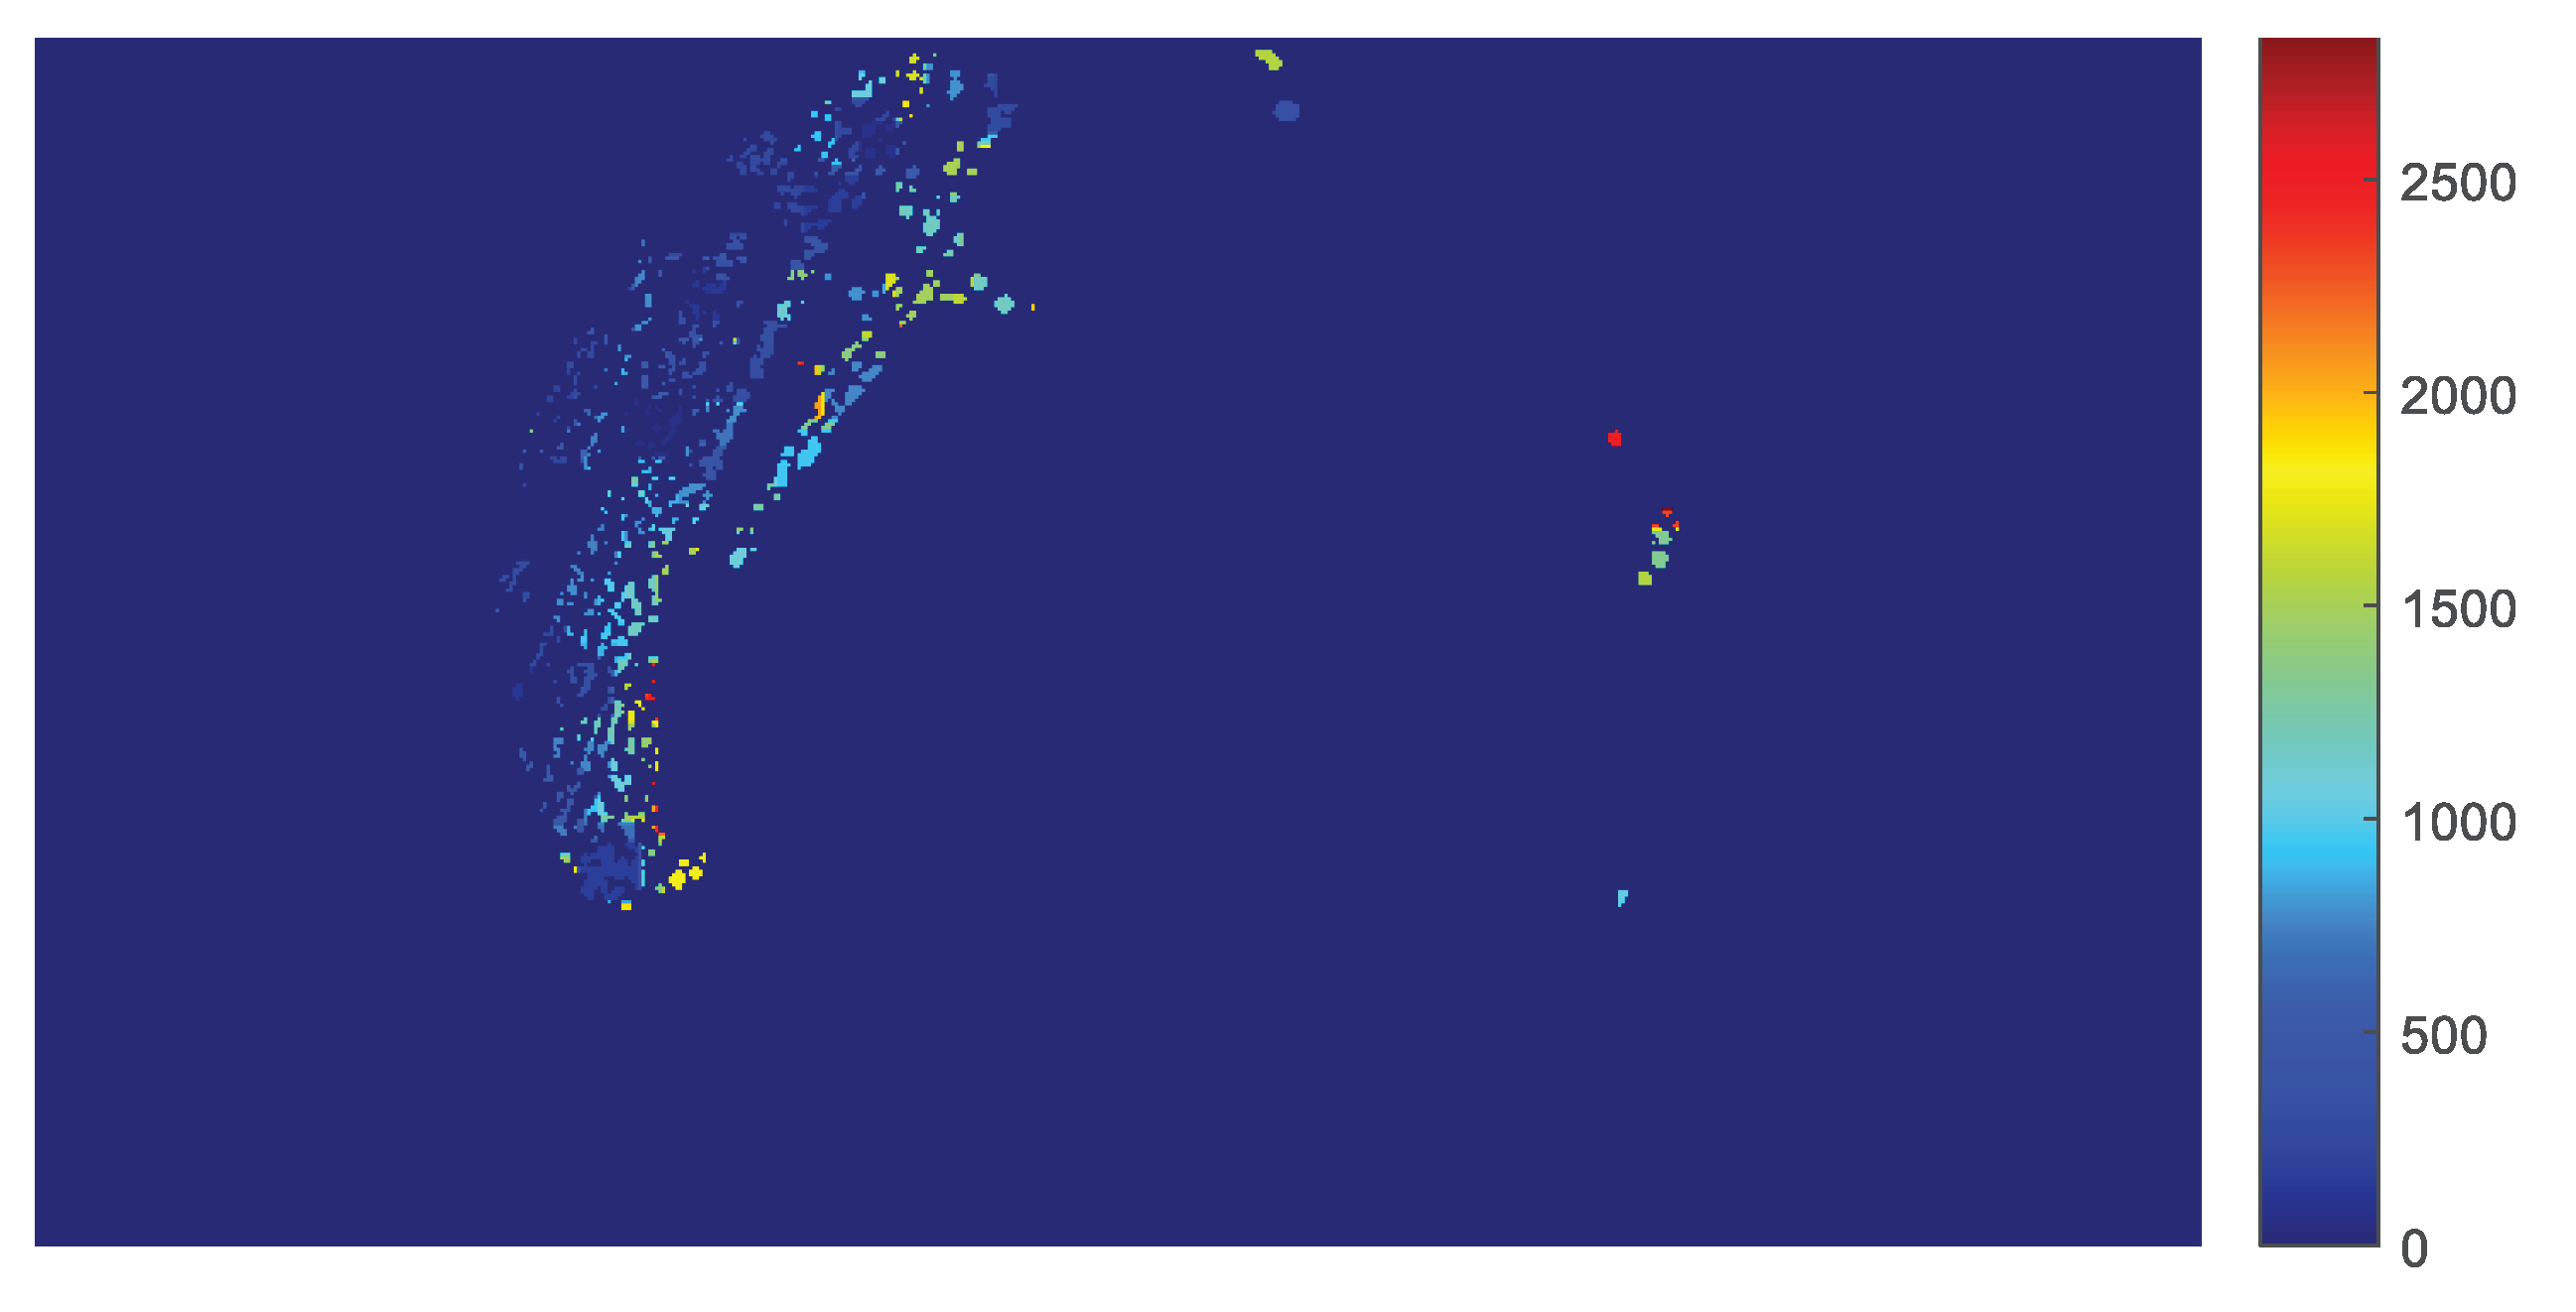
2.4. The Parametric Image
3. Results
4. Conclusions
Author Contributions
Funding
Conflicts of Interest
References
- Sargent, J.R.; Bartley, C.; Dille, P.S.; Keller, J.M.; Nourbakhsh, I.; LeGrand, R. Timelapse GigaPan: Capturing, Sharing, and Exploring Timelapse Gigapixel Imagery. In Proceedings of the Fine International Conference on Gigapixel Imaging for Science, Pittsburgh, PA, USA, 11–13 November 2010; pp. 1–12. [Google Scholar]
- Gonzales, D.S.; Pinheiro, J.C.; Bavister, B.D. Prediction of the developmental potential of hamster embryos in vitro by precise timing of the third cell cycle. Reproduction 1995, 105, 1–8. [Google Scholar] [CrossRef] [PubMed]
- McKiernan, S.H.; Bavister, B.D. Environmental variables influencing in vitro development of hamster 2-cell embryos to the blastocyst stage. Biol. Reprod. 1990, 43, 404–413. [Google Scholar] [CrossRef] [PubMed]
- Schenk, D.; Bacher, S. Functional response of a generalist insect predator to one of its prey species in the field. J. Anim. Ecol. 2002, 71, 524–531. [Google Scholar] [CrossRef]
- Hurst, M.R.H.; van Koten, C.; Jackson, T.A. Pathology of Yersinia entomophaga MH96 towards Costelytra zealandica (Coleoptera; Scarabaeidae) larvae. J. Invertebr. Pathol. 2014, 115, 102–107. [Google Scholar] [CrossRef]
- Cobo, M.P.; Libro, S.; Marechal, N.; D’Entremont, D.; Cobo, D.P.; Berkmen, M. Visualizing bacterial colony morphologies using timelapse imaging chamber MOCHA. J. Bacteriol. 2018, 200, e00413-17. [Google Scholar]
- Dresbøll, D.B.; Thorup-Kristensen, K.; McKenzie, B.M.; Dupuy, L.X.; Bengough, A.G. Timelapse scanning reveals spatial variation in tomato (Solanum lycopersicum L.) root elongation rates during partial waterlogging. Plant Soil 2013, 369, 467–477. [Google Scholar] [CrossRef]
- Desai, N.; Ploskonka, S.; Goodman, L.R.; Austin, C.; Goldberg, J.; Falcone, T. Analysis of embryo morphokinetics, multinucleation and cleavage anomalies using continuous timelapse monitoring in blastocyst transfer cycles. Reprod. Biol. Endocrinol. 2014, 12, 54. [Google Scholar] [CrossRef] [PubMed]
- Shapiro, J.A.; Hsu, C. Escherichia coli K-12 cell-cell interactions seen by timelapse video. J. Bacteriol. 1989, 171, 5963–5974. [Google Scholar] [CrossRef] [PubMed]
- Delpretti, S.; Luisier, F.; Ramani, S.; Blu, T.; Unser, M. Multiframe sure-let denoising of timelapse fluorescence microscopy images. In Proceedings of the 5th IEEE International Symposium on Biomedical Imaging: From Nano to Macro, Paris, France, 14–17 May 2008. [Google Scholar] [CrossRef]
- Zhao, L.; Chen, Y.; Schaffner, D.W. Comparison of Logistic Regression and Linear Regression in Modeling Percentage Data. Appl. Environ. Microbiol. 2001, 67, 2129–2135. [Google Scholar] [CrossRef] [PubMed]
- Sartor, M.A.; Leikauf, G.D.; Medvedovic, M. LRpath: A logistic regression approach for identifying enriched biological groups in gene expression data. Bioinformatics 2008, 25, 211–217. [Google Scholar] [CrossRef] [PubMed]
- Meyer, P. Bi-logistic growth. Technol. Forecas. Soc. Chang. 1994, 47, 89–102. [Google Scholar] [CrossRef]
- Sheehy, J.E. Bi-Phasic Growth Patterns in Rice. Ann. Bot. 2004, 94, 811–817. [Google Scholar] [CrossRef] [PubMed]
- Meyer, P.S.; Ausubel, J.H. Carrying Capacity: A Model with Logistically Varying Limits. Technol. Forecast. Soc. Chang. 1999, 61, 209–214. [Google Scholar] [CrossRef]
- Wong, C.Y.; Goh, K.L. Catch-up models of science and technology: A theorization of the Asian experience from bi-logistic growth trajectories. Technol. Forecast. Soc. Chang. 2015, 95, 312–327. [Google Scholar] [CrossRef]
- Tsoularis, A.; Wallace, J. Analysis of logistic growth models. Math. Biosci. 2002, 179, 21–55. [Google Scholar] [CrossRef]
- Norton, L. A Gompertzian model of human breast cancer growth. Cancer Res. 1988, 48, 7067–7071. [Google Scholar] [PubMed]
- Achkar, J.M.; Fries, B.C. Candida Infections of the Genitourinary Tract. Clin. Microbiol. Rev. 2010, 23, 253–273. [Google Scholar] [CrossRef] [PubMed]
- Bauters, T.G.; Dhont, M.A.; Temmerman, M.I.; Nelis, H.J. Prevalence of vulvovaginal candidiasis and susceptibility to fluconazole in women. Am. J. Obstet. Gynecol. 2002, 187, 569–574. [Google Scholar] [CrossRef] [PubMed]
- Morrell, M.; Fraser, V.J.; Kollef, M.H. Delaying the Empiric Treatment of Candida Bloodstream Infection until Positive Blood Culture Results Are Obtained: A Potential Risk Factor for Hospital Mortality. Antimicrob. Agents Chemother. 2005, 49, 3640–3645. [Google Scholar] [CrossRef] [PubMed]
- Ahmad, A.; Khan, A.U. Prevalence of Candida species and potential risk factors for vulvovaginal candidiasis in Aligarh, India. Eur. J. Obstetr. Gynecol. Reprod. Biol. 2009, 144, 68–71. [Google Scholar] [CrossRef] [PubMed]
- Van Eck, W.; Lamers, M.H. Biological Content Generation: Evolving Game Terrains Through Living Organisms. In Evolutionary and Biologically Inspired Music, Sound, Art and Design; Springer International Publishing: Berlin, Germany, 2015; pp. 224–235. [Google Scholar] [CrossRef]


| Size of Are (Pixel) | Number of Pixels in the Area | ||
|---|---|---|---|
| 7 | 225 | ||
| 8 | 289 | ||
| 9 | 361 | ||
| 10 | 441 | ||
| 11 | 529 | ||
| 12 | 625 | ||
| 13 | 729 | ||
| 14 | 841 | ||
| 15 | 961 |
| Size of Are (Pixel) | Number of Pixels in the Area | |||
|---|---|---|---|---|
| 7 | 225 | |||
| 8 | 289 | |||
| 9 | 361 | |||
| 10 | 441 | |||
| 11 | 529 | |||
| 12 | 625 | |||
| 13 | 729 | |||
| 14 | 841 | |||
| 15 | 961 |
| r | Number of Pixels with |
|---|---|
| 2 | 376 |
| 4 | 229 |
| 8 | 85 |
© 2020 by the authors. Licensee MDPI, Basel, Switzerland. This article is an open access article distributed under the terms and conditions of the Creative Commons Attribution (CC BY) license (http://creativecommons.org/licenses/by/4.0/).
Share and Cite
Delibasis, K.; Basanou, I.; Boulogeorgos, A.-A.A. Measurement and Modeling of Microbial Growth Using Timelapse Video. Sensors 2020, 20, 2545. https://doi.org/10.3390/s20092545
Delibasis K, Basanou I, Boulogeorgos A-AA. Measurement and Modeling of Microbial Growth Using Timelapse Video. Sensors. 2020; 20(9):2545. https://doi.org/10.3390/s20092545
Chicago/Turabian StyleDelibasis, Konstantinos, Ifigenia Basanou, and Alexandros-Apostolos A. Boulogeorgos. 2020. "Measurement and Modeling of Microbial Growth Using Timelapse Video" Sensors 20, no. 9: 2545. https://doi.org/10.3390/s20092545
APA StyleDelibasis, K., Basanou, I., & Boulogeorgos, A.-A. A. (2020). Measurement and Modeling of Microbial Growth Using Timelapse Video. Sensors, 20(9), 2545. https://doi.org/10.3390/s20092545