Thermal Infrared Imaging to Evaluate Emotional Competences in Nursing Students: A First Approach through a Case Study

 ,
,  ,
,  ,
, 
 and
and 
Abstract
1. Introduction
2. Methods
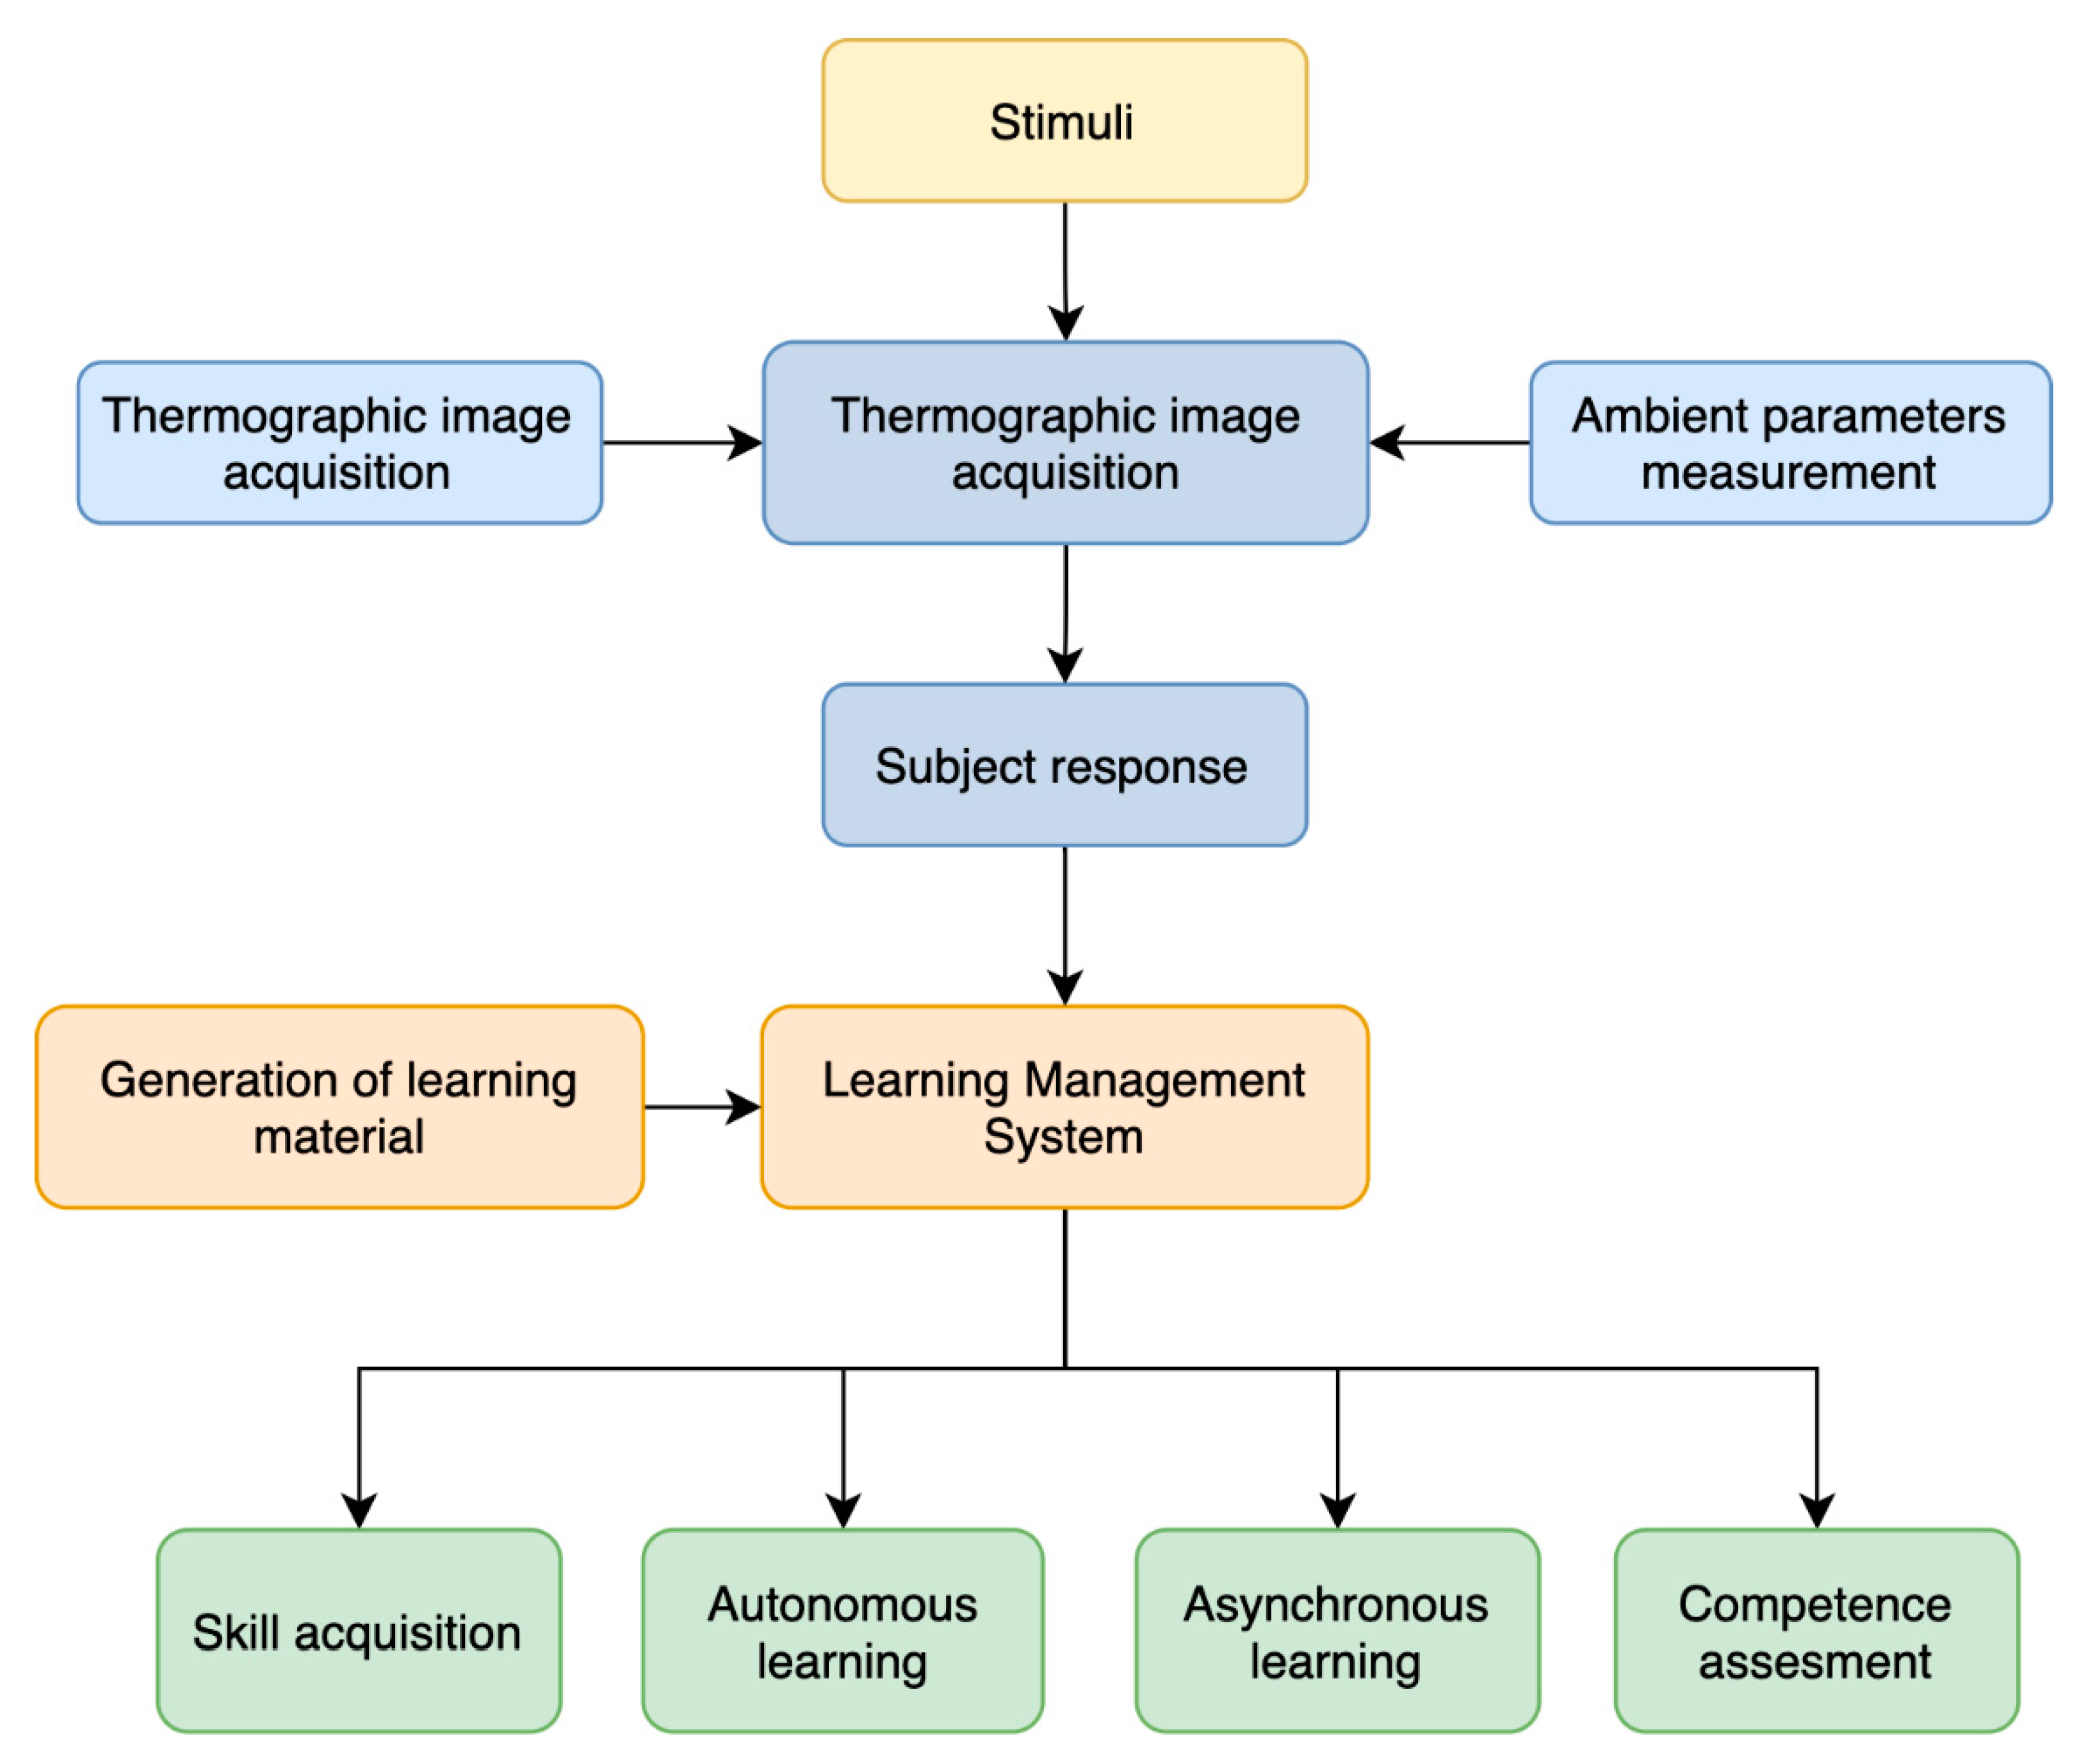
2.1. Study Design
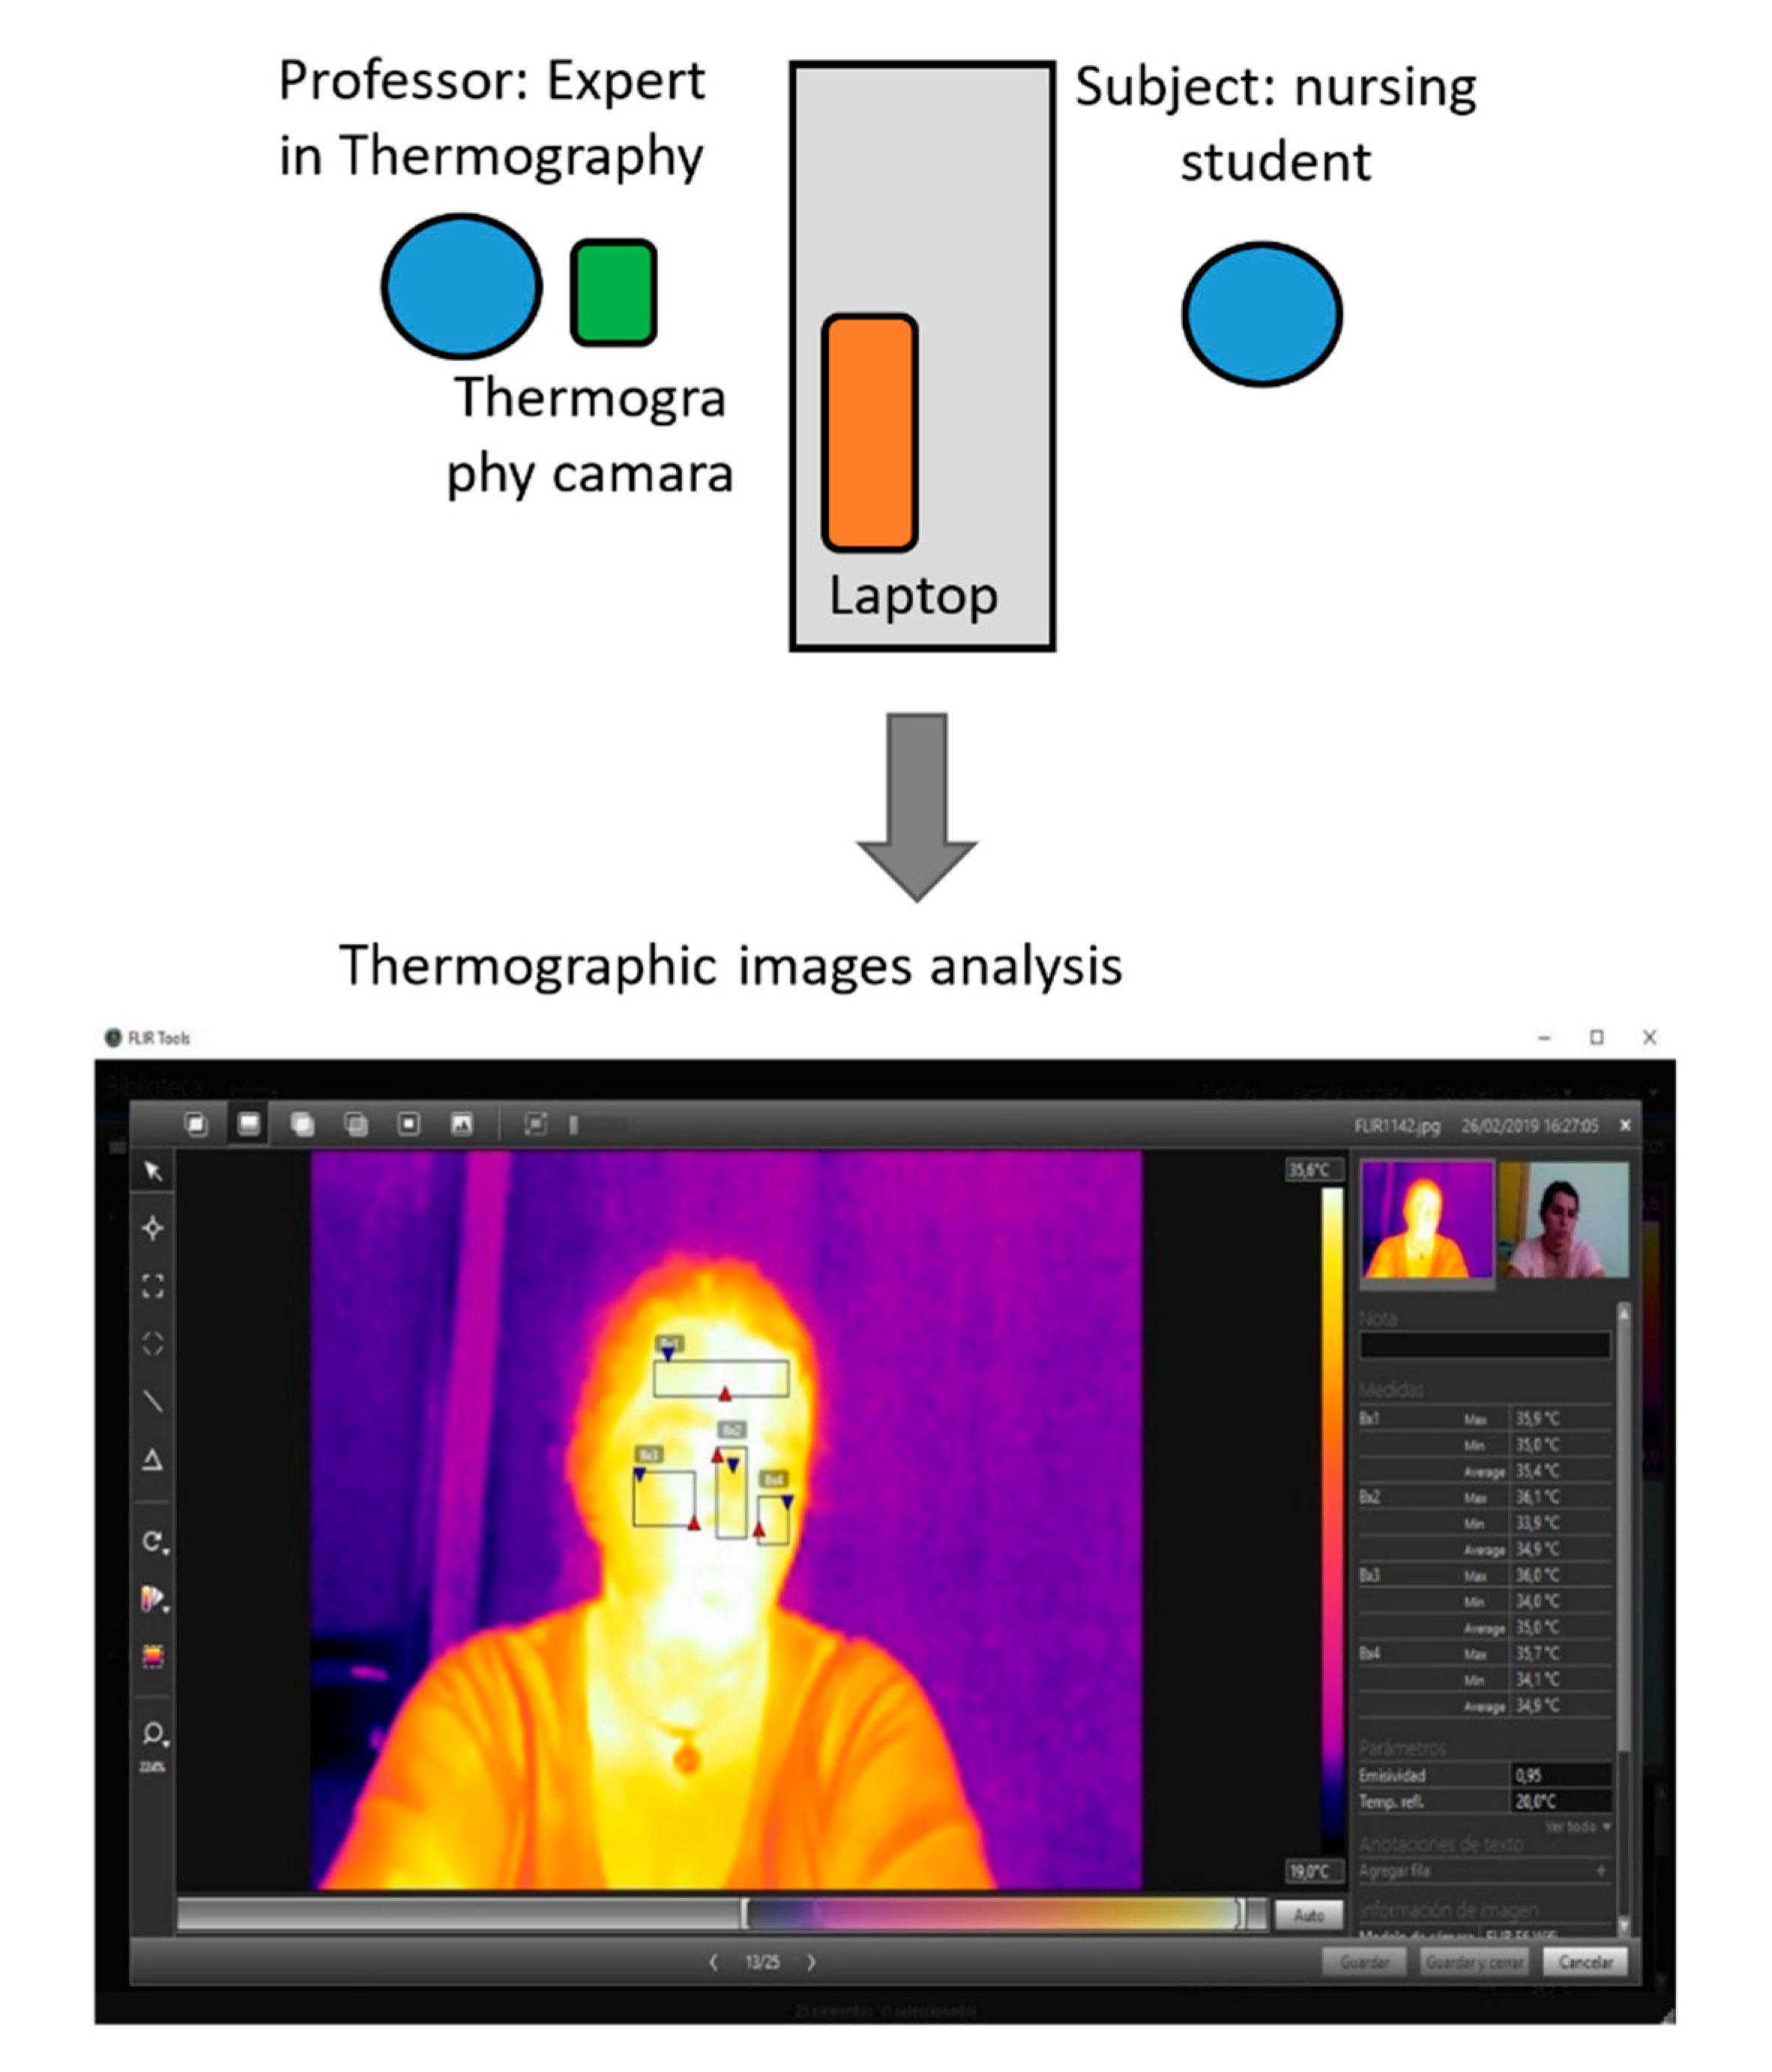
2.2. Experiment Setup
2.3. Materials
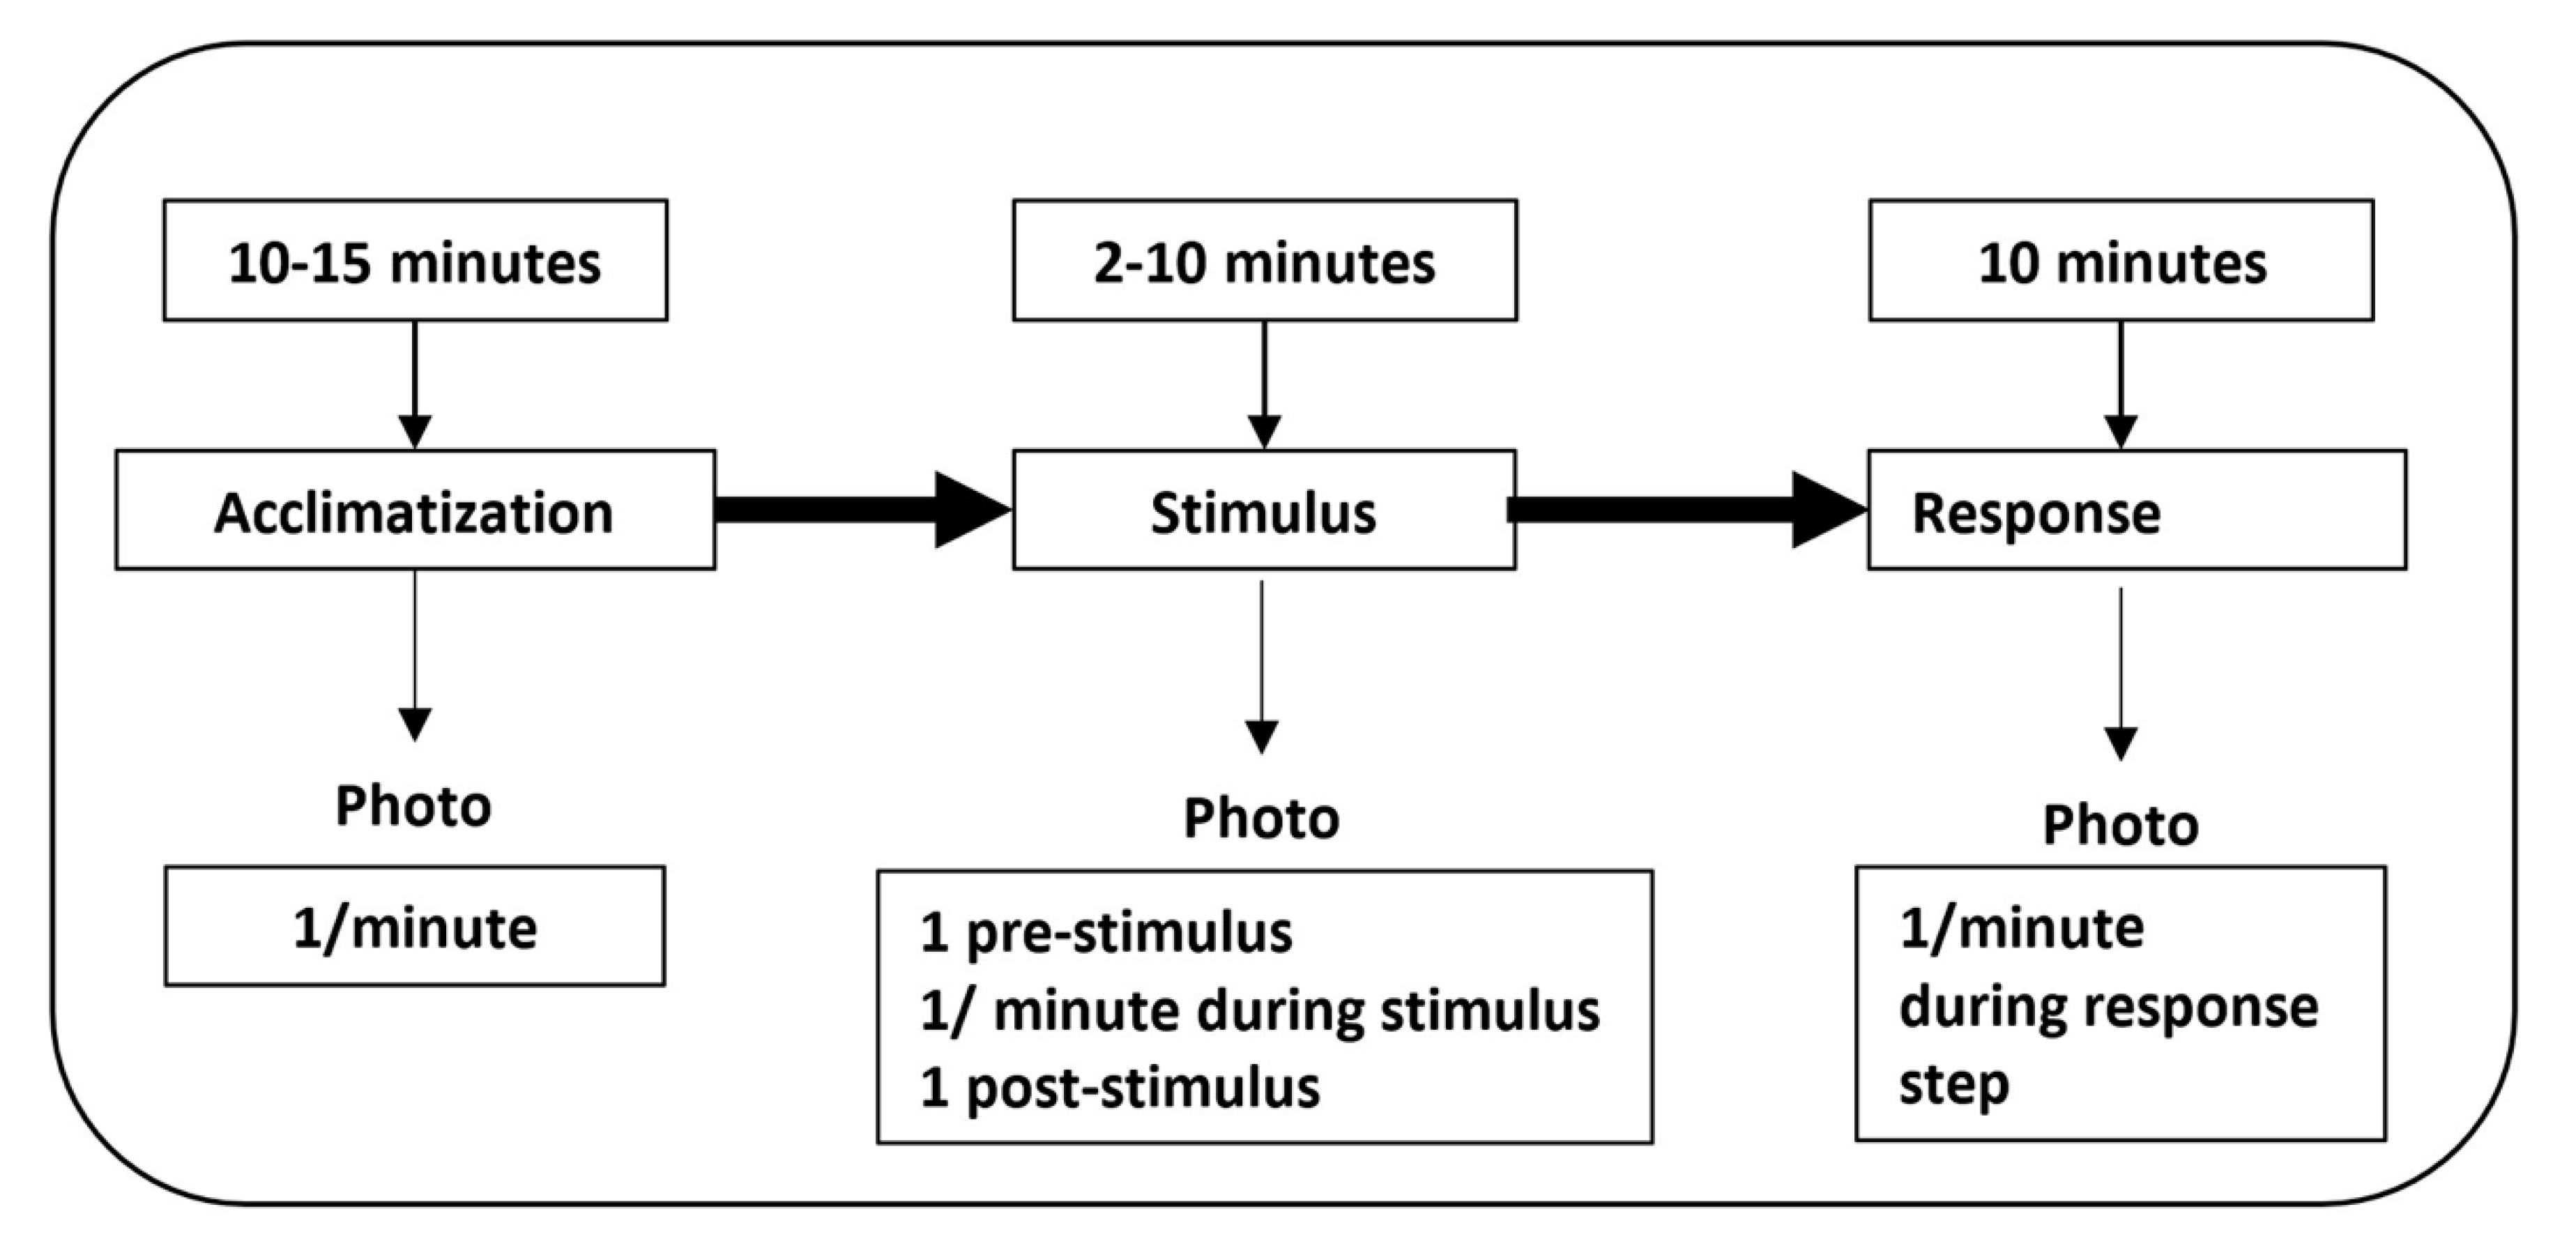
2.4. Data Acquisition Protocol
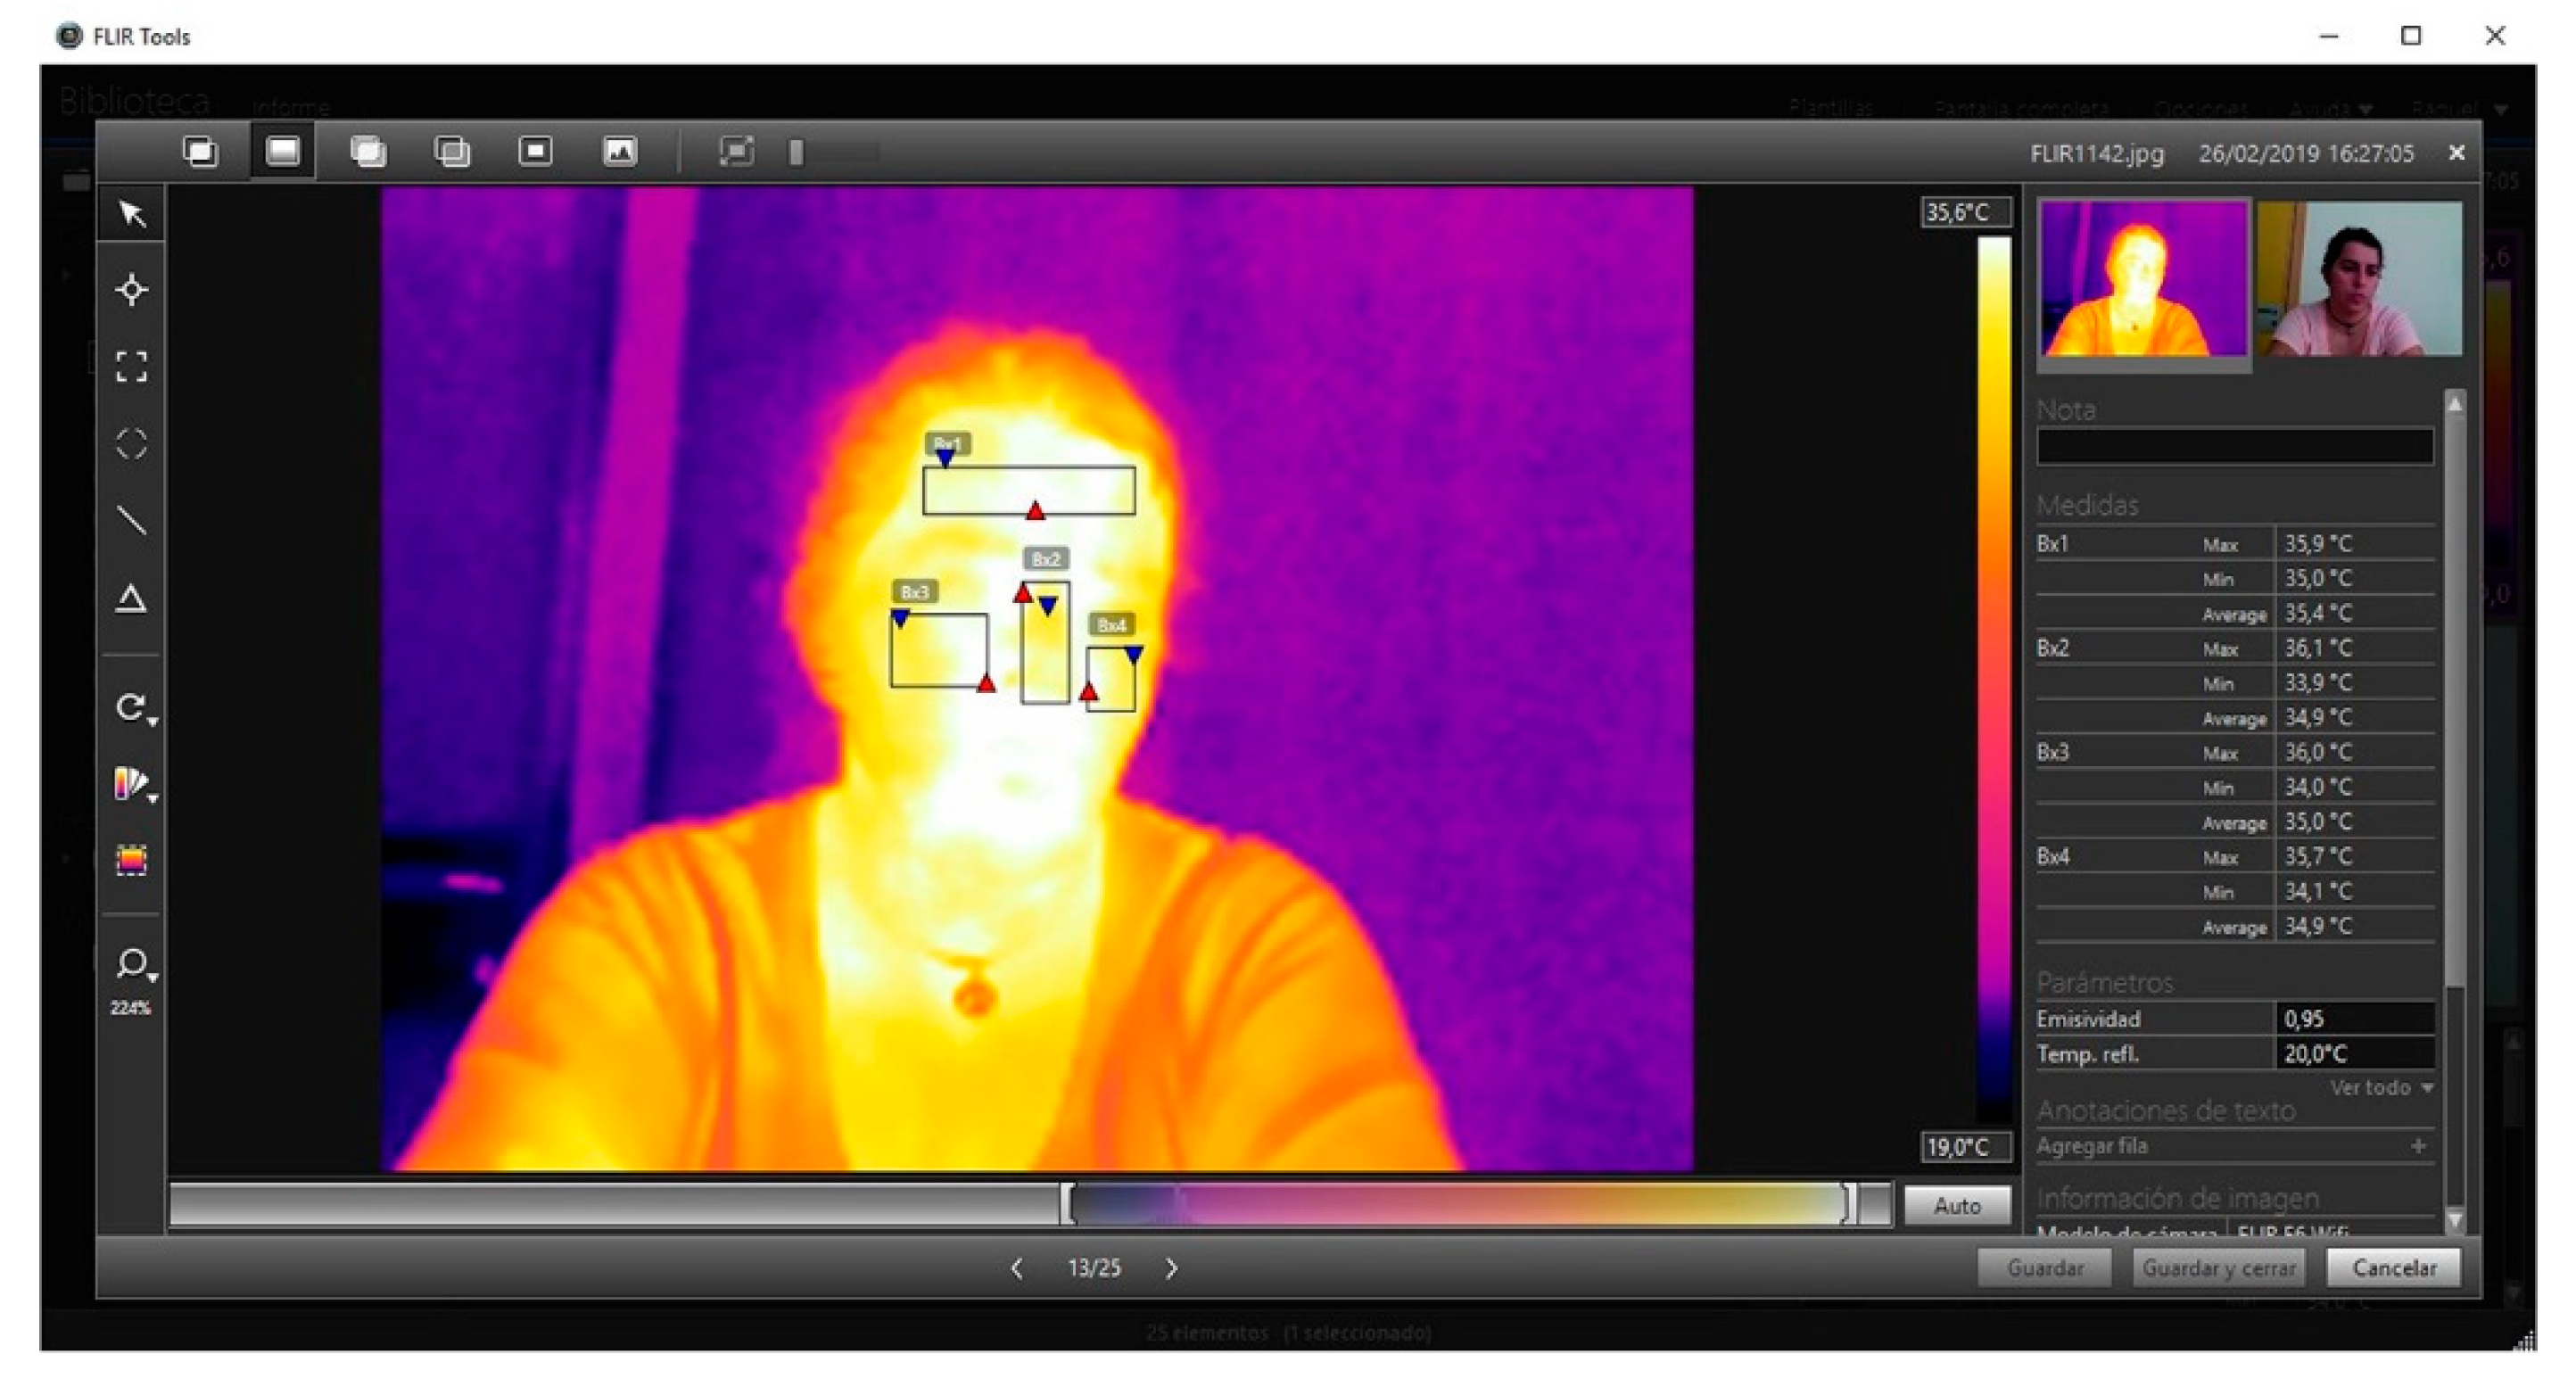
2.5. Thermographic Image Analysis
- -
- Temperature and humidity in the room. Although during the sessions they remained stable, there were slight differences between the sessions.
- -
- Emotions: happiness, love, cheerfulness, anger, fear, and sadness [31].
- -
- Gender and age of subject. Although this research uses the methodology of the case of a single subject, it has been decided to gather these data to be able to replicate the process of the study in future research.
3. Results
- A.
- Thermal changes in the three phases, with audiovisual stimuli (video).
- B.
- Thermal changes in the three phases, with audio stimuli (music).
- C.
- An example of sequential thermographic evaluation.
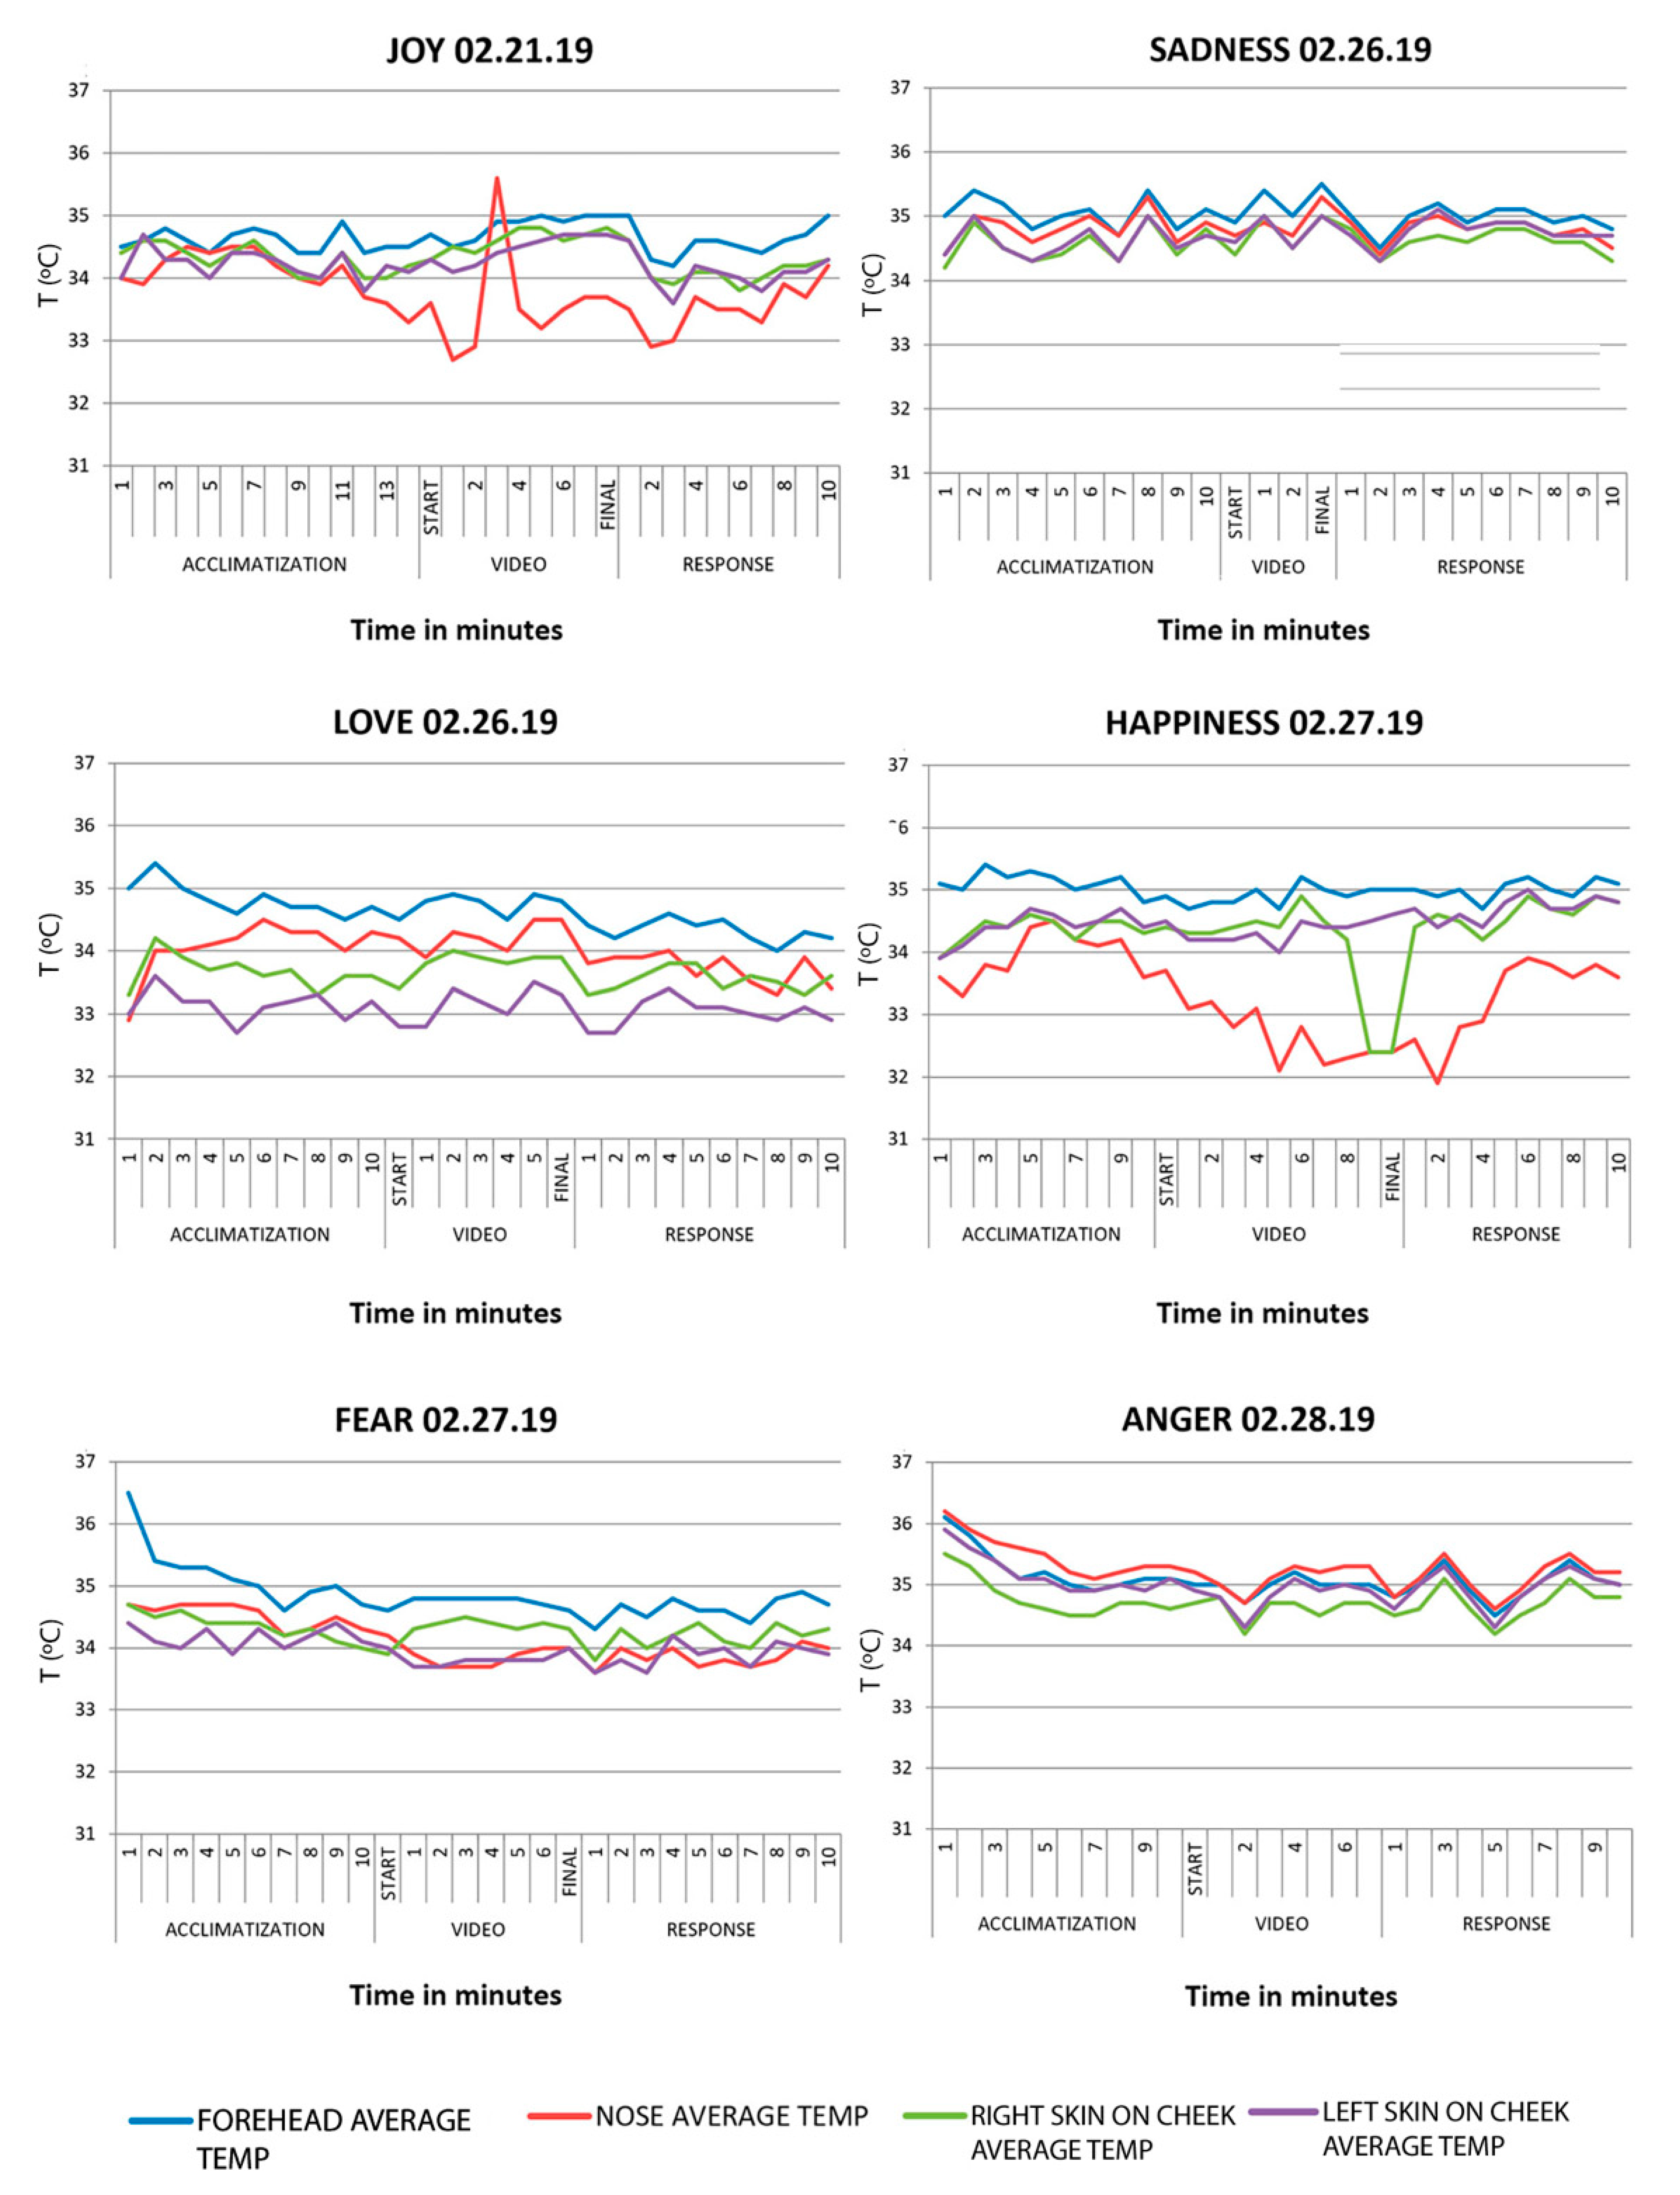
3.1. Part A: Thermal Changes with an Audiovisual Stimulation (Video)
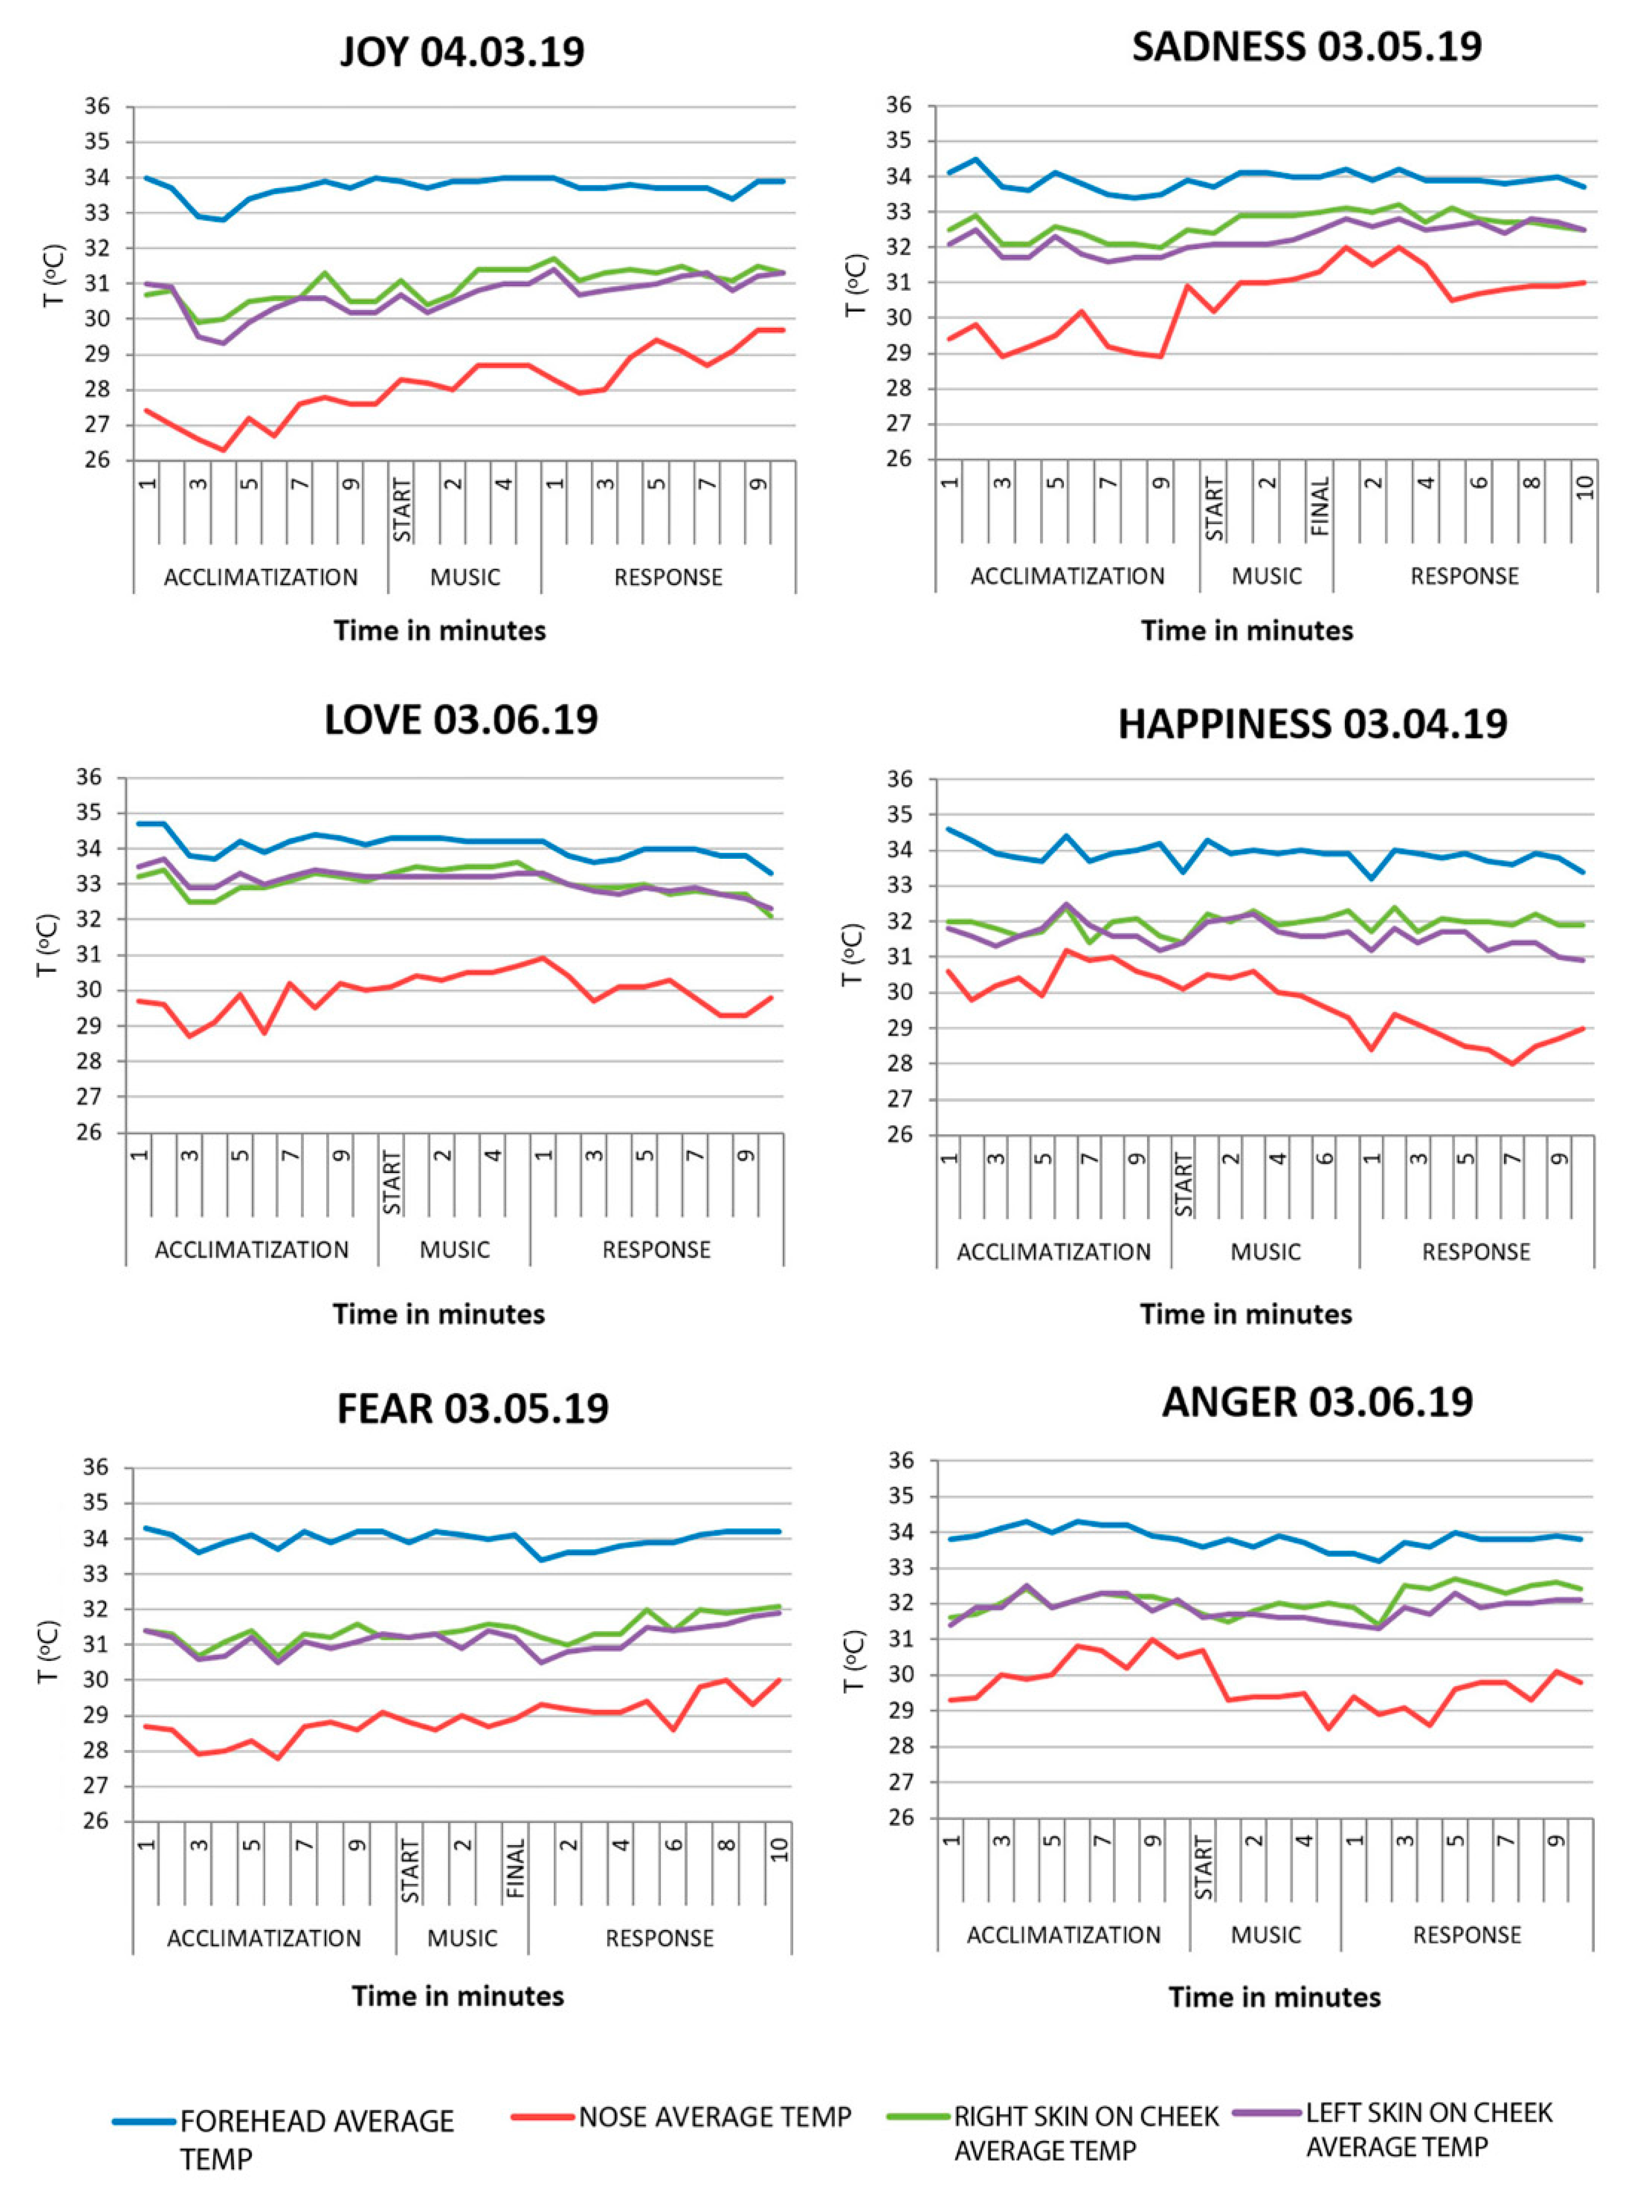
3.2. Part B: Thermal Changes with Audio Stimulus (Music)
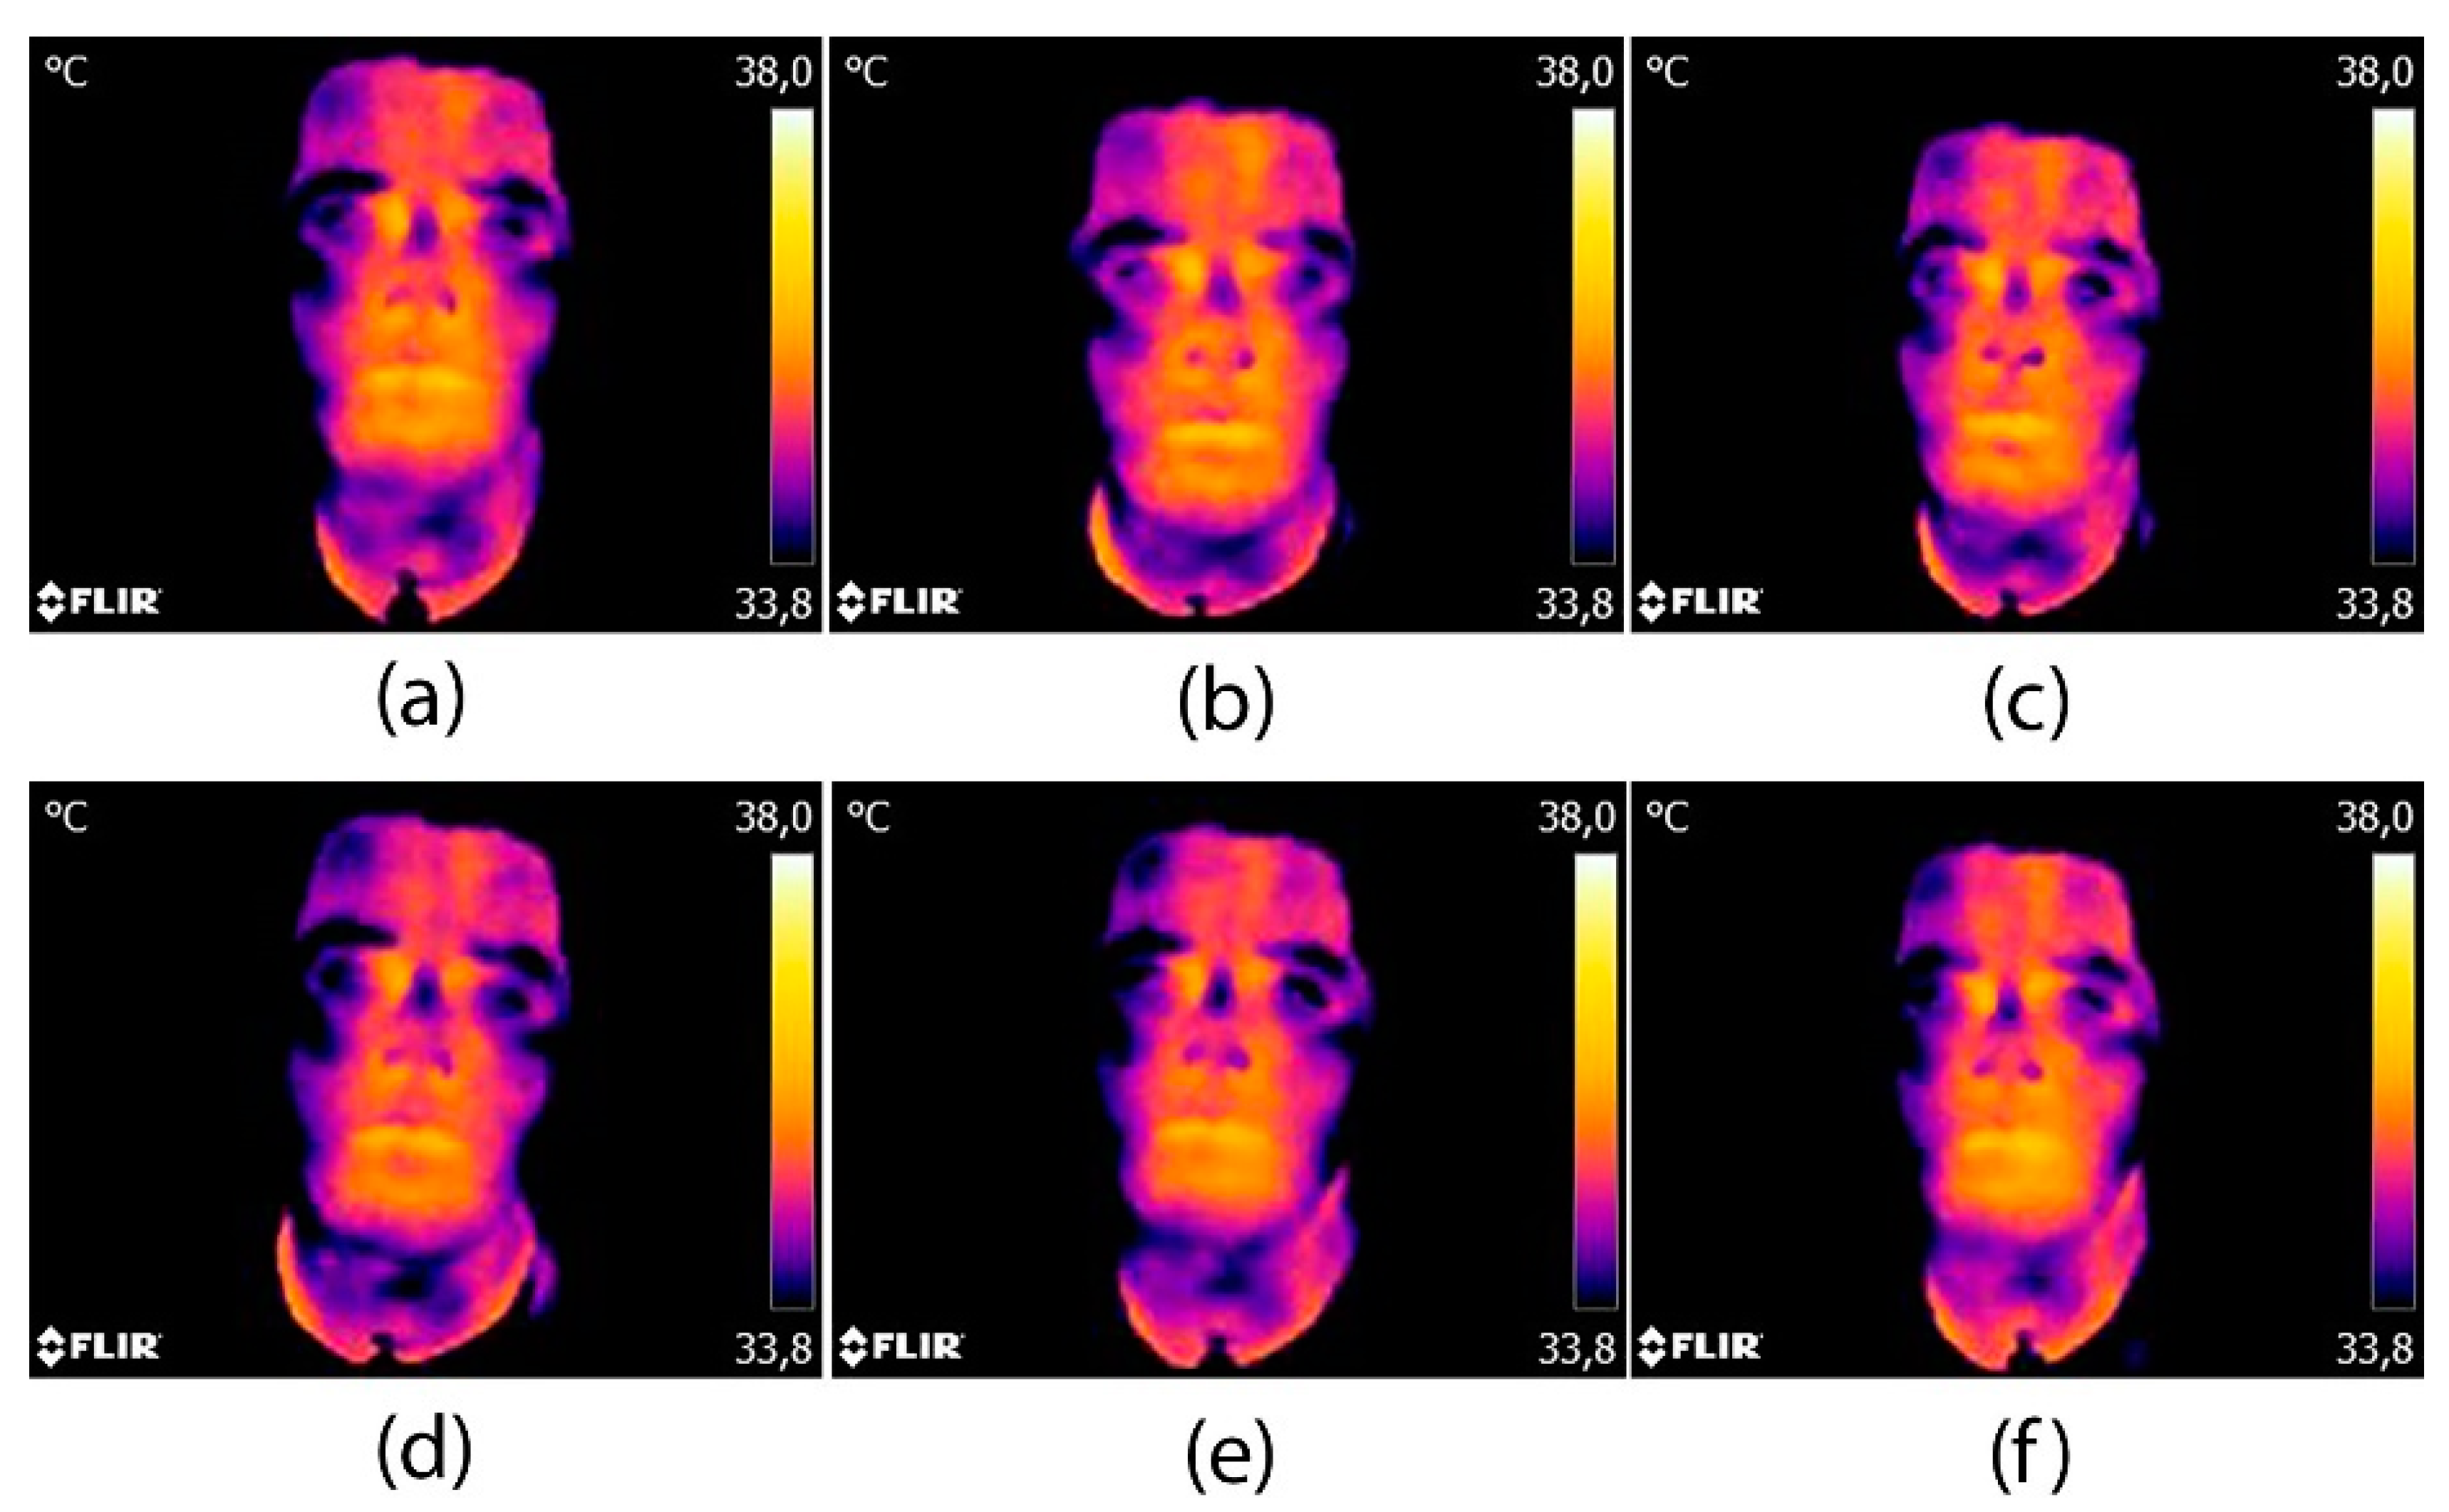
3.3. Part C: Sequential Thermographic Evaluation
4. Discussion
4.1. Conclusions
- Whenever the student is exposed to a stimulus, there is a thermal bodily response that demonstrates that there is a gradient thermal change with respect to the basal temperature of the subject.
- All of the facial areas follow a common thermal pattern in response to the stimulus, with the exception of the nose.
- During the acclimatization phase, the body temperature of the subject did not follow a standard pattern. The room in which the study was carried out varied considerably in temperature throughout the sessions which meant that the temperature of the subject was not always measured under the same conditions.
- It is recommended that the subject of the study is not involved in the research into the case in order to not condition their thermal responses.
- Thermography is the techniques suitable for simulation practices in emotional skills given that it is non-invasive, it is quantifiable, and easy to access.
4.2. Limitations and Future Lines of Research
Author Contributions
Funding
Conflicts of Interest
References
- Giménez-Espert, M.D.C.; Valero-Moreno, S.; Prado-Gascó, V.J. Evaluation of emotional skills in nursing using regression and QCA models: A transversal study. Nurse Educ. Today 2019, 74, 31–37. [Google Scholar] [CrossRef]
- Štiglic, G.; Cilar, L.; Novak, Ž.; Vrbnjak, D.; Stenhouse, R.; Snowden, A.; Pajnkihar, M. Emotional intelligence among nursing students: Findings from a cross-sectional study. Nurse Educ. Today 2018, 66, 33–38. [Google Scholar] [CrossRef] [PubMed]
- Waite, R.; McKinney, N.S. Capital We Must Develop: Emotional Competence Educating Pre-Licensure Nursing Students. Nurs. Educ. Perspect. 2016, 37, 101–103. [Google Scholar] [CrossRef]
- Codier, E.; Freitas, B.; Muneno, L. Developing emotional intelligence ability in oncology nurses: A clinical rounds approach. Oncol. Nurs. Forum 2013, 40, 22–29. [Google Scholar] [CrossRef] [PubMed]
- Clark, M.; Raffray, M.; Hendricks, K.; Gagnon, A.J. Global and public health core competencies for nursing education: A systematic review of essential competencies. Nurse Educ. Today 2016, 40, 173–180. [Google Scholar] [CrossRef]
- Fernández-Cuevas, I.; Marins, J.C.; Carmona, P.G.; García-Concepción, M.A.; Lastras, J.A.; Quintana, M.S. Reliability and reproducibility of skin temperature of overweight subjects by an Infrared Thermography software designed for human beings. Thermol. Int. 2012, 22, 130–137. [Google Scholar]
- Nakanishi, R.; Imai-Matsumura, K. Facial skin temperature decreases in infants with joyful expression. Infant Behav. Dev. 2008, 31, 137–144. [Google Scholar] [CrossRef]
- Keenan, E.; Gethin, G.; Flynn, L.; Watterson, D.; O’Connor, G.M. Enhanced thermal imaging of wound tissue for better clinical decision making. Physiol. Meas. 2017, 38, 1104. [Google Scholar] [CrossRef]
- De Andrade Fernandes, A.; Dos Santos Amorim, P.R.; Brito, C.J.; De Moura, A.G.; Moreira, D.G.; Costa, C.M.A.; Sillero-Quintana, M.; Marins, J.C.B. Measuring skin temperature before, during and after exercise: A comparison of thermocouples and infrared thermography. Physiol. Meas. 2014, 35, 189–203. [Google Scholar] [CrossRef]
- Rodríguez-Gonzálvez, P.; Rodríguez-Martín, M. Understanding uncertainties in thermographic imaging. In Proceedings of the Seventh International Conference on Technological Ecosystems for Enhancing Multiculturality, León, Spain, 16–18 October 2019; ACM International Conference Proceeding Series. Association for Computing Machinery: New York, NY, USA, 2019; pp. 65–71. [Google Scholar]
- Clay-Warner, J.; Robinson, D.T. Infrared Thermography as a Measure of Emotion Response. Emot. Rev. 2015, 7, 157–162. [Google Scholar] [CrossRef]
- Robinson, D.T.; Clay-Warner, J.; Moore, C.D.; Everett, T.; Watts, A.; Tucker, T.N.; Thai, C. Toward an unobtrusive measure of emotion during interaction: Thermal imaging techniques. Adv. Gr. Process. 2012, 29, 225–256. [Google Scholar]
- Escamilla-Galindo, V.L.; Estal-Martínez, A.; Adamczyk, J.G.; Brito, C.J.; Arnaiz-Lastras, J.; Sillero-Quintana, M. Skin temperature response to unilateral training measured with infrared thermography. J. Exerc. Rehabil. 2017, 13, 526–534. [Google Scholar] [CrossRef] [PubMed]
- Cruz-Albarran, I.A.; Benitez-Rangel, J.P.; Osornio-Rios, R.A.; Dominguez-Trejo, B.; Rodriguez-Medina, D.A.; Morales-Hernandez, L.A. A methodology based on infrared thermography for the study of stress in hands of young people during the Trier Social Stress Test. Infrared Phys. Technol. 2018, 93, 116–123. [Google Scholar] [CrossRef]
- Cardone, D.; Merla, A. New Frontiers for Applications of Thermal Infrared Imaging Devices: Computational Psychopshysiology in the Neurosciences. Sensors 2017, 17, 1042. [Google Scholar] [CrossRef] [PubMed]
- Beanlands, H.; McCay, E.; Fredericks, S.; Newman, K.; Rose, D.; Santa Mina, E.; Schindel Martin, L.; Schwind, J.; Sidani, S.; Aiello, A.; et al. Decreasing stress and supporting emotional well-being among senior nursing students: A pilot test of an evidence-based intervention. Nurse Educ. Today 2019, 76, 222–227. [Google Scholar] [CrossRef] [PubMed]
- Tamaki, T.; Inumaru, A.; Yokoi, Y.; Fujii, M.; Tomita, M.; Inoue, Y.; Kido, M.; Ohno, Y.; Tsujikawa, M. The effectiveness of end-of-life care simulation in undergraduate nursing education: A randomized controlled trial. Nurse Educ. Today 2019, 76, 1–7. [Google Scholar] [CrossRef] [PubMed]
- Pawar, S.; Jacques, T.; Deshpande, K.; Pusapati, R.; Meguerdichian, M.J. Evaluation of cognitive load and emotional states during multidisciplinary critical care simulation sessions. BMJ Simul. Technol. Enhanc. Learn. 2018, 4, 87–91. [Google Scholar] [CrossRef]
- Foronda, C.L.; Baptiste, D.L.; Pfaff, T.; Velez, R.; Reinholdt, M.; Sanchez, M.; Hudson, K.W. Cultural Competency and Cultural Humility in Simulation-Based Education: An Integrative Review. Clin. Simul. Nurs. 2018, 15, 42–60. [Google Scholar] [CrossRef]
- Starkweather, A.; Sargent, L.; Nye, C.; Albrecht, T.; Cloutier, R.; Foster, A. Progressive Assessment and Competency Evaluation Framework for Integrating Simulation in Nurse Practitioner Education. J. Nurse Pract. 2017, 13, e301–e310. [Google Scholar] [CrossRef]
- Oyelana, O.; Martin, D.; Scanlan, J.; Temple, B. Learner-centred teaching in a non-learner-centred world: An interpretive phenomenological study of the lived experience of clinical nursing faculty. Nurse Educ. Today 2018, 67, 118–123. [Google Scholar] [CrossRef]
- Pomares, J.; Garcia, G.J.; Lorenzo, G.; Lledó Carreres, A.; Roig-Vila, R. Gestión de Calidad, Autoaprendizaje y Docencia Virtual en el Máster Universitario en Automática y Robótica. Available online: http://hdl.handle.net/10045/71189 (accessed on 28 April 2020).
- Ayala Álvarez, F.J.; Blázquez Parra, E.B.; Montes Tubio, F. Presentation of 3d contents: From classroom to job. Usability and influence in spatial ability. DYNA 2017, 92, 137. [Google Scholar]
- Rodríguez-Gonzálvez, P.; Fradejas, B.A.C.; Rodríguez-Martín, M.; Alvear-Órdenes, I. 3D visualization techniques in health science learning. Application case of Thermographic Images to Blood Flow Monitoring. ACM Int. Conf. Proc. Ser. 2018, 373–380. [Google Scholar] [CrossRef]
- Rodríguez-Martín, M.; Rodríguez-Gonzálvez, P. Learning methodology based on weld virtual models in the mechanical engineering classroom. Comput. Appl. Eng. Educ. 2019, 27, 1113–1125. [Google Scholar] [CrossRef]
- Chetty, S. The Case Study Method for Research in Small-and Medium-Sized Firms. Int. Small Bus. J. Res. Entrep. 1996, 15, 73–85. [Google Scholar] [CrossRef]
- Fox-Wolfgramm, S.J. Towards developing a methodology for doing qualitative reserch research: The dynamic-comparative case study method. Scand. J. Manag. 1997, 13, 439–455. [Google Scholar] [CrossRef]
- Eisenhardt, K.M. Building Theories from Case Study Research. Acad. Manag. Rev. 1989, 14, 532–550. [Google Scholar] [CrossRef]
- Cruz-Albarran, I.A.; Benitez-Rangel, J.P.; Osornio-Rios, R.A.; Morales-Hernandez, L.A. Human emotions detection based on a smart-thermal system of thermographic images. Infrared Phys. Technol. 2017, 81, 250–261. [Google Scholar] [CrossRef]
- Fernández-Cuevas, I.; Bouzas Marins, J.C.; Arnáiz Lastras, J.; Gómez Carmona, P.M.; Piñonosa Cano, S.; García-Concepción, M.Á.; Sillero-Quintana, M. Classification of factors influencing the use of infrared thermography in humans: A review. Infrared Phys. Technol. 2015, 71, 28–55. [Google Scholar] [CrossRef]
- Nummenmaa, L.; Glerean, E.; Hari, R.; Hietanen, J.K. Bodily maps of emotions. Proc. Natl. Acad. Sci. USA 2014, 111, 646–651. [Google Scholar] [CrossRef]
- Goulart, C.; Valadão, C.; Delisle-Rodriguez, D.; Caldeira, E.; Bastos, T. Emotion analysis in children through facial emissivity of infrared thermal imaging. PLoS ONE 2019, 14, e0212928. [Google Scholar] [CrossRef]
- Por, J.; Barriball, L.; Fitzpatrick, J.; Roberts, J. Emotional intelligence: Its relationship to stress, coping, well-being and professional performance in nursing students. Nurse Educ. Today 2011, 31, 855–860. [Google Scholar] [CrossRef] [PubMed]
- Kozlowski, D.; Hutchinson, M.; Hurley, J.; Rowley, J.; Sutherland, J. The role of emotion in clinical decision making: An integrative literature review. BMC Med. Educ. 2017, 17, 255. [Google Scholar] [CrossRef] [PubMed]
- Ioannou, S.; Morris, P.H.; Baker, M.; Reddy, V.; Gallese, V. Seeing a Blush on the Visible and Invisible Spectrum: A Functional Thermal Infrared Imaging Study. Front. Hum. Neurosci. 2017, 11, 525. [Google Scholar] [CrossRef] [PubMed]
- Centeno, C.; Robinson, C.; Noguera-Tejedor, A.; Arantzamendi, M.; Echarri, F.; Pereira, J. Palliative care and the arts: Vehicles to introduce medical students to patient-centred decision-making and the art of caring. BMC Med. Educ. 2017, 17, 257. [Google Scholar] [CrossRef]
- Herborn, K.A.; Graves, J.L.; Jerem, P.; Evans, N.P.; Nager, R.; McCafferty, D.J.; McKeegan, D.E.F. Skin temperature reveals the intensity of acute stress. Physiol. Behav. 2015, 152, 225–230. [Google Scholar] [CrossRef]
- Kosonogov, V.; De Zorzi, L.; Honoré, J.; Martínez-Velázquez, E.S.; Nandrino, J.-L.; Martinez-Selva, J.M.; Sequeira, H. Facial thermal variations: A new marker of emotional arousal. PLoS ONE 2017, 12, e0183592. [Google Scholar] [CrossRef]
- Aryal, A.; Becerik-Gerber, B. Skin temperature extraction using facial landmark detection and thermal imaging for comfort assessment. In Proceedings of the BuildSys 2019—Proceedings of the 6th ACM International Conference on Systems for Energy-Efficient Buildings, Cities, and Transportation, New York, NY, USA, 13–14 November 2019; Association for Computing Machinery, Inc.: New York, NY, USA, 2019; pp. 71–80. [Google Scholar]
- Li, D.; Menassa, C.C.; Kamat, V.R. Non-intrusive interpretation of human thermal comfort through analysis of facial infrared thermography. Energy Build. 2018, 176, 246–261. [Google Scholar] [CrossRef]
- Salazar-López, E.; Domínguez, E.; Juárez Ramos, V.; de la Fuente, J.; Meins, A.; Iborra, O.; Gálvez, G.; Rodríguez-Artacho, M.A.; Gómez-Milán, E. The mental and subjective skin: Emotion, empathy, feelings and thermography. Conscious. Cogn. 2015, 34, 149–162. [Google Scholar] [CrossRef]
- Koprowski, R.; Wilczyński, S.; Martowska, K.; Gołuch, D.; Wrocławska-Warchala, E. Dedicated tool to assess the impact of a rhetorical task on human body temperature. Int. J. Psychophysiol. 2017, 120, 69–77. [Google Scholar] [CrossRef]


| Video Stimulus | Music Stimulus | |||||
|---|---|---|---|---|---|---|
| February | March | |||||
| 1st sess. | 2nd sess. | 3rd sess. | 4th sess. | 5th sess. | 6th sess. | 7th sess. |
| Joy | Sadness | Happiness | Anger | Happiness | Sadness | Anger |
| Love | Fear | Joy | Fear | Love | ||
| Emotions | Temp/Humidity | Start Acclimatization | Start Stimulus | Final Stimulus | Final Period Response | |
|---|---|---|---|---|---|---|
| V I D E O | Joy | Temp (°C) | 20.4 | 20.6 | 20.7 | 21.0 |
| Humidity (%) | 36.8 | 36.8 | 36.2 | 35.8 | ||
| Sadness | Temp (°C) | 24.4 | 23.5 | 23.4 | 23.4 | |
| Humidity (%) | 31.8 | 31.8 | 32.3 | 32.5 | ||
| Love | Temp (°C) | 21.3 | 21.5 | 21.4 | 21.3 | |
| Humidity (%) | 34.1 | 34.0 | 34.1 | 34.4 | ||
| Happiness | Temp (°C) | 23.6 | 23.7 | 23.8 | 23.9 | |
| Humidity (%) | 26.1 | 26.1 | 26.4 | 26.4 | ||
| Fear | Temp (°C) | 21.9 | 21.8 | 21.7 | 21.5 | |
| Humidity (%) | 30.0 | 31.0 | 31.5 | 32.4 | ||
| Anger | Temp (°C) | 23.3 | 23.1 | 23.3 | 23.6 | |
| Humidity (%) | 29.4 | 32.1 | 30.8 | 30.7 | ||
| M U S I C | Joy | Temp (°C) | 19.3 | 19.4 | 19.4 | 19.3 |
| Humidity (%) | 31.9 | 32.2 | 32.5 | 33.0 | ||
| Sadness | Temp (°C) | 20.3 | 19.3 | 19.3 | 19.3 | |
| Humidity (%) | 33.8 | 36.4 | 37.0 | 37.2 | ||
| Love | Temp (°C) | 18.7 | 18.8 | 18.8 | 18.8 | |
| Humidity (%) | 41.3 | 41.6 | 41.8 | 42.2 | ||
| Happiness | Temp (°C) | 20.9 | 20.2 | 20.1 | 19.8 | |
| Humidity (%) | 29.6 | 31.3 | 31.6 | 32.3 | ||
| Fear | Temp (°C) | 19.4 | 19.4 | 19.5 | 19.4 | |
| Humidity (%) | 38.4 | 39.2 | 39.4 | 40.1 | ||
| Anger | Temp (°C) | 18.7 | 18.8 | 18.7 | 18.7 | |
| Humidity (%) | 38.4 | 39.7 | 39.3 | 40.1 |
| Date | Emotion | Number of Images | Stimulus Duration | ||
|---|---|---|---|---|---|
| Per Stimulus | Total | ||||
| V i d e o | 02.21.19 | Joy | 9 | 33 | 8′32″ |
| 02.26.19 | Sadness | 4 | 24 | 2′39″ | |
| 02.26.19 | Love | 7 | 27 | 5′23″ | |
| 02.27.19 | Happiness | 11 | 31 | 9′35″ | |
| 02.27.19 | Fear | 8 | 28 | 6′08″ | |
| 02.28.19 | Anger | 8 | 28 | 6′48″ | |
| M u s i c | 03.04.19 | Joy | 6 | 26 | 6′08″ |
| 03.04.19 | Happiness | 8 | 28 | 4′17″ | |
| 03.05.19 | Sadness | 5 | 25 | 3′21″ | |
| 03.05.19 | Fear | 5 | 25 | 3′35″ | |
| 03.06.19 | Anger | 6 | 26 | 4′45″ | |
| 03.06.19 | Love | 6 | 26 | 4′39″ | |
| Joy | Acclimatization | Video | Response | |||
|---|---|---|---|---|---|---|
| Start | Final | Start | Final | Start | Final | |
| Forehead | 34.5 | 34.5 | 34.7 | 35.0 | 35.0 | 35.0 |
| Nose | 34.0 | 33.3 | 33.6 | 33.7 | 33.5 | 34.2 |
| Right skin on cheek | 34.4 | 34.2 | 34.3 | 34.8 | 34.6 | 34.3 |
| Left skin on cheek | 34.0 | 34.1 | 34.3 | 34.7 | 34.6 | 34.3 |
| Sadness | Acclimatization | Video | Response | |||
| Start | Final | Start | Final | Start | Final | |
| Forehead | 35.0 | 35.1 | 34.9 | 35.5 | 35.0. | 34.8 |
| Nose | 34.4 | 34.9 | 34.7 | 35.3 | 34.9 | 34.5 |
| Right skin on cheek | 34.2 | 34.8 | 34.4 | 35.0 | 34.8 | 34.3 |
| Left skin on cheek | 34.4 | 34.7 | 34.6 | 35.0 | 34.7 | 34.7 |
| Love | Acclimatization | Video | Response | |||
| Start | Final | Start | Final | Start | Final | |
| Forehead | 35.0 | 34.7 | 34.5 | 34.8 | 34.4 | 34.2 |
| Nose | 32.9 | 34.3 | 34.2 | 34.5 | 33.8 | 33.4 |
| Right skin on cheek | 33.3 | 33.6 | 33.4 | 33.9 | 33.3 | 33.6 |
| Left skin on cheek | 33.0 | 33.2 | 32.8 | 33.3 | 32.7 | 32.9 |
| Happiness | Acclimatization | Video | Response | |||
| Start | Final | Start | Final | Start | Final | |
| Forehead | 35.1 | 34.8 | 34.9 | 35.0 | 35.0 | 35.1 |
| Nose | 33.6 | 33.6 | 33.7 | 32.4 | 32.6 | 33.6 |
| Right skin on cheek | 33.9 | 34.3 | 34.4 | 32.4 | 34.4 | 34.8 |
| Left skin on cheek | 33.9 | 34.4 | 34.5 | 34.6 | 34.7 | 34.8 |
| Fear | Acclimatization | Video | Response | |||
| Start | Final | Start | Final | Start | Final | |
| Forehead | 36.5 | 34.7 | 34.6 | 34.6 | 34.3 | 34.7 |
| Nose | 34.7 | 34.3 | 34.2 | 34.0 | 33.6 | 34.0 |
| Right skin on cheek | 34.7 | 34.0 | 33.9 | 34.3 | 33.8 | 34.3 |
| Left skin on cheek | 34.4 | 34.1 | 34.0 | 34.0 | 33.6 | 33.9 |
| Anger | Acclimatization | Video | Response | |||
| Start | Final | Start | Final | Start | Final | |
| Forehead | 36.1 | 35.1 | 35.0 | 35.0 | 34.8 | 35.0 |
| Nose | 36.2 | 35.3 | 35.2 | 35.3 | 34.8 | 35.2 |
| Right skin on cheek | 35.5 | 34.6 | 34.7 | 34.7 | 34.5 | 34.8 |
| Left skin on cheek | 35.9 | 35.1 | 34.9 | 34.9 | 34.6 | 35.0 |
| Happiness | Acclimatization | Music | Response | |||
|---|---|---|---|---|---|---|
| Start | Final | Start | Final | Start | Final | |
| Forehead | 34.6 | 34.2 | 33.4 | 33.9 | 33.2 | 33.4 |
| Nose | 30.6 | 30.4 | 30.1 | 29.3 | 28.4 | 29.0 |
| Right skin on cheek | 32.0 | 31.6 | 31.4 | 32.3 | 31.7 | 31.9 |
| Left skin on cheek | 31.8 | 31.2 | 31.4 | 31.7 | 31.2 | 30.9 |
| Joy | Acclimatization | Music | Response | |||
| Start | Final | Start | Final | Start | Final | |
| Forehead | 34.0 | 34.0 | 33.9 | 34.0 | 34.0 | 33.9 |
| Nose | 27.4 | 27.6 | 28.3 | 28.7 | 28.3 | 29.7 |
| Right skin on cheek | 30.7 | 30.5 | 31.1 | 31.4 | 31.7 | 31.3 |
| Left skin on cheek | 31.0 | 30.2 | 30.7 | 31.0 | 31.4 | 31.3 |
| Sadness | Acclimatization | Music | Response | |||
| Start | Final | Start | Final | Start | Final | |
| Forehead | 34.1 | 33.9 | 33.7 | 34.0 | 34.2 | 33.7 |
| Nose | 29.4 | 30.9 | 30.2 | 31.3 | 32.0 | 31.0 |
| Right skin on cheek | 32.5 | 32.5 | 32.4 | 33.0 | 33.1 | 32.5 |
| Left skin on cheek | 32.1 | 32.0 | 32.1 | 32.5 | 32.8 | 32.5 |
| Fear | Acclimatization | Music | Response | |||
| Start | Final | Start | Final | Start | Final | |
| Forehead | 34.3 | 34.2 | 33.9 | 34.1 | 33.4 | 34.2 |
| Nose | 28.7 | 29.1 | 28.8 | 28.9 | 29.3 | 30.0 |
| Right skin on cheek | 31.4 | 31.2 | 31.2 | 31.5 | 31.2 | 32.1 |
| Left skin on cheek | 31.4 | 31.3 | 31.2 | 31.2 | 30.5 | 31.9 |
| Anger | Acclimatization | Music | Response | |||
| Start | Final | Start | Final | Start | Final | |
| Forehead | 33.8 | 33.8 | 33.6 | 33.4 | 33.4 | 33.8 |
| Nose | 29.3 | 30.5 | 30.7 | 28.5 | 29.4 | 29.8 |
| Right skin on cheek | 31.6 | 32.0 | 31.7 | 32.0 | 31.9 | 32.4 |
| Left skin on cheek | 31.4 | 32.1 | 31.6 | 31.5 | 31.4 | 32.1 |
| Love | Acclimatization | Music | Response | |||
| Start | Final | Start | Final | Start | Final | |
| Forehead | 34.7 | 34.1 | 34.3 | 34.2 | 34.2 | 33.3 |
| Nose | 29.7 | 30.0 | 30.1 | 30.7 | 30.9 | 29.8 |
| Right skin on cheek | 33.2 | 33.1 | 33.3 | 33.6 | 33.2 | 32.1 |
| Left skin on cheek | 33.5 | 33.2 | 33.2 | 33.3 | 33.3 | 32.3 |
| Temperature | |||
|---|---|---|---|
| Video | Music | ||
| Love | Acclimatization | Increase and decrease | Decrease |
| Stimulus | Increase | Increase | |
| Response | Decrease | Decrease | |
| Average Graph | Increase and decrease, increase in stimulus | Increase | |
| Happiness | Acclimatization | Increase and decrease | Decrease |
| Stimulus | Decrease | Increase | |
| Response | Increase | Increase and decrease | |
| Average Graph | Decrease in stimulation: nose, right skin on cheek Increase in stimulation: forehead, left skin on cheek | Decreases in stimulus in the nose, slight increase in the rest | |
| Fear | Acclimatization | Decrease | Decrease |
| Stimulus | Increase | Increase | |
| Response | Increase | Increase | |
| Average Graph | Decrease, increase during stimulus | Slight and gradual increase | |
| Anger | Acclimatization | Decrease | Increase |
| Stimulus | Decrease and increase | Decrease | |
| Response | Increase | Increase | |
| Average Graph | Increase in stimulus | Slight decrease in stimulus | |
| Joy | Acclimatization | Decrease and increase | Decrease |
| Stimulus | Increase | Increase | |
| Response | Increase | Increase | |
| Average Graph | Acute increase in stimulus | Increase | |
| Sadness | Acclimatization | Increase | Decrease and increase |
| Stimulus | Increase | Increase | |
| Response | Decrease | Decrease | |
| Average Graph | Decrease and increase | Decrease and increase | |
© 2020 by the authors. Licensee MDPI, Basel, Switzerland. This article is an open access article distributed under the terms and conditions of the Creative Commons Attribution (CC BY) license (http://creativecommons.org/licenses/by/4.0/).
Share and Cite
Marqués-Sánchez, P.; Liébana-Presa, C.; Benítez-Andrades, J.A.; Gundín-Gallego, R.; Álvarez-Barrio, L.; Rodríguez-Gonzálvez, P. Thermal Infrared Imaging to Evaluate Emotional Competences in Nursing Students: A First Approach through a Case Study. Sensors 2020, 20, 2502. https://doi.org/10.3390/s20092502
Marqués-Sánchez P, Liébana-Presa C, Benítez-Andrades JA, Gundín-Gallego R, Álvarez-Barrio L, Rodríguez-Gonzálvez P. Thermal Infrared Imaging to Evaluate Emotional Competences in Nursing Students: A First Approach through a Case Study. Sensors. 2020; 20(9):2502. https://doi.org/10.3390/s20092502
Chicago/Turabian StyleMarqués-Sánchez, Pilar, Cristina Liébana-Presa, José Alberto Benítez-Andrades, Raquel Gundín-Gallego, Lorena Álvarez-Barrio, and Pablo Rodríguez-Gonzálvez. 2020. "Thermal Infrared Imaging to Evaluate Emotional Competences in Nursing Students: A First Approach through a Case Study" Sensors 20, no. 9: 2502. https://doi.org/10.3390/s20092502
APA StyleMarqués-Sánchez, P., Liébana-Presa, C., Benítez-Andrades, J. A., Gundín-Gallego, R., Álvarez-Barrio, L., & Rodríguez-Gonzálvez, P. (2020). Thermal Infrared Imaging to Evaluate Emotional Competences in Nursing Students: A First Approach through a Case Study. Sensors, 20(9), 2502. https://doi.org/10.3390/s20092502