An End-to-End Reliability Framework of the Internet of Things


Abstract
1. Introduction
- First, we introduce an IoT network-based architecture. Although, several architecture proposals have been developed. They are mainly emerging from competing companies that may have an antagonist or restricted vision. Our IoT architecture proposal is resilient to such influences.
- We apply the RBD to our proposed architecture. Although reliability assessment tools such as RBD have been used in many engineering disciplines, their usage in the IoT field is still moderate. The novelty in this approach resides in extending the RBD paradigm for assessing the reliability of any component of the proposed architecture independently its architectural level and nature (software, hardware, etc.). This conceptual contribution can be useful in the design stage. We model in depth each layer of the proposed architecture. We quantify each proposed layer model by an equation or sets of equations that allow us to assess reliability for each of the architectural layers.
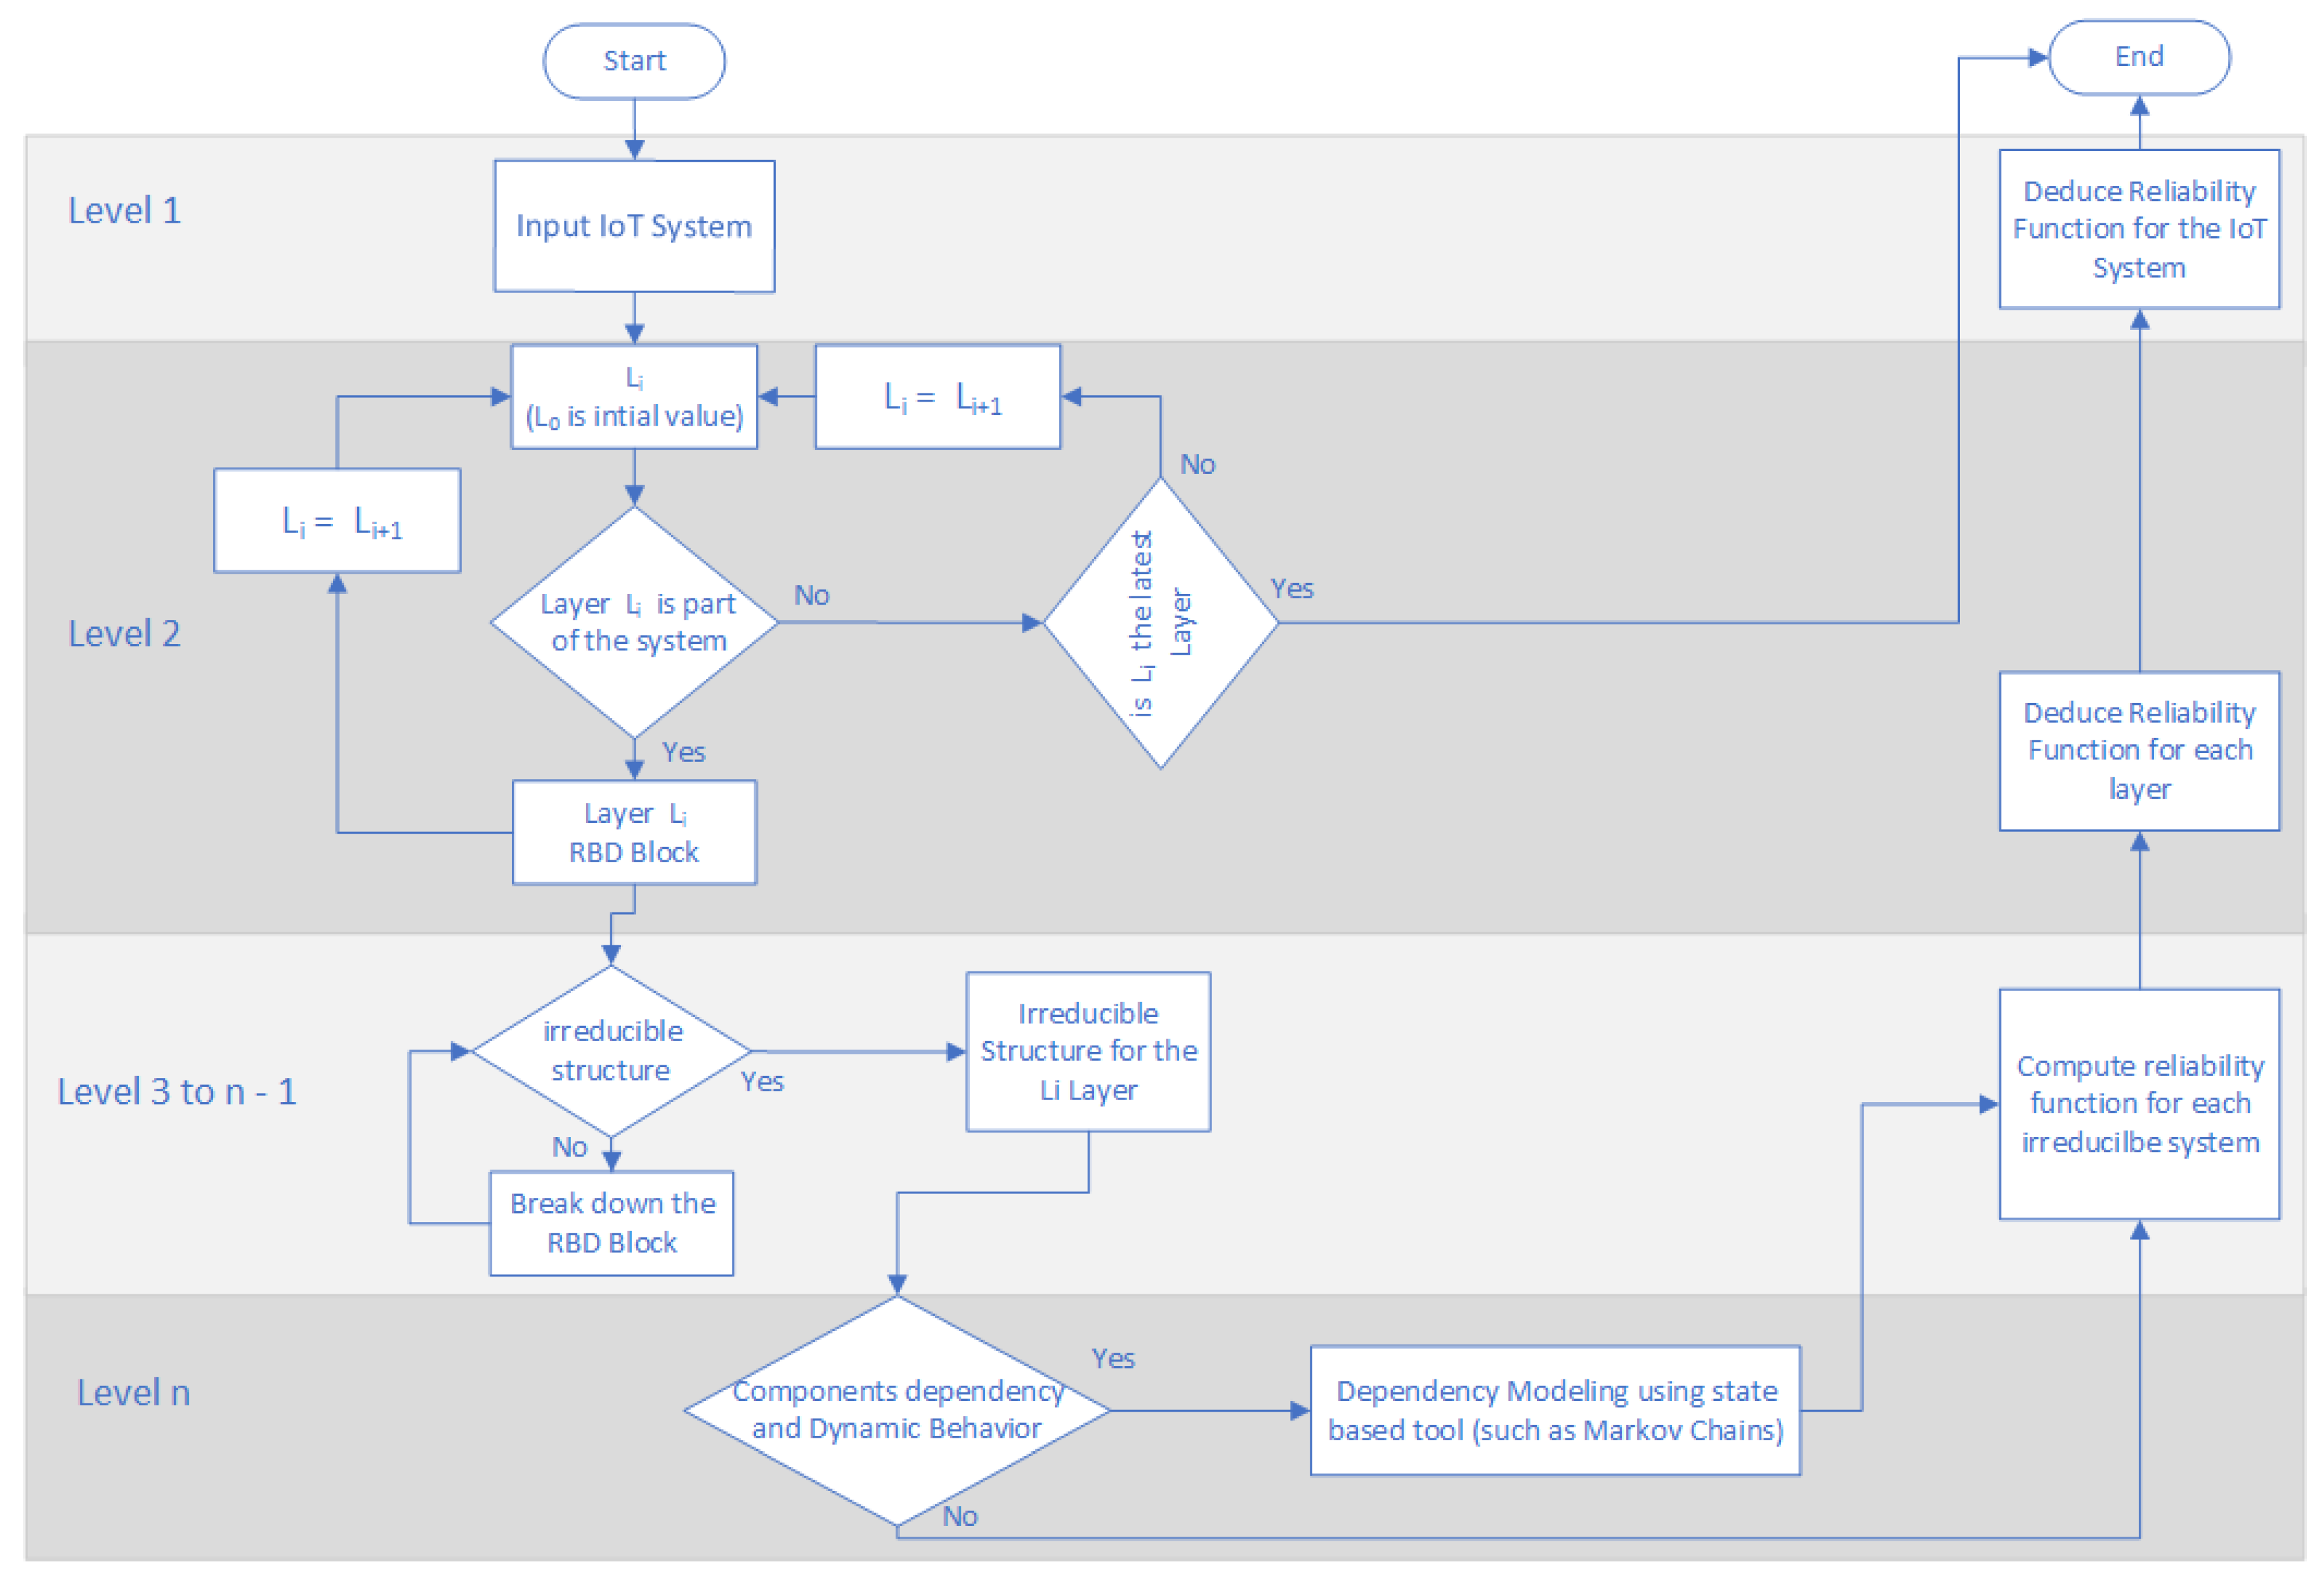
- To ease the deployment of the proposed reliability modeling we suggest a flow chart to use the proposed framework. The proposed modeling flow chart highlights the facts that the introduced framework can incubate most of reliability assessment techniques, and that is hierarchical by nature. Thus, our proposed framework does not suffer from the curse of dimensionality associated to state based techniques such as in Markov Chains paradigm.
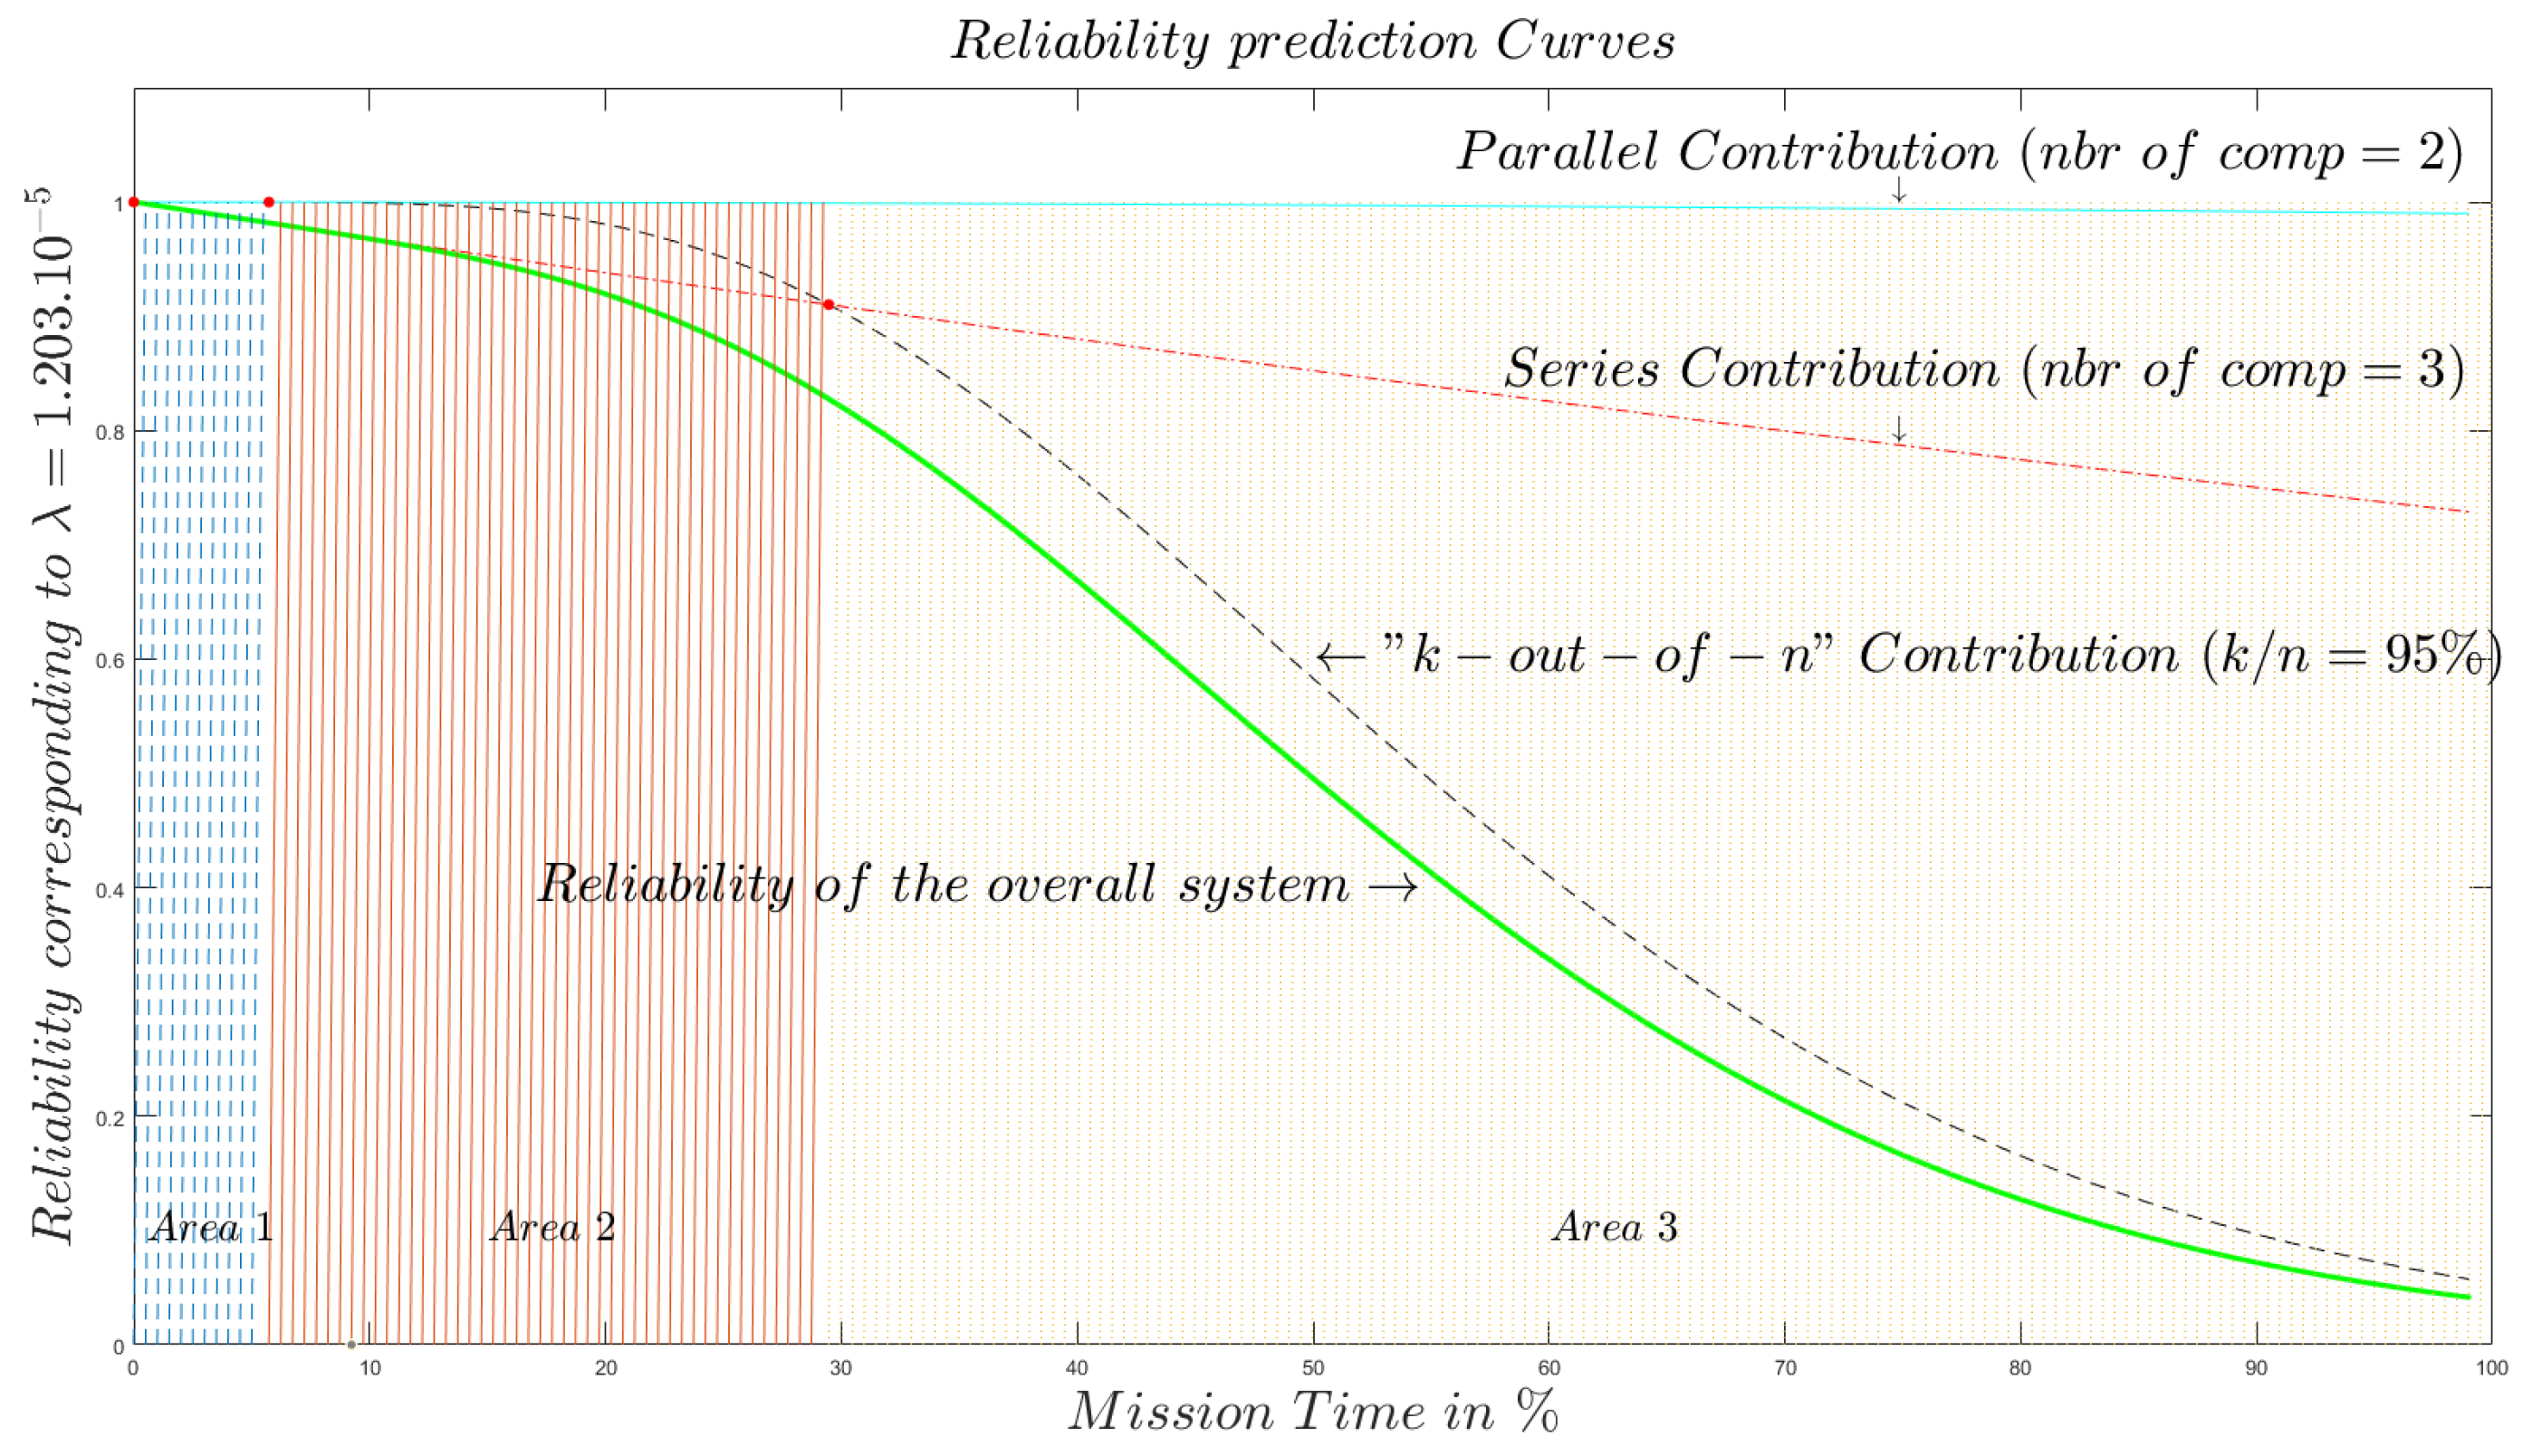
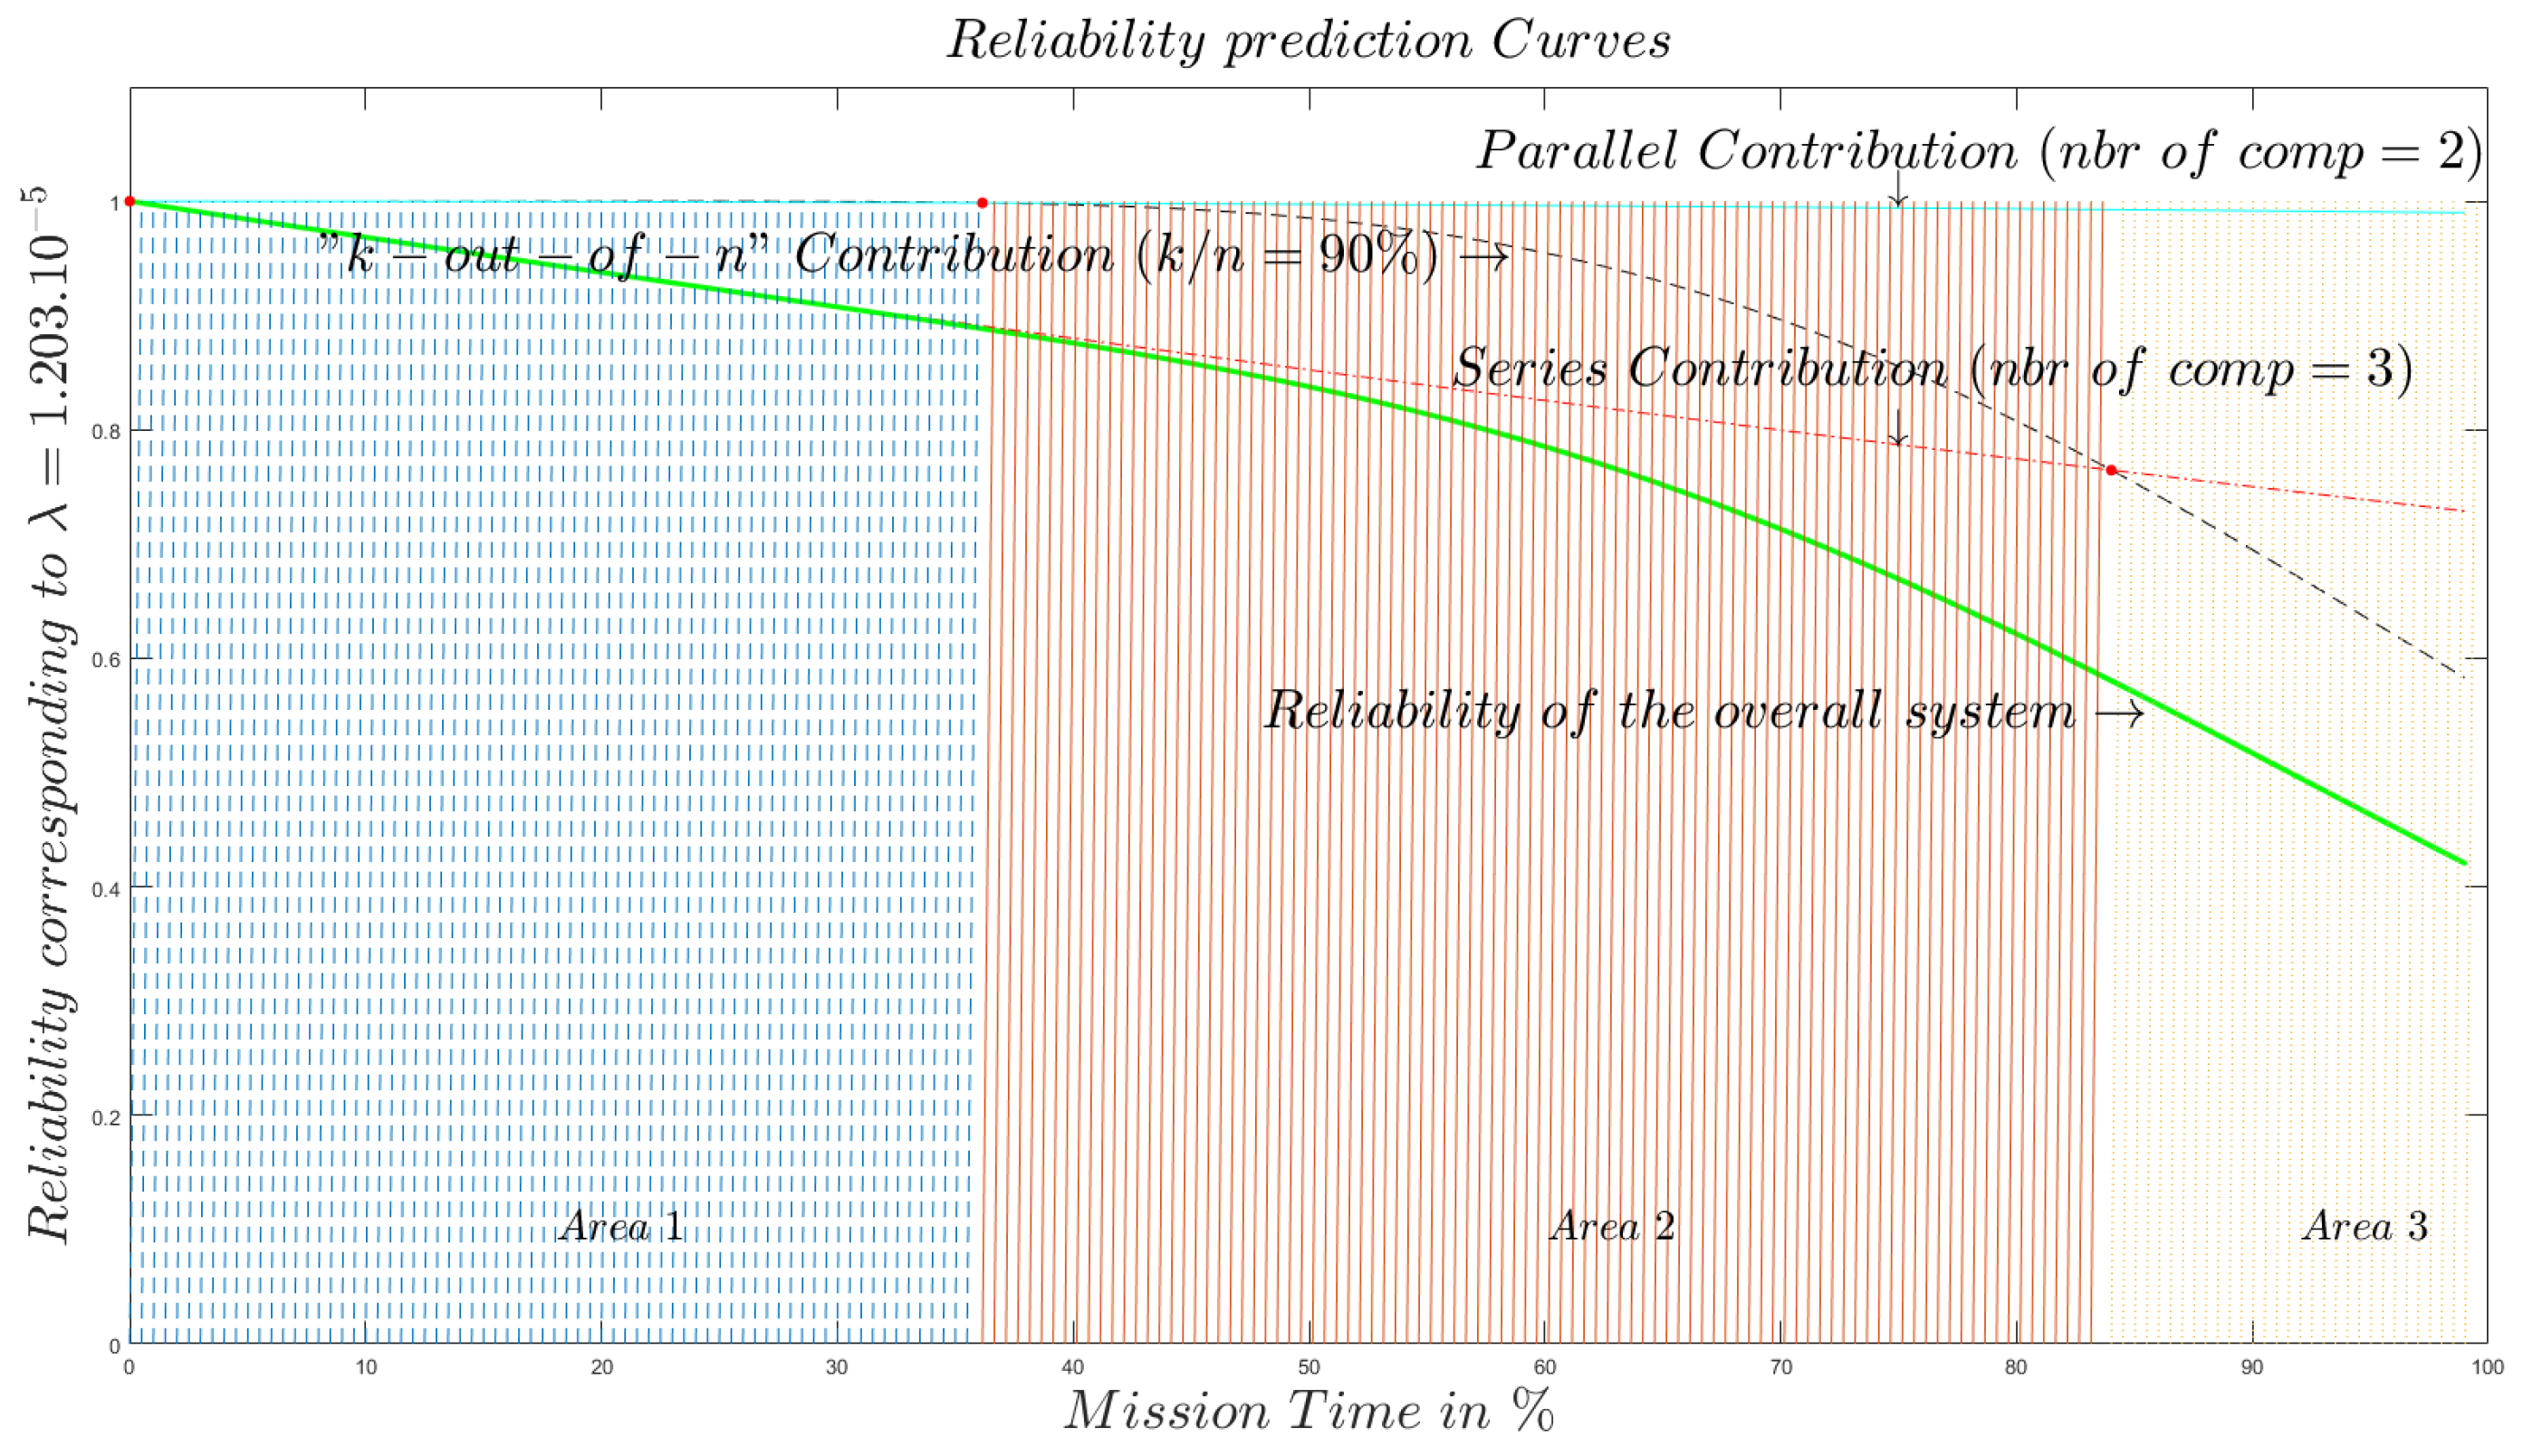
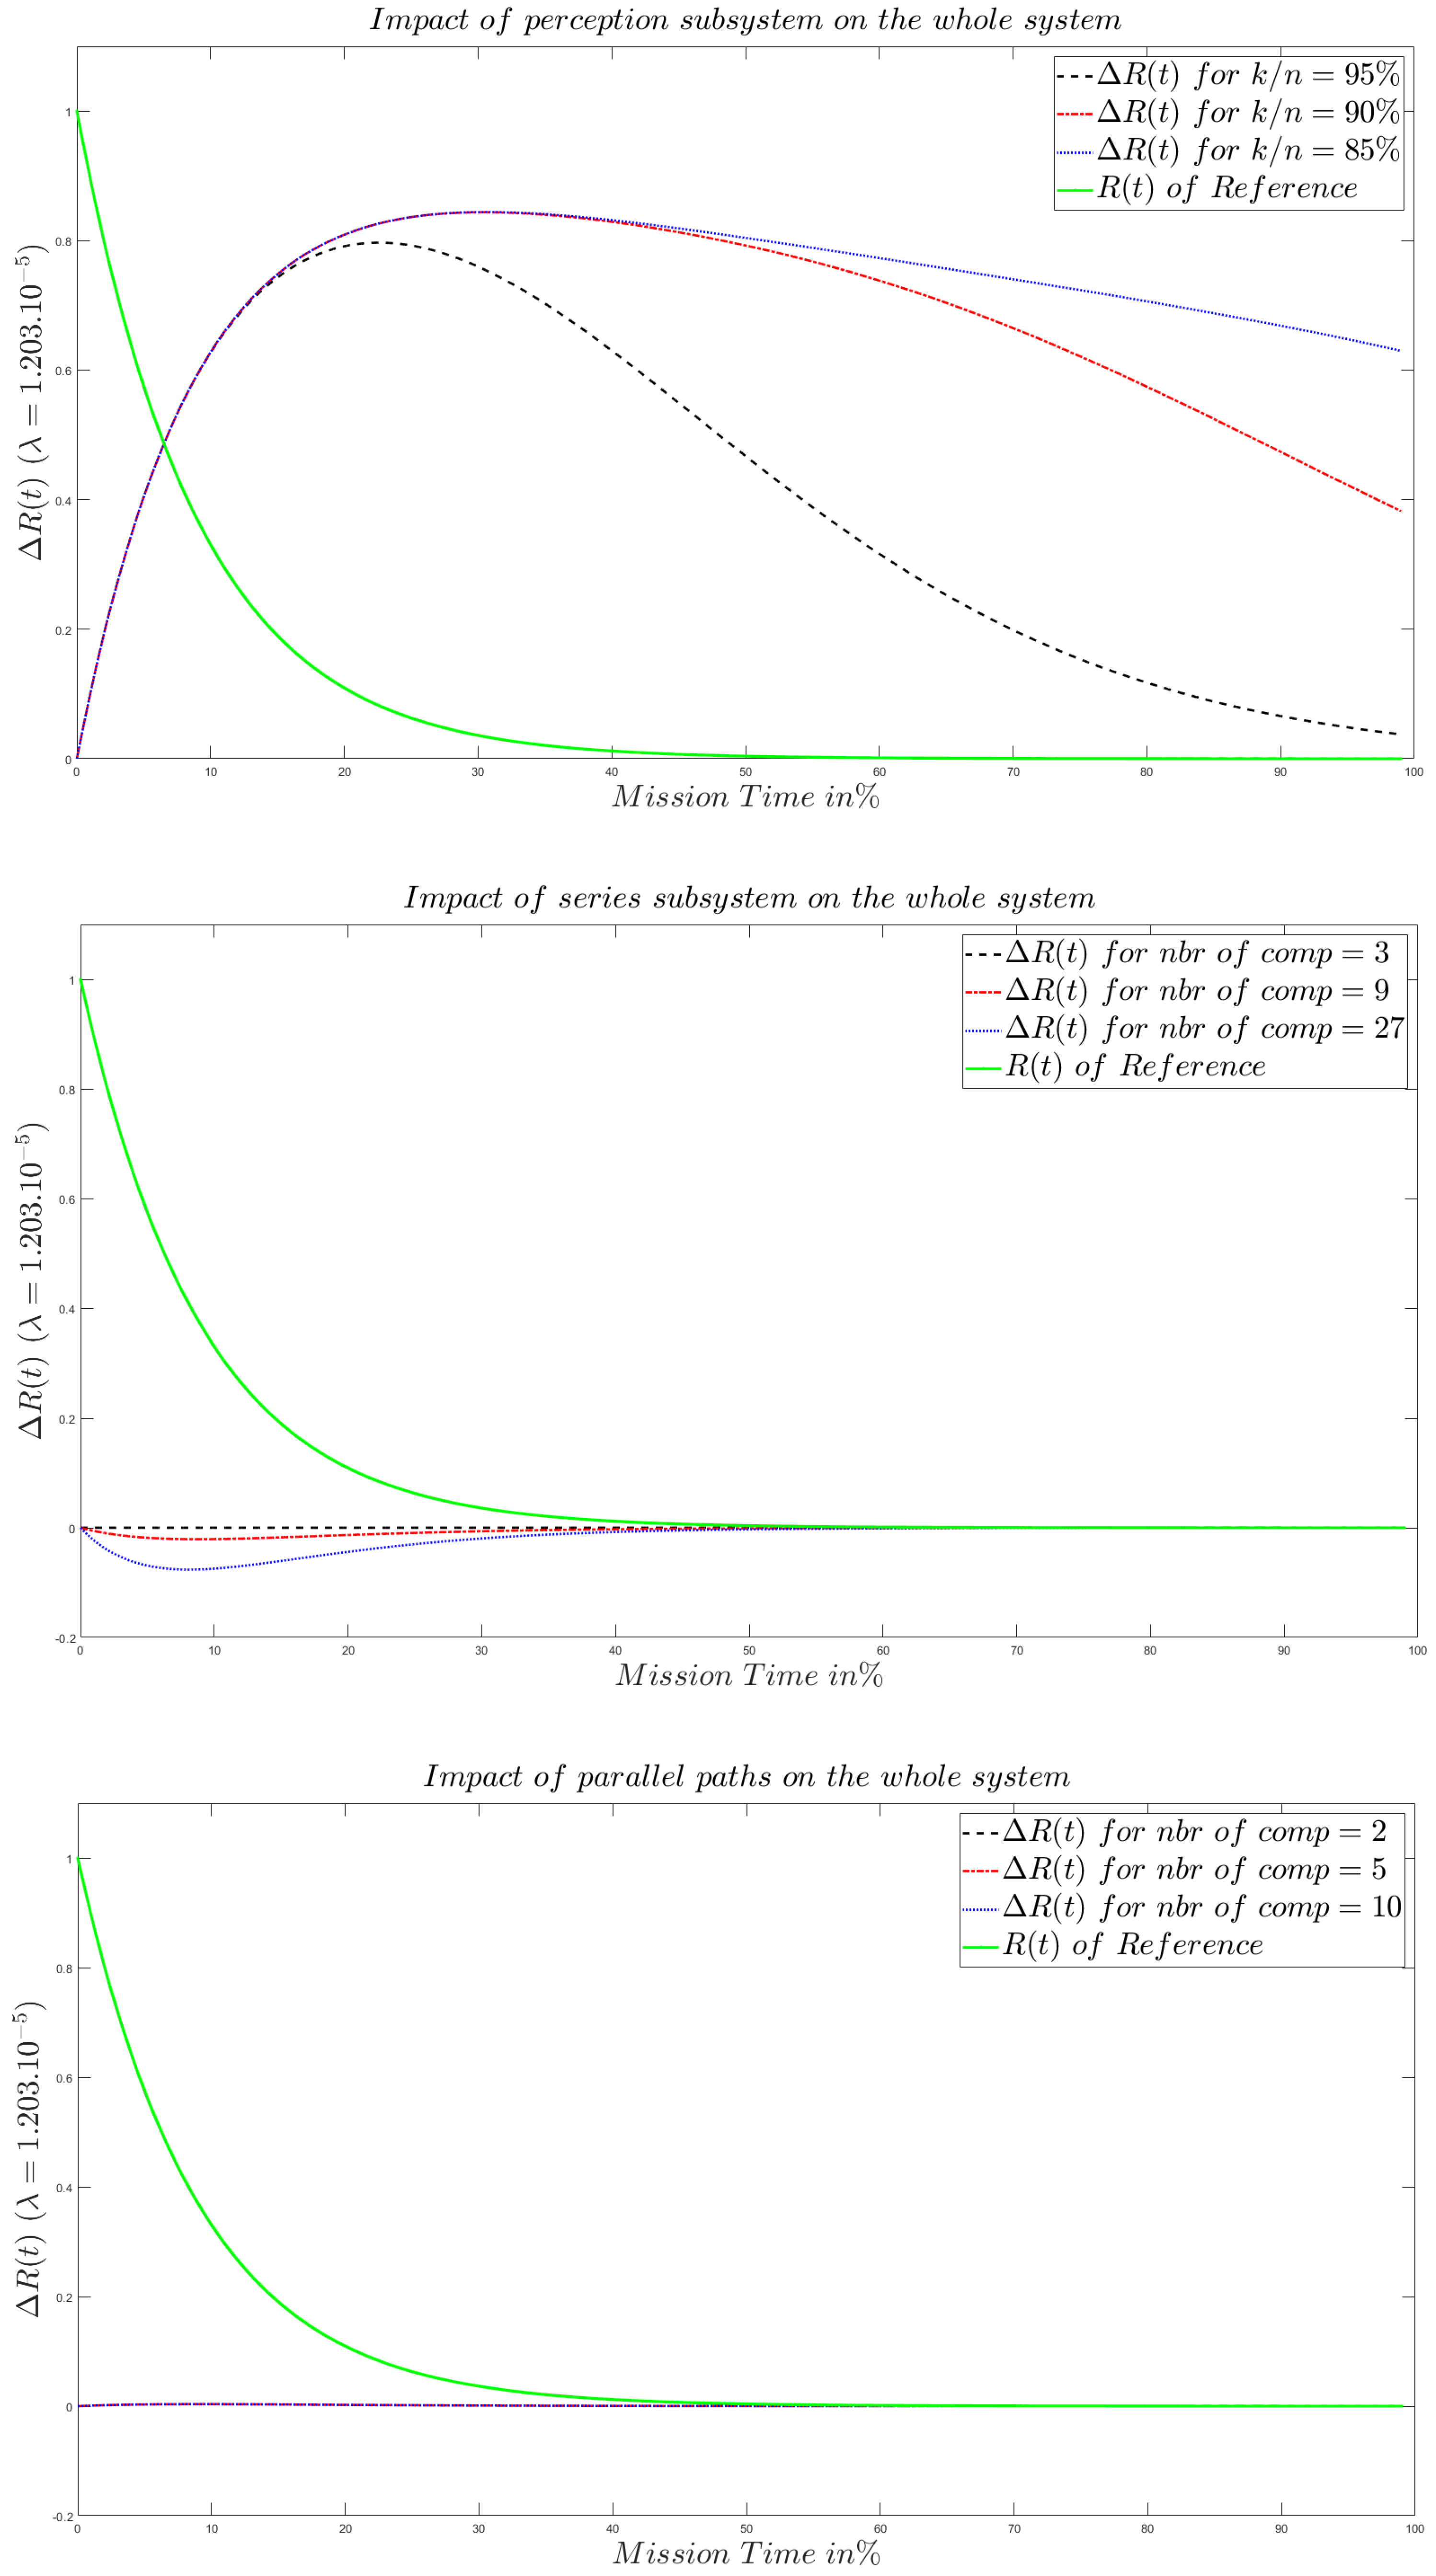
- At the end, we propose simplified scenarios for numerical investigation of the proposed framework. The numerical study, reveal remarkable mission time intervals which characterize the behavior of an IoT system from the point of view of its reliability.
2. Related Work
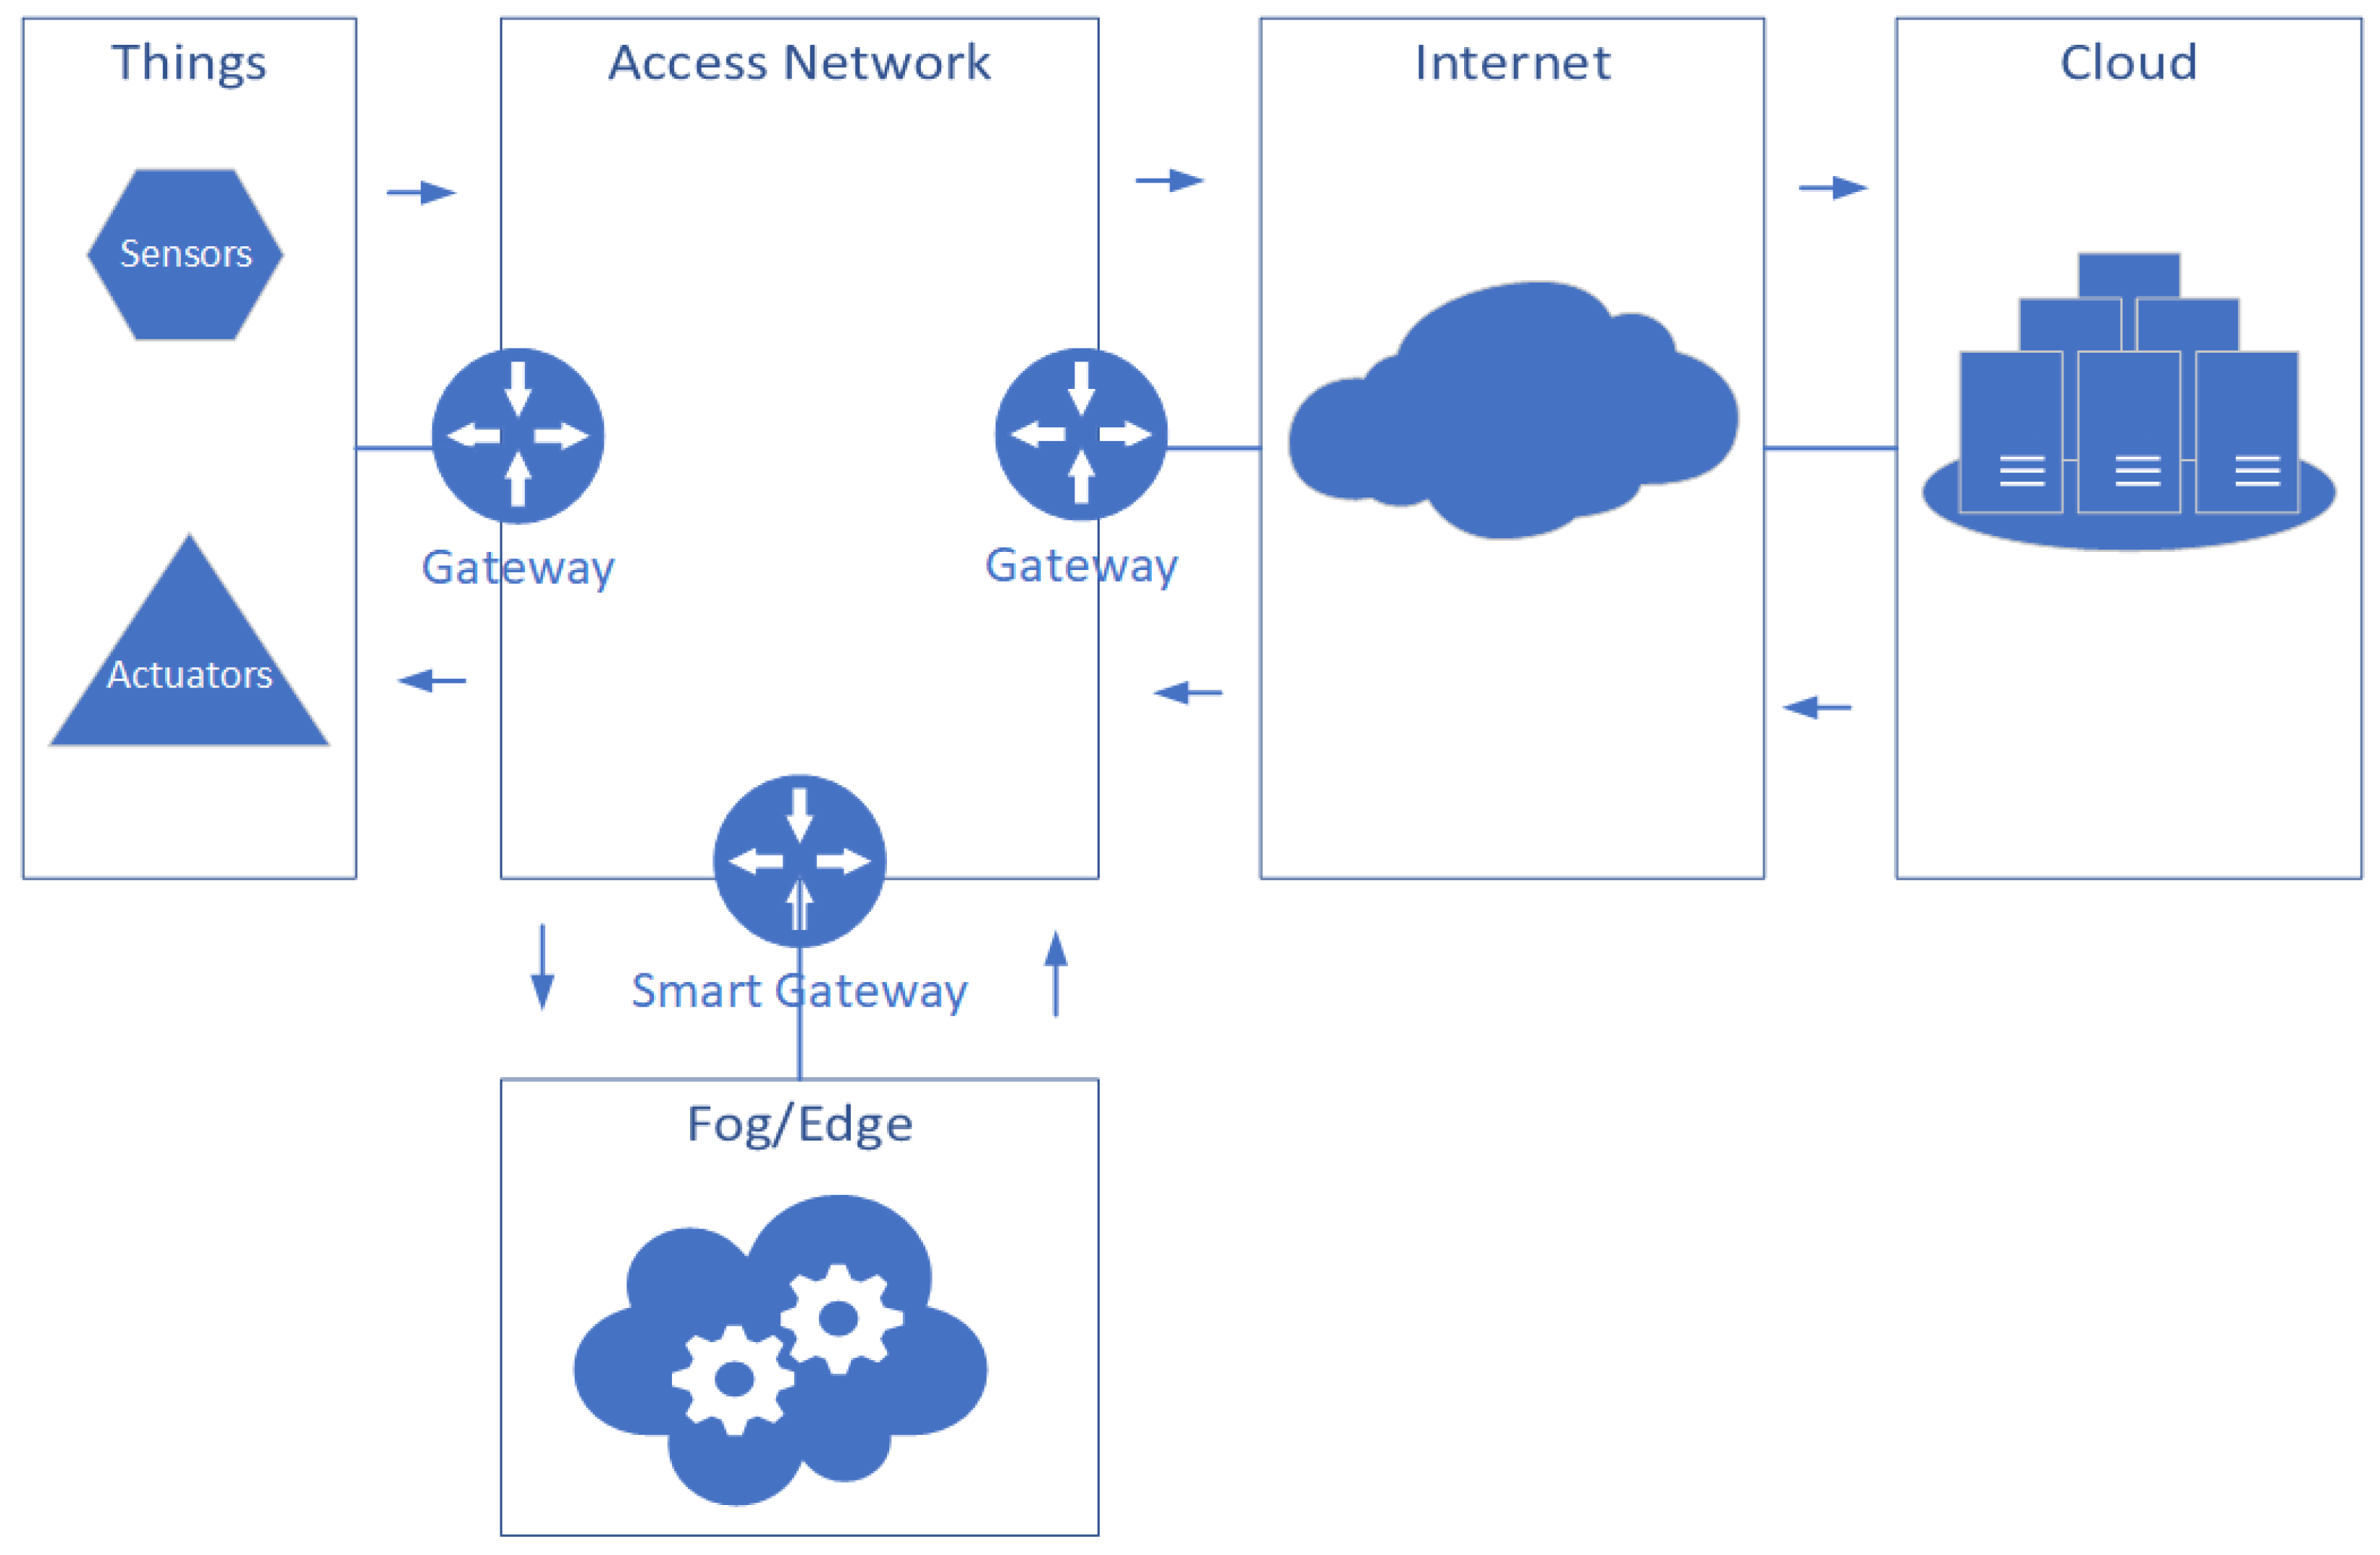
3. IoT Ecosystem
4. System Model
4.1. Reliability Theory Background
4.1.1. Structure Function and Reliability Measures
4.1.2. Series Structure
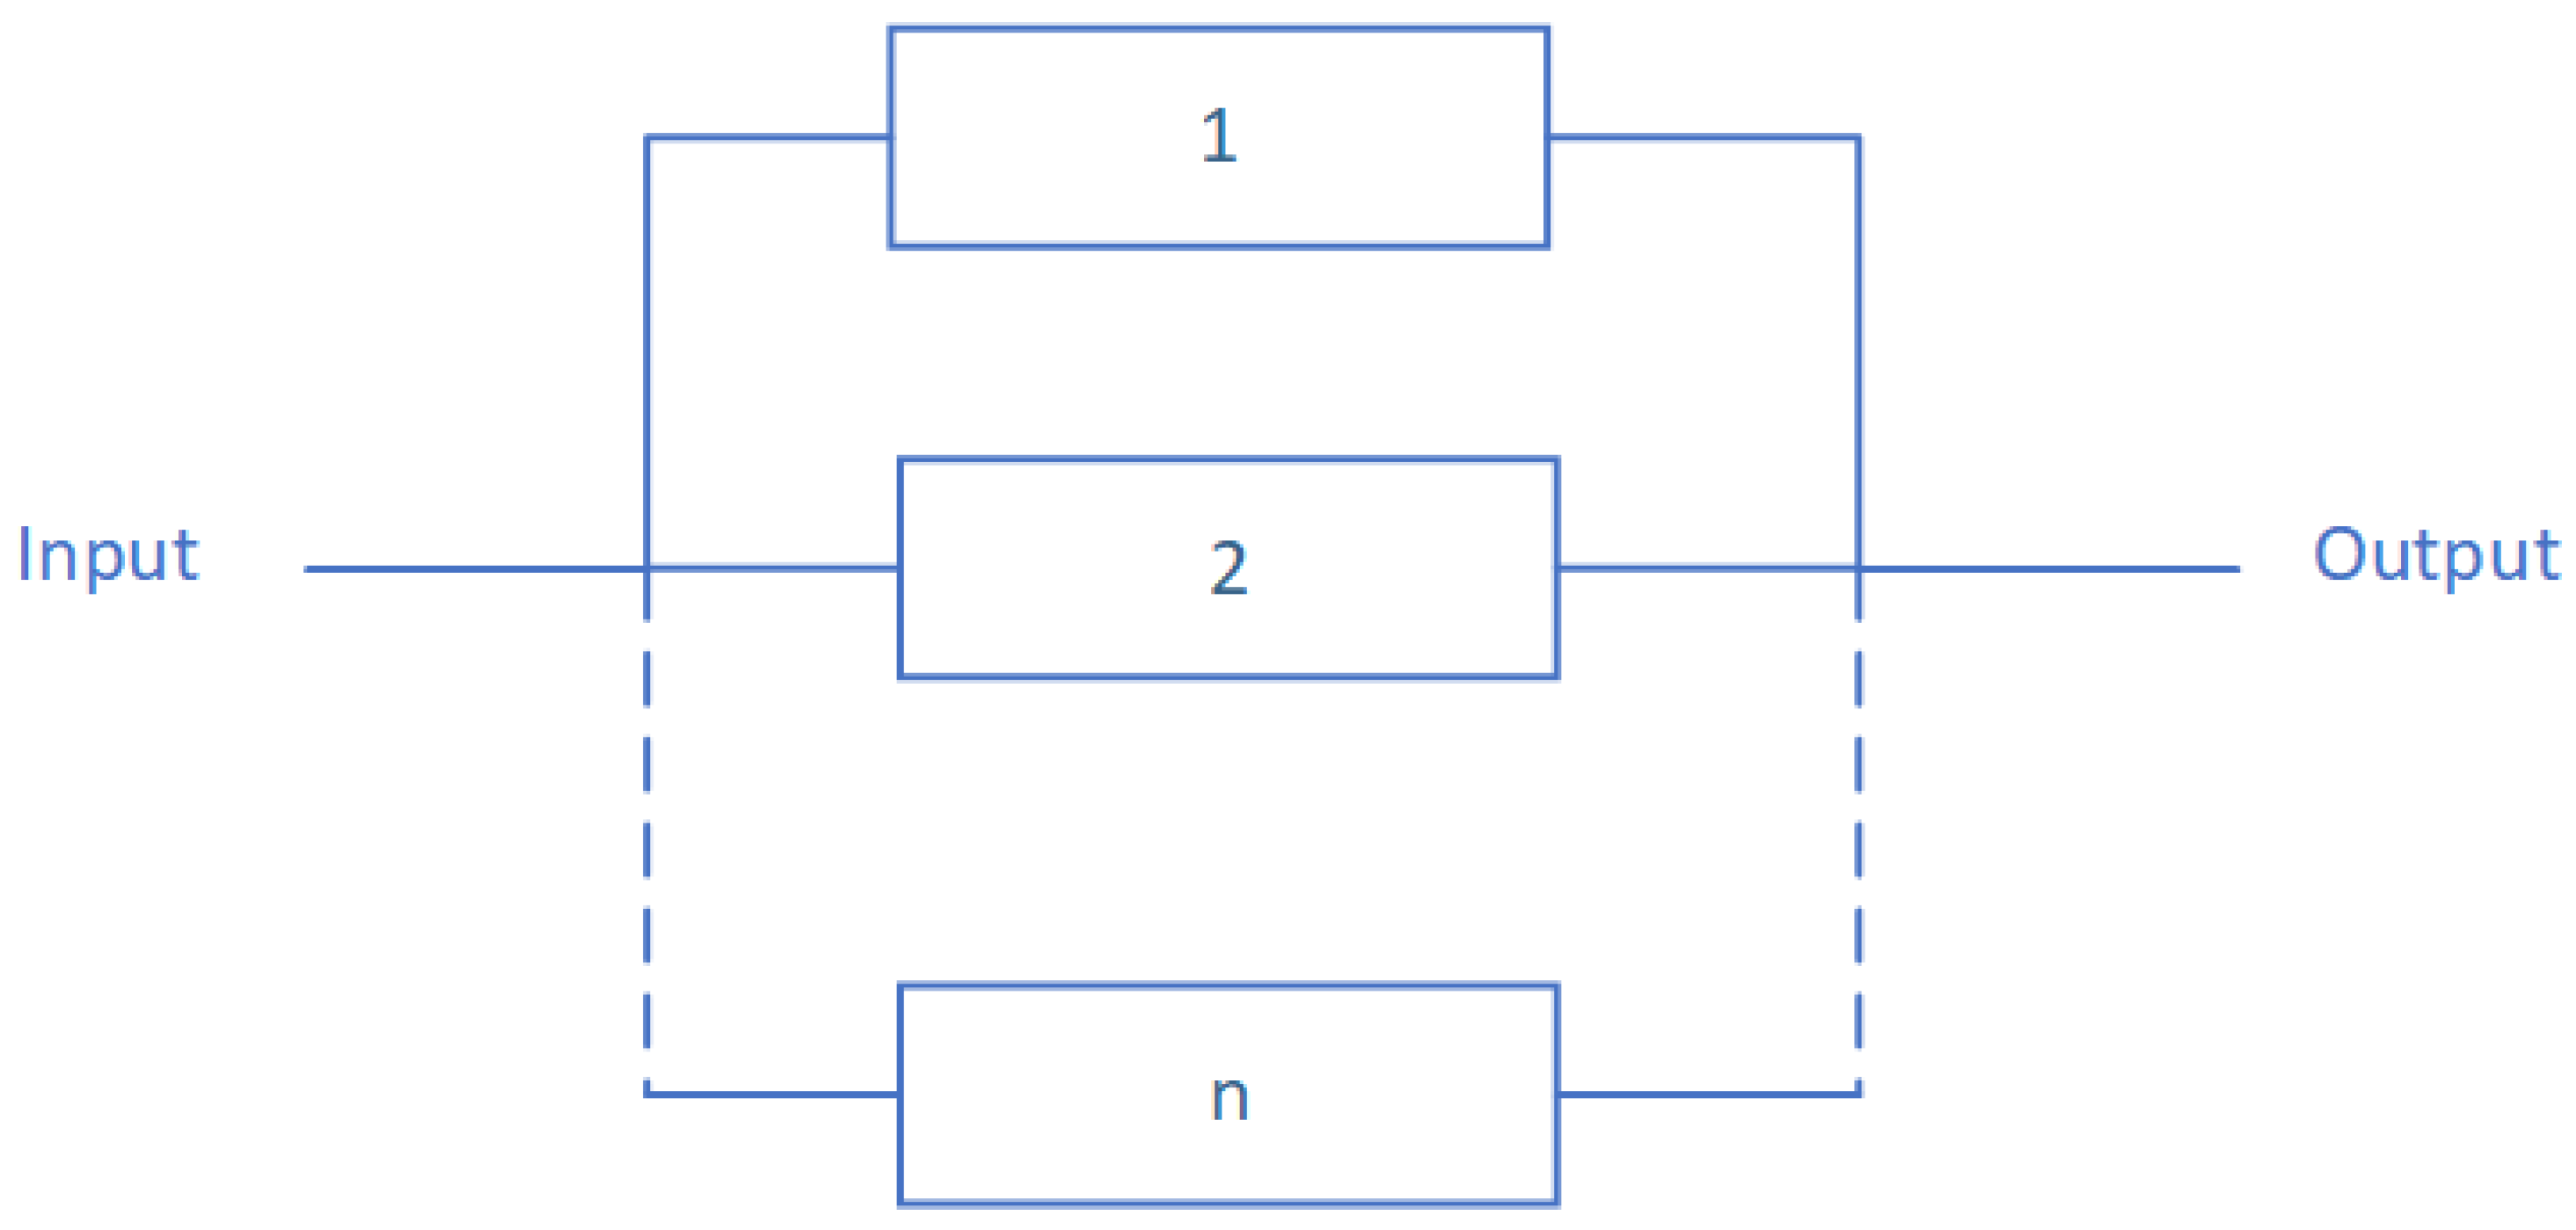
4.1.3. Parallel Structure
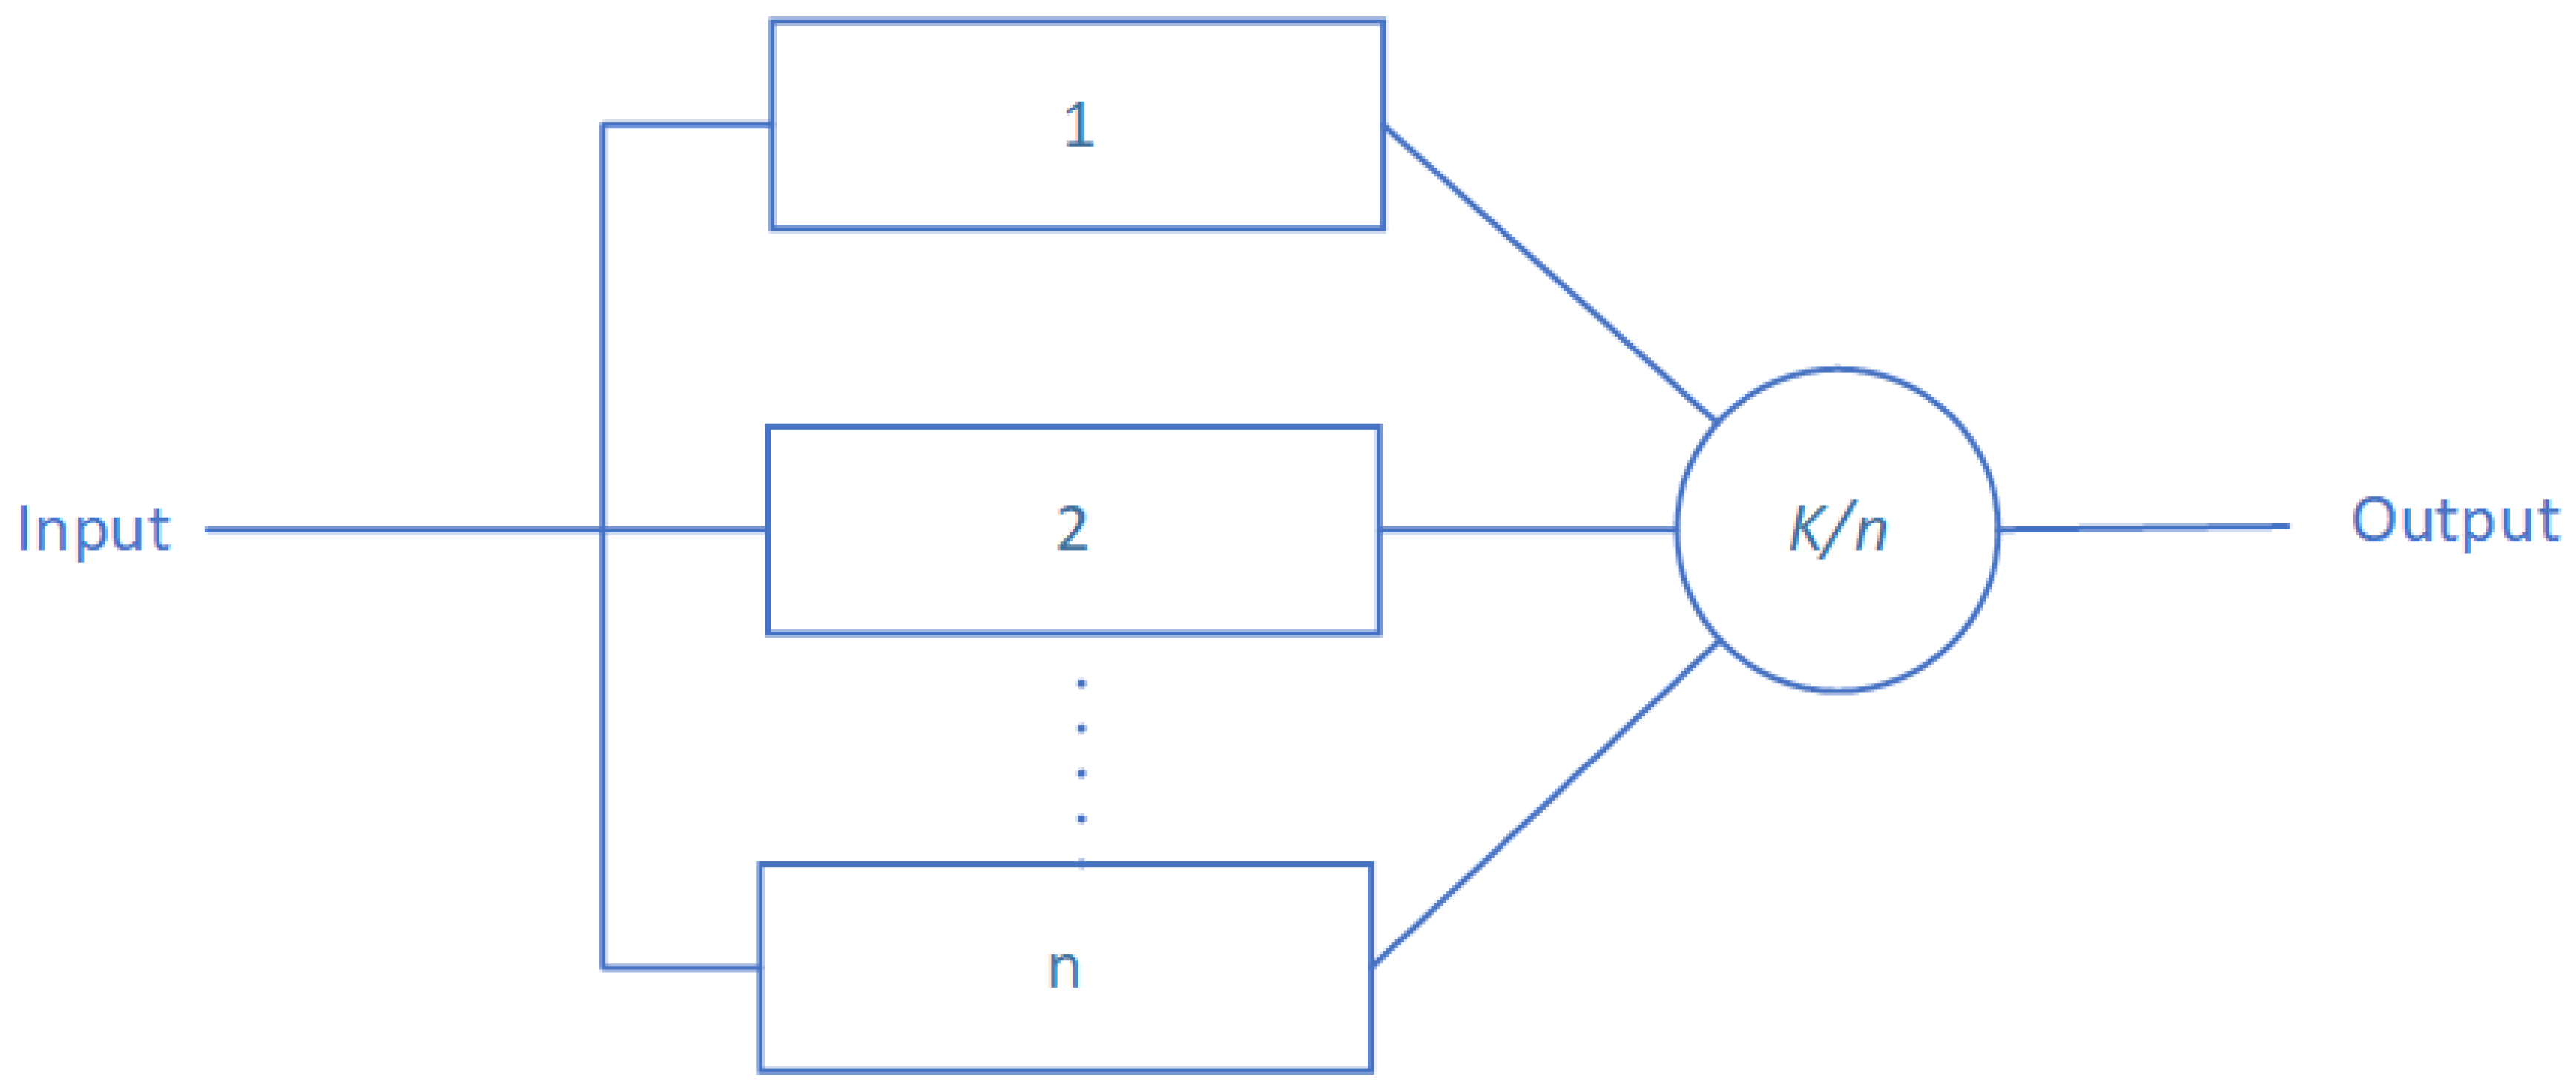
4.1.4. k-out-of-n Structure
4.2. IoT Stack as Reliability Graph
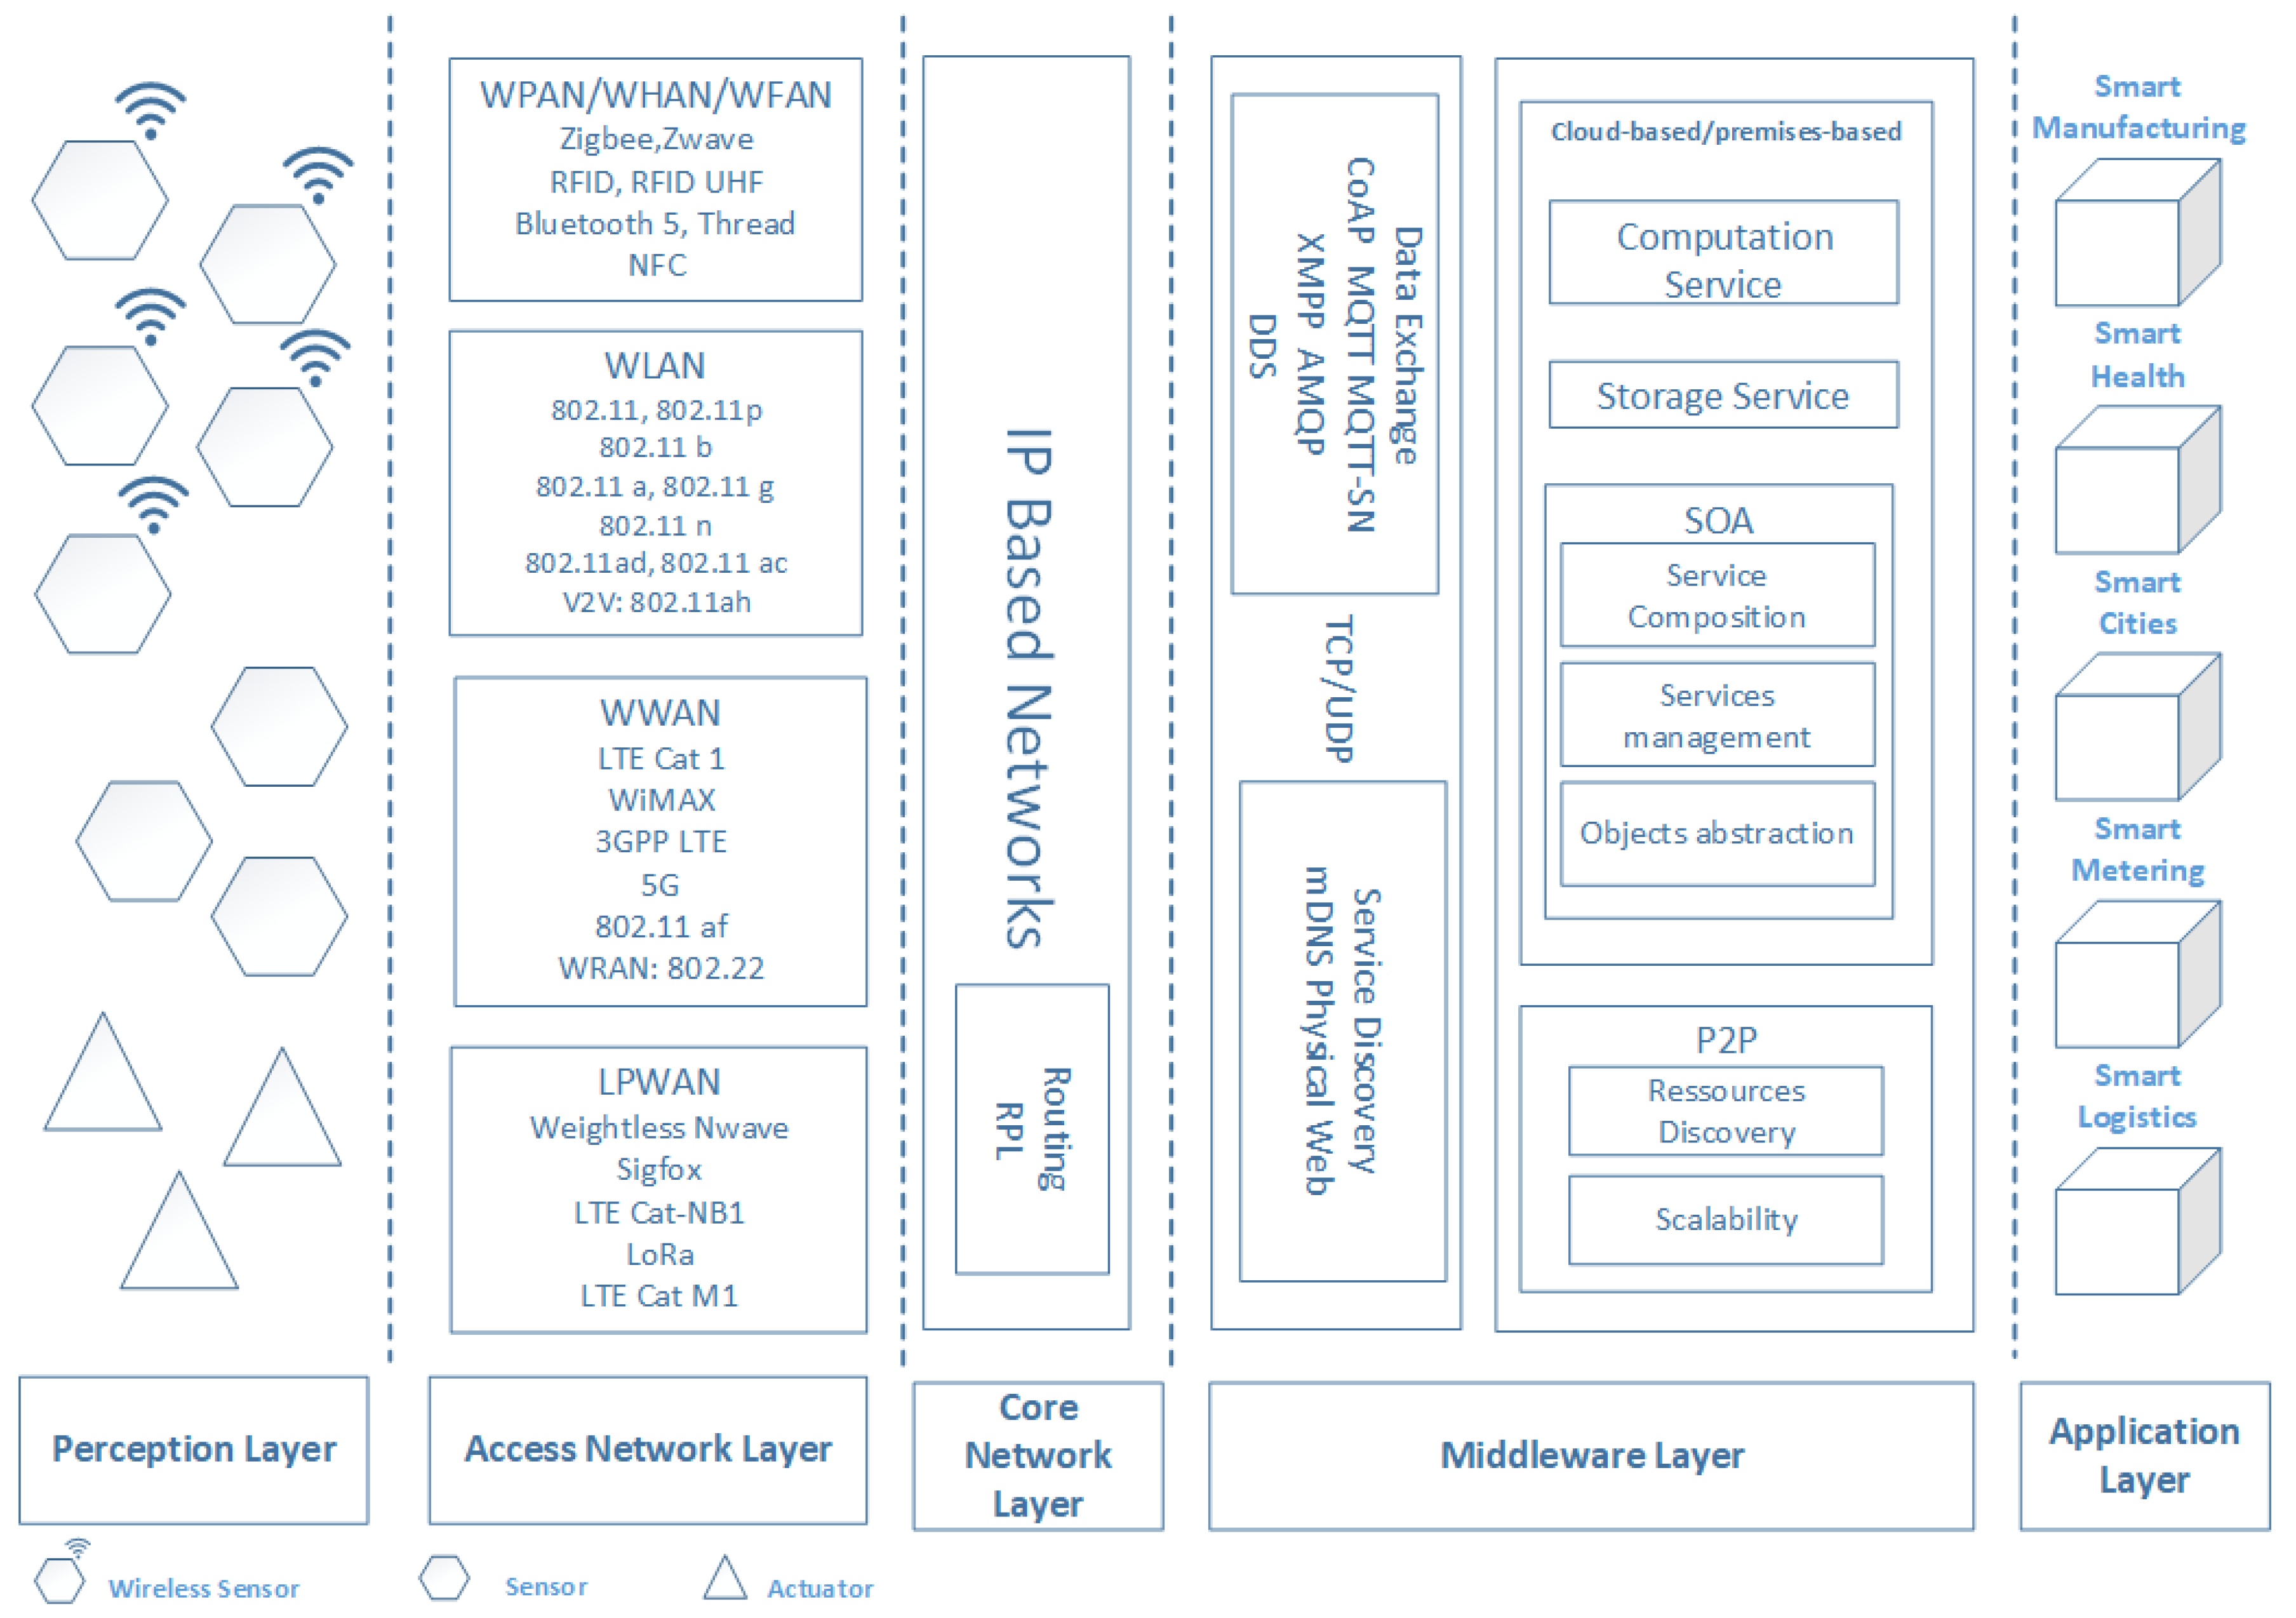
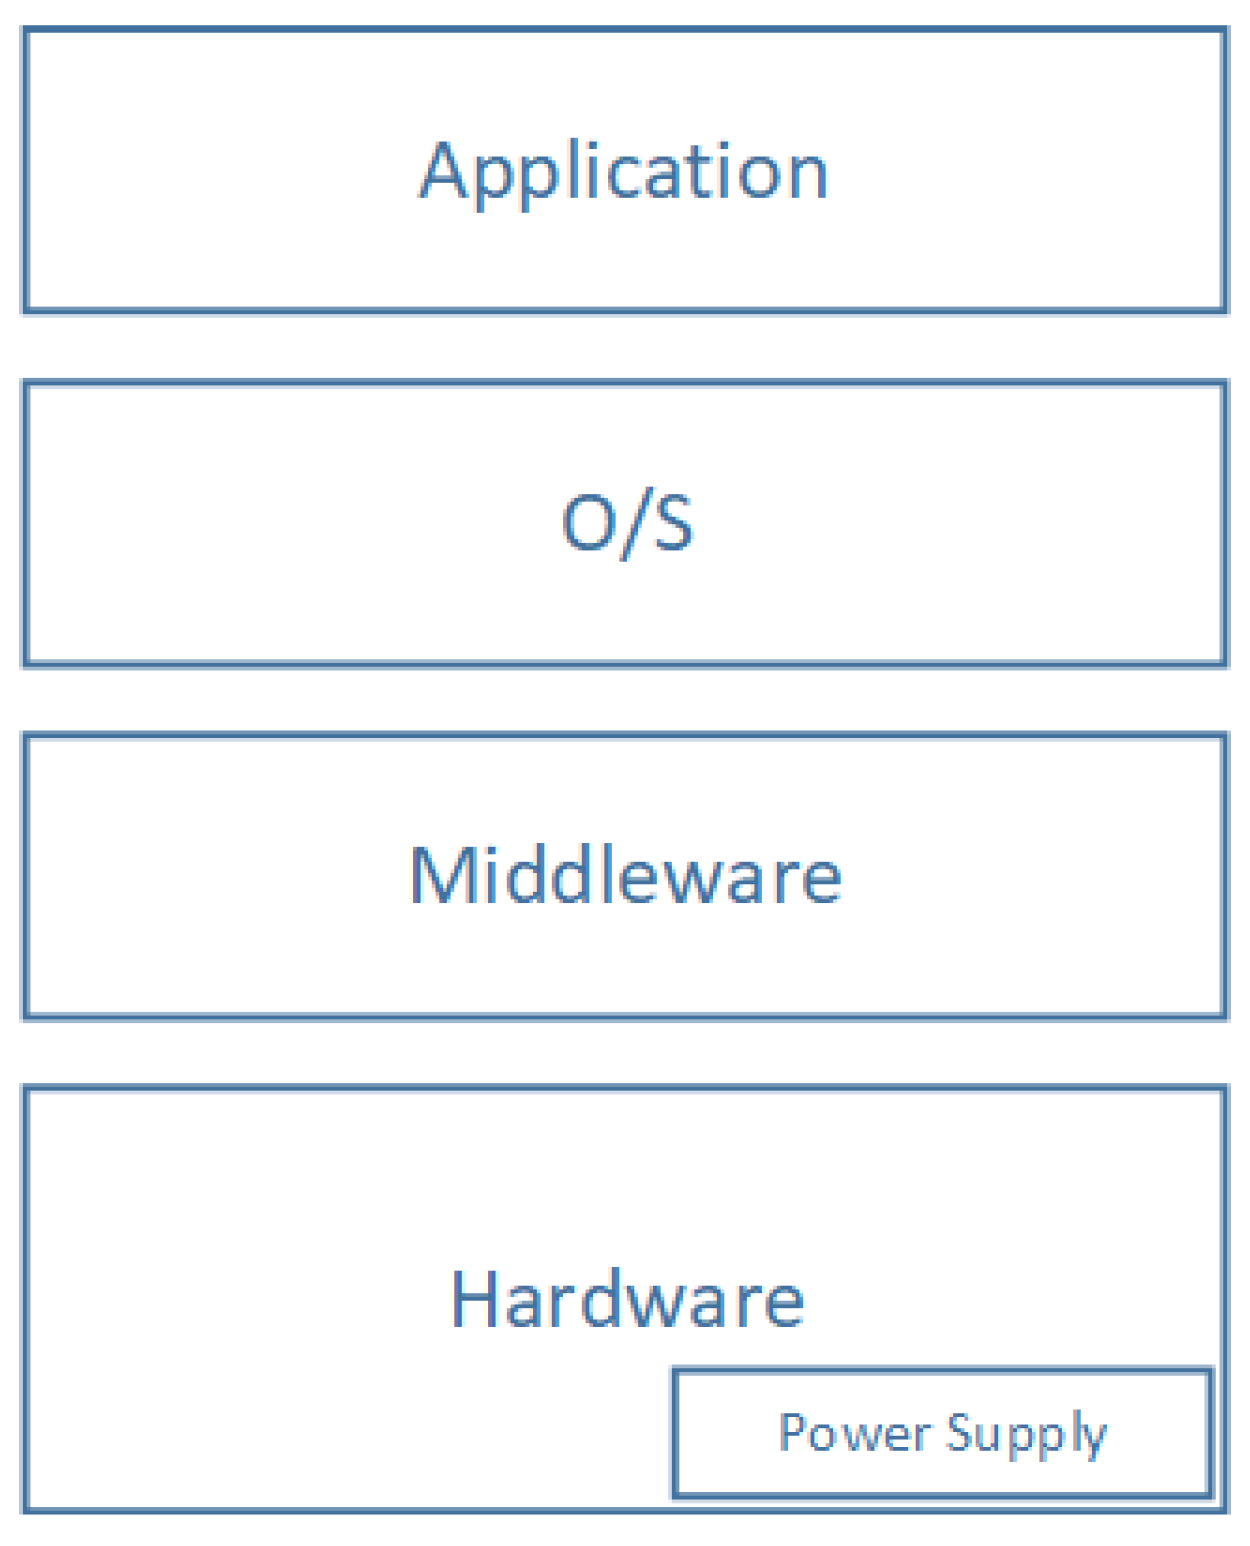
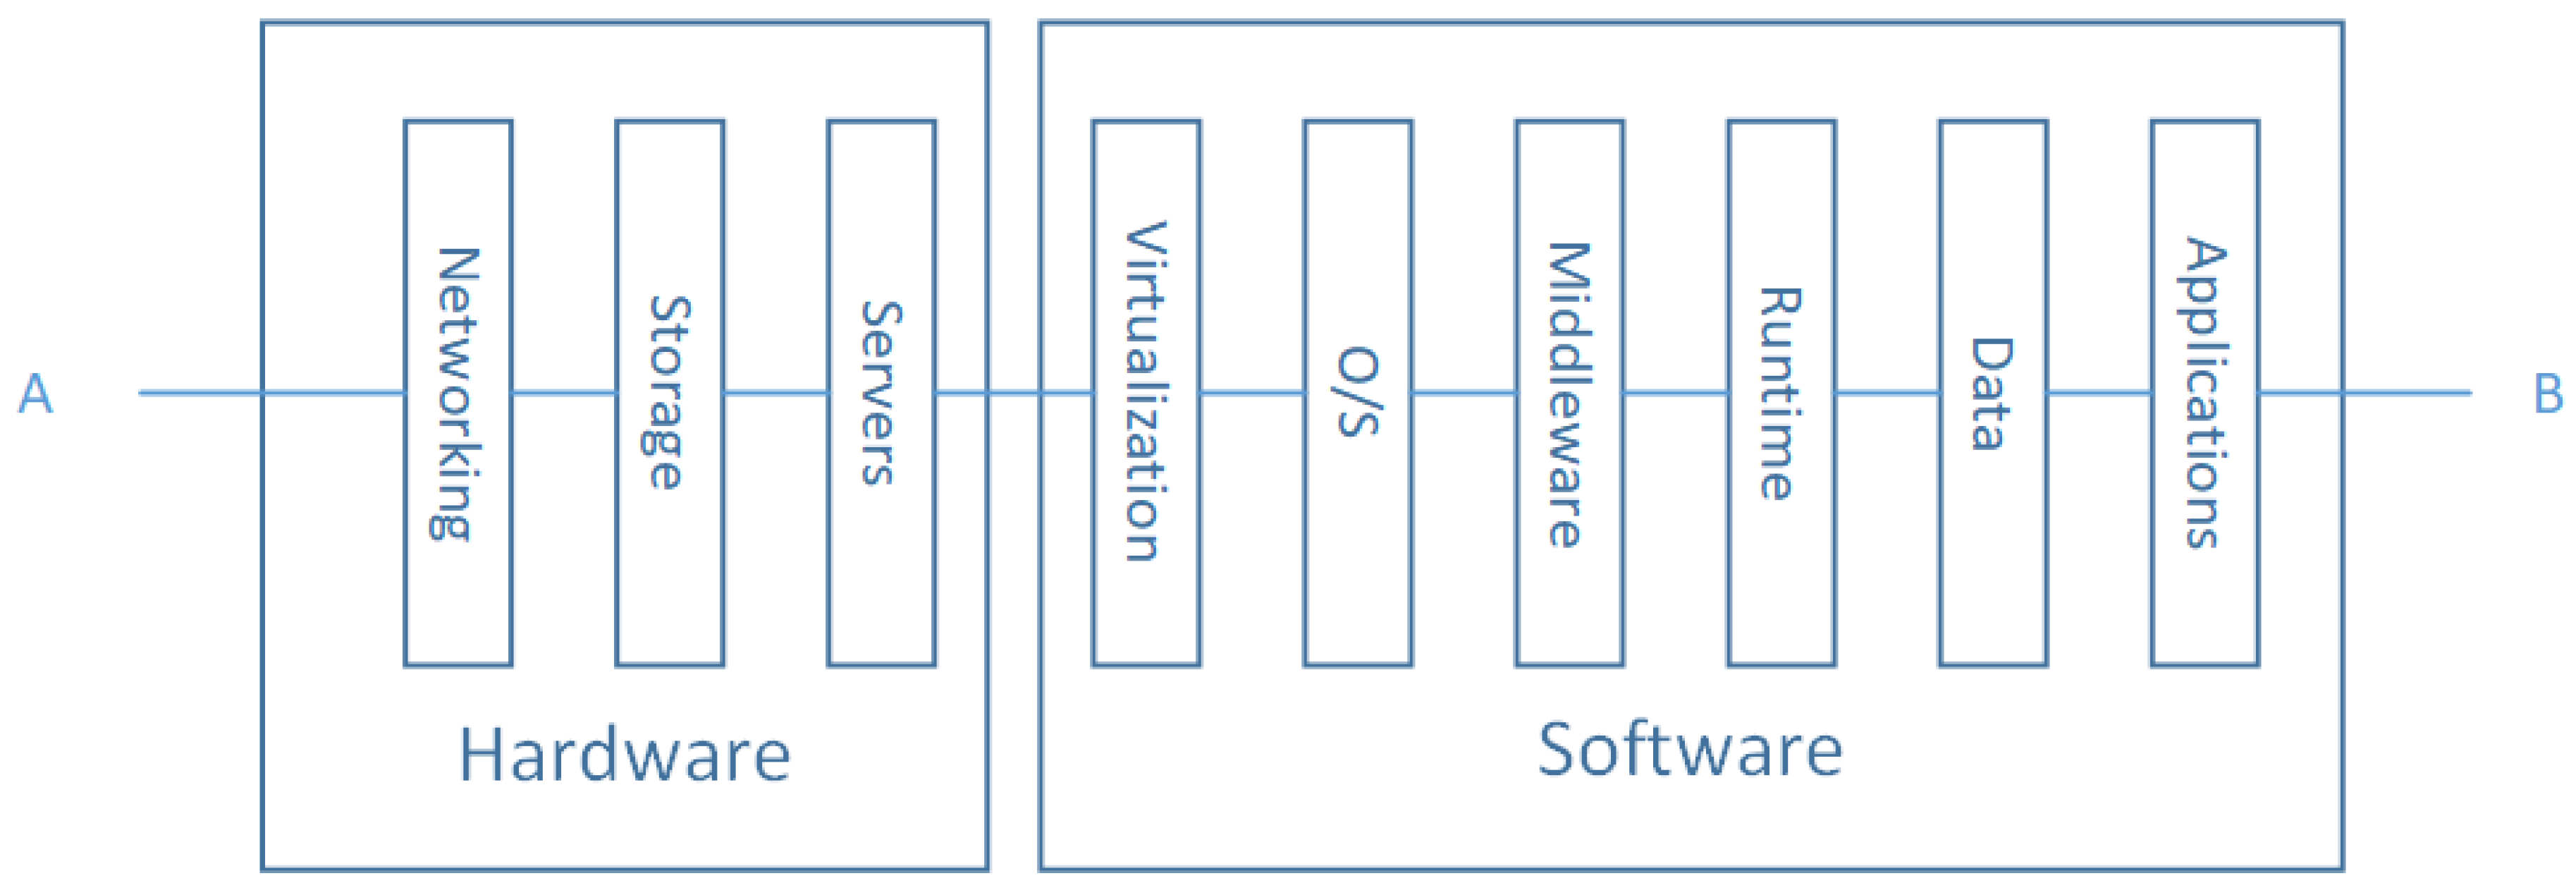
4.2.1. The Layered Architecture of IoT
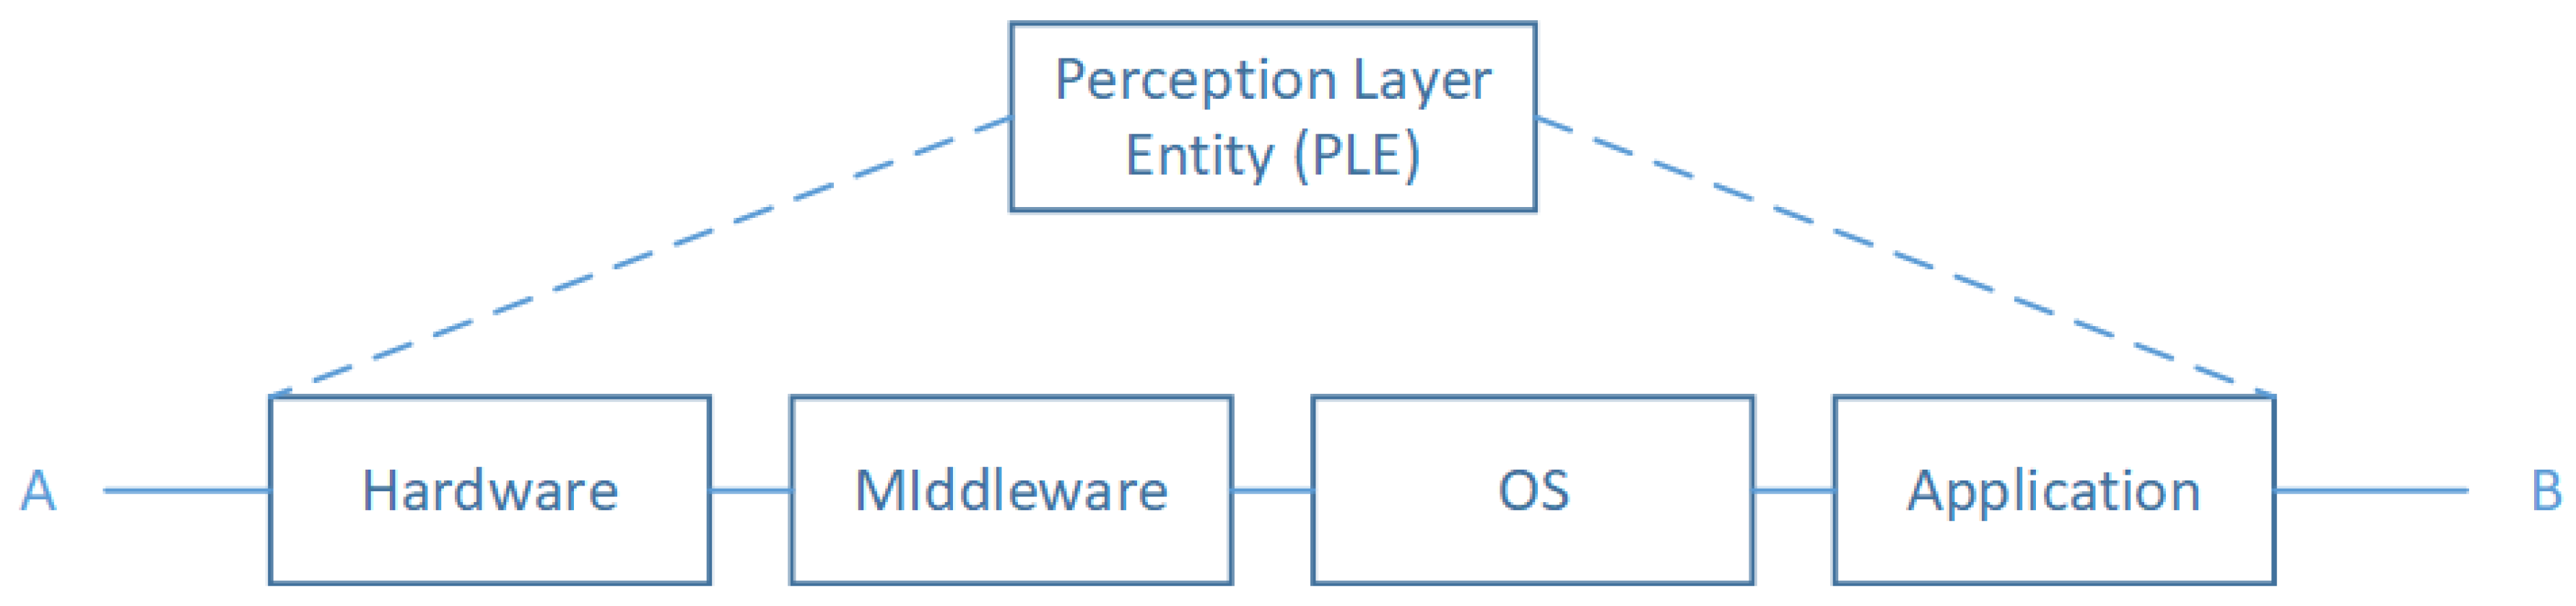
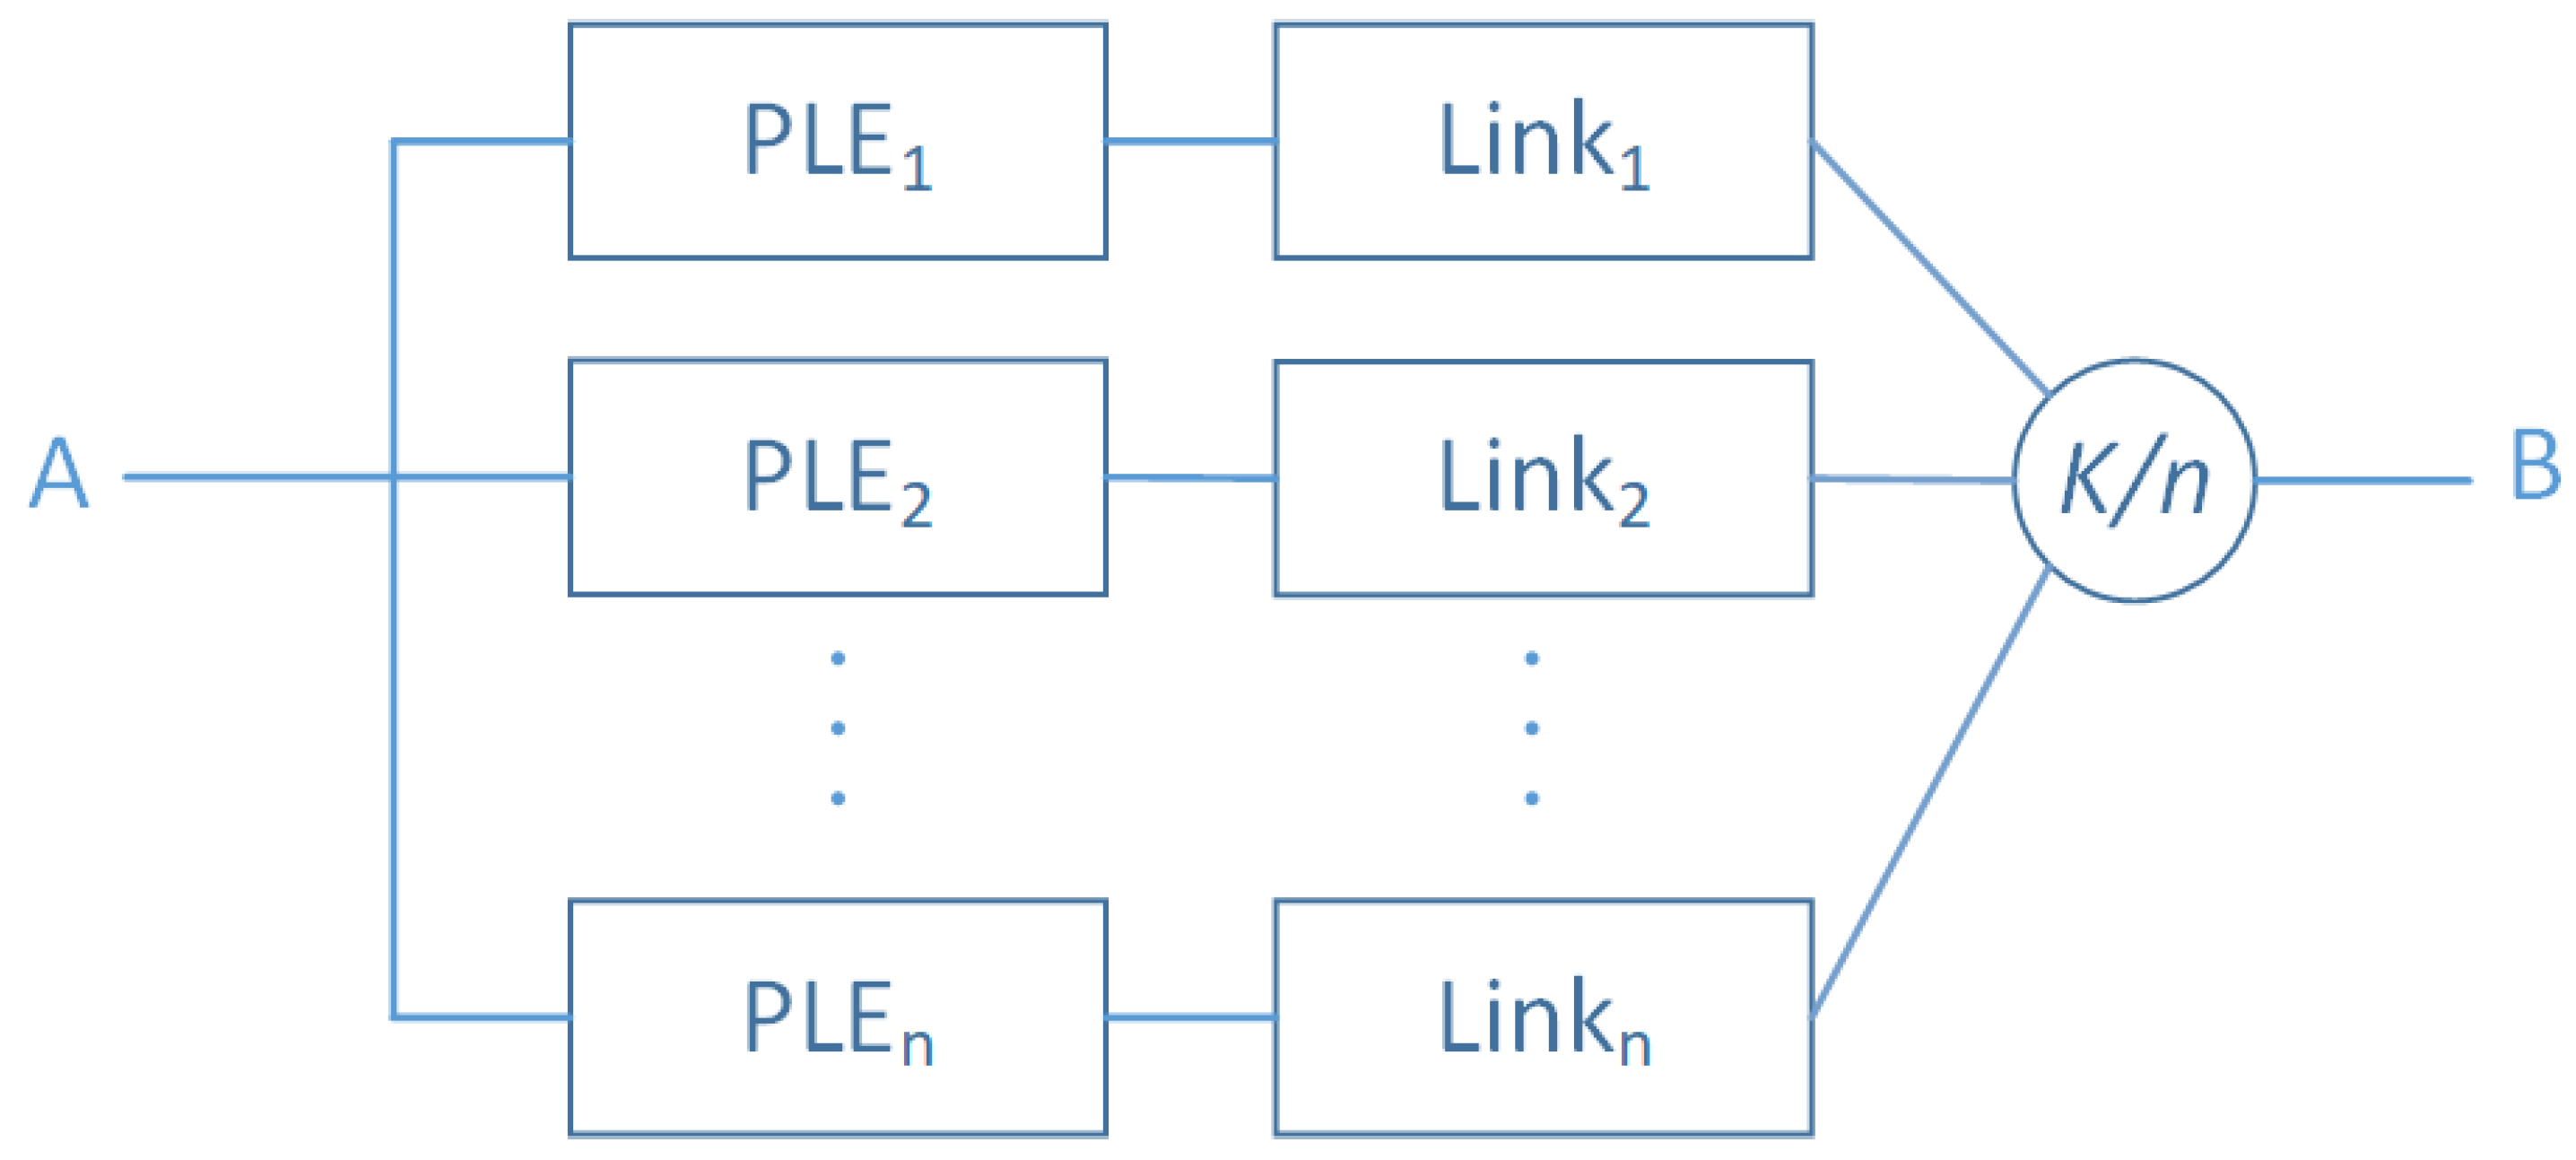
4.2.2. Perception Layer Model
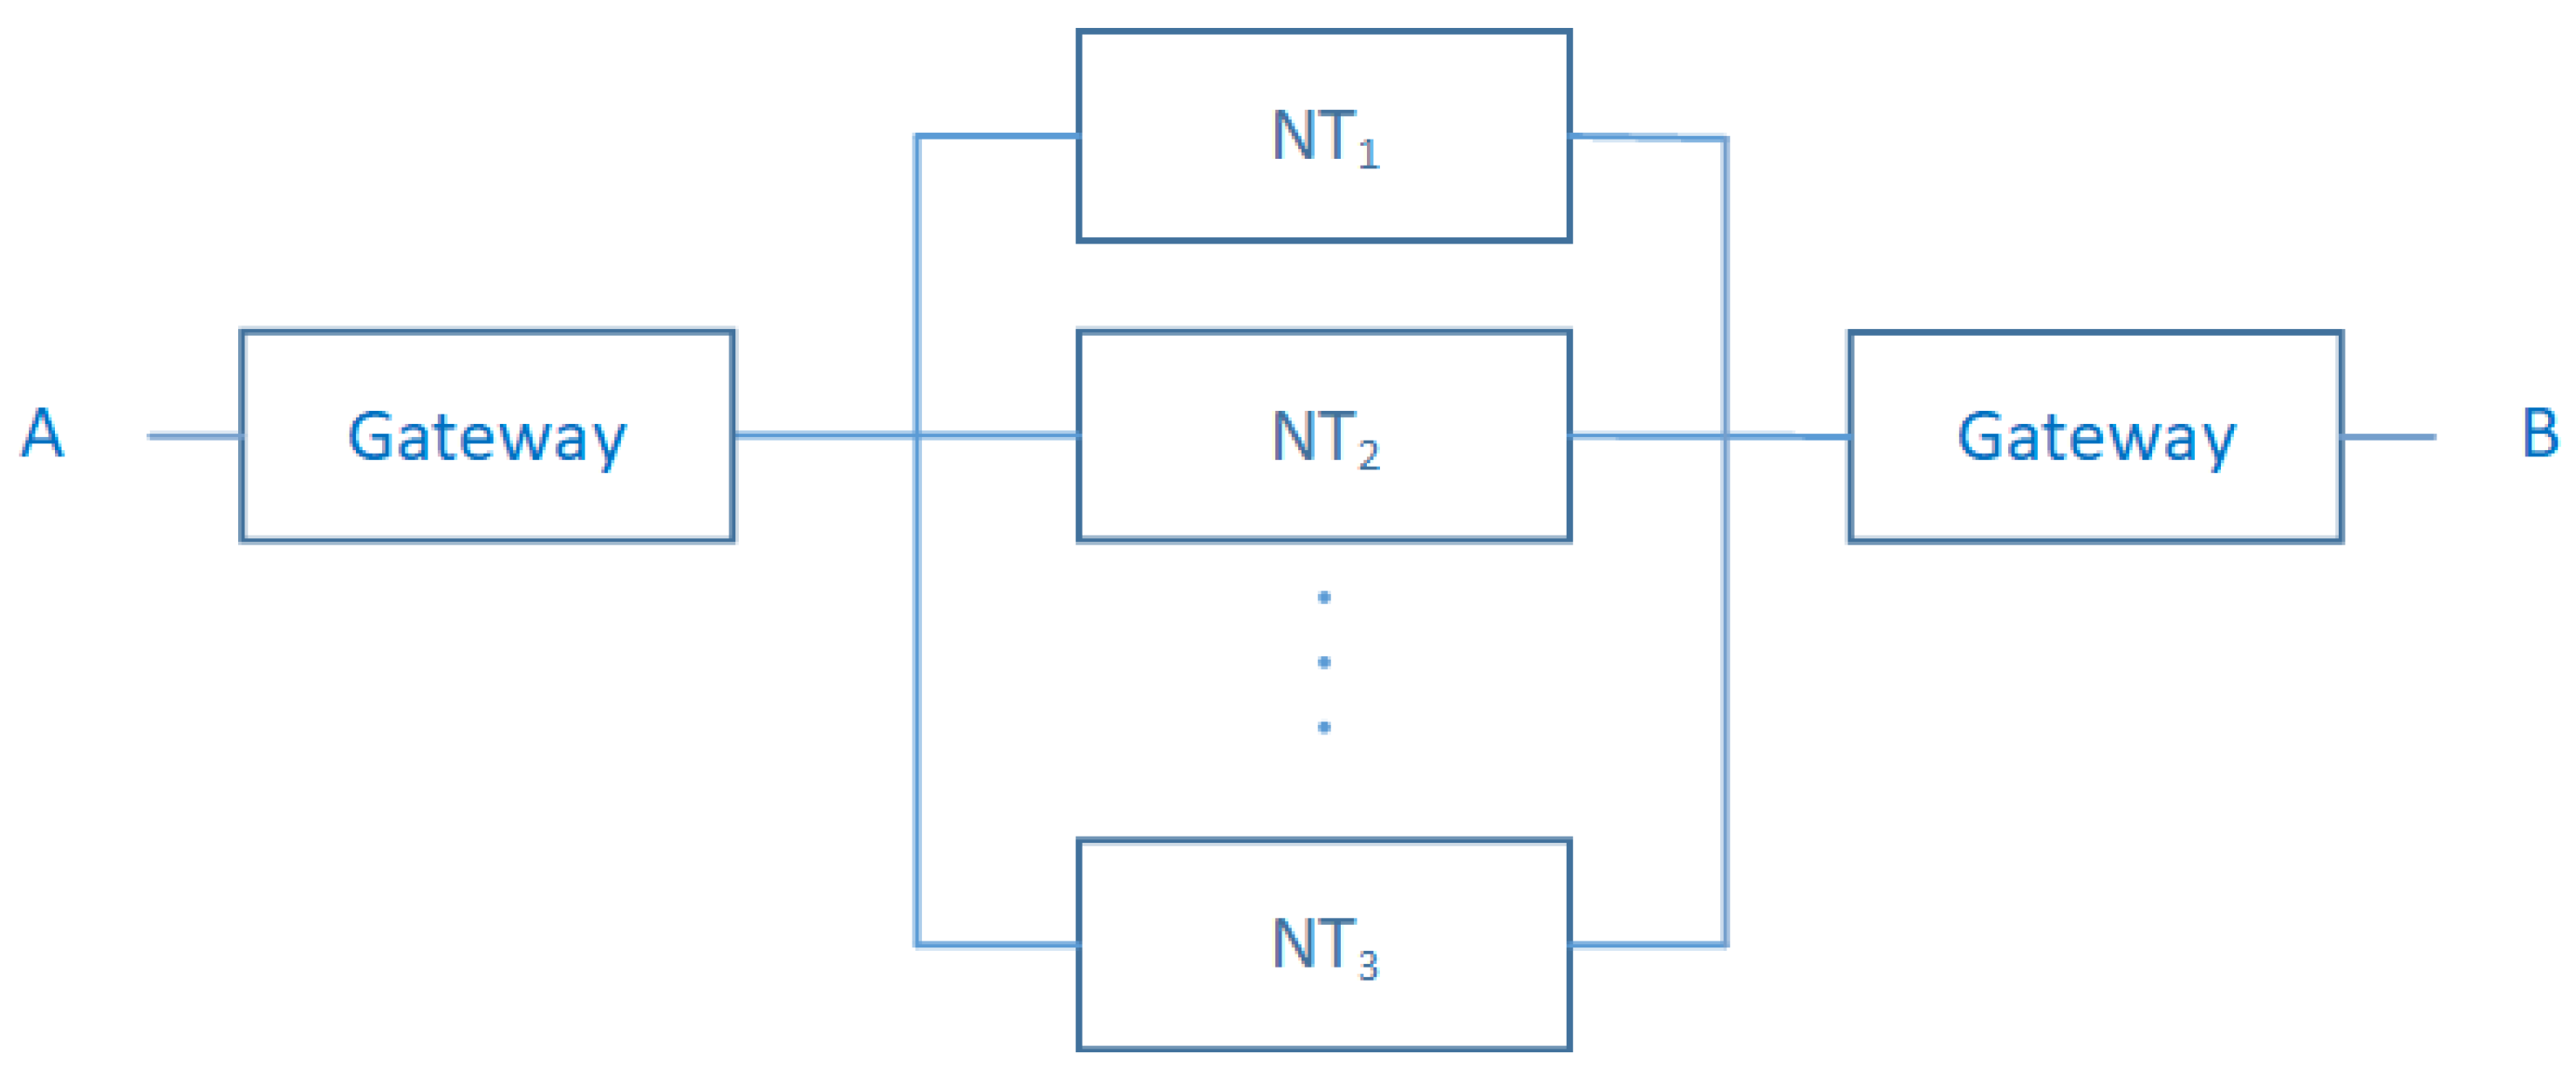
4.2.3. Sensors/Access Network Layer Model
- -
- : Structure function of the Access Network.
- -
- : State vector of the Access Networks.
- -
- : State vector of the Gateway subsystem.
- -
- : State vector of the implemented Network Technology .
- -
- : Reliability function of Access Network system.
- -
- : Reliability function of the Gateway subsystem.
- -
- : Reliability function of the implemented Network Technology .
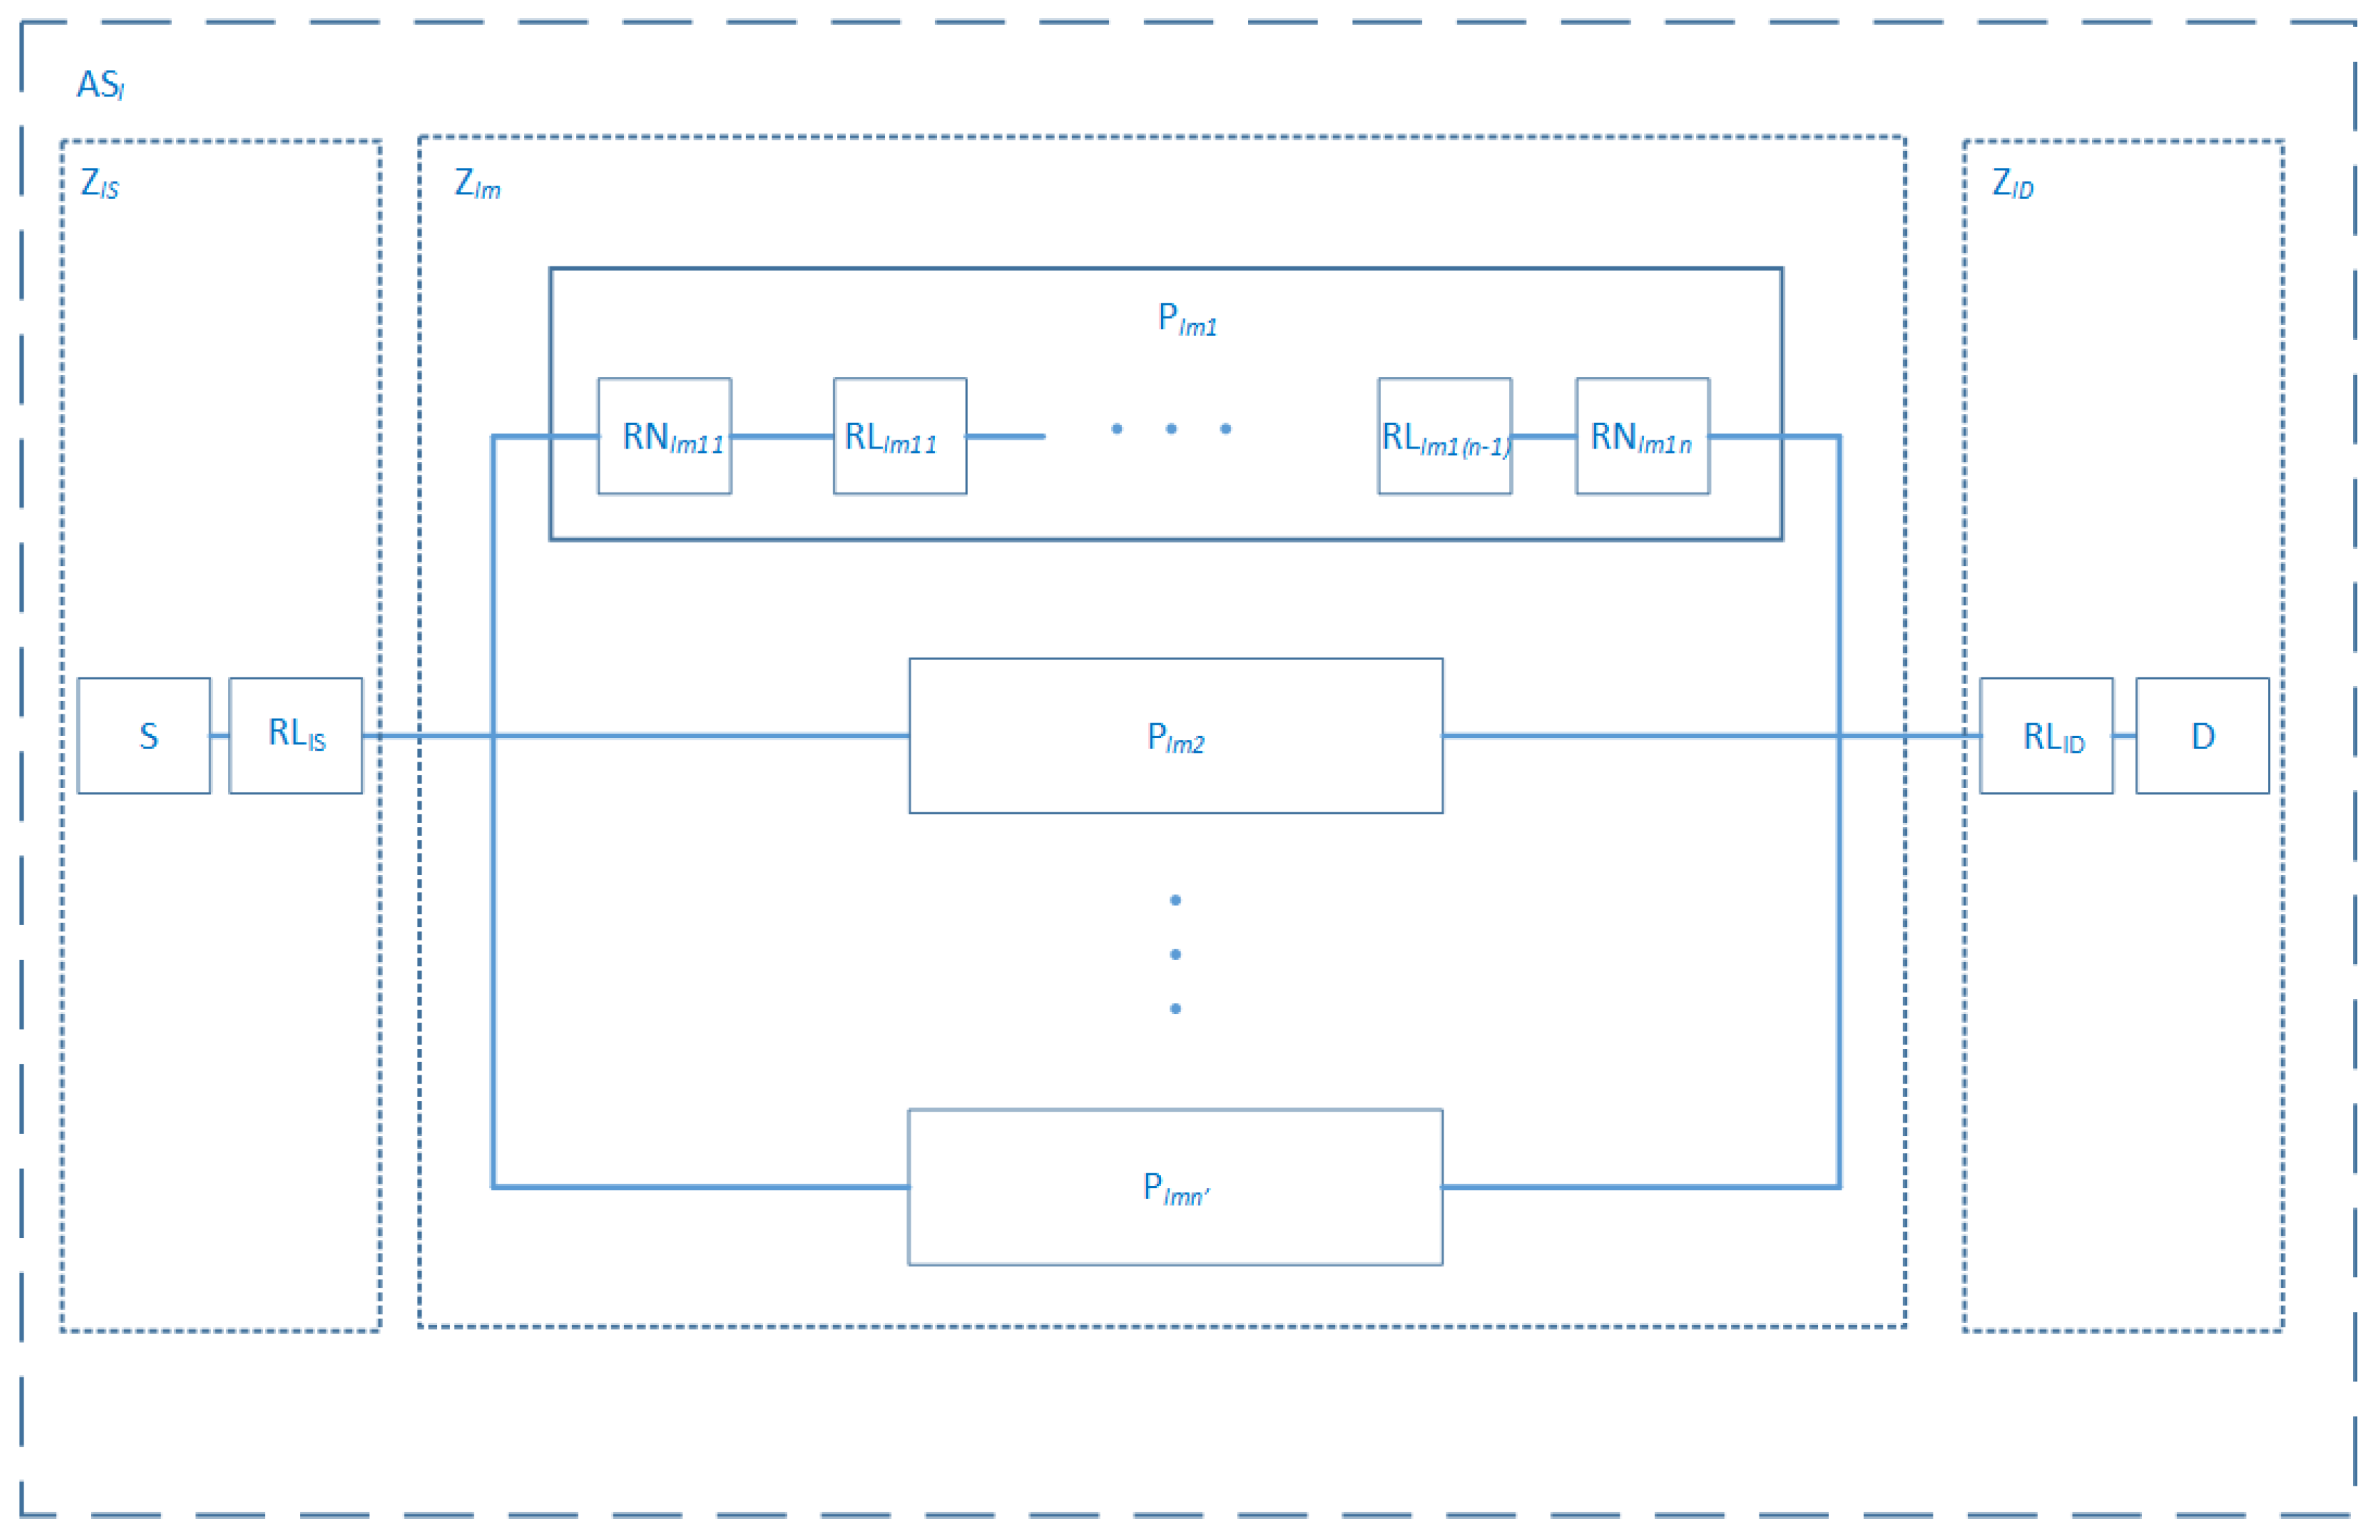
4.2.4. Core Network Layer Model
- -
- : Structure function of the path i in Zone m that belong to the AS l.
- -
- : State vector of the path i in Zone m that belong to the AS l.
- -
- : State vector of a routing node j of the path i in Zone m that belong to the AS l.
- -
- : State vector of a routing link k of the path i in Zone m that belong to the AS l.
- -
- : Reliability function of the path i in Zone m that belong to the AS l.
- -
- : Reliability function of a routing node j of the path i in Zone m that belong to the AS l.
- -
- : Reliability function of a routing link k of the path i in Zone m that belong to the AS l.
- -
- : Reliability function of the Zone m that belong to the AS l.
- -
- : Reliability function of the source node that belong to the AS l.
- -
- : Reliability function of the direct link to the source node that belong to the AS l.
- -
- : Reliability function of the direct link to the destination node that belong to the AS l.
- -
- : Reliability function of the destination node that belong to the AS l.
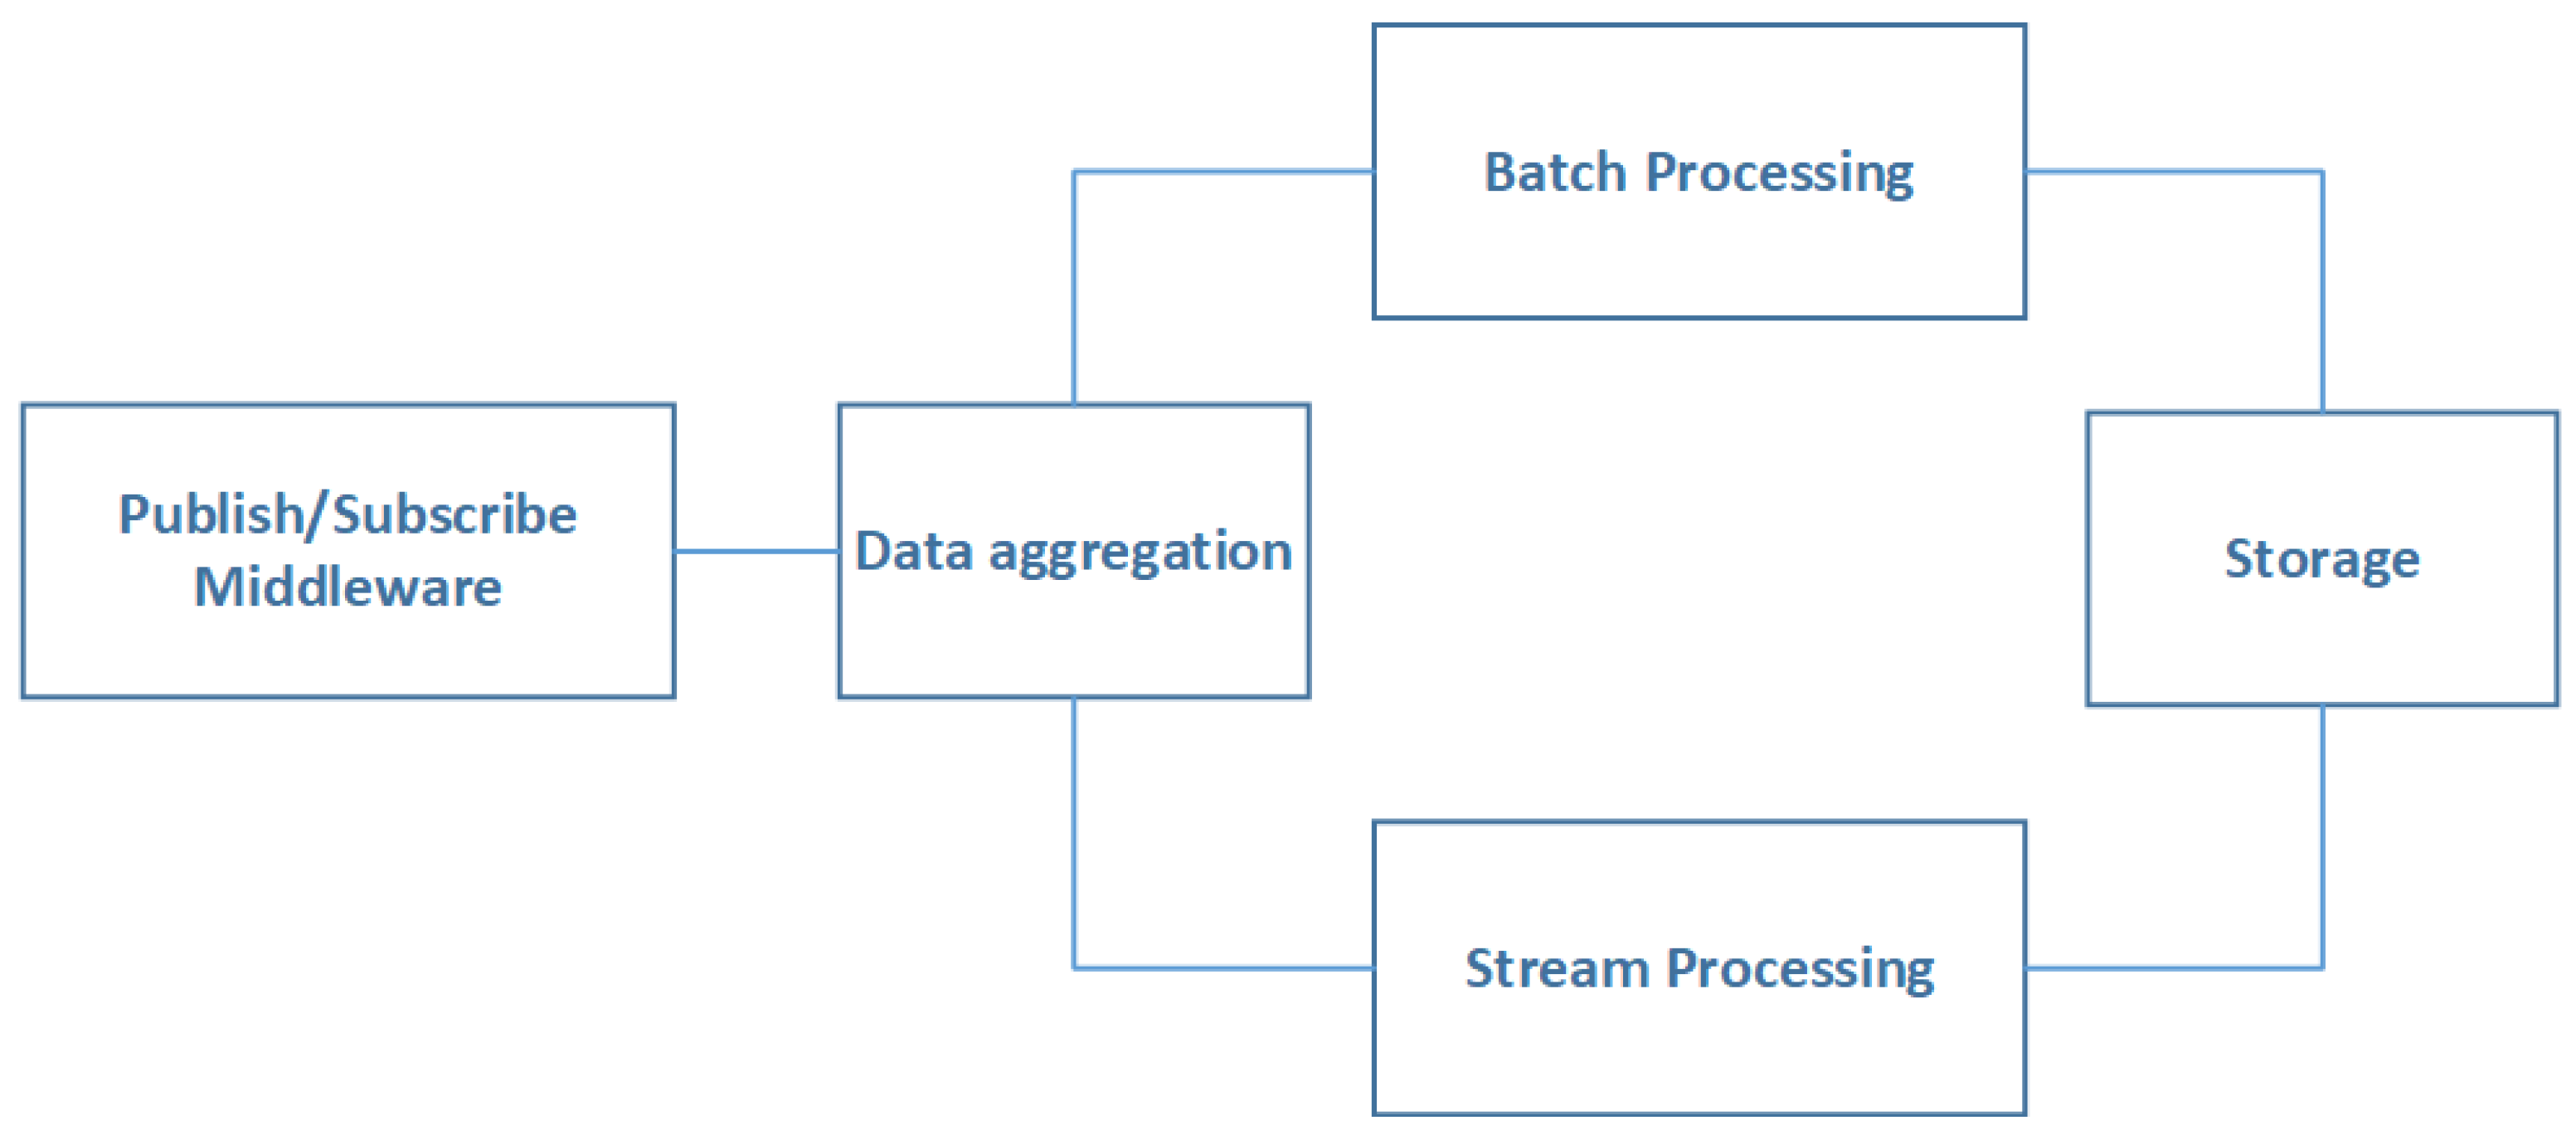
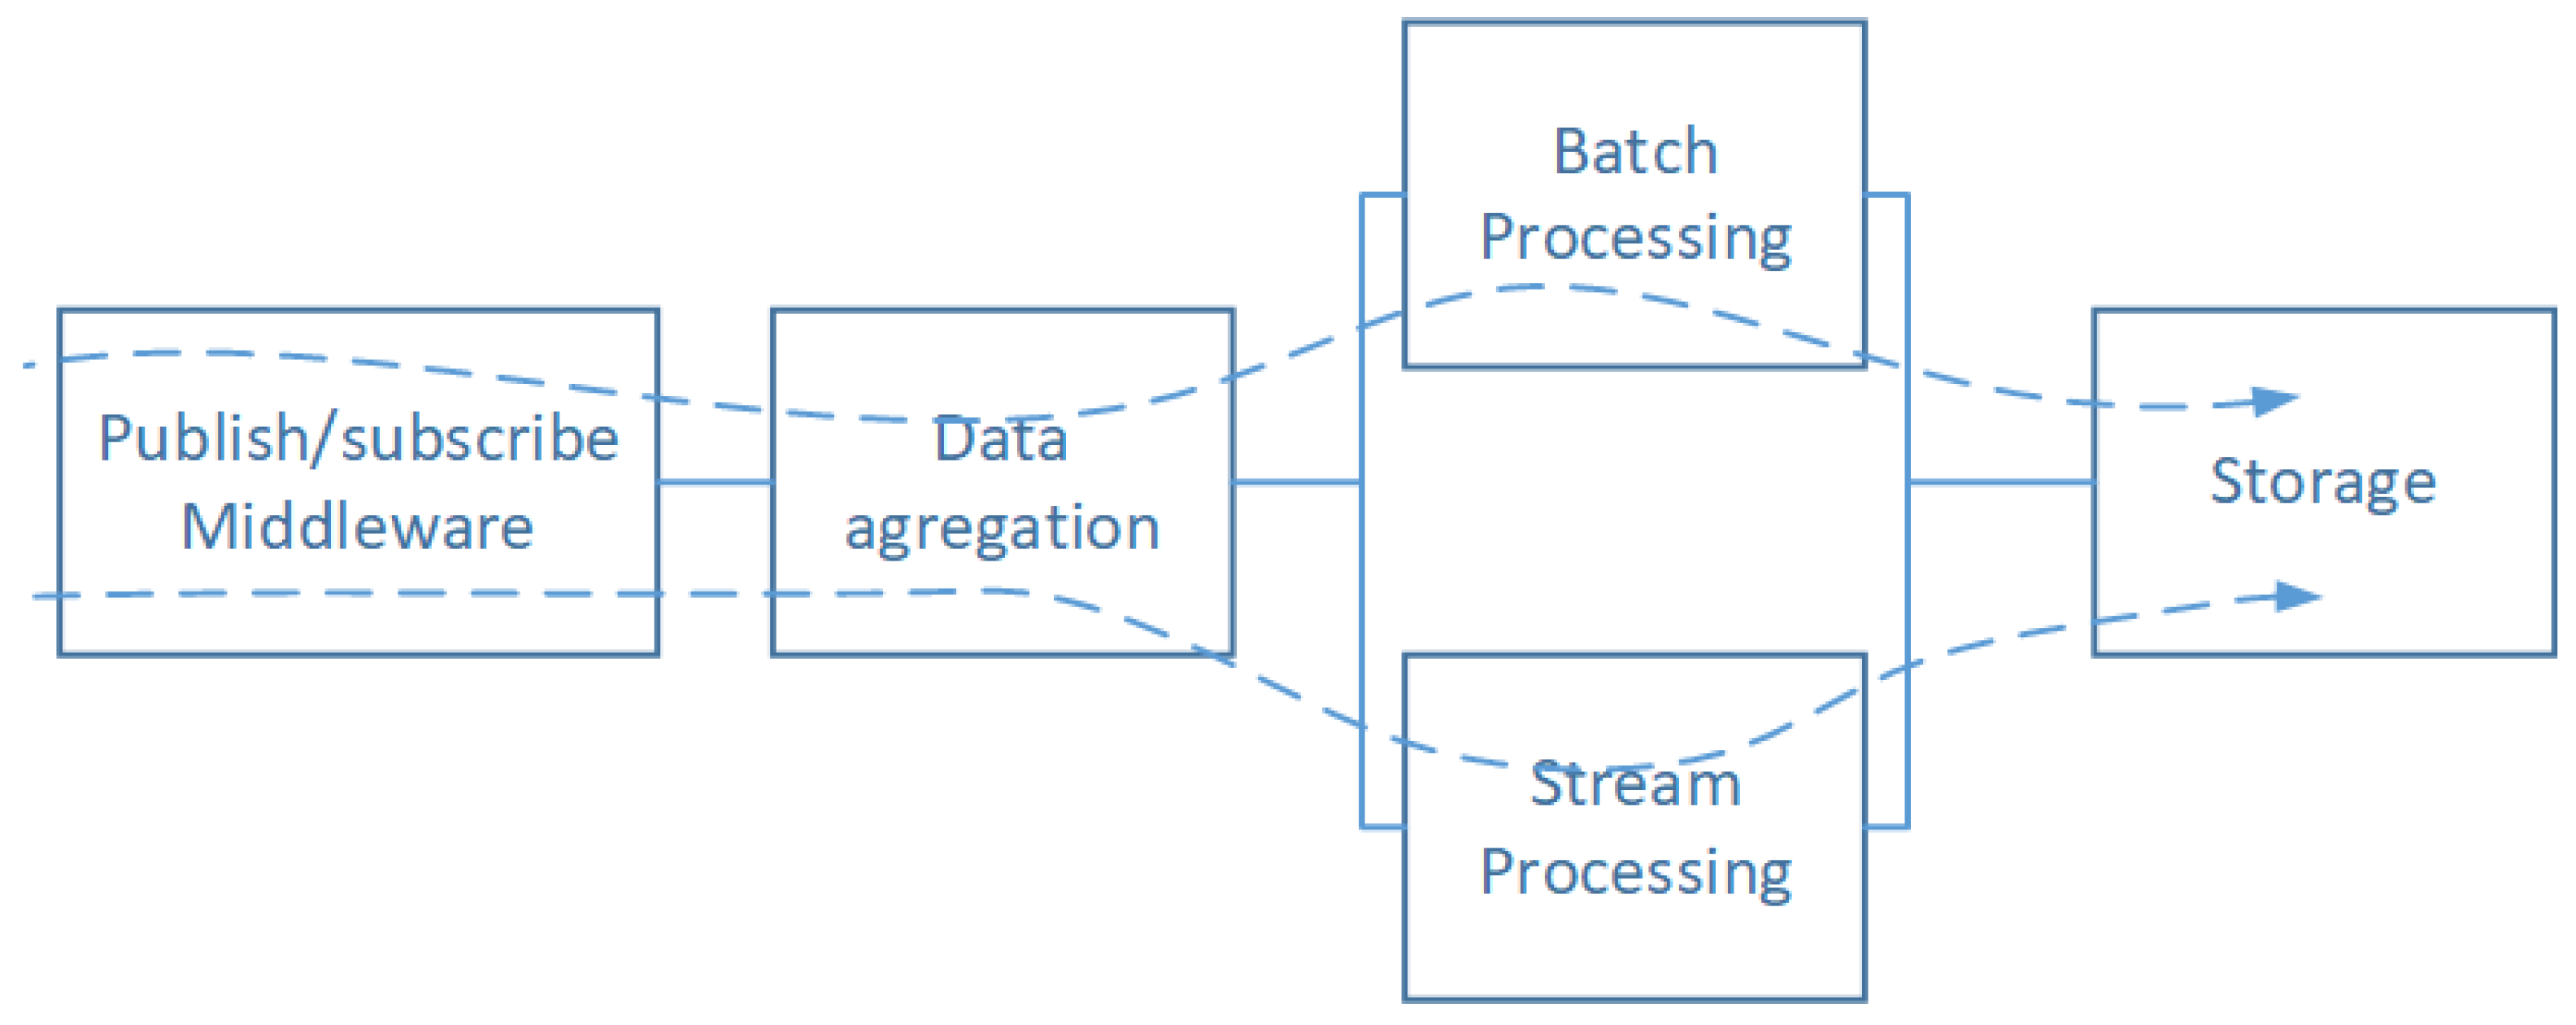
4.2.5. Middleware Layer Model
- -
- : Reliability function of -based architecture.
- -
- : Reliability function of the Publish/Subscribe subsystem.
- -
- : Reliability function of the Data Aggregation subsystem.
- -
- : Reliability function of the Batch Processing subsystem.
- -
- : Reliability function of the Stream Processing subsystem.
- -
- : Reliability function of the Storage subsystem.
4.3. Reliability Framework of IoT Systems
5. Framework Deployment Flow Chart
6. Numerical Investigation
6.1. Investigated Scenario
- -
- The Access Network subsystem and the Core Network are considered the same from the reliability diagram point of view. The reason for this is that the path of the data can be one of those (parallel structure) that are made of Network Technologies nodes and Core Network nodes, which are in series.
- -
- We have fixed the reliability function to be one for the Middleware and the application subsystems which correspond to and in Figure 14. The motivation behind this assumption is that the study of these subsystems cannot be included in this work because of their complexity and their specificity (Software case).
6.2. Results Interpretation
7. Conclusions
Author Contributions
Funding
Conflicts of Interest
References
- Zhao, K.; Ge, L. A survey on the internet of things security. In Proceedings of the 2013 Ninth International Conference on Computational Intelligence and Security, Leshan, China, 14–15 December 2013; pp. 663–667. [Google Scholar]
- Zhang, Z.K.; Cho, M.C.Y.; Wang, C.W.; Hsu, C.W.; Chen, C.K.; Shieh, S. IoT security: Ongoing challenges and research opportunities. In Proceedings of the 2014 IEEE 7th International Conference on Service-Oriented Computing and Applications, Matsue, Japan, 17–19 November 2014; pp. 230–234. [Google Scholar]
- Palattella, M.R.; Accettura, N.; Vilajosana, X.; Watteyne, T.; Grieco, L.A.; Boggia, G.; Dohler, M. Standardized protocol stack for the internet of (important) things. IEEE Commun. Surv. Tutor. 2013, 15, 1389–1406. [Google Scholar] [CrossRef]
- Meddeb, A. Internet of things standards: Who stands out from the crowd? IEEE Commun. Mag. 2016, 54, 40–47. [Google Scholar] [CrossRef]
- Ghayvat, H.; Mukhopadhyay, S.; Gui, X.; Suryadevara, N. WSN-and IOT-based smart homes and their extension to smart buildings. Sensors 2015, 15, 10350–10379. [Google Scholar] [CrossRef]
- Zanella, A.; Bui, N.; Castellani, A.; Vangelista, L.; Zorzi, M. Internet of things for smart cities. IEEE Internet Things J. 2014, 1, 22–32. [Google Scholar] [CrossRef]
- Koulali, M.A.; Koulali, S.; Tembine, H.; Kobbane, A. Industrial Internet of Things-Based Prognostic Health Management: A Mean-Field Stochastic Game Approach. IEEE Access 2018, 6, 54388–54395. [Google Scholar] [CrossRef]
- Roblek, V.; Meško, M.; Krapež, A. A complex view of industry 4.0. Sage Open 2016, 6. [Google Scholar] [CrossRef]
- Wollschlaeger, M.; Sauter, T.; Jasperneite, J. The future of industrial communication: Automation networks in the era of the internet of things and industry 4.0. IEEE Ind. Electron. Mag. 2017, 11, 17–27. [Google Scholar] [CrossRef]
- Hassanalieragh, M.; Page, A.; Soyata, T.; Sharma, G.; Aktas, M.; Mateos, G.; Kantarci, B.; Andreescu, S. Health monitoring and management using Internet-of-Things (IoT) sensing with cloud-based processing: Opportunities and challenges. In Proceedings of the 2015 IEEE International Conference on Services Computing, New York, NY, USA, 27 June–2 July 2015; pp. 285–292. [Google Scholar]
- Wan, J.; Chen, M.; Xia, F.; Di, L.; Zhou, K. From machine-to-machine communications towards cyber-physical systems. Comput. Sci. Inf. Syst. 2013, 10, 1105–1128. [Google Scholar] [CrossRef]
- Khan, R.; Khan, S.U.; Zaheer, R.; Khan, S. Future internet: The internet of things architecture, possible applications and key challenges. In Proceedings of the 2012 10th International Conference on Frontiers of Information Technology, Islamabad, India, 17–19 December 2012; pp. 257–260. [Google Scholar]
- Hanes, D.; Salgueiro, G.; Grossetete, P.; Barton, R.; Henry, J. IoT fundamentals: Networking Technologies, Protocols, and Use Cases for the Internet of Things; Cisco Press: Indianapolis, IN, USA, 2017. [Google Scholar]
- Lea, P. Internet of Things for Architects: Architecting IoT Solutions by Implementing Sensors, Communication Infrastructure, Edge Computing, Analytics, and Security; Packt Publishing Ltd.: Birmingham, UK, 2018. [Google Scholar]
- Hassan, Q.F. Internet of Things A to Z: Technologies and Applications; John Wiley & Sons: Hoboken, NJ, USA, 2018. [Google Scholar]
- Mongiello, M.; Patrono, L.; Di Noia, T.; Nocera, F.; Parchitelli, A.; Sergi, I.; Rametta, P. A complex event processing based smart aid system for fire and danger management. In Proceedings of the 2017 7th IEEE International Workshop on Advances in Sensors and Interfaces (IWASI), Vieste, Italy, 15–16 June 2017; pp. 44–49. [Google Scholar]
- Poy, H.M.; Duffy, B. A cloud-enabled building and fire emergency evacuation application. IEEE Cloud Comput. 2014, 1, 40–49. [Google Scholar] [CrossRef]
- Arnett, J. Jet Propulsion Laboratory, Reliability Analyses Handbook; Jet Propulsion Laboratory: Pasadena, CA, USA, 1990.
- Dâmaso, A.; Rosa, N.; Maciel, P. Reliability of wireless sensor networks. Sensors 2014, 14, 15760–15785. [Google Scholar] [CrossRef] [PubMed]
- Deif, D.; Gadallah, Y. A comprehensive wireless sensor network reliability metric for critical Internet of Things applications. EURASIP J. Wirel. Commun. Netw. 2017, 2017, 145. [Google Scholar] [CrossRef]
- Kanabar, M.G.; Sidhu, T.S. Reliability and availability analysis of IEC 61850 based substation communication architectures. In Proceedings of the 2009 IEEE Power and Energy Society General Meeting, PES ’09, Calgary, AB, Canada, 26–30 July 2009; pp. 1–8. [Google Scholar] [CrossRef]
- Hai, Y.; Yue, Y.; Yao, Q.; Yin, H. Analysis on the reliability of wide area protection communication system. In Proceedings of the International Conference on Communication Technology Proceedings, ICCT, Chengdu, China, 9–11 November 2012; pp. 329–333. [Google Scholar] [CrossRef]
- Wei, B.; Lin, C.; Kong, X. Dependability modeling and analysis for the virtual data center of cloud computing. In Proceedings of the 2011 IEEE International Conference on High Performance Computing and Communications, Banff, AB, Canada, 2–4 September 2011; pp. 784–789. [Google Scholar] [CrossRef]
- Nguyen, T.A.; Min, D.; Choi, E. A hierarchical modeling and analysis framework for availability and security quantification of IoT infrastructures. Electronics 2020, 9, 155. [Google Scholar] [CrossRef]
- Botta, A.; De Donato, W.; Persico, V.; Pescapé, A. On the integration of cloud computing and internet of things. In Proceedings of the 2014 International Conference on Future Internet of Things and Cloud, Barcelona, Spain, 27–29 August 2014; pp. 23–30. [Google Scholar]
- BSI. BS 4778-3.1:1991, Quality Vocabulary. Availability, Reliability and Maintainability Terms. Guide to Concepts and Related Definitions; British Standards Institution: London, UK, 1991. [Google Scholar]
- Rausand, M.; Høyland, A. System Reliability Theory: Models, Statistical Methods, and Application; John Wiley & Sons: Hoboken, NJ, USA, 2004. [Google Scholar]
- Ashley, L.; Armitage, G. Failure mode and effects analysis: An empirical comparison of failure mode scoring procedures. J. Patient Saf. 2010, 6, 210–215. [Google Scholar] [CrossRef] [PubMed]
- Wilson, A.G.; Huzurbazar, A.V. Bayesian networks for multilevel system reliability. Reliab. Eng. Syst. Saf. 2007, 92, 1413–1420. [Google Scholar] [CrossRef]
- Neil, M.; Littlewood, B.; Fenton, N. Applying Bayesian belief networks to system dependability assessment. In Safety-Critical Systems: The Convergence of High Tech and Human Factors; Springer: London, UK, 1996; pp. 71–94. [Google Scholar]
- Torres-Toledano, J.G.; Sucar, L.E. Bayesian networks for reliability analysis of complex systems. In Ibero-American Conference on Artificial Intelligence; Springer: Heidelberg, Germany, 1998; pp. 195–206. [Google Scholar]
- Khakzad, N.; Khan, F.; Amyotte, P. Safety analysis in process facilities: Comparison of fault tree and Bayesian network approaches. Reliab. Eng. Syst. Saf. 2011, 96, 925–932. [Google Scholar] [CrossRef]
- Dunjó, J.; Fthenakis, V.; Vílchez, J.A.; Arnaldos, J. Hazard and operability (HAZOP) analysis. A literature review. J. Hazard. Mater. 2010, 173, 19–32. [Google Scholar] [CrossRef] [PubMed]
- Li, L.; Jin, Z.; Li, G.; Zheng, L.; Wei, Q. Modeling and analyzing the reliability and cost of service composition in the IoT: A probabilistic approach. In Proceedings of the 2012 IEEE 19th International Conference on Web Services, Honolulu, HI, USA, 24–29 June 2012; pp. 584–591. [Google Scholar]
- Gertsbakh, I.B.; Shpungin, Y. Models of Network Reliability: Analysis, Combinatorics, and Monte Carlo; CRC Press: Boca Raton, FA, USA, 2016. [Google Scholar]
- Green, J. IoT Reference Model. 2014. Available online: https://www.iotwf.com/resources/72 (accessed on 3 January 2019).
- ITU. Recommendation ITU-T Y.2060: Overview of the Internet of Things; Technical report; ITU: Geneva, Switzerland, 2013. [Google Scholar]
- Dharmaraja, S.; Jindal, V.; Varshney, U. Reliability and survivability analysis for UMTS networks: An analytical approach. IEEE Trans. Netw. Serv. Manag. 2008, 5, 132–142. [Google Scholar] [CrossRef]
- Xing, L.; Tannous, M.; Vokkarane, V.M.; Wang, H.; Guo, J. Reliability Modeling of Mesh Storage Area Networks for Internet of Things. IEEE Internet Things J. 2017, 4, 2047–2057. [Google Scholar] [CrossRef]
- Marz, N.; Warren, J. Big Data: Principles and Best Practices of Scalable Real-Time Data Systems; Manning Publications Co.: New York, NY, USA, 2015. [Google Scholar]
- Tarkoma, S. Publish/Subscribe Systems: Design and Principles; John Wiley & Sons: Chichester, West Sussex, UK, 2012. [Google Scholar]
- Abd-Allah, A. Extending reliability block diagrams to software architectures. System 1997, 97, 93. [Google Scholar]
- Barlow, R.E.; Proschan, F. Mathematical theory of Reliability; Siam: Philadelphia, PA, USA, 1996. [Google Scholar]


| Methods & Techniques | Preferred Step(s) | Benefits | Limitations | Ref |
|---|---|---|---|---|
| Failure Mode Analyses (FMMA, FMEA, and FMECA) | Design | Comprehensive Implementation | Scoring requires consensus | [28] |
| Tree Analyses (FTA, ETA, and BBN) | Design, Implementation | Events interdependencies are represented as a graph. Helpful for decision making | Heavy for high level granular system | [29,30,31,32] |
| RBD | Design | Design Optimization and uncertainties consideration | demanding in terms of computational resources | [19] |
| Hazard Analyses | Design, Operation | Hazards structuration Specifies operational risk factors | Heavy documentation Well-defined targeted system | [33] |
| Markov Chain | Operation, Maintenance | Used to model dynamic problems and maintenance processes | demanding in terms of computational resources | [34] |
| Monte Carlo Simulation | Operation, Maintenance | Straightforward Implementation Helpful for decision making | Computational resources consuming | [35] |
© 2020 by the authors. Licensee MDPI, Basel, Switzerland. This article is an open access article distributed under the terms and conditions of the Creative Commons Attribution (CC BY) license (http://creativecommons.org/licenses/by/4.0/).
Share and Cite
Azghiou, K.; El Mouhib, M.; Koulali, M.-A.; Benali, A. An End-to-End Reliability Framework of the Internet of Things. Sensors 2020, 20, 2439. https://doi.org/10.3390/s20092439
Azghiou K, El Mouhib M, Koulali M-A, Benali A. An End-to-End Reliability Framework of the Internet of Things. Sensors. 2020; 20(9):2439. https://doi.org/10.3390/s20092439
Chicago/Turabian StyleAzghiou, Kamal, Manal El Mouhib, Mohammed-Amine Koulali, and Abdelhamid Benali. 2020. "An End-to-End Reliability Framework of the Internet of Things" Sensors 20, no. 9: 2439. https://doi.org/10.3390/s20092439
APA StyleAzghiou, K., El Mouhib, M., Koulali, M.-A., & Benali, A. (2020). An End-to-End Reliability Framework of the Internet of Things. Sensors, 20(9), 2439. https://doi.org/10.3390/s20092439