Article

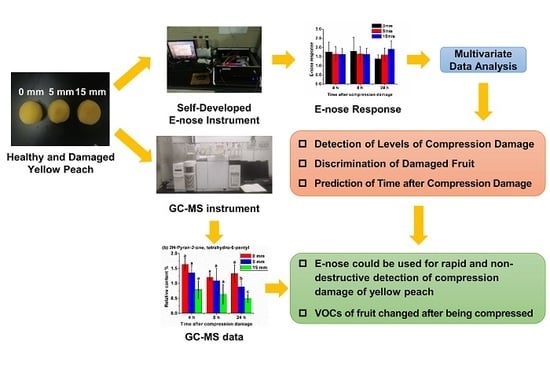
Rapid and Non-Destructive Detection of Compression Damage of Yellow Peach Using an Electronic Nose and Chemometrics

1
Jinan Fruit Research Institute, All China Federation of Supply and Marketing Cooperatives, Jinan 250014, China
2
College of Agriculture & Biotechnology, Zhejiang University, Zijingang Campus, Hangzhou 310058, China
3
School of Food Science and Biotechnology, Zhejiang GongShang University, Hangzhou 310018, China
*
Author to whom correspondence should be addressed.
Sensors 2020, 20(7), 1866; https://doi.org/10.3390/s20071866
Submission received: 12 February 2020 / Revised: 24 March 2020 / Accepted: 24 March 2020 / Published: 27 March 2020
(This article belongs to the Section Electronic Sensors)

Abstract

:
The rapid and non-destructive detection of mechanical damage to fruit during postharvest supply chains is important for monitoring fruit deterioration in time and optimizing freshness preservation and packaging strategies. As fruit is usually packed during supply chain operations, it is difficult to detect whether it has suffered mechanical damage by visual observation and spectral imaging technologies. In this study, based on the volatile substances (VOCs) in yellow peaches, the electronic nose (e-nose) technology was applied to non-destructively predict the levels of compression damage in yellow peaches, discriminate the damaged fruit and predict the time after the damage. A comparison of the models, established based on the samples at different times after damage, was also carried out. The results show that, at 24 h after damage, the correct answer rate for identifying the damaged fruit was 93.33%, and the residual predictive deviation in predicting the levels of compression damage and the time after the damage, was 2.139 and 2.114, respectively. The results of e-nose and gas chromatography-mass spectrophotometry (GC–MS) showed that the VOCs changed after being compressed—this was the basis of the e-nose detection. Therefore, the e-nose is a promising candidate for the detection of compression damage in yellow peach.

Graphical Abstract

1. Introduction

Peach (Prunus persica L. Batsch) is one of the major fruits worldwide and has an important economic value. Peaches were domesticated in China and are now widely cultivated in the Americas, Europe, and Asia [1]. According to the color of the flesh, peach can be divided into three varieties: white flesh, yellow flesh and red flesh peach. Due to its attractive color, taste, and aroma, yellow peach is very competitive in fruit markets. In comparing the total carotenoid content of yellow flesh and white flesh peach, the former is much higher than the latter. In particular, yellow peaches at harvest have higher β-cryptoxanthin and β-carotene contents [2,3,4].
Fruit ripens and softens quickly after harvest, resulting in a short shelf life [5]. After harvest, the fruit’s metabolism continues, which can cause quality deterioration. Besides this, fruit is susceptible to mechanical damage during the postharvest supply chain, accelerating the deterioration of fruit quality and affecting the commercial value of the fruit [6]. Mechanical wounding during transport and storage can cause fruits such as apples, bananas, and tomatoes to produce large amounts of C2H4, which, in turn, accelerates fruit ripening and causes quality deterioration [5]. Polashock, et al. [7] found that tomatoes that were mechanically damaged by compression force were less firm, higher in pectin methylesterase (PME) activity, and had greater juice consistency. Li et al. [6] showed that pears with bruise damage were less firm, had a lower the ratio of sugar to acid, and had a higher water loss and disease incidence rate. Mechanical damage also increased the probability of infection with fungi for blueberries, and changed its volatile compounds, e.g., the damaged fruit had higher contents of aldehydes [7].
A major challenge in the fruit supply chain is the rapid detection of fruit damage or decay that occurs during the supply chain steps, such as in the storage room and on the truck. A lack of data on fruit decay causes delays in making the right decisions in a timely manner along the supply chain, such as changing transportation or sale strategies. Acquiring timely information as to whether the fruit has suffered mechanical damage is the key to enhancing information transparency in the fruit supply chain.
During the whole supply chain of fruits, growers, distributors, sellers, and consumers usually observe fruit decay directly with the naked eye. However, visual observation has disadvantages, such as being subjective, time-consuming, and tedious. The traditional measurement methods for fruit quality are mainly destructive physical/chemical methods, and the measurement process is time-consuming and labor-intensive. Moreover, these methods are based on sampling measurement, which means that only a few samples can be measured, and they so cannot meet the needs of the fruit supply chain industry. Therefore, it is necessary to develop a detection technology that can quickly detect any quality deterioration in the postharvest fruit supply chain.
Currently, the research and application of non-destructive detection methods of fruit freshness and mechanical damage mainly use computer vision, visible and near-infrared spectroscopy, and hyperspectral imaging techniques [8,9]. However, during the supply chain, fruit is usually packed in corrugated fiberboard boxes or plastic containers, and may be covered by additional inner packaging, making it difficult to detect whether the fruit has suffered quality deterioration during the supply chain by visual observation and spectral imaging technologies. In addition, during the fruit supply chain, the environment is usually dark, such as cold storage rooms, carriages, and packages, which makes it difficult to carry out spectral imaging detection. Therefore, there is a need to develop a technology that can detect deterioration in the quality of packaged fruits in a dark environment during the fruit supply chain.
Volatile substances (VOCs) are important indicators in evaluating fruit quality, especially when consumers buy peach fruits and the aroma of the fruit is an important consideration. VOCs, including aldehydes, esters, lactones, terpenes and other substances are abundant in fruits. Fruits produce VOCs during metabolism [10,11], including the postharvest period [12,13,14]. Studies show that the VOCs of fruit have relationships with the fruit quality [15,16,17]. Migliori, et al. [18] found that the VOCs of healthy and decayed tomato fruits were different. Therefore, VOCs are sensitive to the quality deterioration of fruit, and can be used as a characteristic to detect whether the fruit is mechanically damaged or not.
Electronic nose (e-nose) is a bionic olfactory system that can mimic a human olfactory sensor for VOC recognition [19]. An e-nose system is mainly composed of a sampling system, a gas sensor array and a signal processing system. The sensor array is the core component of the e-nose system that directly affects its sensitivity and accuracy. Metal oxide sensors are widely used in e-nose systems due to their low cost and high sensitivity [20,21,22]. E-nose has been used to detect the early spoilage and deterioration of blueberries [23], citrus [24], and apple juice [25] as well as the maturity of persimmon [26] and citrus [27]. Sanaeifar at al. [11] used an e-nose to predict the total soluble solids, titratable acidity, pH, and the firmness of banana at different shelf-life stages. Hui, et al. [28] successfully used an e-nose system with eight metal oxide semiconductors to distinguish fresh, medium, and aged apples. Di Natale et al. [29] predicted the presence of mealiness and skin damage of apple and storage days of oranges based on the variations in their aromas using e-nose. E-nose has also been used in practical applications, such as the space shuttle [30,31,32]. Feature extraction, measurement denoising, and pattern classification are important for e-nose analysis [33,34,35]. The use of both the steady-state output and temporal or transient information from tin-oxide sensors operating at different temperatures showed its capability of distinguishing various reducing chemicals [36]. In recent years, fluctuation enhanced sensing (FES) was developed to detect gas-phase chemicals [37,38]. Different from conventional approaches that mainly focus on steady-state values of the data that result from the interaction between a chemical sensor and the molecules it detects, FES exploits microfluctuations, which also contain characteristics of different agents, to increase the probability of detection and improve sensitivity and selectivity [39]. FES with a single chemiresistive microsensor has been used for the detection and classification of different gases [40]. In another study, a high-performance chemical and biological agent classification system was proposed to improve the commercial-off-the-shelf (COTS) sensors and other future nanosensors [41]. Currently, the e-nose technology has not been applied to detect compression damage in yellow peach.
For this reason, the aim of this study is to demonstrate the feasibility of applying the e-nose technology to the VOC analysis to predict the levels of compression damage of yellow peach, to discriminate the damaged fruit, and to predict the time after the damage. Multivariate statistical analysis was carried out for data calculation. Moreover, a gas chromatography-mass spectrophotometry (GC–MS) method was used to characterize the possible pattern of VOCs related to compression damage.

2. Materials and Methods

2.1. Sample Preparation

Yellow-fleshed peaches (Prunus persica L. Batsch cv. Jinxiu) at commercial maturity were harvested from an orchard in Jiaxing (Zhejiang Province, China) on August 10, 2019, and transported to the laboratory in Hangzhou (Zhejiang Province, China) on the same day of harvest. Yellow peach fruit, uniform in size, color, and maturity without mechanical injuries and pests, was selected for the experiments. The selected fruit was divided into three groups, namely, the group of fruit without compression damage (Group 0), the group of fruit compressed by 5 mm (Group I), and the group of fruit compressed by 15 mm (Group II). The compression test to obtain Group I and Group II was performed by the TA.XT Plus Texture Analyzer (Stable Micro Systems, Godalming, UK). A flat-end aluminum round disk probe, 10 mm in diameter, was used, and the compression depths were held constant at 5 mm and 15 mm for Group I and Group II, respectively. The compression speed was 2 mm/s. For Group I and Group II, the e-nose signals of the fruits were collected at 4, 8, and 24 h after the fruit was compressed. The e-nose measurement for Group 0 was at the same time as Group I and Group II. There were 30 fruits for each sampling time, resulting in 90 samples in each group. Before the acquisition of e-nose signal of the fruit, the fruit was sealed in a plastic box for 0.5 h to generate VOCs, and then 10 mL of gas was extracted with a syringe for the e-nose measurement. The used syringe was valve type airtight glass syringe with polytetrafluoroethylene (PTFE) switch (10 mL capacity).

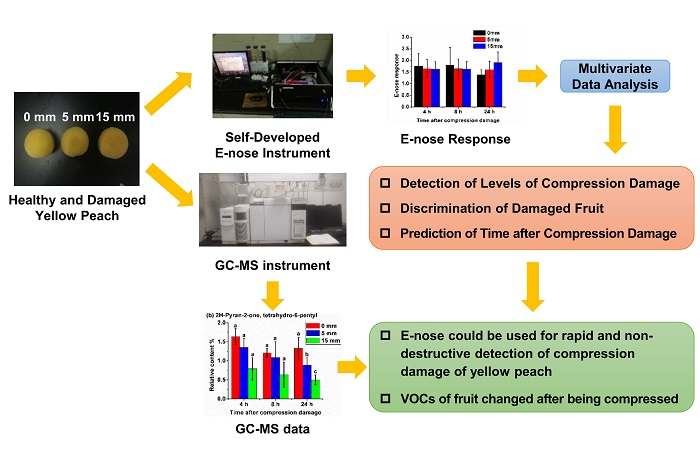
2.2. E-Nose Instrument and Data Acquisition

The e-nose instrument used was developed in-house, and is an updated version of the instrument mentioned in our previous work [42]. Similar to that work [42], this instrument had a gas sensor array, a gas filter and a data acquisition system (Figure 1). In contrast to that work, where the e-nose instrument had 10 sensors in the gas sensor array, this instrument had 14 Figaro TGS series sensors. Their properties are shown in Table 1. Some sensors were selected as their sensitive substances are related to fruit, such as VOC, organic vapors, and organic solvents. These sensors include TGS 2602 (S8), TGS 2620 (S12), TGS 822 (S4) and MQ-138 (S5). Other sensors were selected as they can provide stable signals and are available in the market. The response area of each sensor was used for further data analysis, resulting in 14 variables for each sample. For the parameters of e-nose acquisition, the detection temperature was 40 °C, the acquisition time was 200 s, and the detection and washing flow rates were 0.6 L/min and 2 L/min, respectively.

2.3. Multivariate Data Analysis

The acquisition process of e-nose data did not need to separate the VOCs into individual chemicals, but collected rather the VOCs as a whole. Therefore, the acquired e-nose signals represented the overall situation of the VOCs of the fruit. However, this also made it impossible to determine which e-nose sensors were functioning for the data analysis. Therefore, the e-nose signal needed to be processed by multivariate analysis algorithms to extract key information in the signal for modeling. Partial least squares regression (PLSR) is a widely used multivariate analysis method that is mainly used to build qualitative or quantitative models with discriminative or predictive functions [43]. PLSR finds the fundamental relationships between the variable matrix Y (the target attribute) and the variable matrix X (the e-nose data). During the calculation of PLSR, latent factors are extracted from the X matrix, and then the optimal functions are determined in order to reach the error sum squares. The least squares support vector machine (LS-SVM) is another classic multivariate analysis method with the capability of both linear and non-linear multivariate calibrations. The LS-SVM can solve the multivariate calibration problems in a relatively fast way. To obtain the support vectors, a linear set of equations is used in the LS-SVM instead of a quadratic programming problem [44]. The optimal values of the two main parameters in the LS-SVM model, namely the regularization parameter γ and the RBF kernel function parameter σ2, were determined using the grid-search technique with leave-one-out cross-validation.
Variable selection is an important step in multivariate data analysis. Among the 14 input variables obtained from the 14 sensors of the e-nose system, not all of them were useful in establishing the model. In this study, two classic variable selection algorithms were considered, namely the successive projections algorithm (SPA) and uninformative variable elimination (UVE). SPA selects variables with minimal redundancy through a projection operation in order to select variables with the minimum collinearity [45,46]. UVE eliminates the variables, in the modeling, with no more information other than noise by calculating the reliability of each variable [47].
The established model needed to be evaluated for accuracy and robustness. This process is usually performed using an independent sample set that distinguishes itself from the calibration sample set. When establishing each model in this study, two-thirds of the samples were selected for modeling, and the remaining one-third of the samples were used for verification of the model. The performances of the models, in predicting the levels of compression damage and the time after the damage, were based on the correlation coefficient of calibration (Rc), correlation coefficient of prediction (Rp), root-mean-square error of calibration (RMSEC), root-mean-square error of prediction (RMSEP), residual predictive deviation (RPD), and the absolute difference between the RMSEC and RMSEP (AB_RMSE). The performances of the models in distinguishing the damaged fruit were based on the correct answer rate (CAR), which is the ratio of the number of correctly identified samples to the total number of samples in the model. All calculation for the multivariate data analysis were carried out on MATLAB 2017b software (The MathWorks Inc., Natick, MA, USA).

2.4. GC–MS Non-Destructive Measurement

The VOCs from yellow peaches, as a whole, in all three groups at 4, 8, and 24 h after the fruit was compressed were non-destructively acquired and a GC–MS measurement was carried out using a 7860N-5973-C system (Agilent, Wilmington, DE, USA). Tests of each group at each timepoint were repeated four times. The detection procedure was as follows: a single whole fruit was placed in a beaker and sealed with Parafilm for 30 min; then, a SPME fiber (PDMS/DVB, 65 μm, capillary column, Supelco Co., Bellefonte, PA, USA) was used to extract the VOCs of the fruit in the beaker; after 30 min extraction, the fiber that adsorbed VOCs was inserted into the inlet and desorbed at 240 °C for 5 min for the GC–MS analysis. The main parameters of GC–MS were as follows: high-purity helium was used as carrier gas at a flow rate of 1.0 mL/min, and the column model was the DB-WAX quartz capillary column (30 m, 0.25 mm, 0.25 µm); the initial column temperature was 40 °C, and rose to 100 °C at a rate of 3 °C/min and 245 °C at a rate of 5 °C/min. The mass spectrometry parameters were: The ion source was an EI source, ionized at 70 eV of electron energy, the transfer temperature was 250 °C, and the ion source temperature was 230 °C.

3. Results

3.1. E-Nose Response of Peach Fruit

Table 2 shows the average response of the e-nose signal for samples with different levels of compression damage (0, 5, and 15 mm) and different times after compression (4, 8, and 24 h). It can be seen that different levels of compression damage and different time after compression made the e-nose signals different. When the e-nose signal was acquired at 4 h after the compression, the signal of the samples with different levels of compression damage was similar (Figure S1). When the time was 24 h, there were obvious differences in the e-nose signal between the different levels of compression damage, especially for sensors 1, 2, 5, 6, 8, 9, and 11, whose e-nose signals were positively correlated with the level of damage that the samples suffered (Figure S1). However, it can be seen from Table 2 that it was difficult to clearly distinguish between different levels of compression damage or the time after damage through a particular sensor. In particular, due to the differences among individual peach fruit samples, even if they suffered the same compression damage and were stored for the same time after being compressed, there was a large difference between their e-nose signals, such as the variance of the signal being large, which is very normal. Due to the positioning of the tree that each peach fruit was picked from, the location of the tree, the cultivation method, and the soil and other environmental conditions are different for different fruits, resulting in differences in the VOCs after each fruit suffered compression damage. Therefore, it is necessary to use multivariate data analysis to analyze the signals of all 14 sensors together and to establish chemometric models.

3.2. Detection of Levels of Compression Damage

In order to study whether the e-nose technology can be used to detect the levels of compression damage to peach fruits, the e-nose signals of all 14 sensors were used as independent variables in the model, the level of compression damage was used as a dependent variable, and PLSR and LS-SVM models were established, respectively. There were 30 samples for each compression level and each time after the compression; there were three levels of compression damage (0, 5, and 15 mm) and three kinds of time (4, 8, and 24 h), resulting in a total of 270 samples (30 samples × 3 levels × 3 times). Among them, 180 samples were selected by a sample set partitioning based on the joint X-Y distance (SPXY) algorithm [48] for the model calibration and the remaining 90 samples as the independent samples for prediction. Besides this, only the models for the samples stored for 4, 8, and 24 h after compression were established, respectively. For these models, 90 samples were used to establish the model (30 samples × 3 levels), and among them, 60 samples were selected by SPXY for calibration and the remaining 30 samples for prediction. The results of these models are shown in Table 3.
When samples from all three kinds of time were used for modeling, neither the PLSR nor the LS-SVM model could predict the level of compression damage suffered by the fruit. Only the fruit at 4 or 8 h after compression damage occurred was used for modeling, and still neither of the two modeling algorithms could obtain effective models. Only when the fruit at 24 h after compression damage occurred was used for modeling did, the LS-SVM algorithm obtain a good model, with an RPD value reaching 1.745 and a Rp value of 0.822. However, the corresponding PLSR model still could not obtain good prediction results. This shows that, after the yellow peach suffered compression damage, in a short period of time, such as 4 or 8 h, the changes in its VOCs were not enough to be reflected by the e-nose signal. At 24 h after damage, the VOCs of the yellow peach fruit could be used to establish an e-nose detection model, but the LS-SVM algorithm, capable of being used for nonlinear modeling, must also be used. Only the PLSR algorithm, which can be used for linear modeling, was still unable to predict the level of compression damage suffered by the peach fruit.
Two variable selection algorithms were further used to improve the prediction accuracy of the models. The variable selection calculation was performed for 24 h samples first. This is because when full variables were considered for modeling, only the LS-SVM model based on 24 h samples obtained good results. Two algorithms, UVE and SPA, were used for variable selection, and ten variables and two variables were obtained from all 14 variables, respectively. The selected variables were used for modeling, and the results are shown in Table 3.
Through the calculation of UVE, the established UVE-LS-SVM model has better prediction accuracy than the full-variable LS-SVM model, in which the RPD value increased by 22.58%, while the RMSEP value decreased by 18.41%. However, the PLSR model, based on the variables selected by UVE, could not improve the accuracy of the model. When the variables selected by SPA were used to establish the models, the accuracy of the prediction sample set was similar to that of the full-variable LS-SVM model, but the calibration sample set was significantly worse. It shows that although the calculation of SPA reduced the number of variables from 14 to 2, which is significant, these two variables were not enough to represent the overall VOCs in order to detect the level of compression damage. Besides the 24 h samples, UVE and SPA were also calculated for the 4 and 8 h samples, but no improvement was achieved.

3.3. Discrimination of Damaged Fruit

The levels of compression damage detection results show that the best UVE-LS-SVM model had the highest RPD, at 2.139, indicating that the model is usable for screening [49]. Besides the detection of the damage level, the discrimination of the damaged fruit is also important for the industry. Similar to Section 3.2, all 14 sensors were used for modeling, based on four kinds of sample sets, namely, all-time samples, 4 h samples, 8 h samples, and 24 h samples, and the results are shown in Table 4. When PLSR was used for modeling, all four kinds of sample sets failed to discriminate between samples, aalthough, from the perspective of overall accuracy, these models had a certain ability to distinguish the samples from the calibration sample set and the prediction sample set. However, looking specifically at the discrimination results for the healthy fruit and the damaged fruit, most samples from the calibration sample set and all the samples from the prediction sample set for the healthy fruit were judged to be the damaged samples. This shows that, in fact, these PLSR models had no ability to distinguish fruit damage. When the LS-SVM algorithm was used for modeling, the results of the LS-SVM models based on the all-time samples, 4 h samples, and 8 h samples were not good, which was similar to the results of the detection of levels of compression damage. Most healthy samples in the prediction sample set were judged to be damaged samples. When the 24 h samples were used for modeling, good discrimination results were obtained, not only from the overall discrimination results, in which the CARs of the calibration sample set and prediction sample set were 96.67% and 86.67%, respectively, but also from the healthy and damaged fruits, with most samples being correctly distinguished. Although looking at the overall discrimination results, the LS-SVM model established, based on the 24 h samples, had not improved much, as compared to the PLSR and LS-SVM models that were established based on other sample sets (CARS improved from between 60% and 80% to over 80%), but the discrimination results of healthy samples and damaged samples were much better. The feasibility of improving the accuracy of damage discrimination through variable selection was further evaluated. The results are shown in Table 4. Only the UVE-LS-SVM model achieved better discrimination accuracy. Among them, the calibration sample set reached 100% CAR, and the prediction sample set reached more than 90% CAR. Moreover, all damaged fruits were distinguished 100% of the time. The above results show that, when the compression damage occurred for 24 h, the VOCs of the yellow peach fruit could be used to determine whether the fruit had suffered compression damage.

3.4. Prediction of Time after Compression Damage
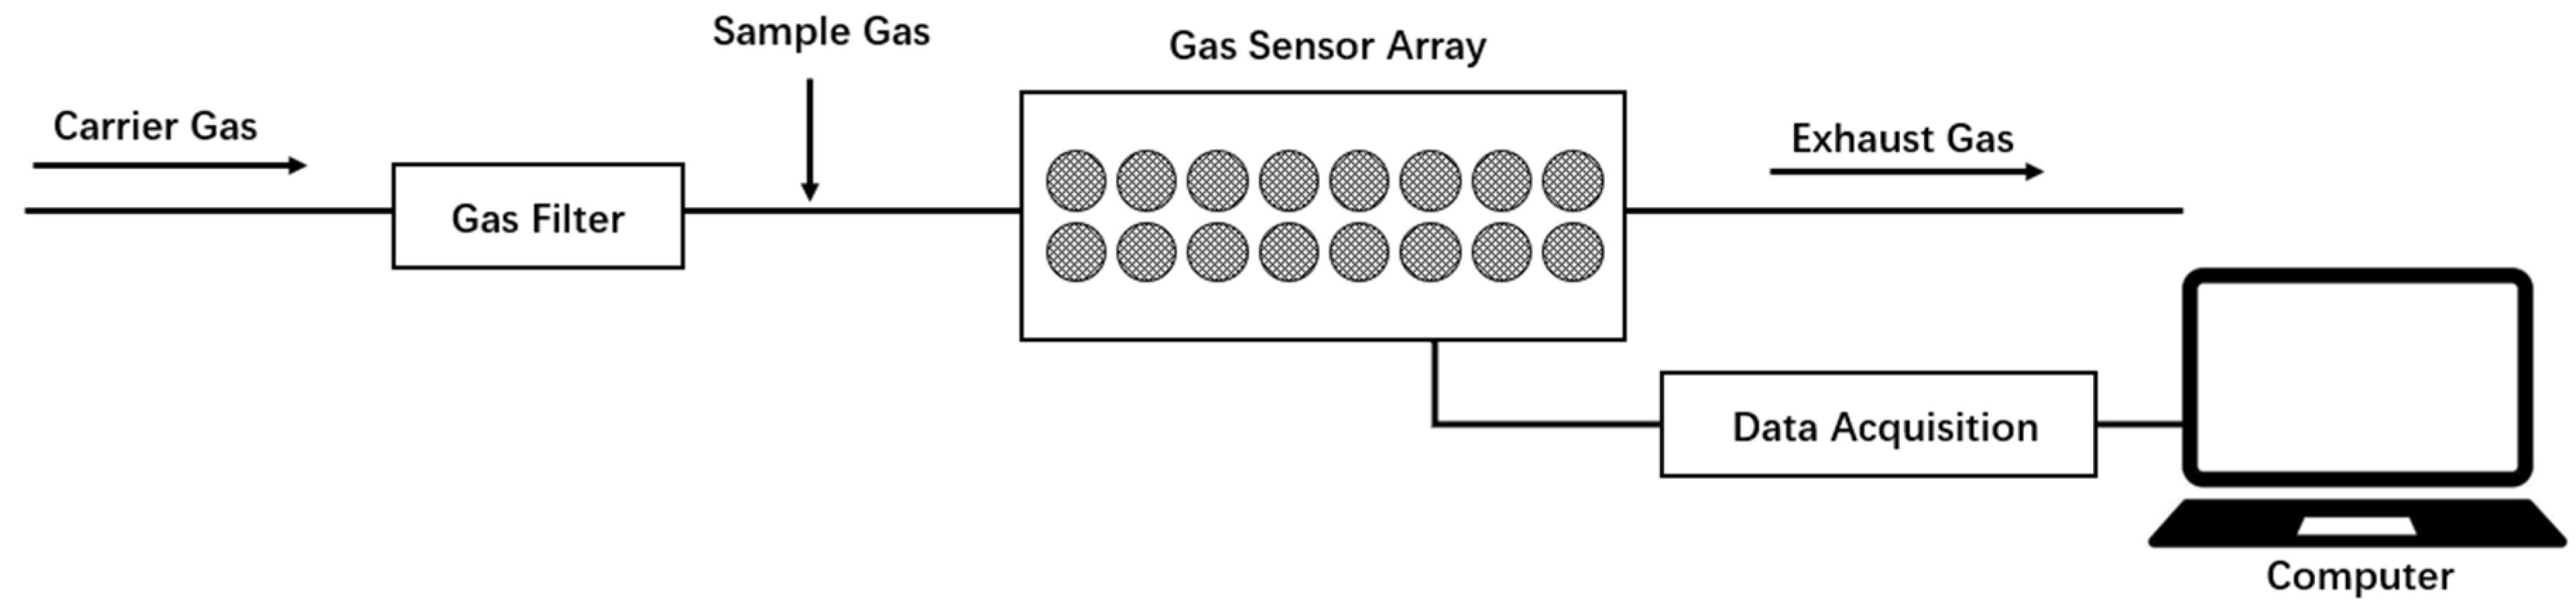
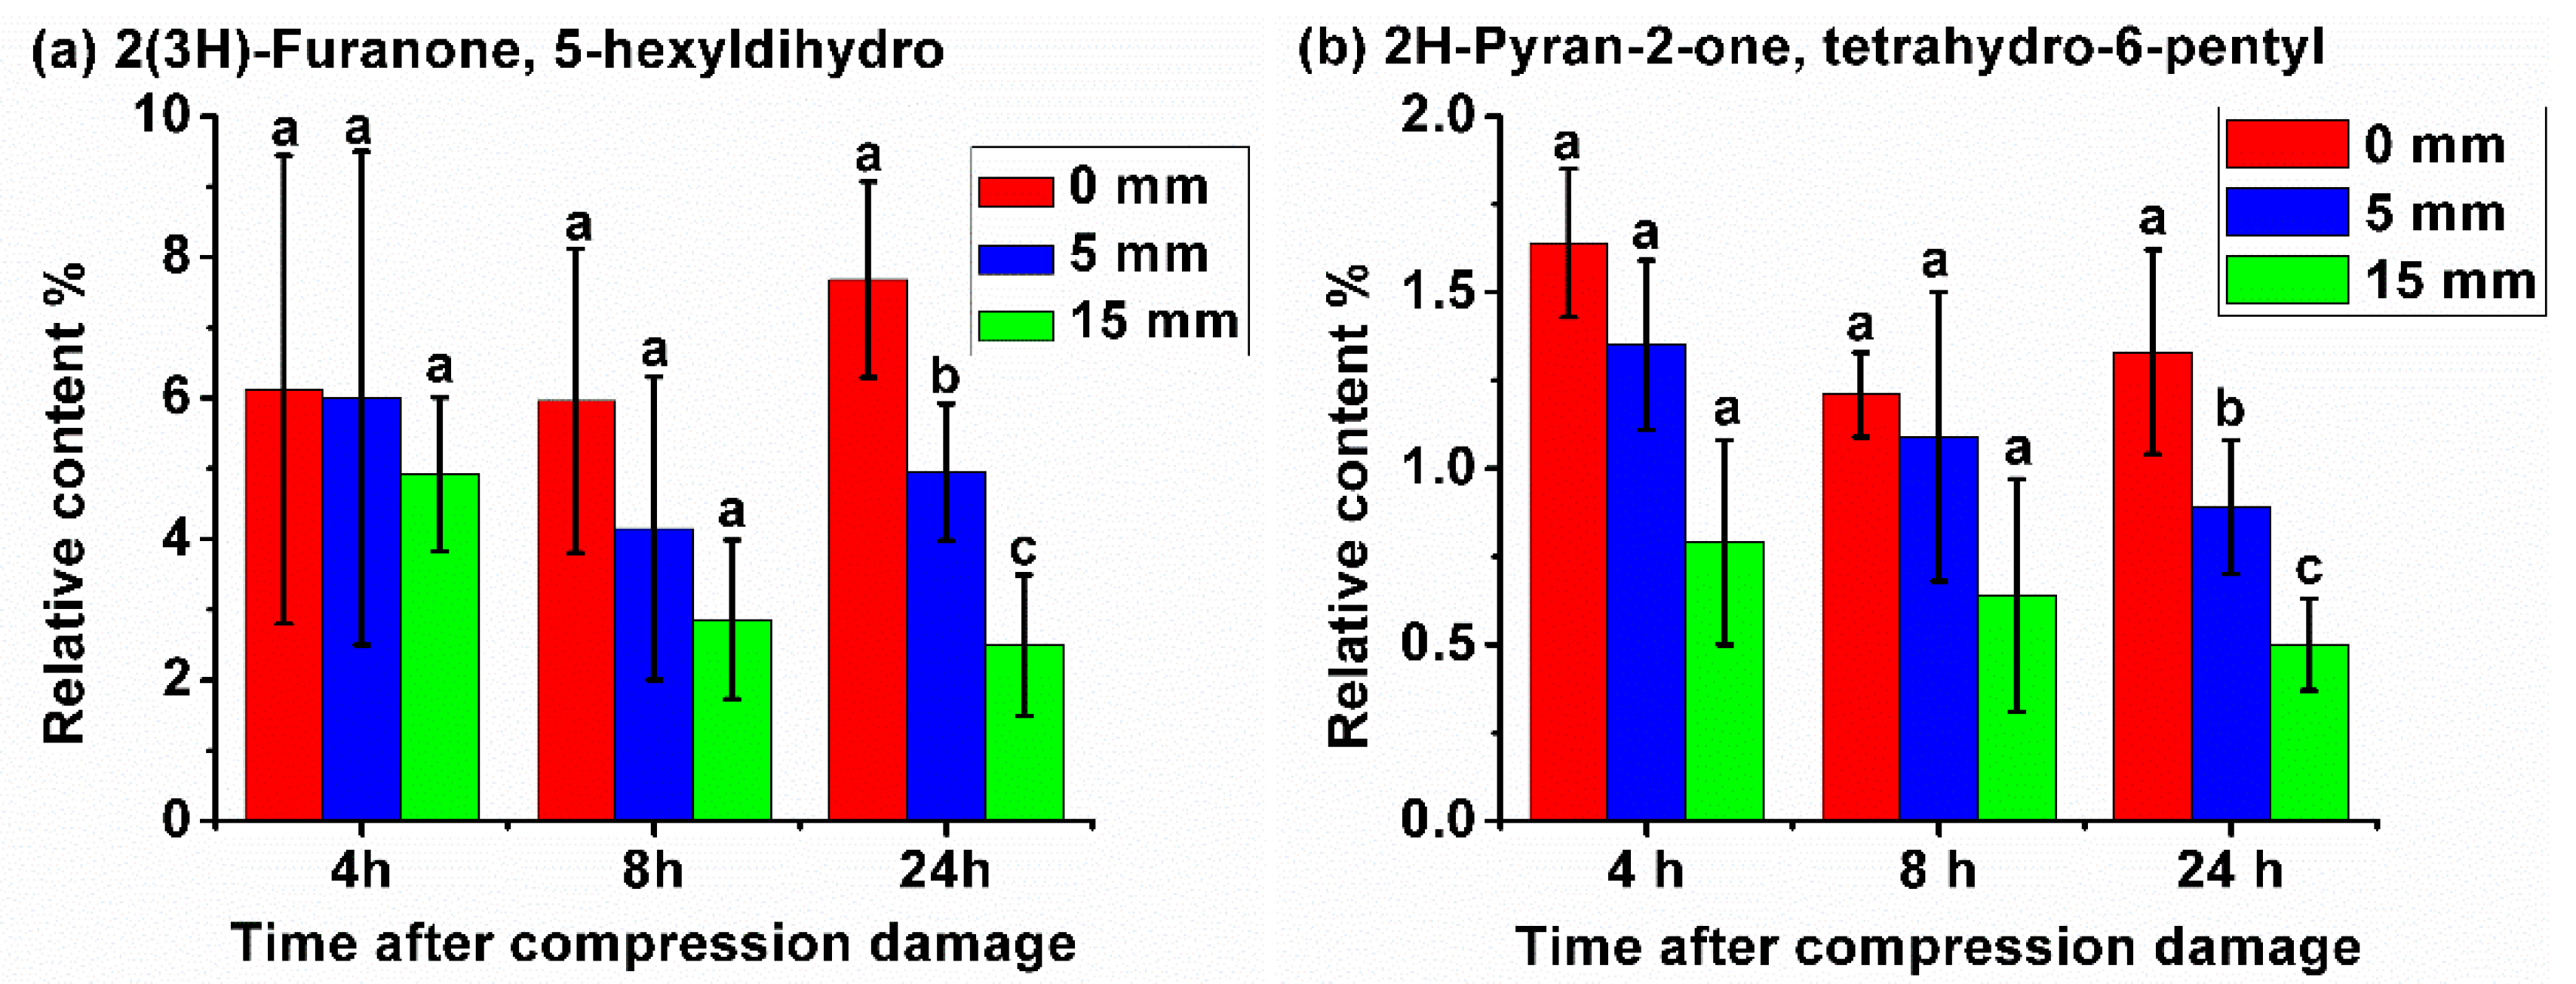
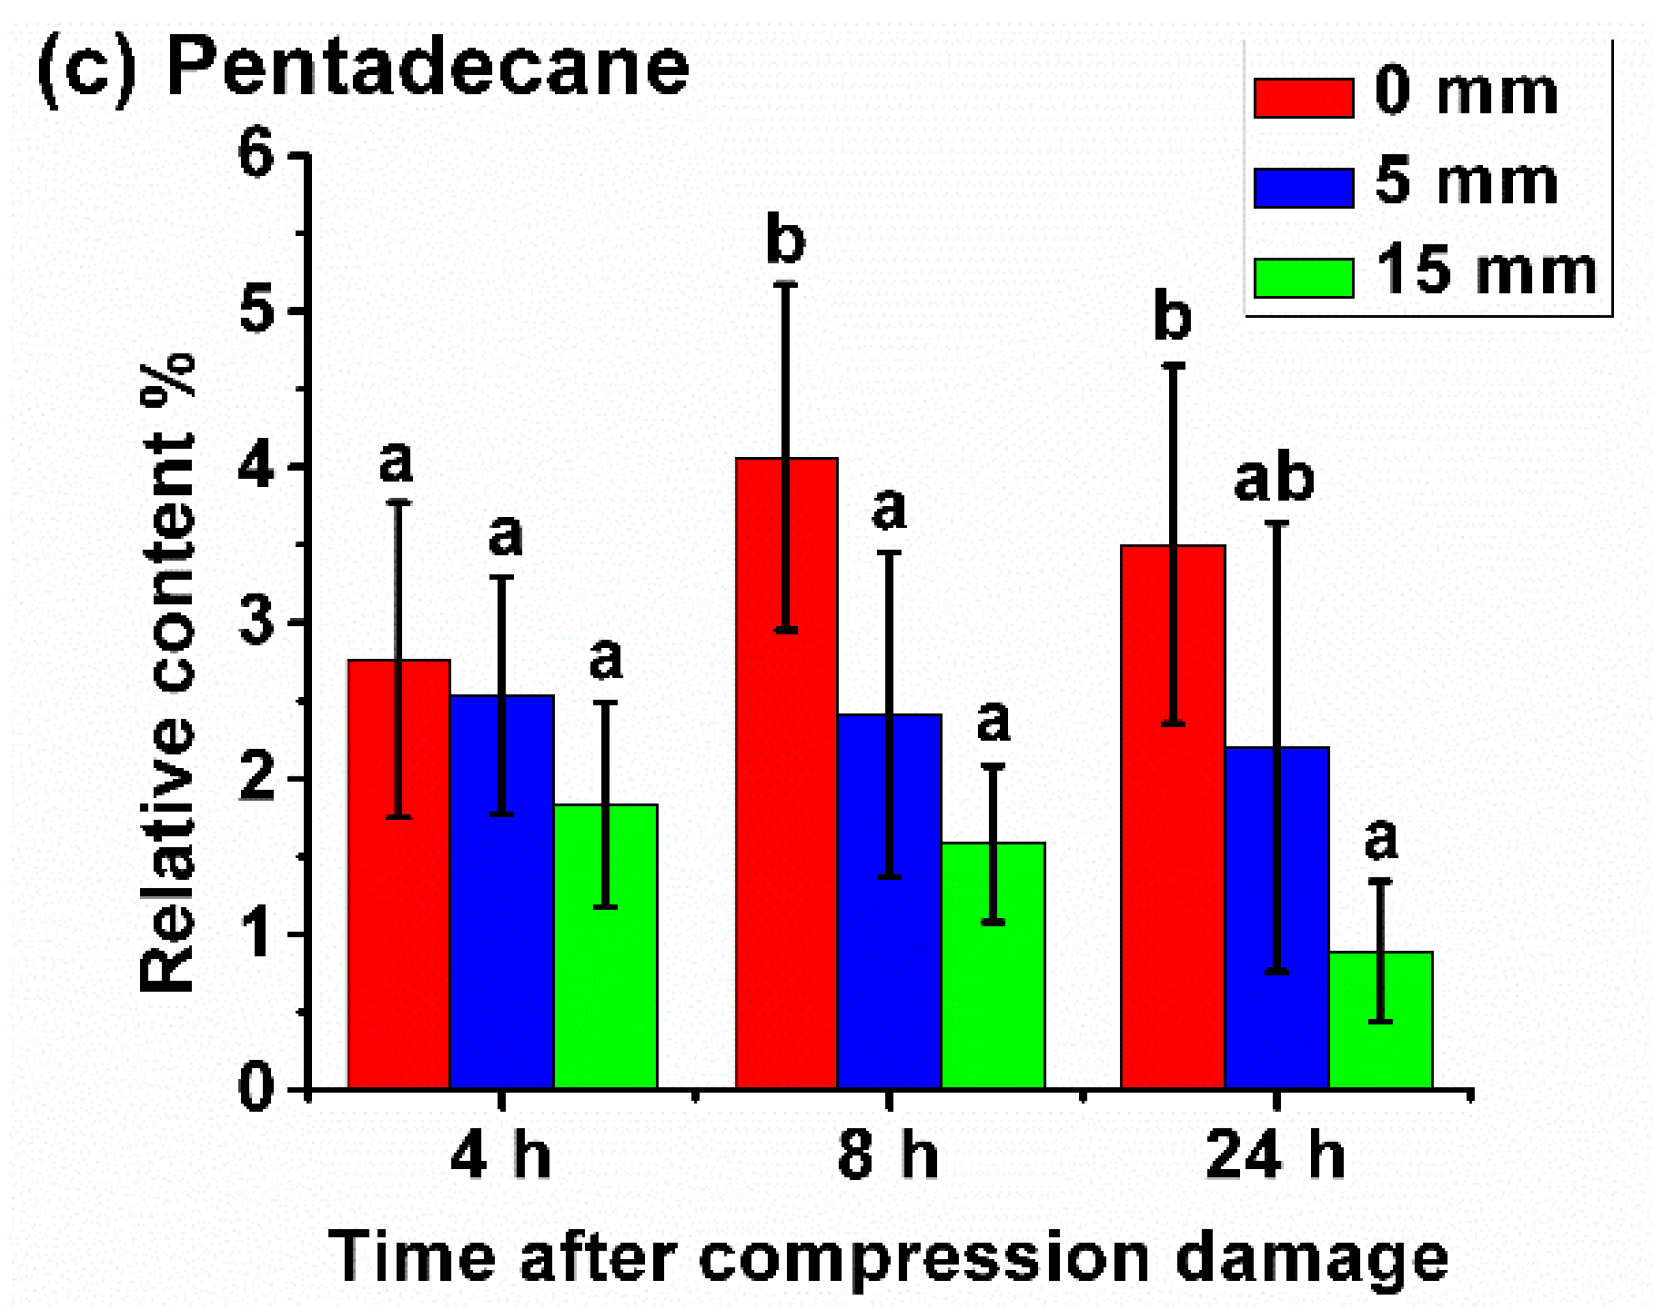
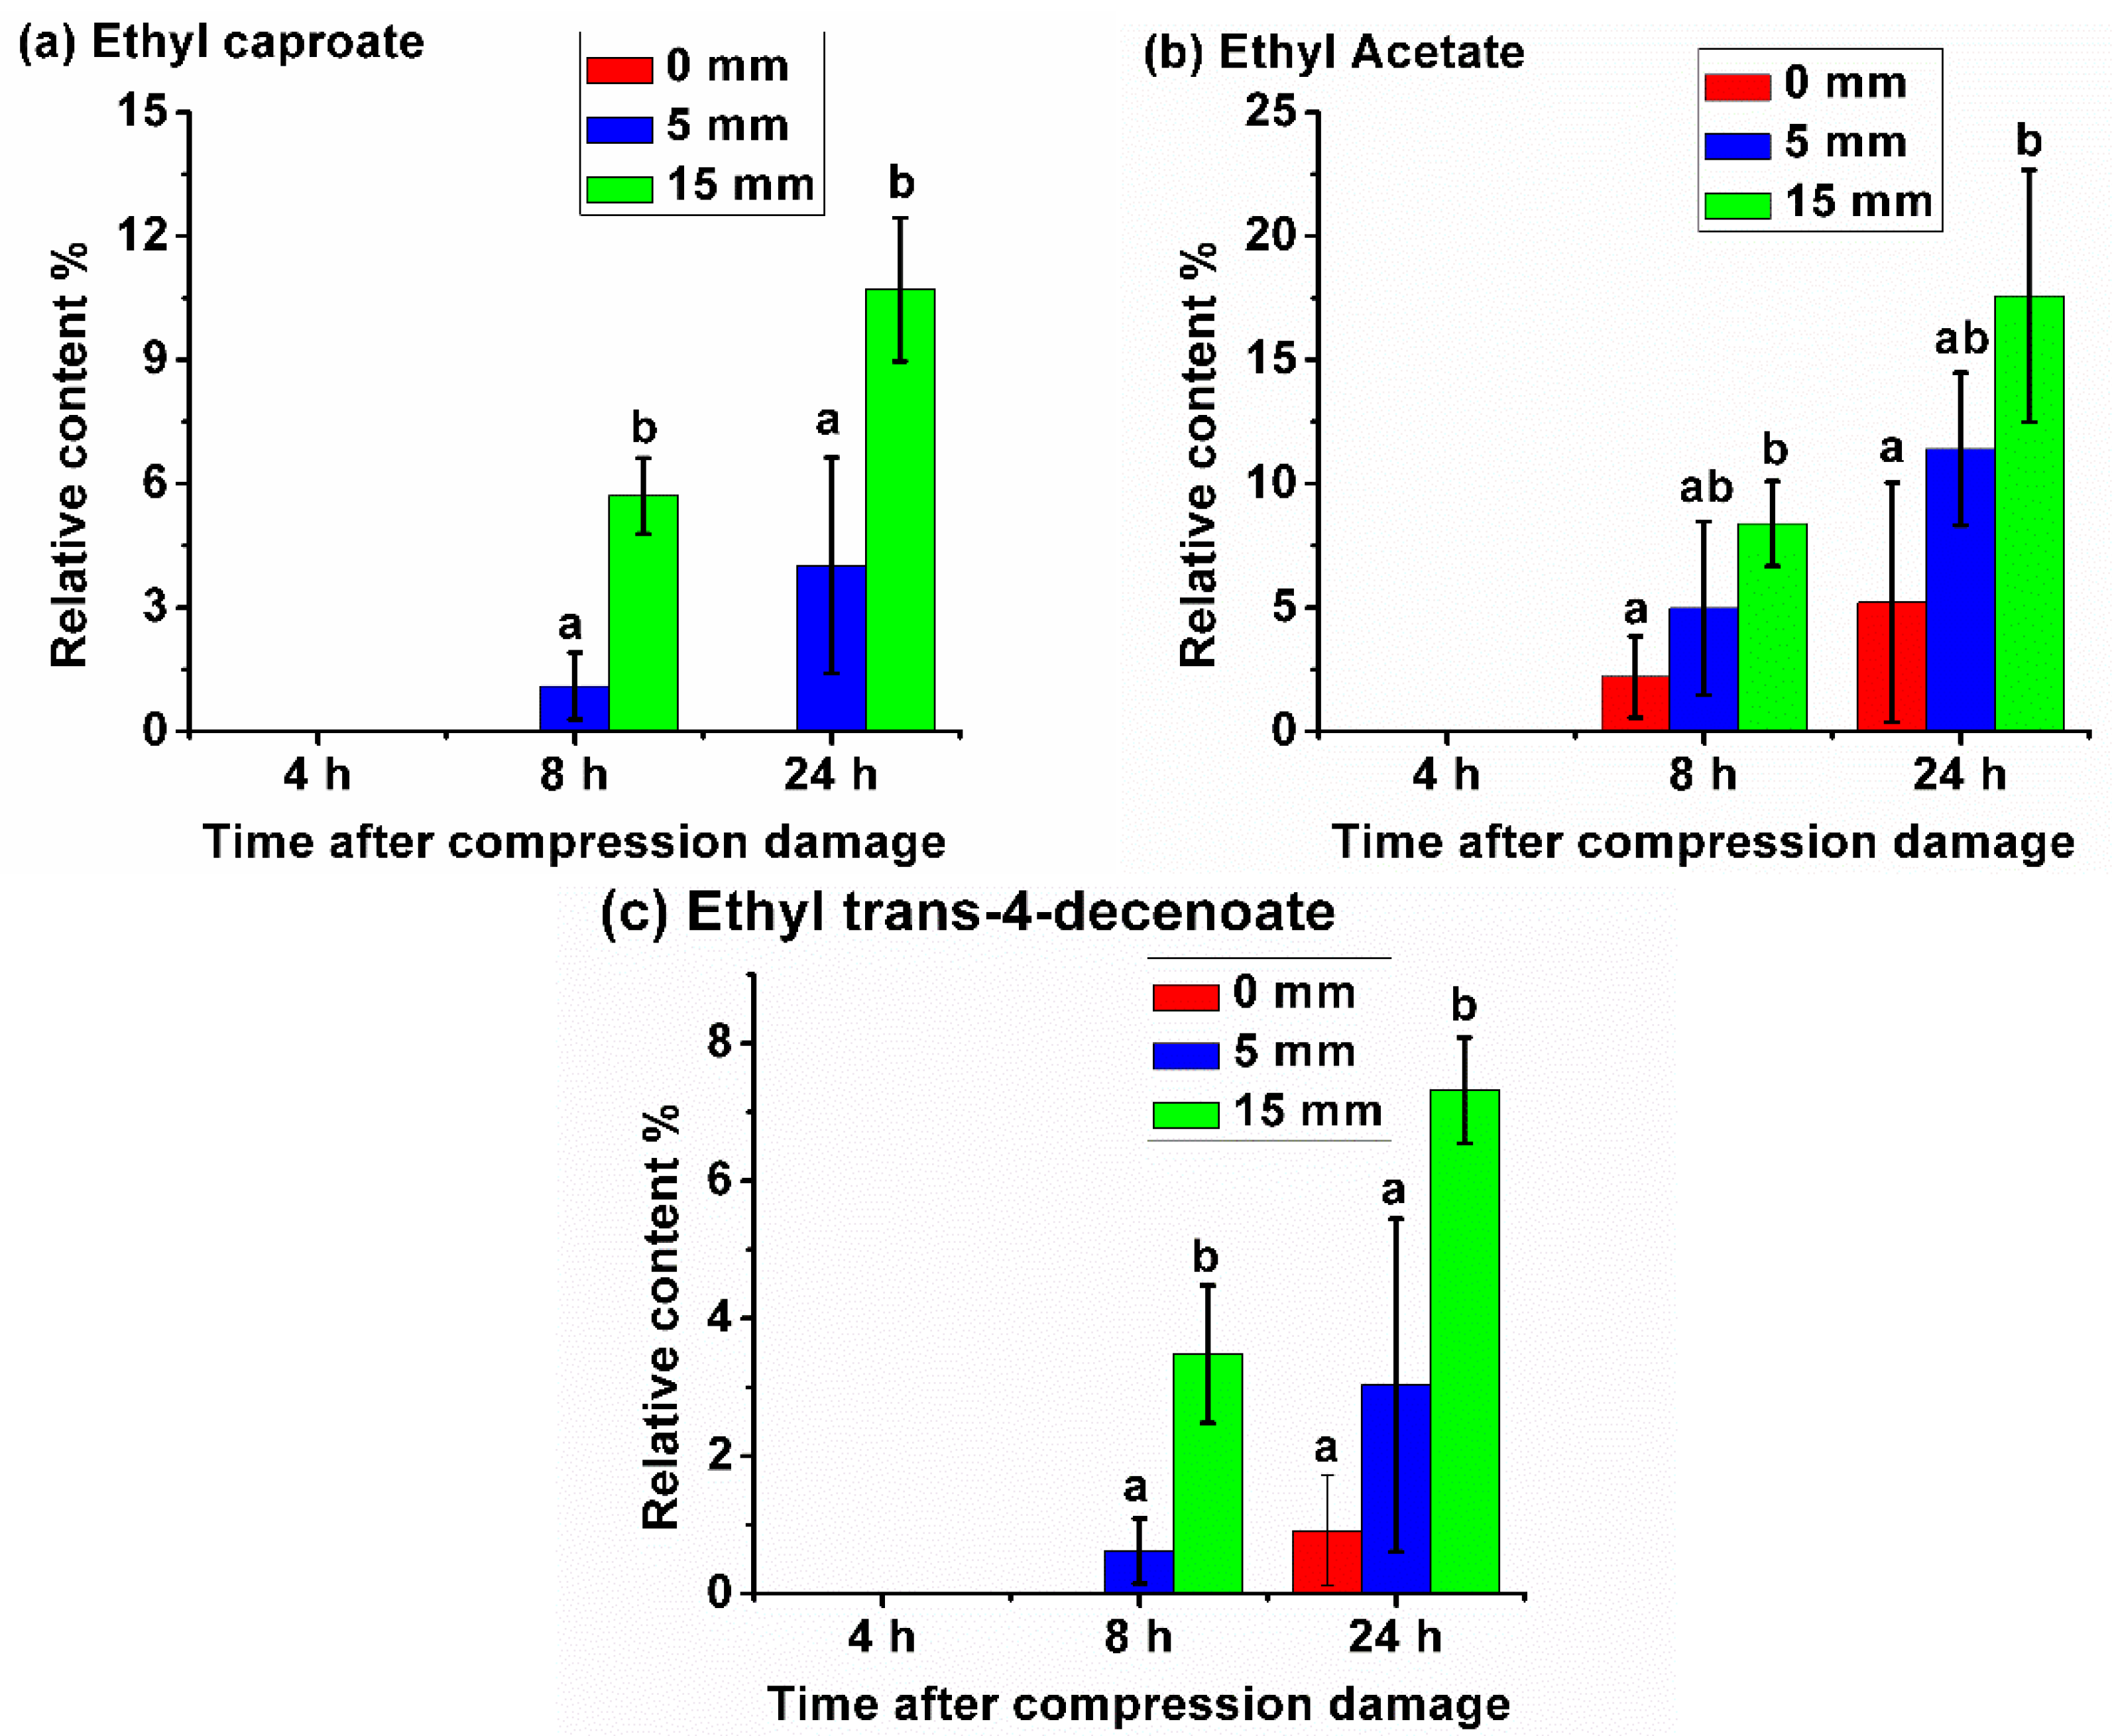
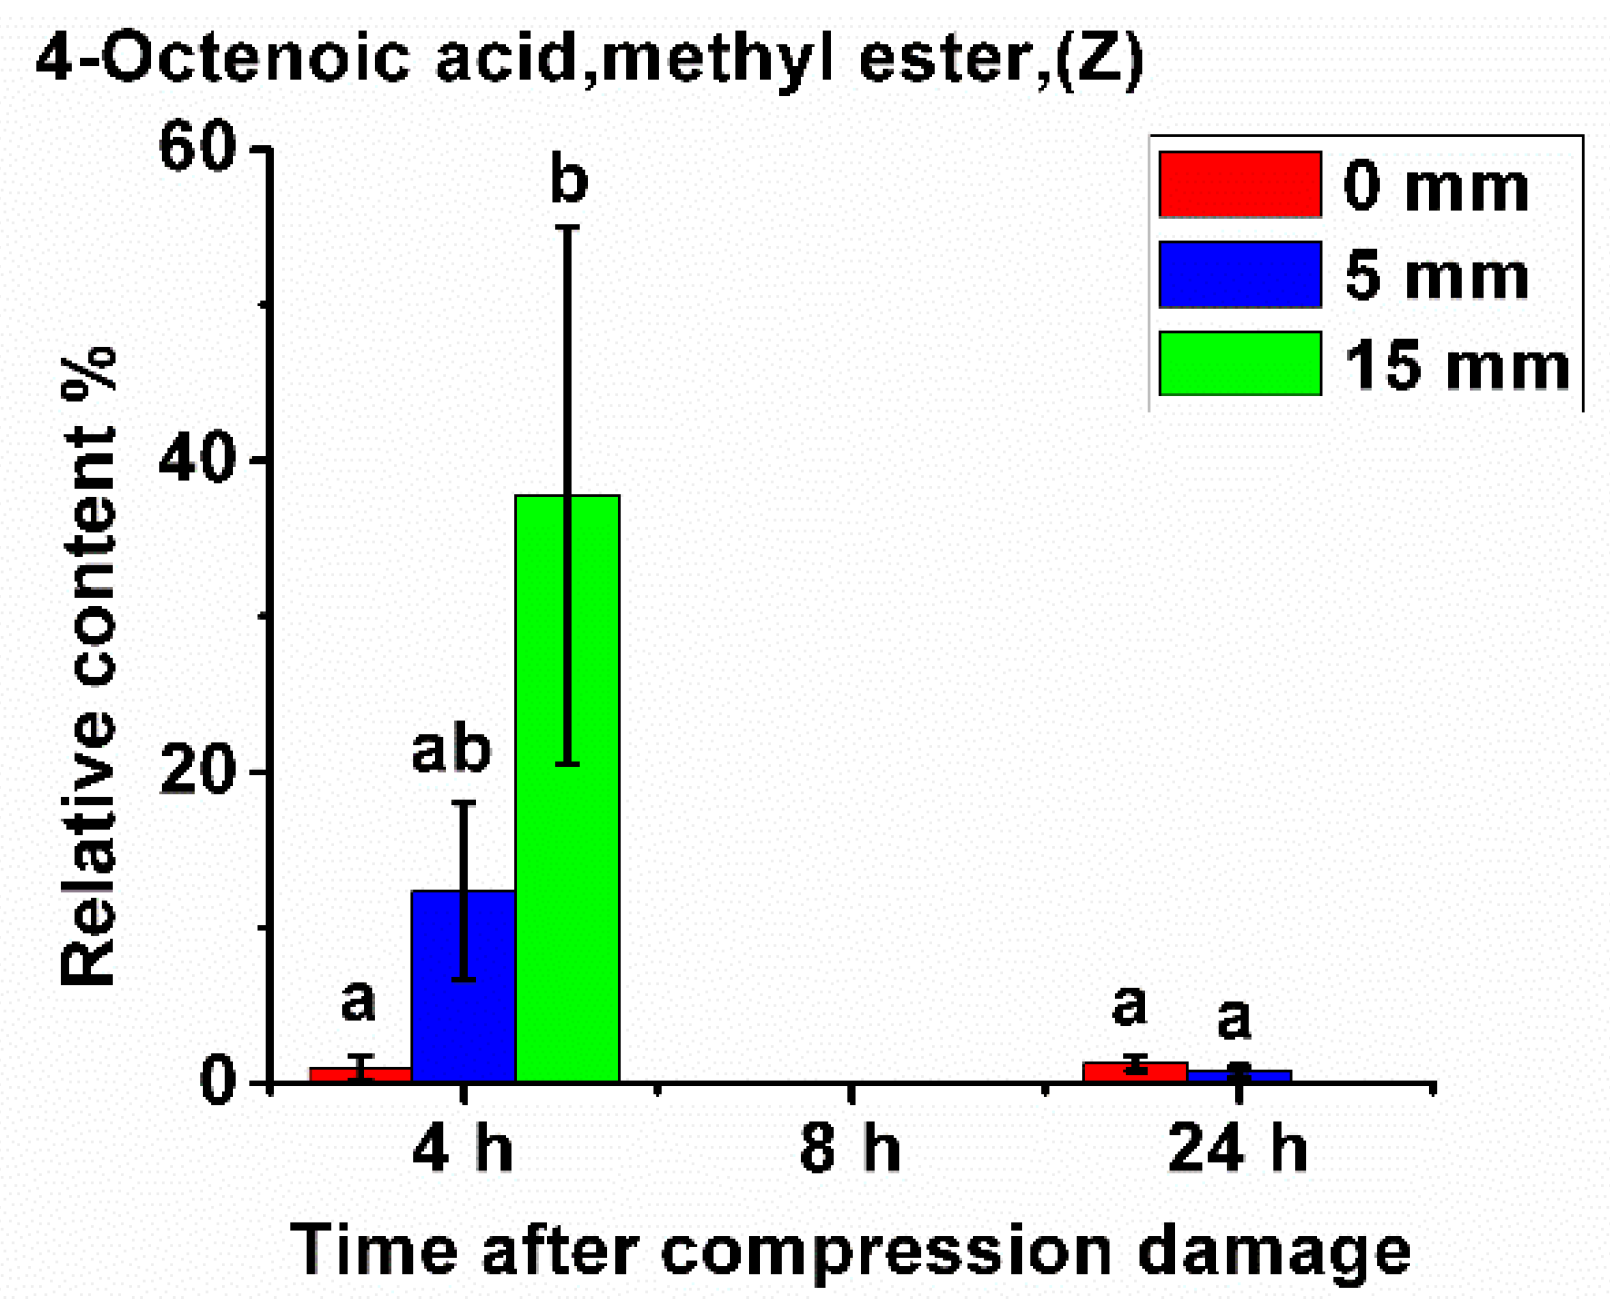
Predicting when compression damage occurred is very important in order to discover the cause of the compression damage and to optimize solutions for the fruit supply chain. Based on three samples sets, namely, the two sample sets of fruits compressed by 5 and 15 mm, respectively, and their combined sample set, the prediction models for the occurrence time of compression damage (4, 8, and 24 h) were established, respectively. The former two sample sets had 90 samples (30 samples × 3 times), respectively; 60 of them were selected by SPXY for calibration and the remaining 30 samples for prediction. The combined sample set had 180 samples, in which 120 of them were selected by SPXY for calibration and the remaining 60 samples for prediction. The results are shown in Table 5. When the fruit compressed by 5 mm was used for modeling, neither the PLSR algorithm nor the LS-SVM algorithm could establish a model that could be used to predict the occurrence time of compression damage. On the contrary, when the fruit compressed by 15 mm was used for modeling, both the PLSR and LS-SVM models obtained good prediction with RPD values of 1.959 and 2.114, respectively. Nevertheless, the PLSR model had a poorer calibration result than the LS-SVM model. When the fruits with two levels of compression damage were used for modeling together, both the PLSR and LS-SVM models had poor results. The variable selection of the e-nose data from the fruit compressed by 15 mm was further performed, and the results are shown in Table 5. It can be seen that neither the UVE nor the SPA algorithm could improve the prediction accuracy of the models. The above results show that, when the fruit suffered severe compression damage, such as 15 mm, the differences in the VOCs could be used to predict when the compression damage occurred. On the contrary, if the fruit suffered only light compression damage, such as 5 mm, the change in the VOCs of the fruit might not be enough to be detected by the e-nose system. Moreover, when the fruit suffered light mechanical damage, the fruit had the ability to heal itself [50,51], resulting in less difference of VOCs between the damaged fruit and healthy fruit, making it more difficult to detect whether the fruit had suffered mechanical damage.

3.5. GC–MS Analysis

GC–MS technology was used to analyze the changes of VOCs in the whole yellow peach fruit after compression damage. By analyzing the GC–MS results of yellow peach fruit in nine sample sets with three levels of compression damage and three kinds of time after compression, the VOCs of fruit were mainly esters, alkanes, benzene rings, phenols, and terpenes. Among them, esters were the most dominant, and their relative content was also the highest, accounting for 32.60–81.39%. After 4 h of compression damage, a total of 35 VOCs were detected, including esters (13), alkanes (10), benzene rings (5), terpenes (3), alcohol (1), phenol (1), ether (1), and ketone (1). After 8 h of compression damage, a total of 33 VOCs were detected, including esters (17), alkane (9), benzene rings (3), phenol (1), alcohol (1), thiazole (1), and pyrimidine (1). After 24 h of compression damage, a total of 34 VOCs were detected, including esters (19), alkane (9), terpene (1), benzene ring (1), phenol (1), alcohol (1), ether (1), and ketone (1).
Further analysis of the change in the content of each VOC was performed. It can be seen that there was a certain change between the content of some VOCs from the samples with different levels of compression damage and different times after damage. Among them, the relative content of three VOCs decreased with the increase in the level of compression damage (Figure 2). As shown in Figure 2a, for 5-hexyldihydro-2(3H)-furanone, 4 h after compression damage, its relative content was not significantly different from the samples with different compression damages. At 8 h, its content in the damaged samples was lower than that of the samples without compression damage, and the greater the compression damage, the lower the content; however, there was no significant difference between them. At 24 h, there was significant differences between the three compression treatments. In addition, when the fruit was subjected to 15 mm compression, its content decreased with time. For tetrahydro-6-pentyl-2H-pyran-2-one, as shown in Figure 2b, as the level and time of compression damage increased, its relative content decreased. While there was no significant difference between the samples of different compression treatments at 4 and 8 h, there was a significant difference between the samples of three compression treatments at 24 h. For Pentadecane, as shown in Figure 2c, as the level and time of compression damage increased, its relative content also decreased, and at 8 and 24 h, there was a significant difference between the healthy and damaged samples.
There were another three VOCs, whose relative content increased with the increase in the level of compression damage (Figure 3). For ethyl caproate, as shown in Figure 3a, nothing was detected in all three compression treatments at 4 h. Over time, the content of this VOC in the damaged fruit increased continuously, and there was a significant difference between the samples compressed by 5 and 15 mm. This VOC was never detected in the samples without compression damage at all storage times. For ethyl acetate, as shown in Figure 3b, nothing was detected in all three compression treatments at 4 h. As time increased, its content in healthy samples gradually increased, but its content in the samples that suffered compression damage increased more rapidly, and the more severe the compression, the higher the content increased. At 8 and 24 h, there was a significant difference between the healthy samples and the samples compressed by 15 mm. For ethyl trans-4-decenoate, as shown in Figure 3c, nothing was detected in all three compression treatments at 4 h. For healthy samples, only a small amount was detected at 24 h. For the samples compressed by 5 mm, only a small amount was detected at 8 h, and the content was more obvious at 24 h. For the samples compressed by 15 mm, the content was already evident at 8 h and significantly increased at 24 h.
In addition, as shown in Figure 4, after 4 h of compression damage, 4-(Z)-octenoic acid methyl ester was produced in the fruit, and its content was related to the level of compression damage. The more severe the compression, the higher its content. Its content in the fruit without compression damage was very low.
However, no 4-(Z)-octenoic acid methyl ester was detected after 8 h of compression damage, and the content was also very low at 24 h. This shows that a large amount of 4-(Z)-octenoic acid methyl ester was produced shortly after compression damage occurred, resulting in a significant increase in its content; however, with the increase of time after damage, its content decreased. This may be due to the metabolic process of degradation in 4-(Z)-octenoic acid methyl ester, in the fruit.
To show which of the 14 e-nose sensors responds best to a given volatile compound in the case of yellow peach, the relative contents of seven volatile compounds determined by GC-MS and shown in Figure 2, Figure 3, and Figure 4 were correlated with the responses of the e-nose sensors by PLSR calculation. The contents of these volatile compounds changed after being compressed. Therefore, these compounds were selected for calculation. The regression coefficients of PLSR models show that sensors 10, 8 and 6 were important to predict the content of 5-hexyldihydro-2(3H)-furanone, sensors 8, 9 and 13 were important to predict the content of tetrahydro-6-pentyl-2H-pyran-2-one, sensors 8, 13 and4 were important to predict the content of pentadecane, sensors 8, 2 and 11 were important to predict the content of ethyl caproate, sensors 8 and 2 were important to predict the content of ethyl acetate, sensors 8 and 2 were also important to predict the content of ethyl trans-4-decenoate, and sensors 13, 8 and 4 were important to predict the content of 4-(Z)-octenoic acid methyl ester.

4. Discussion

Previous studies found that the VOCs of fruit changed during its development and ripening [15,52]. Besada et al. [15] identified VOCs associated with immature stages, intermediate maturity stages and ripening and correlated VOCs with loquat aroma/flavor. Song et al. [52] characterized VOCs of jujube fruits at different ripening stages. Other studies also found that postharvest treatments can affect VOC production in fruit [53,54]. According to Lu et al. [53], although the aroma production of apple fruit during storage was significantly inhibited by 1-MCP treatment of 1.0 μL L−1, (1-MCP 0.6 +Ca) treatment promoted VOC production by improving the enzyme activities of alcohol dehydrogenase (ADH), pyruvate decarboxylase (PDC) and aromatase-related acyltransferase (AAT). The results of Echeverría et al.’s [54] work show that VOCs of Fuji apples kept under different storage conditions were different. In addition, pathogenic fungal diseases and pests were found to affect the VOCs of fruit [55,56,57]. Pan et al. [55] identified several key VOCs for infection treatment of strawberry fruit on day 2. According to Wen et al. [56], the VOCs of citrus fruits infested by Bactrocera dorsalis (Hendel) were different. Liu et al. [57] found that changes in VOCs in fungi-inoculated peaches were correlated with total amounts and species of fungi. In our work, the e-nose and GC–MS results showed that the VOCs of yellow peach fruit changed after being compressed. The difference of VOCs and their content in samples with different compression levels and time was the reason that the e-nose technology could be used for the rapid and non-destructive detection of compression damage in yellow peach. Considering that fruit is usually stored in packaging boxes during supply chain, the detection of mechanical damage, based on VOCs, will be more suitable than optical detection technology for application in the fruit supply chain.
By using an array of sensors to simulate olfactory, e-nose systems have been used to detect fruit quality. Li et al. [58] used e-nose to predict quality of Chinese bayberry, resulting in an accuracy of 95%. Zhang et al. [26] assessed soluble solids content of persimmon fruit picked on different dates using e-nose technique. An average prediction accuracy of 91.36% was obtained by support vector machine models. Our previous study found that the VOCs of peach fruit could be used to rapidly and non-destructively detect fruit decay [59]. The CAR value of the best model to classify decayed fruit was 95.83% (94.64% for healthy samples and 100.00% for decayed samples). The RPD value of the best model to predict the storage days of peach fruit was 9.283. Other studies were also carried out using e-nose to detect plant quality. Rusinek et al. [21] used an e-nose technique to identify the loss in the rapeseed quality during storage. A new three-parameter method based on the impregnation time, cleaning time, and maximum response was proposed to electronic fingerprints, which could distinguish the rapeseed samples infected with microflora. In another study, this three-parameter method was used to assess the quality of cold-pressed rapeseed oil and then to determine the pre-pressing treatment of rapeseed [22]. The above studies show that e-nose was an efficient, rapid and non-destructive method to analyze the VOCs of samples and to determine the quality of samples. Especially for the mechanical damage of fruit, previous works have been carried out to detect impact damage using e-nose technique. Demir et al. [60] classified fresh blueberries with impact damage, based on their VOCs during storage. E-nose data of blueberries were acquired on days 0, 2, 10, 17 and 24 after the impact treatment. Discriminant function analysis was used to classify samples, resulting in correct classification rates of 0, 100, 100, 100 and 100% for days 0, 2, 10, 17 and 24, respectively. Volatiles of fruit on day 0 had no significant difference. In another study, Ren et al. [61] determined the damage degree of apples dropped from different heights using e-nose, coupled with multivariate statistical analyses. Back-propagation neural network model obtained good classification of damaged apples. In our study, based on the variation of VOCs in yellow peach fruits, the non-destructive detection of compression damage was performed using e-nose technology. It should be noted that, among the various mechanical damages that the fruit suffered during the postharvest supply chain, compared to the impact and vibration damages, compression damage usually causes less damage to the fruit, and so it is more difficult to carry out the detection of compression damage through the VOCs in fruit. Moreover, besides the classification of damaged fruits like previous work did, the levels of compression damage were also detected based on the e-nose data of peach fruit in this work. The detection of damage levels can provide more detailed information on the damage, which is important for the fruit industry.
In addition, previous works on the detection of mechanical damage of fruit mainly focused on the classification of damaged fruit or detection of damage levels [60,61]. As it is impossible to know when the compression damage occurred in the fruit supply chain, and because the fruit continues to undergo metabolism after compression damage, there are continuous changes in the VOCs of fruit. Therefore, this study also carried out a comparative study of models established based on the samples at different times after compression damage, so that the established models are more in line with the actual situation.
To further develop a dedicated e-nose detection instrument, it is necessary to analyze the changing rules and mechanisms of the VOCs in the fruit, as a whole, caused by mechanical damage. This study performed a non-destructive GC–MS analysis of the VOCs of yellow peach, and the results show that the compression damage did cause changes in the VOCs of the fruit. Previous studies also used GC–MS technology to find differences in the VOCs of fresh-cut broccoli with different freshness levels [62], and found that the VOCs of strawberry fruit also changed after being infected with the disease [55]. However, in these studies, the fruit was cut and blended for VOC extraction and GC–MS analysis. Nevertheless, the VOCs released after the fruit is damaged during the supply chain are from the whole fruit, not the blended pulp. Therefore, the acquisition of both the e-nose signal and the GC–MS data in this study was from the whole fruit, not the pulp.
Chemometric analysis is an important step for e-nose study and application. For the two multivariate analysis algorithms used in this study, the results of the LS-SVM models were better than the PLSR models. This is similar to previous research [59,63], indicating that the nonlinear modeling algorithm is more suitable for the data analysis of the e-nose instruments based on metal oxide sensors.
Before the practical application, some other issues need to be solved based on this primary study. First, this study only simulated the compression damage of yellow peach fruit. During the supply chain, the fruit suffers from a variety of mechanical damages. These mechanical damages can also cause a combination change in the VOCs of the fruit. Therefore, further research is needed for these mechanical damages. Second, in this study, the ambient temperature for e-nose signal collection was 20 °C. Nevertheless, a cold chain environment was commonly considered during the fruit supply chain, and the released VOCs of fruit at different temperatures were different. Therefore, in further research, the effect of different temperatures on the detection of fruit mechanical damage needs to be considered. Thirdly, more fruit samples from different harvest years, orchards, varieties, planting pattern and climates are required to make the models more practically applicable. In addition, the small size and low cost of e-nose instruments are important. The former will facilitate the installation in transport boxes, cold storage rooms, refrigerators, and carriages, while the latter will facilitate the industrialization of the instruments.

5. Conclusions

This study investigated the feasibility of using the e-nose technology for the rapid and non-destructive detection of the compression damage of yellow peach. The results show that, at 24 h after the compression damage, the levels of compression damage could be predicted, and the best UVE-LS-SVM model had the highest RPD of 2.139, whereas the models established based on the e-nose data, collected at 4 and 8 h after the damage were not good. The results of the discrimination of damaged fruit also show that the VOCs of the yellow peach fruit could be used to determine whether the fruit has suffered compression damage when the compression damage occurred for 24 h. The CAR for prediction was 93.33%, and all damaged fruit was correctly identified. The time when the compression damage occurred could be predicted when the fruit suffered severe compression damage, such as 15 mm (which is used in this study). Light compression damage, such as 5 mm (which is used in this study) could not cause a sufficiently large change of VOCs to be used to predict the time after damage using e-nose technology. The results of GC–MS identified that three VOCs decreased, and three other VOCs increased, with the increase of the level of compression damage, showing that the VOCs of yellow peach fruit changed after being compressed, which was the basis for e-nose to detect the compression damage of yellow peach. This study opens up an attractive prospect for using the e-nose technology in the non-destructive detection of fruit damage during the postharvest supply chain.

Supplementary Materials

The following are available online at https://www.mdpi.com/1424-8220/20/7/1866/s1, Figure S1: Electronic nose (e-nose) and gas chromatography-mass spectrophotometry (GC–MS) spectral examples of yellow peach from three groups at 4, 8, and 24 h after the fruit was compressed. 0 mm: fruits without compression damage (Group 0), 5 mm: fruits compressed by 5 mm (Group I), 15 mm: fruits compressed by 15 mm (Group II).

Author Contributions

Conceptualization, D.W. (Di Wu) and X.Y.; Data curation, J.C. and X.Y.; Formal analysis, J.C., X.Y., L.J., W.W., and S.L.; Funding acquisition, D.W.; Investigation, X.Y., J.C., W.Y., D.W. (Da Wang), and S.T.; Methodology, D.W. (Di Wu) and S.T.; Project administration, D.W. (Di Wu); Resources, D.W. (Di Wu) and S.T.; Software, D.W. (Di Wu) and S.T.; Supervision, D.W. (Di Wu); Validation, D.W. (Di Wu) and X.Y.; Visualization, X.Y. and J.C.; Writing—original draft: X.Y. and J.C.; Writing—review & editing: D.W. (Di Wu). All authors have read and agreed to the published version of the manuscript.

Funding

This research was funded by the National Key R&D Program of China (2017YFD0401303 and 2017YFD0401302), Zhejiang Provincial Key R&D Program of China (2019C02074), the National Natural Science Foundation of China (31972201), and Zhejiang Provincial Collaborative Innovation Center of Food Safety and Nutrition (2017SICR104).

Conflicts of Interest

The authors declare no conflict of interest.

References

  1. Byrne, D.H.; Raseira, M.B.; Bassi, D.; Piagnani, M.C.; Gasic, K.; Reighard, G.L.; Moreno, M.A.; Pérez, S. Peach. In Fruit Breeding; Badenes, M.L., Byrne, D.H., Eds.; Springer: Boston, MA, USA, 2012; pp. 505–569. [Google Scholar]
  2. Gil, M.I.; Tomás-Barberán, F.A.; Hess-Pierce, B.; Kader, A.A. Antioxidant capacities, phenolic compounds, carotenoids, and vitamin C contents of nectarine, peach, and plum cultivars from California. J. Agric. Food Chem. 2002, 50, 4976–4982. [Google Scholar] [CrossRef] [PubMed]
  3. Vizzotto, M.; Cisneros-Zevallos, L.; Byrne, D.H.; Ramming, D.W.; Okie, W. Large variation found in the phytochemical and antioxidant activity of peach and plum germplasm. J. Am. Soc. Hort. Sci. 2007, 132, 334–340. [Google Scholar] [CrossRef] [Green Version]
  4. Brandi, F.; Bar, E.; Mourgues, F.; Horváth, G.; Turcsi, E.; Giuliano, G.; Liverani, A.; Tartarini, S.; Lewinsohn, E.; Rosati, C. Study of ‘Redhaven’ peach and its white-fleshed mutant suggests a key role of CCD4 carotenoid dioxygenase in carotenoid and norisoprenoid volatile metabolism. BMC Plant Biol. 2011, 11, 24. [Google Scholar] [CrossRef] [PubMed] [Green Version]
  5. Yu, Y.-B.; Yang, S.F. Biosynthesis of wound ethylene. Plant Physiol. 1980, 66, 281–285. [Google Scholar] [CrossRef] [PubMed] [Green Version]
  6. Li, J.; Yan, J.; Cao, J.; Zhao, Y.; Jiang, W. Preventing the wound-induced deterioration of Yali pears by chitosan coating treatments. Food Sci. Technol. Int. 2012, 18, 123–128. [Google Scholar] [CrossRef]
  7. Polashock, J.J.; Saftner, R.A.; Kramer, M. Postharvest highbush blueberry fruit antimicrobial volatile profiles in relation to anthracnose fruit rot resistance. J. Am. Soc. Hort. Sci. 2007, 132, 859–868. [Google Scholar] [CrossRef] [Green Version]
  8. Wu, D.; Sun, D.-W. Advanced applications of hyperspectral imaging technology for food quality and safety analysis and assessment: A review—Part I: Fundamentals. Innov. Food Sci. Emerg. Technol. 2013, 19, 1–14. [Google Scholar] [CrossRef]
  9. Wu, D.; Sun, D.-W. Advanced applications of hyperspectral imaging technology for food quality and safety analysis and assessment: A review—Part II: Applications. Innov. Food Sci. Emerg. Technol. 2013, 19, 15–28. [Google Scholar] [CrossRef]
  10. Baietto, M.; Wilson, A.D. Electronic-nose applications for fruit identification, ripeness and quality grading. Sensors 2015, 15, 899–931. [Google Scholar] [CrossRef]
  11. Sanaeifar, A.; Mohtasebi, S.S.; Ghasemi-Varnamkhasti, M.; Ahmadi, H. Application of MOS based electronic nose for the prediction of banana quality properties. Measurement 2016, 82, 105–114. [Google Scholar] [CrossRef]
  12. Horvat, R.; Chapman, G., Jr.; Robertson, J.; Meredith, F.; Scorza, R.; Callahan, A.; Morgens, P. Comparison of the volatile compounds from several commercial peach cultivars. J. Agric. Food Chem. 1990, 38, 234–237. [Google Scholar] [CrossRef]
  13. Chen, J.L.; Wu, J.H.; Wang, Q.; Deng, H.; Hu, X.S. Changes in the volatile compounds and chemical and physical properties of Kuerle fragrant pear (Pyrus serotina Reld) during storage. J. Agric. Food Chem. 2006, 54, 8842–8847. [Google Scholar] [CrossRef] [PubMed]
  14. Hui, G.; Wu, Y.; Ye, D.; Ding, W.; Zhu, L.; Wang, L. Study of peach freshness predictive method based on electronic nose. Food Control 2012, 28, 25–32. [Google Scholar]
  15. Besada, C.; Salvador, A.; Sdiri, S.; Gil, R.; Granell, A. A combination of physiological and chemometrics analyses reveals the main associations between quality and ripening traits and volatiles in two loquat cultivars. Metabolomics 2013, 9, 324–336. [Google Scholar] [CrossRef]
  16. Mayuoni-Kirshinbaum, L.; Daus, A.; Porat, R. Changes in sensory quality and aroma volatile composition during prolonged storage of ‘Wonderful’pomegranate fruit. Int. J. Food Sci. Technol. 2013, 48, 1569–1578. [Google Scholar] [CrossRef]
  17. Yi, J.; Kebede, B.T.; Grauwet, T.; Van Loey, A.; Hu, X.; Hendrickx, M. A multivariate approach into physicochemical, biochemical and aromatic quality changes of purée based on Hayward kiwifruit during the final phase of ripening. Postharvest. Biol. Technol. 2016, 117, 206–216. [Google Scholar] [CrossRef]
  18. Migliori, C.A.; Salvati, L.; Di Cesare, L.F.; Scalzo, R.L.; Parisi, M. Effects of preharvest applications of natural antimicrobial products on tomato fruit decay and quality during long-term storage. Sci. Hortic. 2017, 222, 193–202. [Google Scholar] [CrossRef]
  19. Hines, E.L.; Llobet, E.; Gardner, J.W. Electronic noses: A review of signal processing techniques. IEE Proc. Circuits Devices Syst. 1999, 146, 297–310. [Google Scholar] [CrossRef]
  20. Srivastava, S.; Sadistap, S. Data processing approaches and strategies for non-destructive fruits quality inspection and authentication: A review. J. Food Meas. Charact. 2018, 12, 2758–2794. [Google Scholar] [CrossRef]
  21. Rusinek, R.; Gancarz, M.; Krekora, M.; Nawrocka, A. A novel method for generation of a fingerprint using electronic nose on the example of rapeseed spoilage. J. Food Sci. 2019, 84, 51–58. [Google Scholar] [CrossRef] [Green Version]
  22. Rusinek, R.; Siger, A.; Gawrysiak-Witulska, M.; Rokosik, E.; Malaga-Toboła, U.; Gancarz, M. Application of an electronic nose for determination of pre-pressing treatment of rapeseed based on the analysis of volatile compounds contained in pressed oil. Int. J. Food Sci. Technol. 2020. [Google Scholar] [CrossRef]
  23. Li, C.; Krewer, G.W.; Ji, P.; Scherm, H.; Kays, S.J. Gas sensor array for blueberry fruit disease detection and classification. Postharvest. Biol. Technol. 2010, 55, 144–149. [Google Scholar] [CrossRef]
  24. Gruber, J.; Nascimento, H.M.; Yamauchi, E.Y.; Li, R.W.; Esteves, C.H.; Rehder, G.P.; Gaylarde, C.C.; Shirakawa, M.A. A conductive polymer based electronic nose for early detection of Penicillium digitatum in post-harvest oranges. Mater. Sci. Eng. C 2013, 33, 2766–2769. [Google Scholar] [CrossRef] [PubMed]
  25. Wang, H.; Hu, Z.; Long, F.; Guo, C.; Yuan, Y.; Yue, T. Early detection of Zygosaccharomyces Rouxii—spawned spoilage in apple juice by electronic nose combined with chemometrics. Int. J. Food Microbiol. 2016, 217, 68–78. [Google Scholar] [CrossRef] [PubMed]
  26. Zhang, W.; Pan, L.; Zhao, X.; Tu, K. A study on soluble solids content assessment using electronic nose: Persimmon fruit picked on different dates. Int. J. Food Prop. 2016, 19, 53–62. [Google Scholar] [CrossRef] [Green Version]
  27. Srivastava, S.; Sadisatp, S. Development of a low cost optimized handheld embedded odor sensing system (HE-Nose) to assess ripeness of oranges. J. Food Meas. Charact. 2016, 10, 1–15. [Google Scholar] [CrossRef]
  28. Hui, G.; Wu, Y.; Ye, D.; Ding, W. Fuji apple storage time predictive method using electronic nose. Food Anal. Meth. 2013, 6, 82–88. [Google Scholar]
  29. Di Natale, C.; Macagnano, A.; Martinelli, E.; Paolesse, R.; Proietti, E.; D’Amico, A. The evaluation of quality of post-harvest oranges and apples by means of an electronic nose. Sens. Actuators B Chem. 2001, 78, 26–31. [Google Scholar] [CrossRef]
  30. Young, R.C.; Buttner, W.J.; Linnell, B.R.; Ramesham, R. Electronic nose for space program applications. Sens. Actuators B Chem. 2003, 93, 7–16. [Google Scholar] [CrossRef]
  31. Qian, T.; Xu, R.; Kwan, C.; Linnell, B.; Young, R. Toxic vapor classification and concentration estimation for space shuttle and international space station. In Proceedings of the Advances in Neural Networks -ISNN 2004, International Symposium on Neural Networks, Part I, Dalian, China, 19–21 August 2004; pp. 543–551. [Google Scholar]
  32. Ryan, M.A.; Zhou, H.; Buehler, M.G.; Manatt, K.S.; Mowrey, V.S.; Jackson, S.P.; Kisor, A.K.; Shevade, A.V.; Homer, M.L. Monitoring space shuttle air quality using the jet propulsion laboratory electronic nose. IEEE Sens. J. 2004, 4, 337–347. [Google Scholar] [CrossRef]
  33. Li, W.; Leung, H.; Kwan, C.; Linnell, B.R. E-nose vapor identification based on dempster-shafer fusion of multiple classifiers. IEEE Trans. Instrum. Meas. 2008, 57, 2273–2282. [Google Scholar] [CrossRef]
  34. Roussel, S.; Forsberg, G.; Steinmetz, V.; Grenier, P.; Bellon-Maurel, V. Optimisation of electronic nose measurements. Part I: Methodology of output feature selection. J. Food Eng. 1998, 37, 207–222. [Google Scholar] [CrossRef]
  35. Carmel, L.; Levy, S.; Lancet, D.; Harel, D. A feature extraction method for chemical sensors in electronic noses. Sens. Actuators B Chem. 2003, 93, 67–76. [Google Scholar] [CrossRef]
  36. Wilson, D.M.; DeWeerth, S.P. Odor discrimination using steady-state and transient characteristics of tin-oxide sensors. Sens. Actuators B Chem. 1995, 28, 123–128. [Google Scholar] [CrossRef]
  37. Kish, L.B.; Vajtai, R.; Granqvist, C.G. Extracting information from noise spectra of chemical sensors: Single sensor electronic noses and tongues. Sens. Actuators B Chem. 2000, 71, 55–59. [Google Scholar] [CrossRef]
  38. Kish, L.B.; Smulko, J.; Heszler, P.; Granqvist, C.G. On the sensitivity, selectivity, sensory information and optimal size of resistive chemical sensors. Nanotechnol. Percept. 2007, 3, 43–52. [Google Scholar] [CrossRef]
  39. Schmera, G.; Kwan, C.; Ajayan, P.; Vajtai, R.; Kish, L.B. Fluctuation-enhanced sensing: Status and perspectives. IEEE Sens. J. 2008, 8, 714–719. [Google Scholar] [CrossRef]
  40. Ayhan, B.; Kwan, C.; Zhou, J.; Kish, L.B.; Benkstein, K.D.; Rogers, P.H.; Semancik, S. Fluctuation enhanced sensing (FES) with a nanostructured, semiconducting metal oxide film for gas detection and classification. Sens. Actuators B Chem. 2013, 188, 651–660. [Google Scholar] [CrossRef]
  41. Kwan, C.; Schmera, G.; Smulko, J.M.; Kish, L.B.; Heszler, P.; Granqvist, C.-G. Advanced agent identification with fluctuation-enhanced sensing. IEEE Sens. J. 2008, 8, 706–713. [Google Scholar] [CrossRef]
  42. Chen, J.; Gu, J.; Zhang, R.; Mao, Y.; Tian, S. Freshness evaluation of three kinds of meats based on the electronic nose. Sensors 2019, 19, 605. [Google Scholar] [CrossRef] [Green Version]
  43. Chen, X.; Xu, Y.; Meng, L.; Chen, X.; Yuan, L.; Cai, Q.; Shi, W.; Huang, G. Non-parametric partial least squares–discriminant analysis model based on sum of ranking difference algorithm for tea grade identification using electronic tongue data identify tea grade using e-tongue data. Sens. Actuators B Chem. 2020, 311, 127924. [Google Scholar] [CrossRef]
  44. Li, J.Z.; Liu, H.X.; Yao, X.J.; Liu, M.C.; Hu, Z.D.; Fan, B.T. Structure-activity relationship study of oxindole-based inhibitors of cyclin-dependent kinases based on least-squares support vector machines. Anal. Chim. Acta 2007, 581, 333–342. [Google Scholar] [CrossRef] [PubMed]
  45. Araujo, M.C.U.; Saldanha, T.C.B.; Galvao, R.K.H.; Yoneyama, T.; Chame, H.C.; Visani, V. The successive projections algorithm for variable selection in spectroscopic multicomponent analysis. Chemom. Intell. Lab. Syst. 2001, 57, 65–73. [Google Scholar] [CrossRef]
  46. Liu, K.; Chen, X.; Li, L.; Chen, H.; Ruan, X.; Liu, W. A consensus successive projections algorithm—multiple linear regression method for analyzing near infrared spectra. Anal. Chim. Acta 2015, 858, 16–23. [Google Scholar] [CrossRef]
  47. Centner, V.; Massart, D.L.; deNoord, O.E.; deJong, S.; Vandeginste, B.M.; Sterna, C. Elimination of uninformative variables for multivariate calibration. Anal. Chem. 1996, 68, 3851–3858. [Google Scholar] [CrossRef]
  48. Galvao, R.K.H.; Araujo, M.C.U.; Jose, G.E.; Pontes, M.J.C.; Silva, E.C.; Saldanha, T.C.B. A method for calibration and validation subset partitioning. Talanta 2005, 67, 736–740. [Google Scholar] [CrossRef]
  49. Esteve, A.L.; Armstrong, P.R.; Romagosa, C.I.; Hurburgh, C.R. Measurement of single soybean seed attributes by near-infrared technologies. A comparative study. J. Agric. Food Chem. 2012, 60, 8314–8322. [Google Scholar] [CrossRef]
  50. Wang, B.; Jiang, H.; Bi, Y.; He, X.; Wang, Y.; Li, Y.; Zheng, X.; Prusky, D. Preharvest multiple sprays with sodium nitroprusside promote wound healing of harvested muskmelons by activation of phenylpropanoid metabolism. Postharvest. Biol. Technol. 2019, 158, 110988. [Google Scholar] [CrossRef]
  51. Shao, X.; Tu, K.; Tu, S.; Su, J.; Zhao, Y. Effects of heat treatment on wound healing in gala and Red fuji apple fruits. J. Agric. Food Chem. 2010, 58, 4303–4309. [Google Scholar] [CrossRef]
  52. Song, J.; Bi, J.; Chen, Q.; Wu, X.; Lyu, Y.; Meng, X. Assessment of sugar content, fatty acids, free amino acids, and volatile profiles in jujube fruits at different ripening stages. Food Chem. 2019, 270, 344–352. [Google Scholar] [CrossRef]
  53. Lu, X.; Meng, G.; Jin, W.; Gao, H. Effects of 1-MCP in combination with Ca application on aroma volatiles production and softening of ‘Fuji’apple fruit. Sci. Hortic. 2018, 229, 91–98. [Google Scholar] [CrossRef]
  54. Echeverría, G.; Correa, E.; Ruiz-Altisent, M.; Graell, J.; Puy, J.; López, L. Characterization of Fuji apples from different harvest dates and storage conditions from measurements of volatiles by gas chromatography and electronic nose. J. Agric. Food Chem. 2004, 52, 3069–3076. [Google Scholar] [CrossRef] [PubMed]
  55. Pan, L.; Zhang, W.; Zhu, N.; Mao, S.; Tu, K. Early detection and classification of pathogenic fungal disease in post-harvest strawberry fruit by electronic nose and gas chromatography–mass spectrometry. Food Res. Int. 2014, 62, 162–168. [Google Scholar] [CrossRef]
  56. Wen, T.; Zheng, L.; Dong, S.; Gong, Z.; Sang, M.; Long, X.; Luo, M.; Peng, H. Rapid detection and classification of citrus fruits infestation by Bactrocera dorsalis (Hendel) based on electronic nose. Postharvest. Biol. Technol. 2019, 147, 156–165. [Google Scholar] [CrossRef]
  57. Liu, Q.; Zhao, N.; Zhou, D.; Sun, Y.; Sun, K.; Pan, L.; Tu, K. Discrimination and growth tracking of fungi contamination in peaches using electronic nose. Food Chem. 2018, 262, 226–234. [Google Scholar] [CrossRef]
  58. Li, J.; Zheng, F.; Jiang, J.; Lin, H.; Hui, G. Chinese bayberry (Myrica rubra Sieb. et Zucc.) quality determination based on an electronic nose and non-linear dynamic model. Anal. Methods 2015, 7, 9928–9939. [Google Scholar] [CrossRef]
  59. Wei, X.; Zhang, Y.; Wu, D.; Wei, Z.; Chen, K. Rapid and non-destructive detection of decay in peach fruit at the cold environment using a self-developed handheld electronic-nose system. Food Anal. Meth. 2018, 11, 2290–3004. [Google Scholar] [CrossRef]
  60. Demir, N.; Ferraz, A.C.O.; Sargent, S.A.; Balaban, M.O. Classification of impacted blueberries during storage using an electronic nose. J. Sci. Food Agric. 2011, 91, 1722–1727. [Google Scholar] [CrossRef]
  61. Ren, Y.; Ramaswamy, H.S.; Li, Y.; Yuan, C.; Ren, X. Classification of impact injury of apples using electronic nose coupled with multivariate statistical analyses. J. Food Process Eng. 2018, 41, e12698. [Google Scholar] [CrossRef]
  62. Chen, H.-Z.; Zhang, M.; Guo, Z. Discrimination of fresh-cut broccoli freshness by volatiles using electronic nose and gas chromatography-mass spectrometry. Postharvest. Biol. Technol. 2019, 148, 168–175. [Google Scholar] [CrossRef]
  63. Huang, L.; Liu, H.; Zhang, B.; Wu, D. Application of electronic nose with multivariate analysis and sensor selection for botanical origin identification and quality determination of honey. Food Bioprocess Technol. 2015, 8, 359–370. [Google Scholar] [CrossRef]
Figure 1. Schematic of the e-nose system.
Sensors 20 01866 g001
Figure 2. (ac) Relative content of three volatile substances (VOCs) decreased with the increase of the level of compression damage.
Sensors 20 01866 g002aSensors 20 01866 g002b
Figure 3. (ac) Relative content of three VOCs increased with the increase of the level of compression damage.
Sensors 20 01866 g003
Figure 4. Relative content of 4-(Z)-octenoic acid methyl ester after compression damage.
Sensors 20 01866 g004
Table 1. Gas sensor array and its properties.
Sensor NumberSensor ModelSensitive Substances
S1TGS 826Ammonia, amines
S2MQ-136Hydrogen sulfide, sulfide
S3TGS 821Hydrogen
S4TGS 822Alcohol, organic solvents
S5MQ-138Toluene, acetone, ethanol, formaldehyde, hydrogen, and other organic vapors
S6MQ-4Methane, biogas, natural gas
S7TGS 813Methane, propane, isobutane, natural gas, liquefied gas
S8TGS 2602Cigarette smoke, cooking odor, VOC, ammonia, hydrogen sulfide, alcohol
S9MQ-5Butane, propane, methane, liquefied gas, natural gas, gas
S10TGS 2610Liquefied petroleum gas, combustible gas, propane, butane
S11MQ-2Propane, smoke, combustible gas
S12TGS 2620Carbon monoxide, ethanol, organic solvents, other volatile gases
S13TGS 2600Smoke, cooking odor, hydrogen, carbon monoxide, air pollutants
S14TGS 2611Methane, natural gas
Table 2. Mean values and standard deviations of electronic nose (e-nose) responses of yellow peach from three groups at 4, 8, and 24 h after the fruit was compressed. Fruits without compression damage were in Group 0. Fruits compressed by 5 mm were in Group I. Fruits compressed by 15 mm were in Group II.
Sensor Number 0 mm5 mm15 mm
Mean ValueStandard DeviationMean ValueStandard DeviationMean ValueStandard Deviation
14 h1.3891.1251.2400.6971.2930.686
8 h2.1221.3081.6410.8341.2930.686
24 h1.3030.4951.5440.9712.5391.083
24 h1.4101.2881.4620.9911.3100.949
8 h2.0401.6341.3321.0041.3100.949
24 h1.2350.6031.6131.2732.2991.447
34 h0.1260.0780.0850.0690.1010.070
8 h0.0880.0560.1080.0810.1010.070
24 h0.1060.0760.1060.0910.1110.083
44 h0.8680.4230.7120.2940.7200.271
8 h0.8030.2770.7390.4180.7200.271
24 h1.0590.9520.8920.3671.2230.504
54 h0.2070.1140.2570.1780.2480.151
8 h0.2900.2380.2650.1880.2480.151
24 h0.2290.1270.3040.1960.4620.243
64 h1.7520.5361.6500.3771.6280.313
8 h1.8040.7481.6410.4231.6280.313
24 h1.3880.2061.6070.3591.8970.467
74 h0.5760.3150.4740.0820.5040.078
8 h0.5640.3940.5210.1670.5040.078
24 h0.6120.5640.5990.4260.7130.247
84 h0.7490.7280.5700.4030.8850.659
8 h1.6351.4181.1080.5400.8850.659
24 h1.0791.0021.1160.9602.3661.503
94 h1.5770.9771.4930.6491.3620.560
8 h1.8441.1881.3900.6291.3620.560
24 h1.1990.2831.4180.6141.7930.751
104 h0.9390.2940.8360.1900.8550.201
8 h0.9370.3250.9680.3600.8550.201
24 h1.0400.8640.9370.2311.2400.331
114 h1.0280.8760.9490.5060.9210.509
8 h1.2990.9220.9780.5440.9210.509
24 h0.7800.2881.0760.6791.7060.801
124 h1.6210.8401.3580.5451.4310.517
8 h1.4660.5671.5490.8921.4310.517
24 h1.7951.4421.6450.6172.2600.980
134 h1.8660.9381.4930.5541.5790.491
8 h1.6120.5861.6820.8991.5790.491
24 h2.1391.8581.8210.6452.4290.993
144 h1.4230.4421.2420.3011.3250.300
8 h1.4280.6181.4570.5641.3250.300
24 h1.5421.3771.4100.3711.8840.563
Table 3. Detection of levels of compression damage.
TimeVariableCalibrationCalibrationPredictionAB_RMSE
RcRc2RMSECRpRp2RMSEPRPD
allallPLSR0.3670.1356.0680.3010.0785.4241.0410.644
4 hallPLSR0.2050.0426.1840.023−0.0696.2551.0000.071
8 hallPLSR0.1710.0296.497−0.139−0.0115.6900.9950.807
24 hallPLSR0.3840.1475.9070.7900.1625.4851.0990.422
allallLS-SVM0.6110.3545.2430.4300.1575.1541.0960.089
4 hallLS-SVM1.0001.0000.0050.5650.2675.1671.2105.162
8 hallLS-SVM0.9150.7753.1280.3730.0495.3081.0672.180
24 hallLS-SVM0.8530.6513.7780.8220.6703.4551.7450.323
24 hUVEPLSR0.3940.1555.8810.8200.2305.2851.1410.596
24 hUVELS-SVM0.9660.9221.7900.8880.7682.8192.1391.029
24 hSPAPLSR0.6420.4124.9070.8320.6373.5251.7101.382
24 hSPALS-SVM0.6600.4344.8130.8390.6753.4041.7711.409
Table 4. Discrimination of damaged fruit.
TimeVariableCalibrationAllHealthDamaged
CalibrationPredictionCalibrationPredictionCalibrationPrediction
allallPLSR63.89%74.44%3.00%0.00%100.00%100.00%
4 hallPLSR63.33%76.67%34.78%0.00%91.89%100.00%
8 hallPLSR60.00%80.00%37.50%0.00%88.89%79.17%
24 hallPLSR71.67%63.33%26.32%0.00%97.56%100.00%
all allLS-SVM87.22%77.78%38.81%84.96%65.22%46.27%
4 hallLS-SVM95.00%66.67%91.30%28.57%97.30%78.26%
8 hallLS-SVM100.00%76.67%100.00%33.33%100.00%87.50%
24 hallLS-SVM96.67%86.67%94.74%100.00%97.56%78.95%
24 hUVEPLSR71.67%63.33%10.53%0.00%100.00%100.00%
24 hUVELS-SVM100.00%93.33%100.00%81.81%100.00%100.00%
24 hSPAPLSR68.33%70.00%5.3%97.56%18.18%100.00%
24 hSPALS-SVM76.67%73.33%47.37%81.82%90.24%68.42%
Table 5. Prediction of time after compression damage.
Damage LevelVariableCalibrationCalibrationPredictionAB_RMSE
RcRc2RMSECRpRp2RMSEPRPD
allallPLSR0.6870.4726.5040.3640.0306.8341.0730.330
5 mmallPLSR0.4910.2427.9320.401−0.0666.6281.0621.304
15 mmallPLSR0.7310.5346.0380.8680.7153.9851.9592.053
allallLS-SVM0.7860.5985.6710.4670.1706.5321.1220.861
5 mmallLS-SVM0.8880.7554.5120.193−0.2157.3060.9642.794
15 mmallLS-SVM0.9230.8323.6220.8900.7533.6932.1140.071
15 mmUVEPLSR0.7610.5795.7400.7980.5804.9181.5870.822
15 mmUVELS-SVM0.8800.7454.4610.8980.7703.6552.1360.806
15 mmSPAPLSR0.6210.3866.9290.8600.6184.4511.7542.478
15 mmSPALS-SVM0.6810.4596.5010.8670.6534.0951.9072.406

