Change-Point Detection of Peak Tibial Acceleration in Overground Running Retraining

 , ,
, ,
Abstract
1. Introduction
2. Materials and Methods
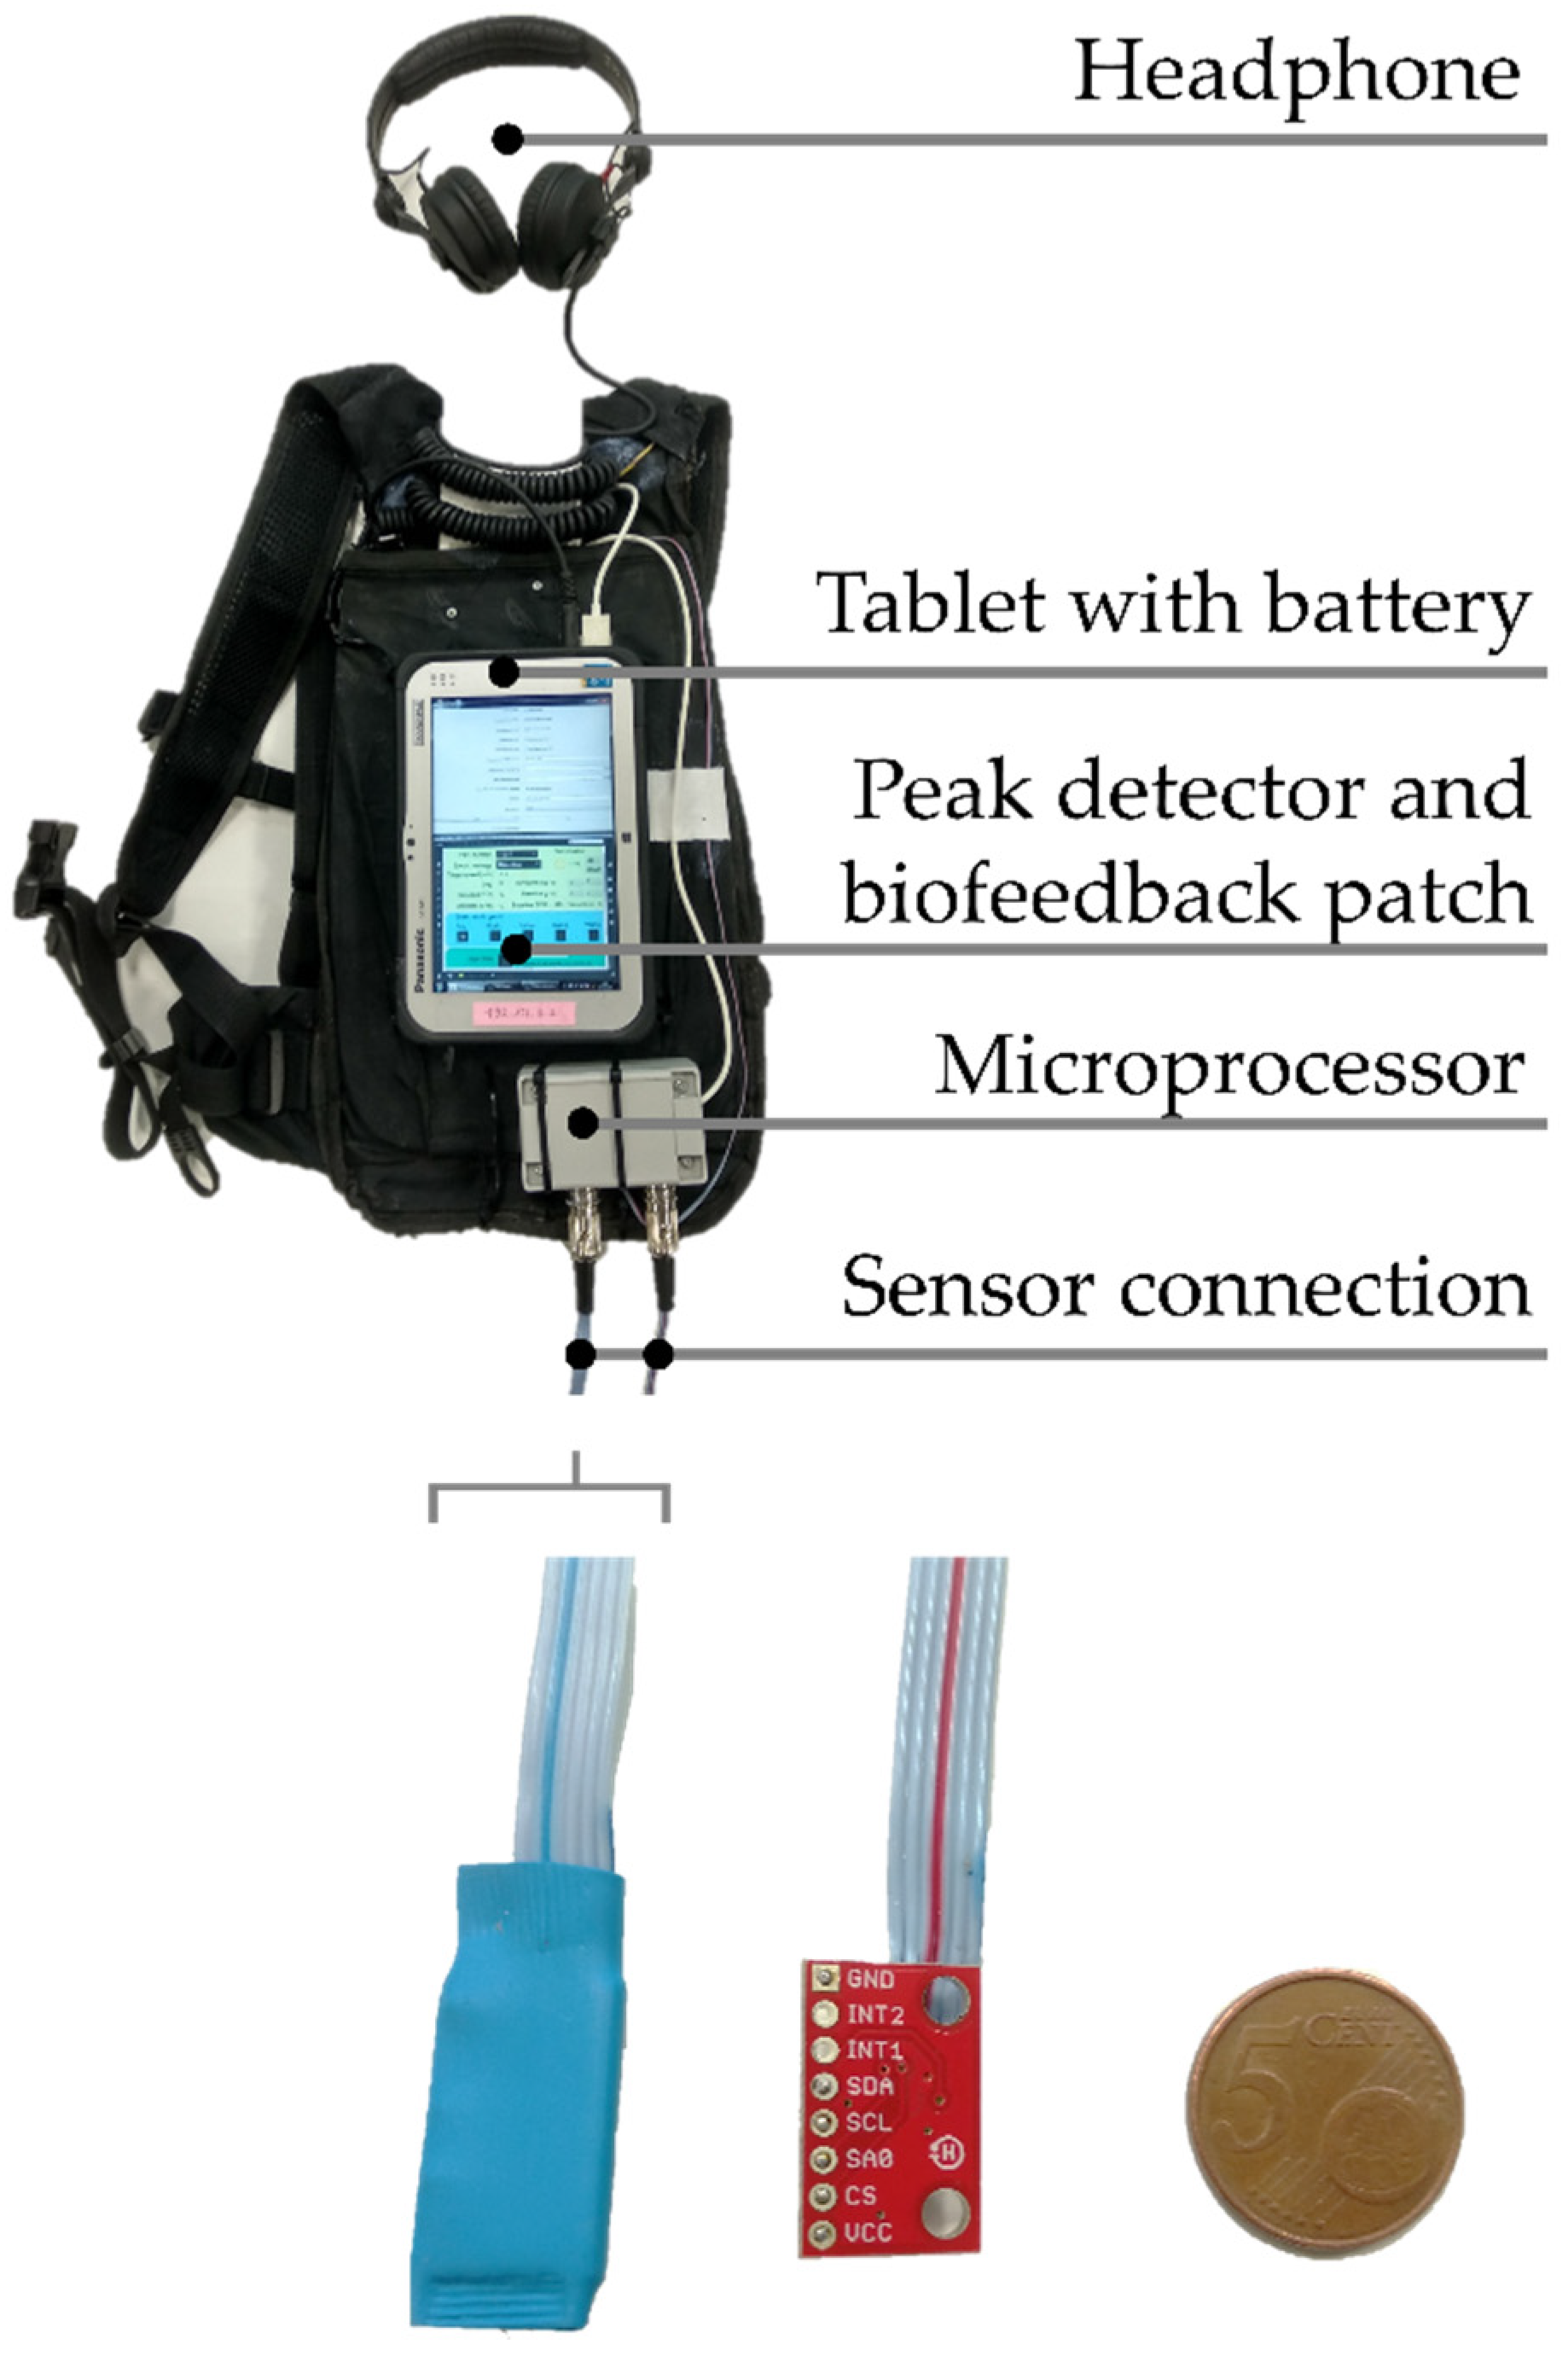
2.1. Subjects
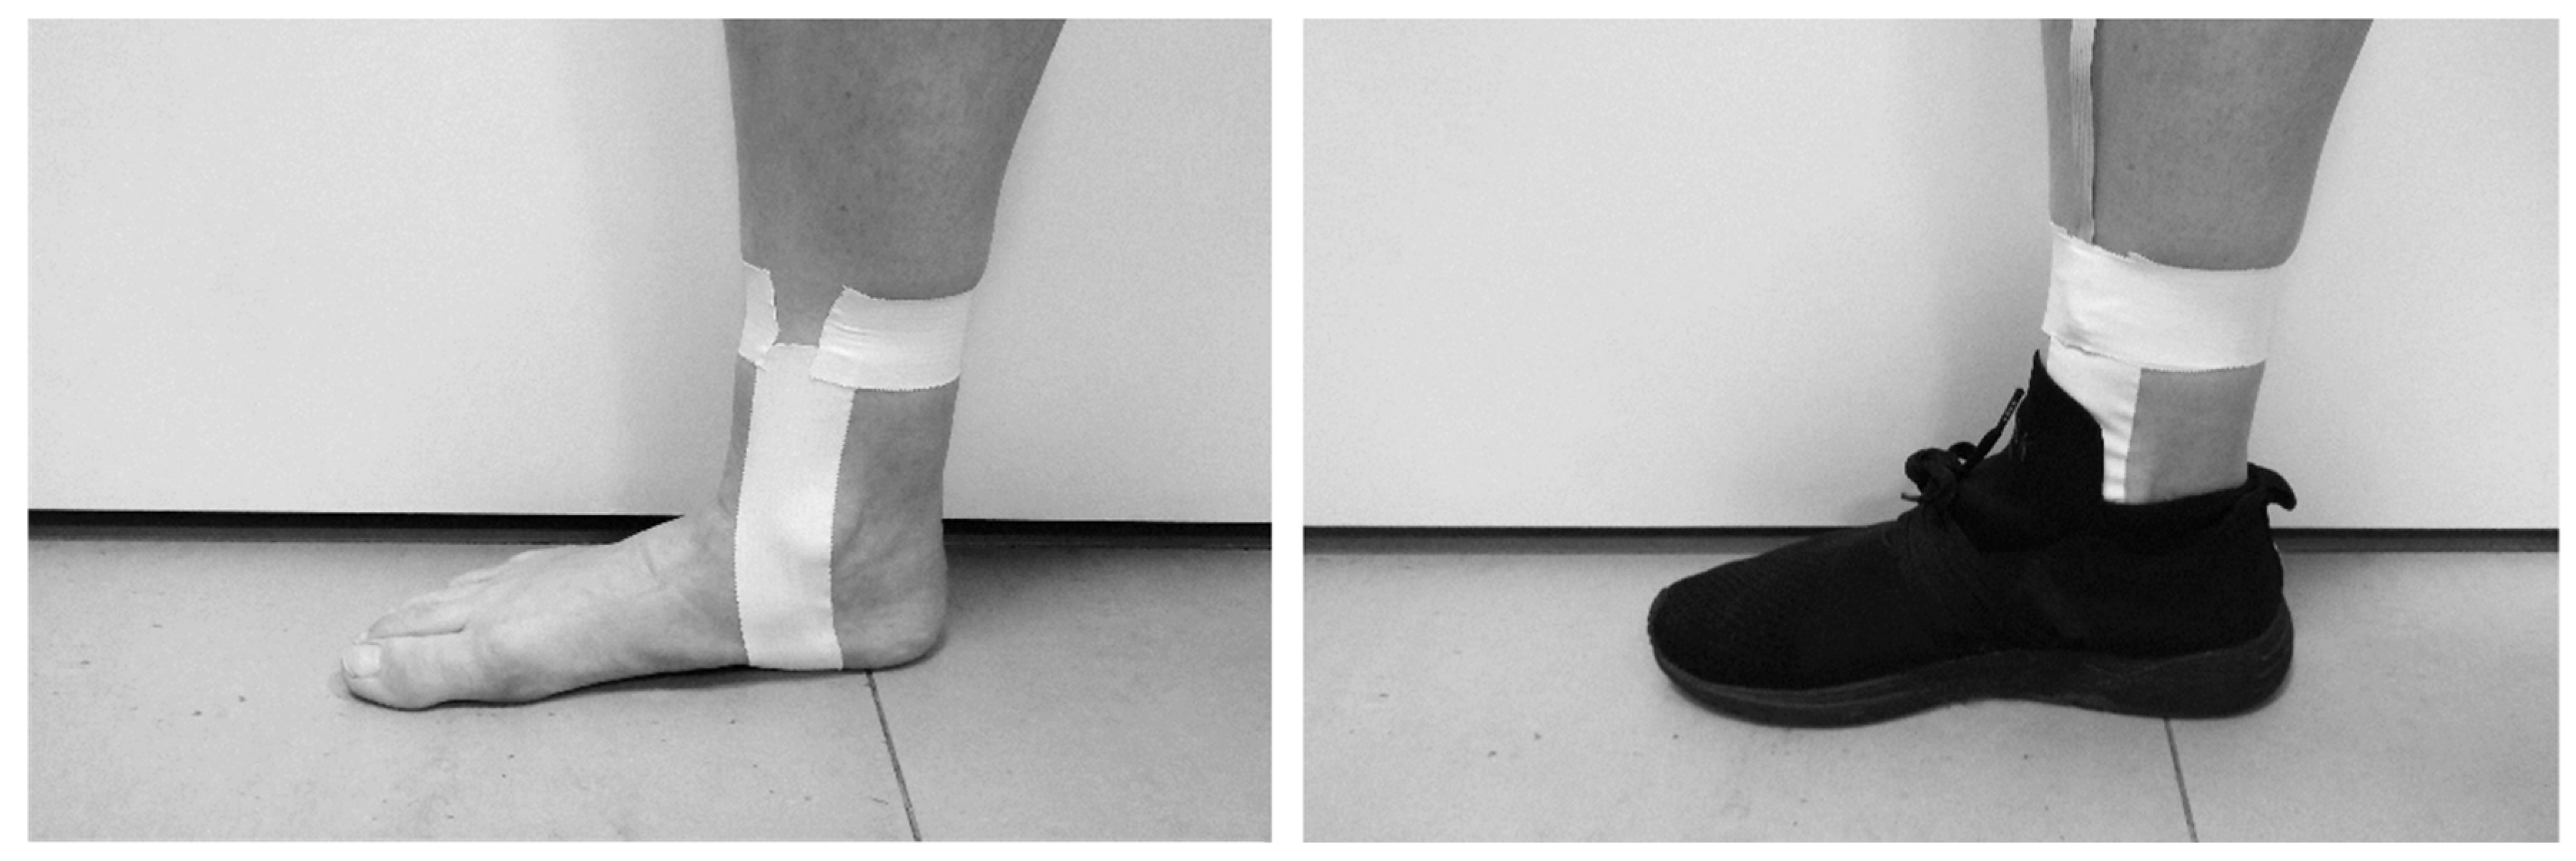
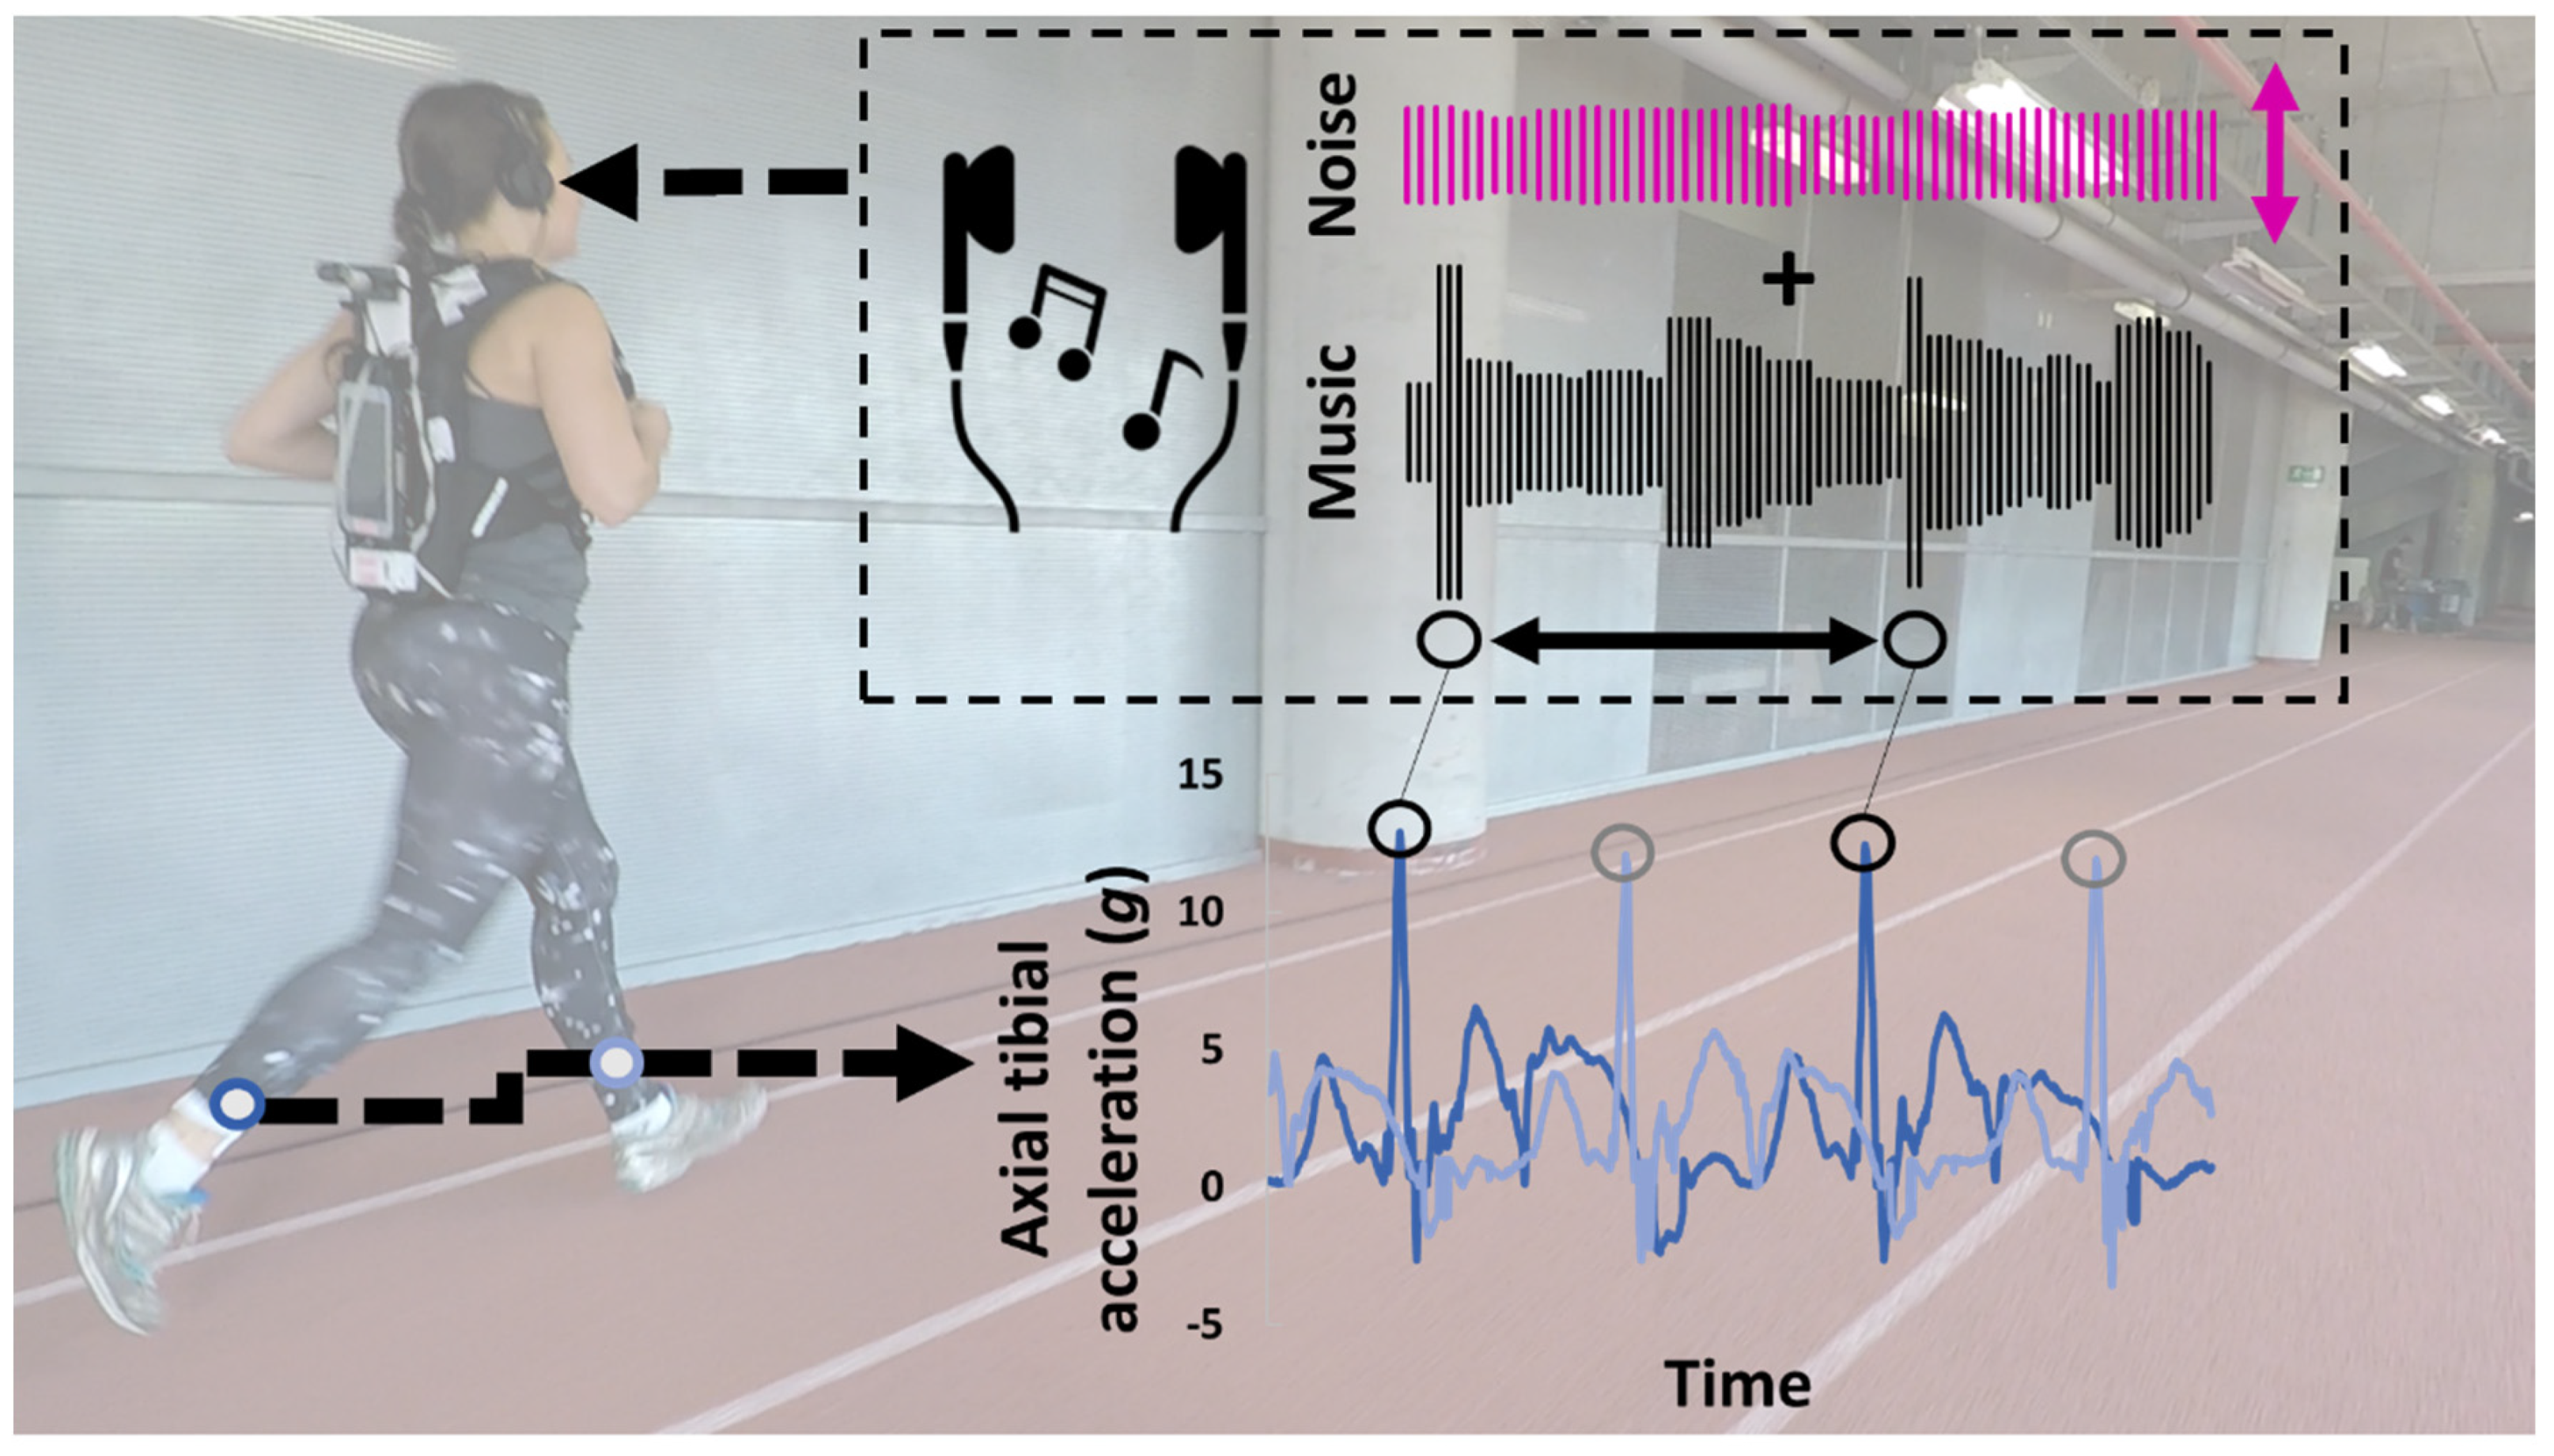
2.2. Intervention
2.3. Data Processing
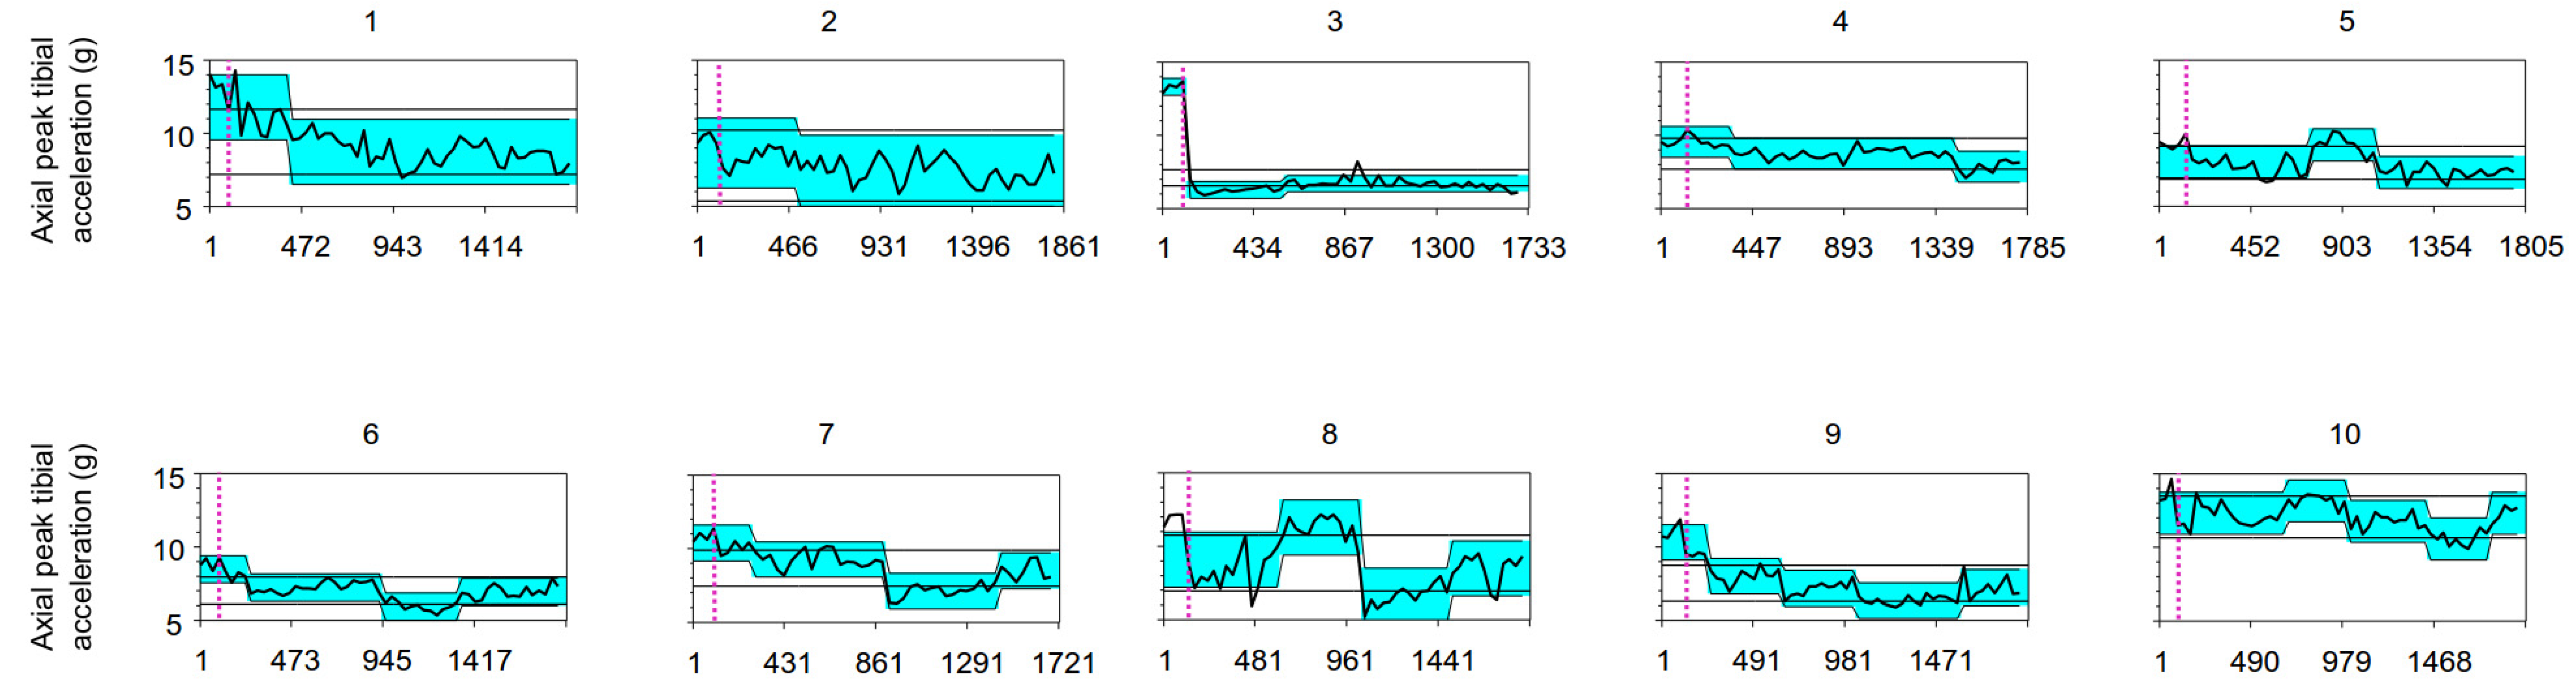
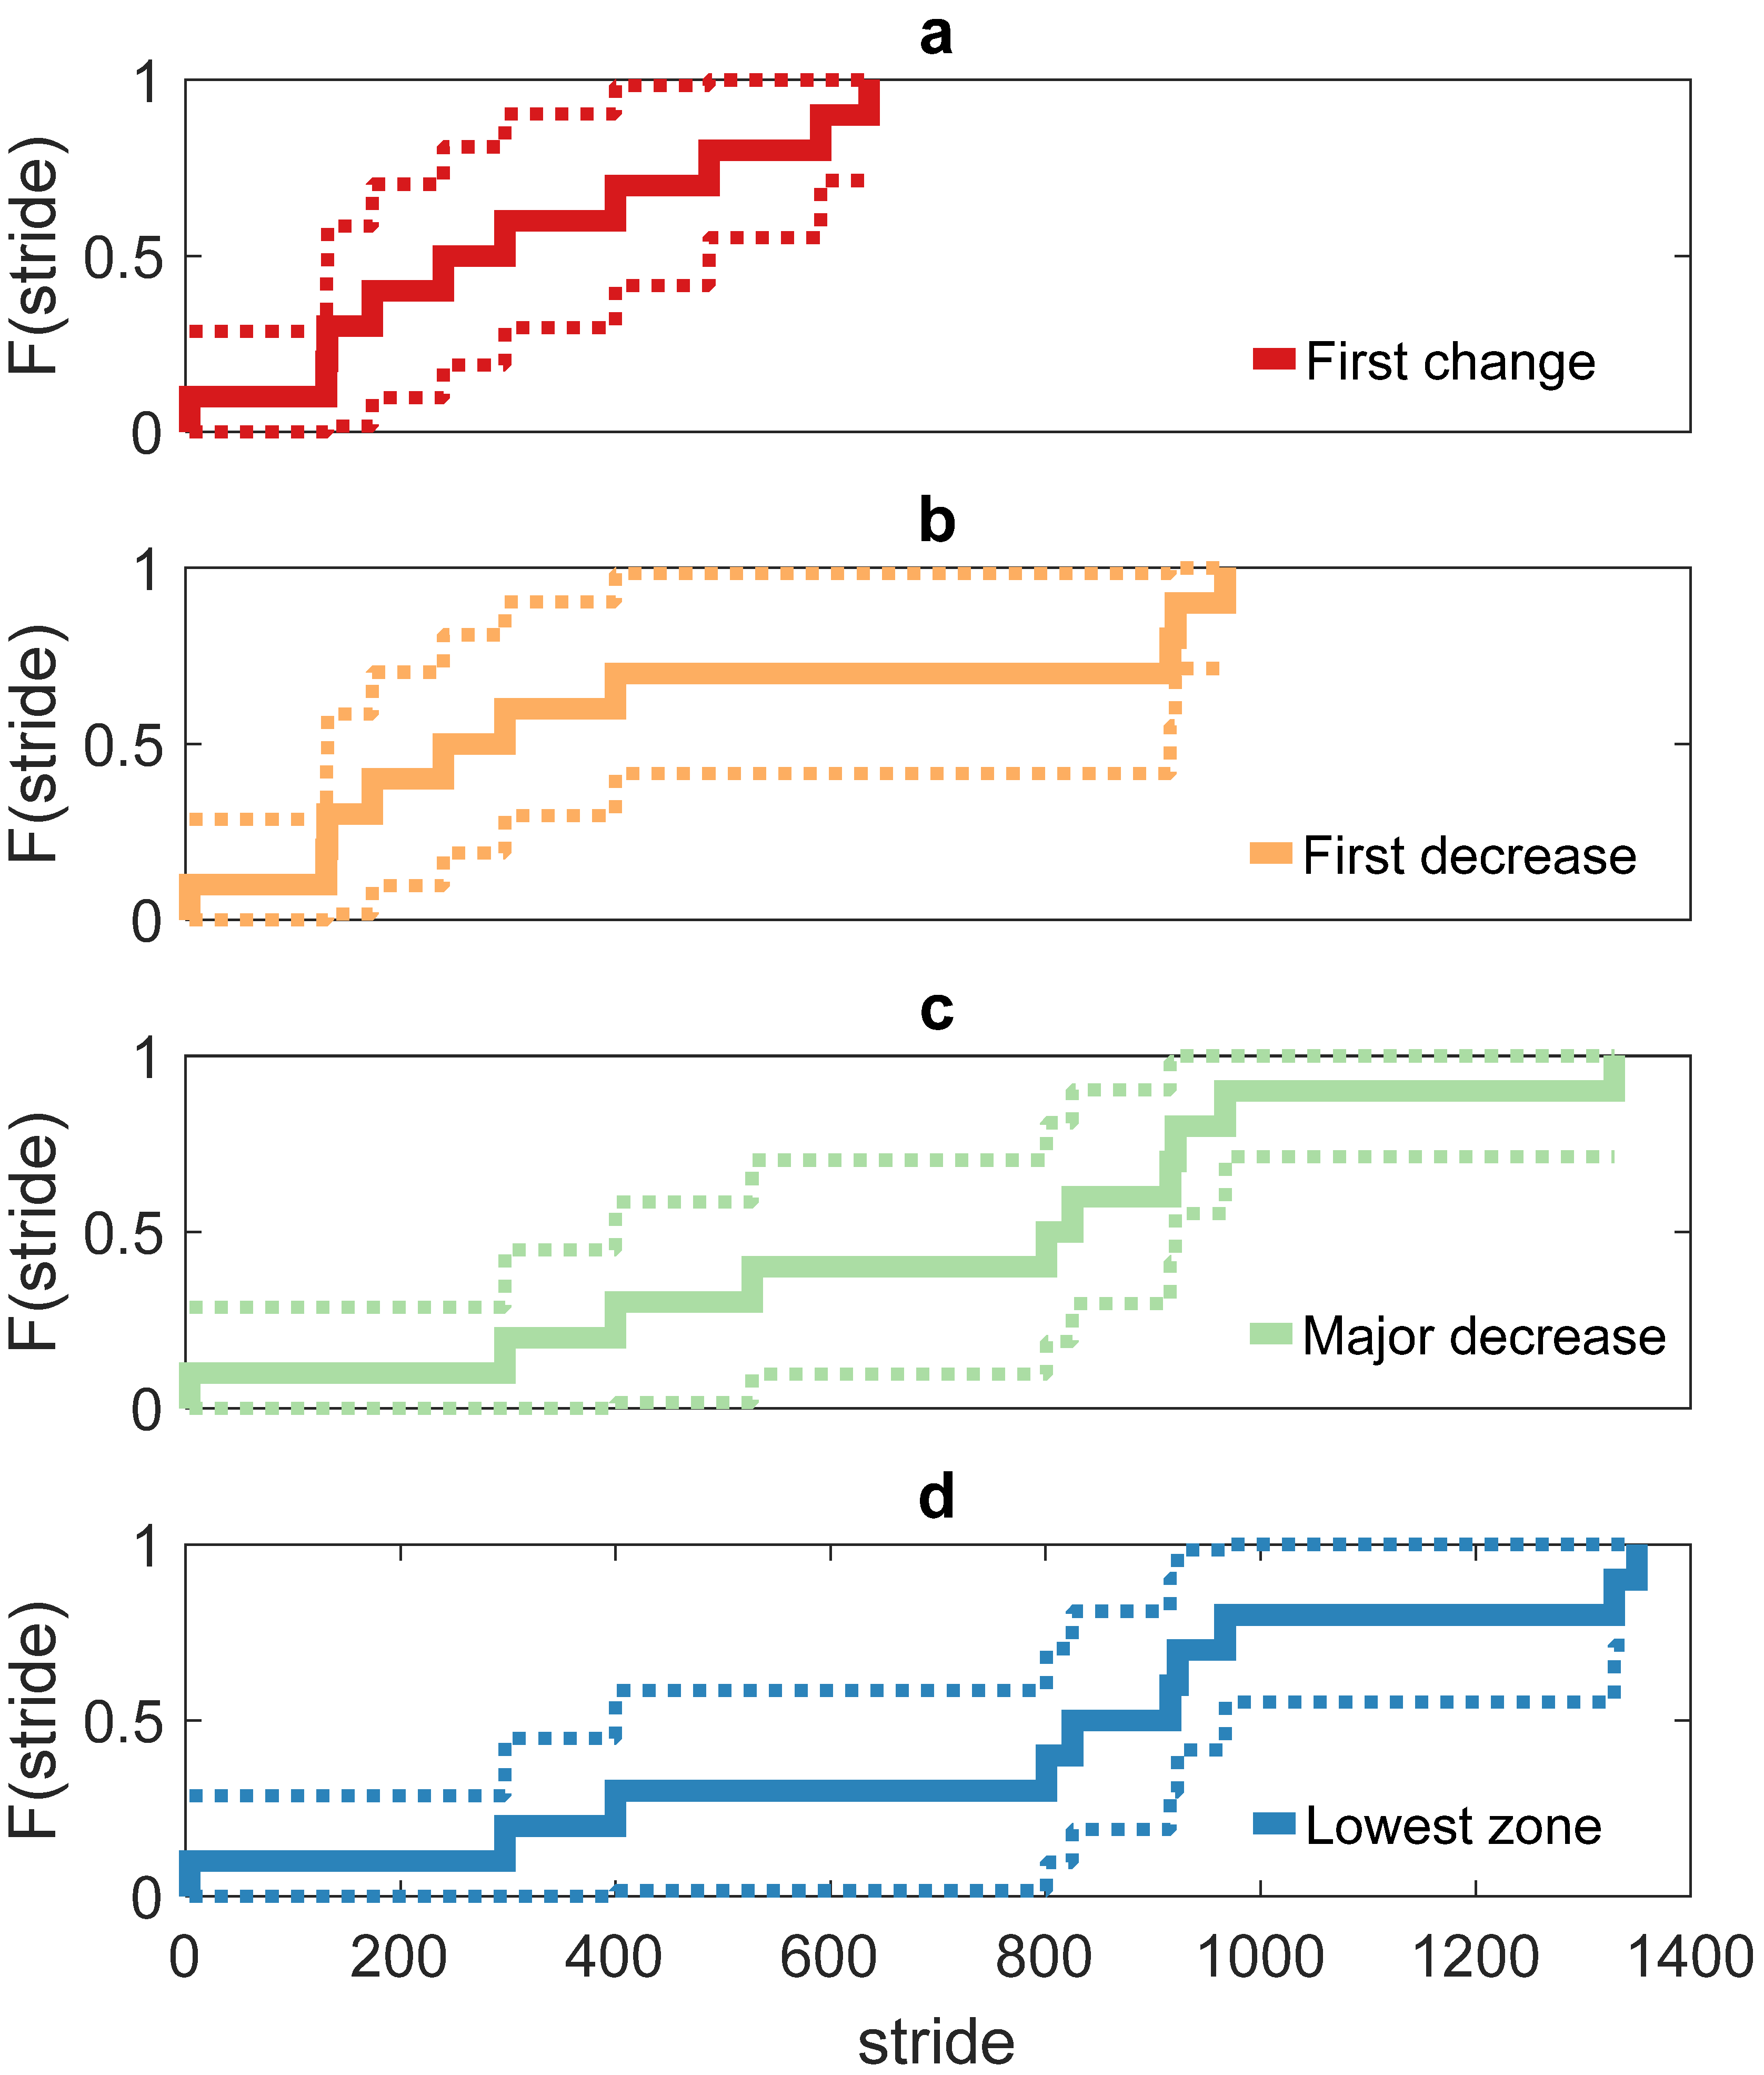
3. Results
4. Discussion
Supplementary Materials
Author Contributions
Funding
Acknowledgments
Conflicts of Interest
Appendix A

Appendix B
References
- Sheerin, K.R.; Reid, D.; Besier, T.F. The measurement of tibial acceleration in runners: A review of the factors that can affect tibial acceleration during running and evidence-based guidelines for its use. Gait Posture 2019, 67, 12–24. [Google Scholar] [CrossRef] [PubMed]
- Provot, T.; Chiementin, X.; Oudin, E.; Bolaers, F.; Murer, S. Validation of a high sampling rate inertial measurement unit for acceleration during running. Sensors 2017, 17, 1958. [Google Scholar] [CrossRef] [PubMed]
- Mitschke, C.; Kiesewetter, P.; Milani, T.L. The effect of the accelerometer operating range on biomechanical parameters: Stride length, velocity, and peak tibial acceleration during running. Sensors 2018, 18, 130. [Google Scholar] [CrossRef] [PubMed]
- Wood, C.M.; Kipp, K. Use of audio biofeedback to reduce tibial impact accelerations during running. J. Biomech. 2014, 47, 1739–1741. [Google Scholar] [CrossRef]
- Van den Berghe, P.; Lorenzoni, V.; Gerlo, J.; Breine, B.; Derie, R.; Six, J.; Leman, M.; De Clercq, D. Real-time music-based biofeedback to reduce impact loading during over-ground running. In Proceedings of the 42nd Annual meeting of the American Society of Biomechanics, Rochester, MN, USA, 8–11 August 2018. [Google Scholar]
- Creaby, M.W.; Franettovich Smith, M.M. Retraining running gait to reduce tibial loads with clinician or accelerometry guided feedback. J. Sci. Med. Sport 2016, 19, 288–292. [Google Scholar] [CrossRef]
- Crowell, H.P.; Milner, C.E.; Hamill, J.; Davis, I.S. Reducing Impact Loading During Running With the Use of Real-Time Visual Feedback. J. Orthop. Sports Phys. Ther. 2010, 40, 206–213. [Google Scholar] [CrossRef]
- Crowell, H.P.; Davis, I.S. Gait retraining to reduce lower extremity loading in runners. Clin. Biomech. 2011, 26, 78–83. [Google Scholar] [CrossRef]
- Clansey, A.C.; Hanlon, M.; Wallace, E.S.; Nevill, A.; Lake, M.J. Influence of Tibial shock feedback training on impact loading and running economy. Med. Sci. Sports Exerc. 2014, 46, 973–981. [Google Scholar] [CrossRef]
- Davis, I.S.; Futrell, E. Gait Retraining: Altering the Fingerprint of Gait. Phys. Med. Rehabil. Clin. N. Am. 2016, 27, 339–355. [Google Scholar] [CrossRef]
- Bowser, B.J.; Fellin, R.; Milner, C.E.; Pohl, M.B.; Davis, I.S. Reducing impact loading in runners: A one-year follow-up. Med. Sci. Sports Exerc. 2018, 50, 2500–2506. [Google Scholar] [CrossRef]
- Van den Berghe, P.; Six, J.; Gerlo, J.; Leman, M.; De Clercq, D. Validity and reliability of peak tibial accelerations as real-time measure of impact loading during over-ground rearfoot running at different speeds. J. Biomech. 2019, 86, 238–242. [Google Scholar] [CrossRef]
- Lorenzoni, V.; Van den Berghe, P.; Maes, P.-J.; De Bie, T.; De Clercq, D.; Leman, M. Design and validation of an auditory biofeedback system for modification of running parameters. J. Multimodal User Interfaces 2018, 3, 167–180. [Google Scholar] [CrossRef]
- Willy, R.W.; Buchenic, L.; Rogacki, K.; Ackerman, J.; Schmidt, A.; Willson, J.D. In-field gait retraining and mobile monitoring to address running biomechanics associated with tibial stress fracture. Scand. J. Med. Sci. Sports 2016, 26, 197–205. [Google Scholar] [CrossRef] [PubMed]
- Luft, A.R.; Buitrago, M.M. Stages of motor skill learning. Mol. Neurobiol. 2005, 32, 205–216. [Google Scholar] [CrossRef]
- Buitrago, M.M.; Ringer, T.; Schulz, J.B.; Dichgans, J.; Luft, A.R. Characterization of motor skill and instrumental learning time scales in a skilled reaching task in rat. Behav. Brain Res. 2004, 155, 249–256. [Google Scholar] [CrossRef] [PubMed]
- Khan, N.; McClean, S.; Zhang, S.; Nugent, C. Optimal parameter exploration for online change-point detection in activity monitoring using genetic algorithms. Sensors 2016, 16, 1784. [Google Scholar] [CrossRef]
- Khan, T.; Lundgren, L.E.; Järpe, E.; Olsson, M.C.; Viberg, P. A Novel Method for Classification of Running Fatigue Using Change-Point Segmentation. Sensors 2019, 19, 4729. [Google Scholar] [CrossRef]
- Pashami, S.; Lilienthal, A.J.; Trincavelli, M. Detecting changes of a distant gas source with an array of MOX gas sensors. Sensors 2012, 12, 16404–16419. [Google Scholar] [CrossRef]
- Pashami, S.; Lilienthal, A.J.; Schaffernicht, E.; Trincavelli, M. TREFEX: Trend estimation and change detection in the response of MOX gas sensors. Sensors 2013, 13, 7323–7344. [Google Scholar] [CrossRef]
- Zuo, G.; Dou, Y.; Lei, R. Discrimination algorithm and procedure of snow depth and sea ice thickness determination using measurements of the vertical ice temperature profile by the ice-tethered buoys. Sensors 2018, 18, 4162. [Google Scholar] [CrossRef]
- Culman, C.; Aminikhanghahi, S.; J Cook, D. Easing Power Consumption of Wearable Activity Monitoring with Change Point Detection. Sensors 2020, 20, 310. [Google Scholar] [CrossRef] [PubMed]
- Staniszewski, M.; Skorupa, A.; Boguszewicz, Ł.; Sokół, M.; Polański, A. Quality Control Procedure Based on Partitioning of NMR Time Series. Sensors 2018, 18, 792. [Google Scholar] [CrossRef] [PubMed]
- Van Gelder, L.M.A.; Barnes, A.; Wheat, J.S.; Heller, B.W. Characterizing the Learning Effect in Response to Biofeedback Aimed at Reducing Tibial Acceleration during Running. Proc. ISEA 2018, 2, 200. [Google Scholar] [CrossRef]
- Taylor, W.A. Change-Point Analysis: A Powerful New Tool for Detecting Changes. Available online: https://variation.com/wp-content/uploads/change-point-analyzer/change-point-analysis-a-powerful-new-tool-for-detecting-changes.pdf (accessed on 19 March 2020).
- Yamato, T.P.; Saragiotto, B.T.; Lopes, A.D. A Consensus Definition of Running-Related Injury in Recreational Runners: A Modified Delphi Approach. J. Orthop. Sports Phys. Ther. 2015, 45, 375–380. [Google Scholar] [CrossRef]
- Breine, B.; Malcolm, P.; Frederick, E.C.; De Clercq, D. Relationship between running speed and initial foot contact patterns. Med. Sci. Sports Exerc. 2014, 46, 1595–1603. [Google Scholar] [CrossRef]
- STMicroelecronics LIS331HH MEMS Digital Output Motion Sensor Ultra Low-Power High Performance Three-Axis “nano” Accelerometer. Available online: http://www.st.com/st-web-ui/static/active/en/resource/technical/document/datasheet/DM00040962.pdf (accessed on 19 March 2020).
- Gruber, A.H.; Boyer, K.A.; Derrick, T.R.; Hamill, J. Impact shock frequency components and attenuation in rearfoot and forefoot running. J. Sport Heal. Sci. 2014, 3, 113–121. [Google Scholar] [CrossRef]
- Milner, C.E.; Ferber, R.; Pollard, C.D.; Hamill, J.; Davis, I.S. Biomechanical factors associated with tibial stress fracture in female runners. Med. Sci. Sports Exerc. 2006, 38, 323–328. [Google Scholar] [CrossRef]
- Moens, B.; Leman, M. Alignment strategies for the entrainment of music and movement rhythms. Ann. N. Y. Acad. Sci. 2015, 1337, 86–93. [Google Scholar] [CrossRef]
- Van Dyck, E.; Moens, B.; Buhmann, J.; Demey, M.; Coorevits, E.; Dalla Bella, S.; Leman, M. Spontaneous Entrainment of Running Cadence to Music Tempo. Sports Med. Open 2015, 2, 15. [Google Scholar] [CrossRef]
- Hinkley, D.V. Inference about the change-point from cumulative sum tests. Biometrika 1971, 58, 509–523. [Google Scholar] [CrossRef]
- Pettitt, A.N. A simple cumulative sum type statistic for the change-point problem with zero-one observations. Biometrika 1980, 67, 79–84. [Google Scholar] [CrossRef]
- Hinkley, D.; Schechtman, E. Conditional bootstrap methods in the mean-shift model. Biometrika 1987, 74, 85–93. [Google Scholar] [CrossRef]
- Cram, P.; Fendrick, A.M.; Inadomi, J.; Cowen, M.E.; Carpenter, D.; Vijan, S. The impact of a celebrity promotional campaign on the use of colon cancer screening: The Katie Couric effect. Arch. Intern. Med. 2003, 163, 1601–1605. [Google Scholar] [CrossRef]
- Taylor, W. A Pattern Test for Distinguishing between Autoregressive and Mean-Shift Data. Available online: https://variation.com/wp-content/uploads/change-point-analyzer/a-pattern-test-for-distinguishing-between-autoregressive-and-mean-shift-data.pdf (accessed on 19 March 2020).


| Studies | Hardware for Biofeedback | Feedback Modality | Running Environment | Trials for Analysis |
|---|---|---|---|---|
| Crowell et al. (2010) | 1 × accelerometer 1 × computer 1 × monitor screen |  | Treadmill, laboratory | 20 averaged per condition |
| Clansey et al. (2014) | 1 × accelerometer 1 × computer 1 × projection screen 1 × speaker set |  + +  | Treadmill, laboratory | 6 averaged per condition |
| Wood and Kipp (2014) | 1 × accelerometer 1 × computer with speakers |  | Treadmill, laboratory | 20 averaged per condition |
| Present study | 2 × accelerometers 1 × instrumented backpack 1 × headphone |  | Overground, athletic facility | 1853 ± 88 (mean ± SD) in total |
| ID | APTA (g) Baseline | Number of Change Points | Location of the Change Point | 95% Confidence Interval | Δ Change Inter-Segments in APTA (g) | Zone of Lowest APTA (g) {% vs. Baseline} | Estimated Standard Deviation |
|---|---|---|---|---|---|---|---|
| 1 | 13.21 | 1 | 297 a | 231–330 | −3.04 | 8.75 {66%} | 0.75 |
| 2 | 9.66 | 1 | 400 a | 235–631 | −1.24 | 7.44 {77%} | 0.81 |
| 3 | 13.43 | 2 | 4 a 466 | 4–4 367–1555 | −7.05 +0.42 | 6.30 {47%} | 0.19 |
| 4 | 9.40 | 2 | 240 1329 a | 240–306 1263–1362 | −0.81 −0.90 | 7.86 {84%} | 0.35 |
| 5 | 9.28 | 2 | 636 967 a | 373–703 934–967 | +1.17 −1.90 | 7.33 {79%} | 0.37 |
| 6 | 8.87 | 3 | 132 825 a 1221 | 66–165 825–858 1188–1254 | −1.24 −1.28 +0.99 | 5.96 {67%} | 0.31 |
| 7 | 10.83 | 3 | 174 801 a 1329 | 75–273 768–801 1296–1362 | −1.12 −2.14 +1.36 | 7.14 {66%} | 0.40 |
| 8 | 11.83 | 3 | 487 916 a 1378 | 190–520 916–916 1345–1477 | +2.18 −4.64 +1.86 | 6.65 {56%} | 0.63 |
| 9 | 11.03 | 4 | 131 527 a 923 1484 | 131–131 428–626 824–956 1451–1715 | −2.30 −0.85 −0.81 +0.88 | 6.37 {58%} | 0.41 |
| 10 | 13.67 | 4 | 591 921 a 1350 1680 | 129–657 888–954 1284–1383 1680–1680 | +0.86 −1.42 −1.18 +1.73 | 10.62 {78%} | 0.48 |
© 2020 by the authors. Licensee MDPI, Basel, Switzerland. This article is an open access article distributed under the terms and conditions of the Creative Commons Attribution (CC BY) license (http://creativecommons.org/licenses/by/4.0/).
Share and Cite
Van den Berghe, P.; Gosseries, M.; Gerlo, J.; Lenoir, M.; Leman, M.; De Clercq, D. Change-Point Detection of Peak Tibial Acceleration in Overground Running Retraining. Sensors 2020, 20, 1720. https://doi.org/10.3390/s20061720
Van den Berghe P, Gosseries M, Gerlo J, Lenoir M, Leman M, De Clercq D. Change-Point Detection of Peak Tibial Acceleration in Overground Running Retraining. Sensors. 2020; 20(6):1720. https://doi.org/10.3390/s20061720
Chicago/Turabian StyleVan den Berghe, Pieter, Maxim Gosseries, Joeri Gerlo, Matthieu Lenoir, Marc Leman, and Dirk De Clercq. 2020. "Change-Point Detection of Peak Tibial Acceleration in Overground Running Retraining" Sensors 20, no. 6: 1720. https://doi.org/10.3390/s20061720
APA StyleVan den Berghe, P., Gosseries, M., Gerlo, J., Lenoir, M., Leman, M., & De Clercq, D. (2020). Change-Point Detection of Peak Tibial Acceleration in Overground Running Retraining. Sensors, 20(6), 1720. https://doi.org/10.3390/s20061720