A Software Deep Packet Inspection System for Network Traffic Analysis and Anomaly Detection

 ,
,  , , and
Abstract
:1. Introduction
- -
- Anomalies can cause network congestion and increase router resource utilization, making their detection critical.
- -
- Some anomalies do not necessarily affect the network, but they can have a serious impact on a client or end user.
2. Related Work
2.1. Background on Network Anomaly Detection Methods
2.2. Background on DPI System
2.3. Related Research on Network Traffic Analysis and Anomaly Detection in IoT and WSN
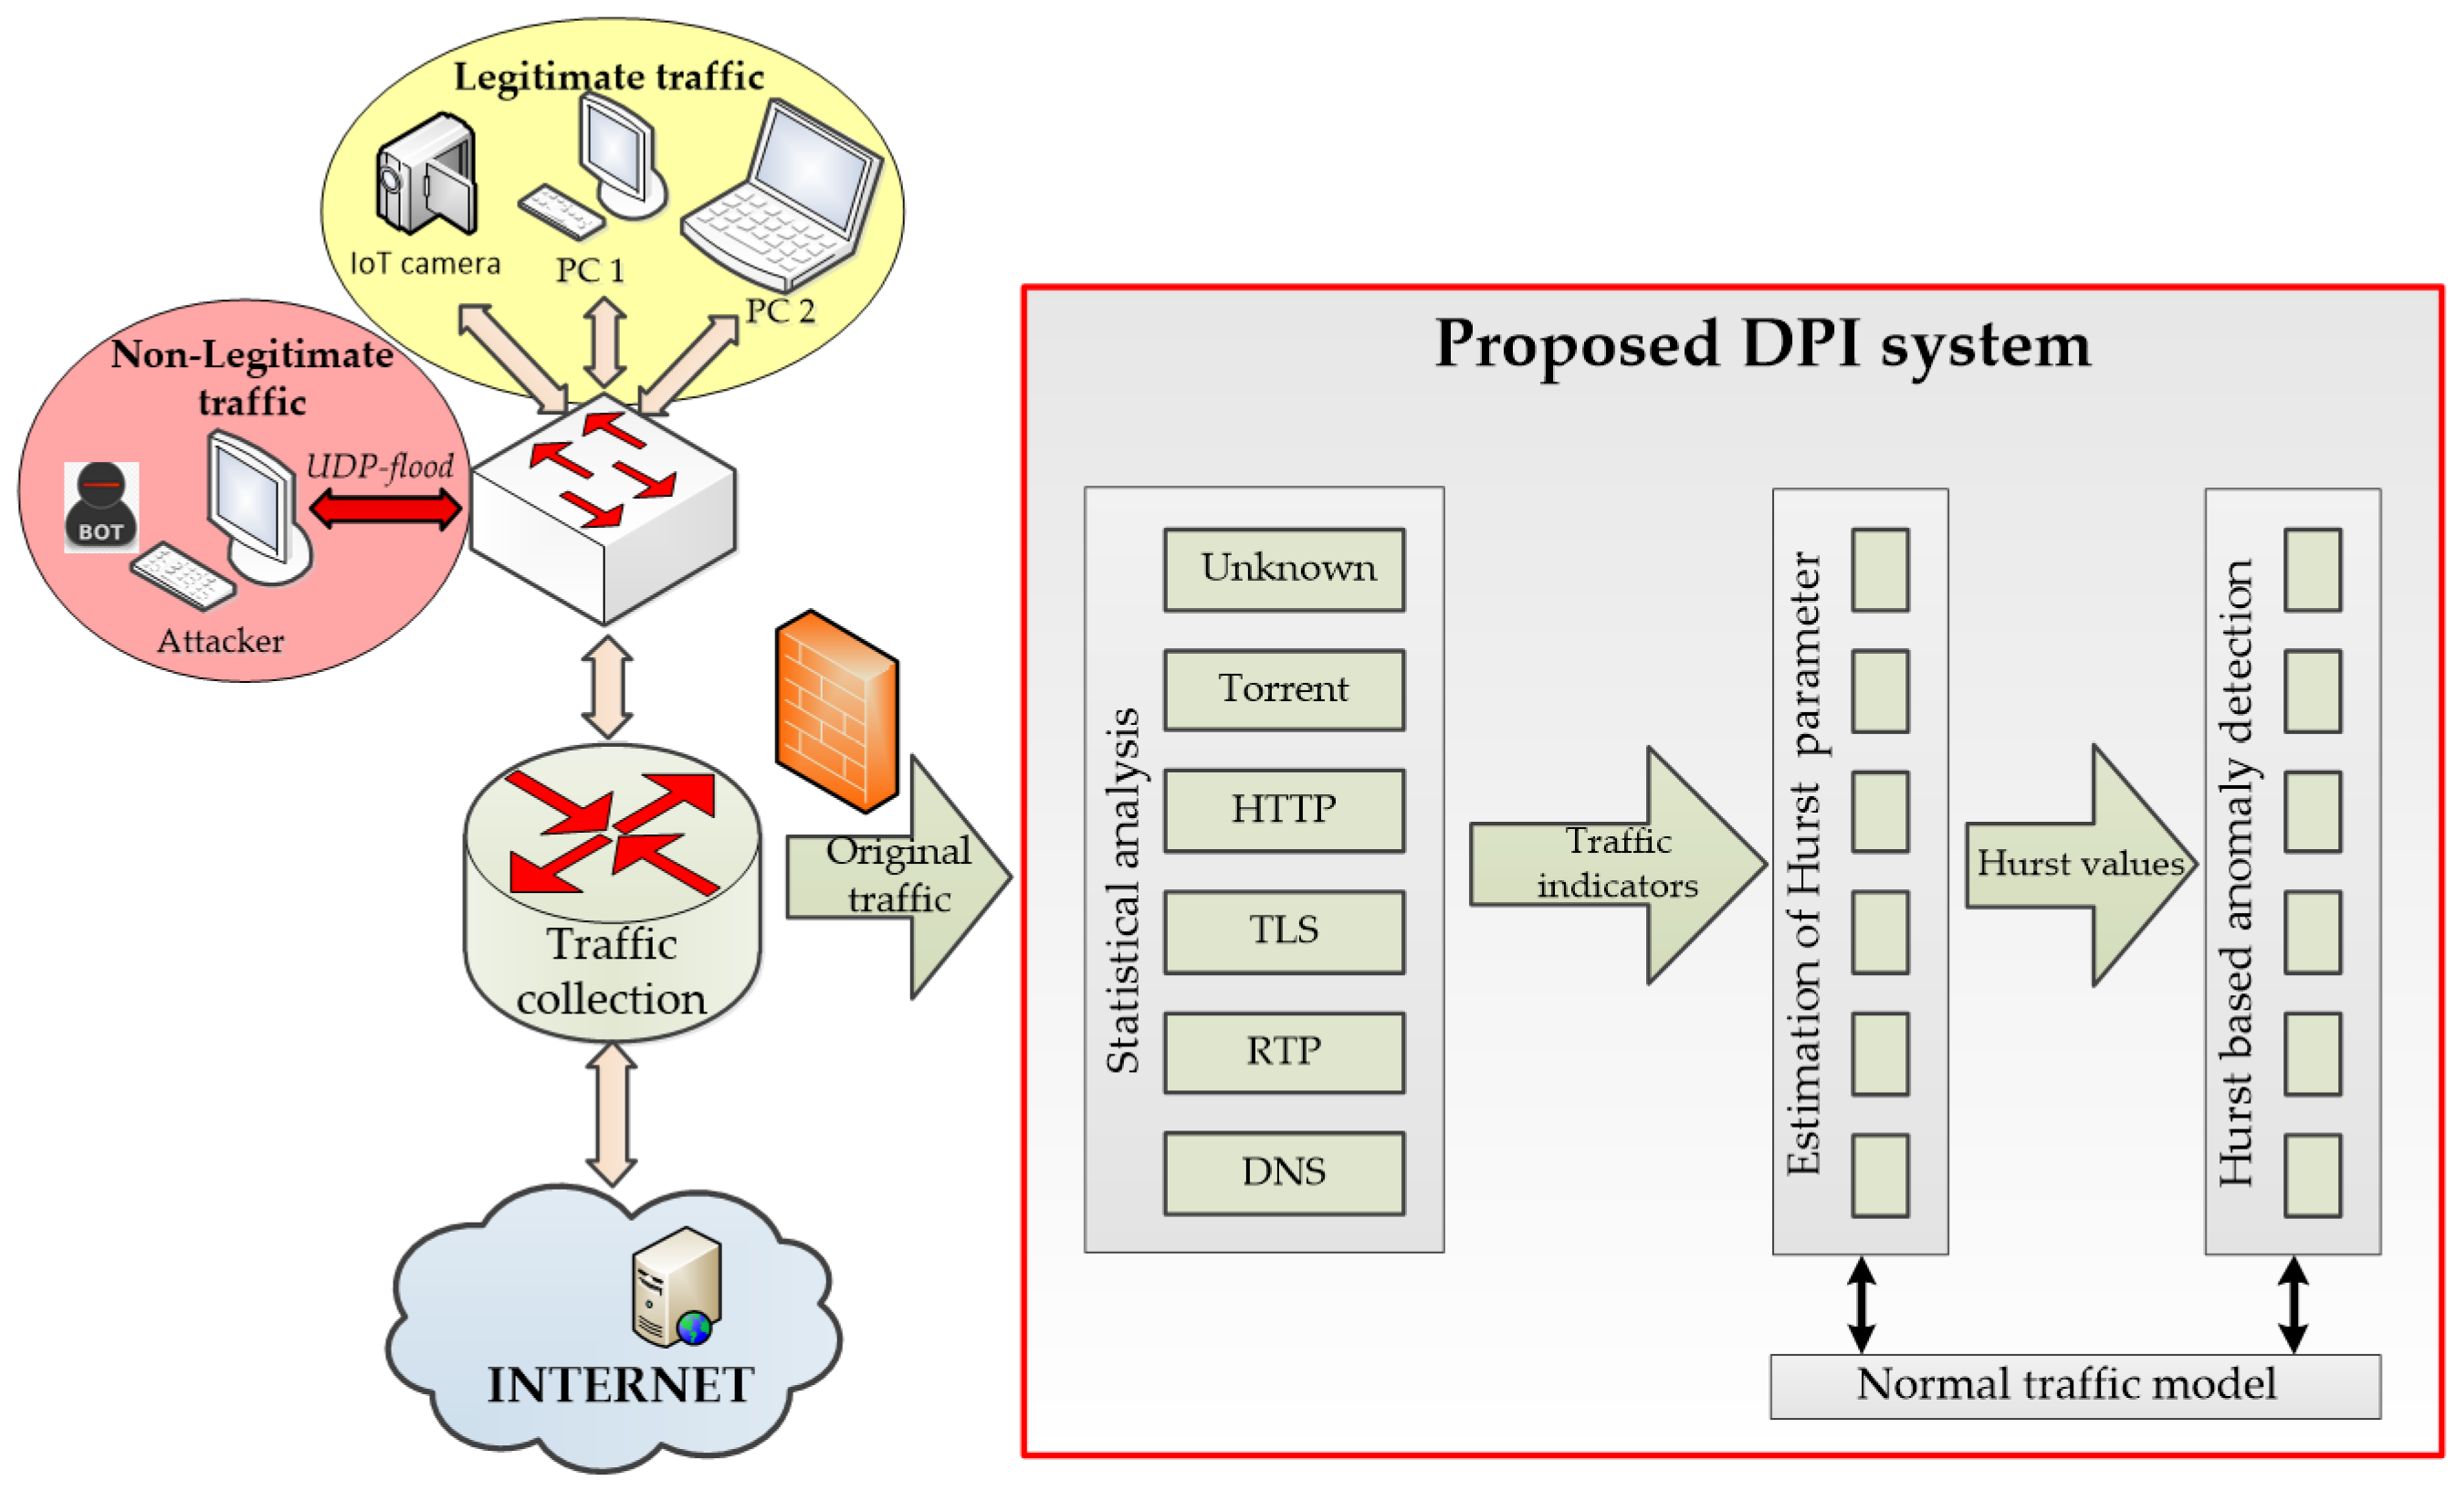
3. Description of the Proposed Method for Network Traffic Anomaly Detection and Prevention
- Installing the device (SHC) in the enterprise network;
- Capturing of subscriber traffic and processing using an algorithm;
- Reaction to the detected anomaly (depends on the installation scheme).
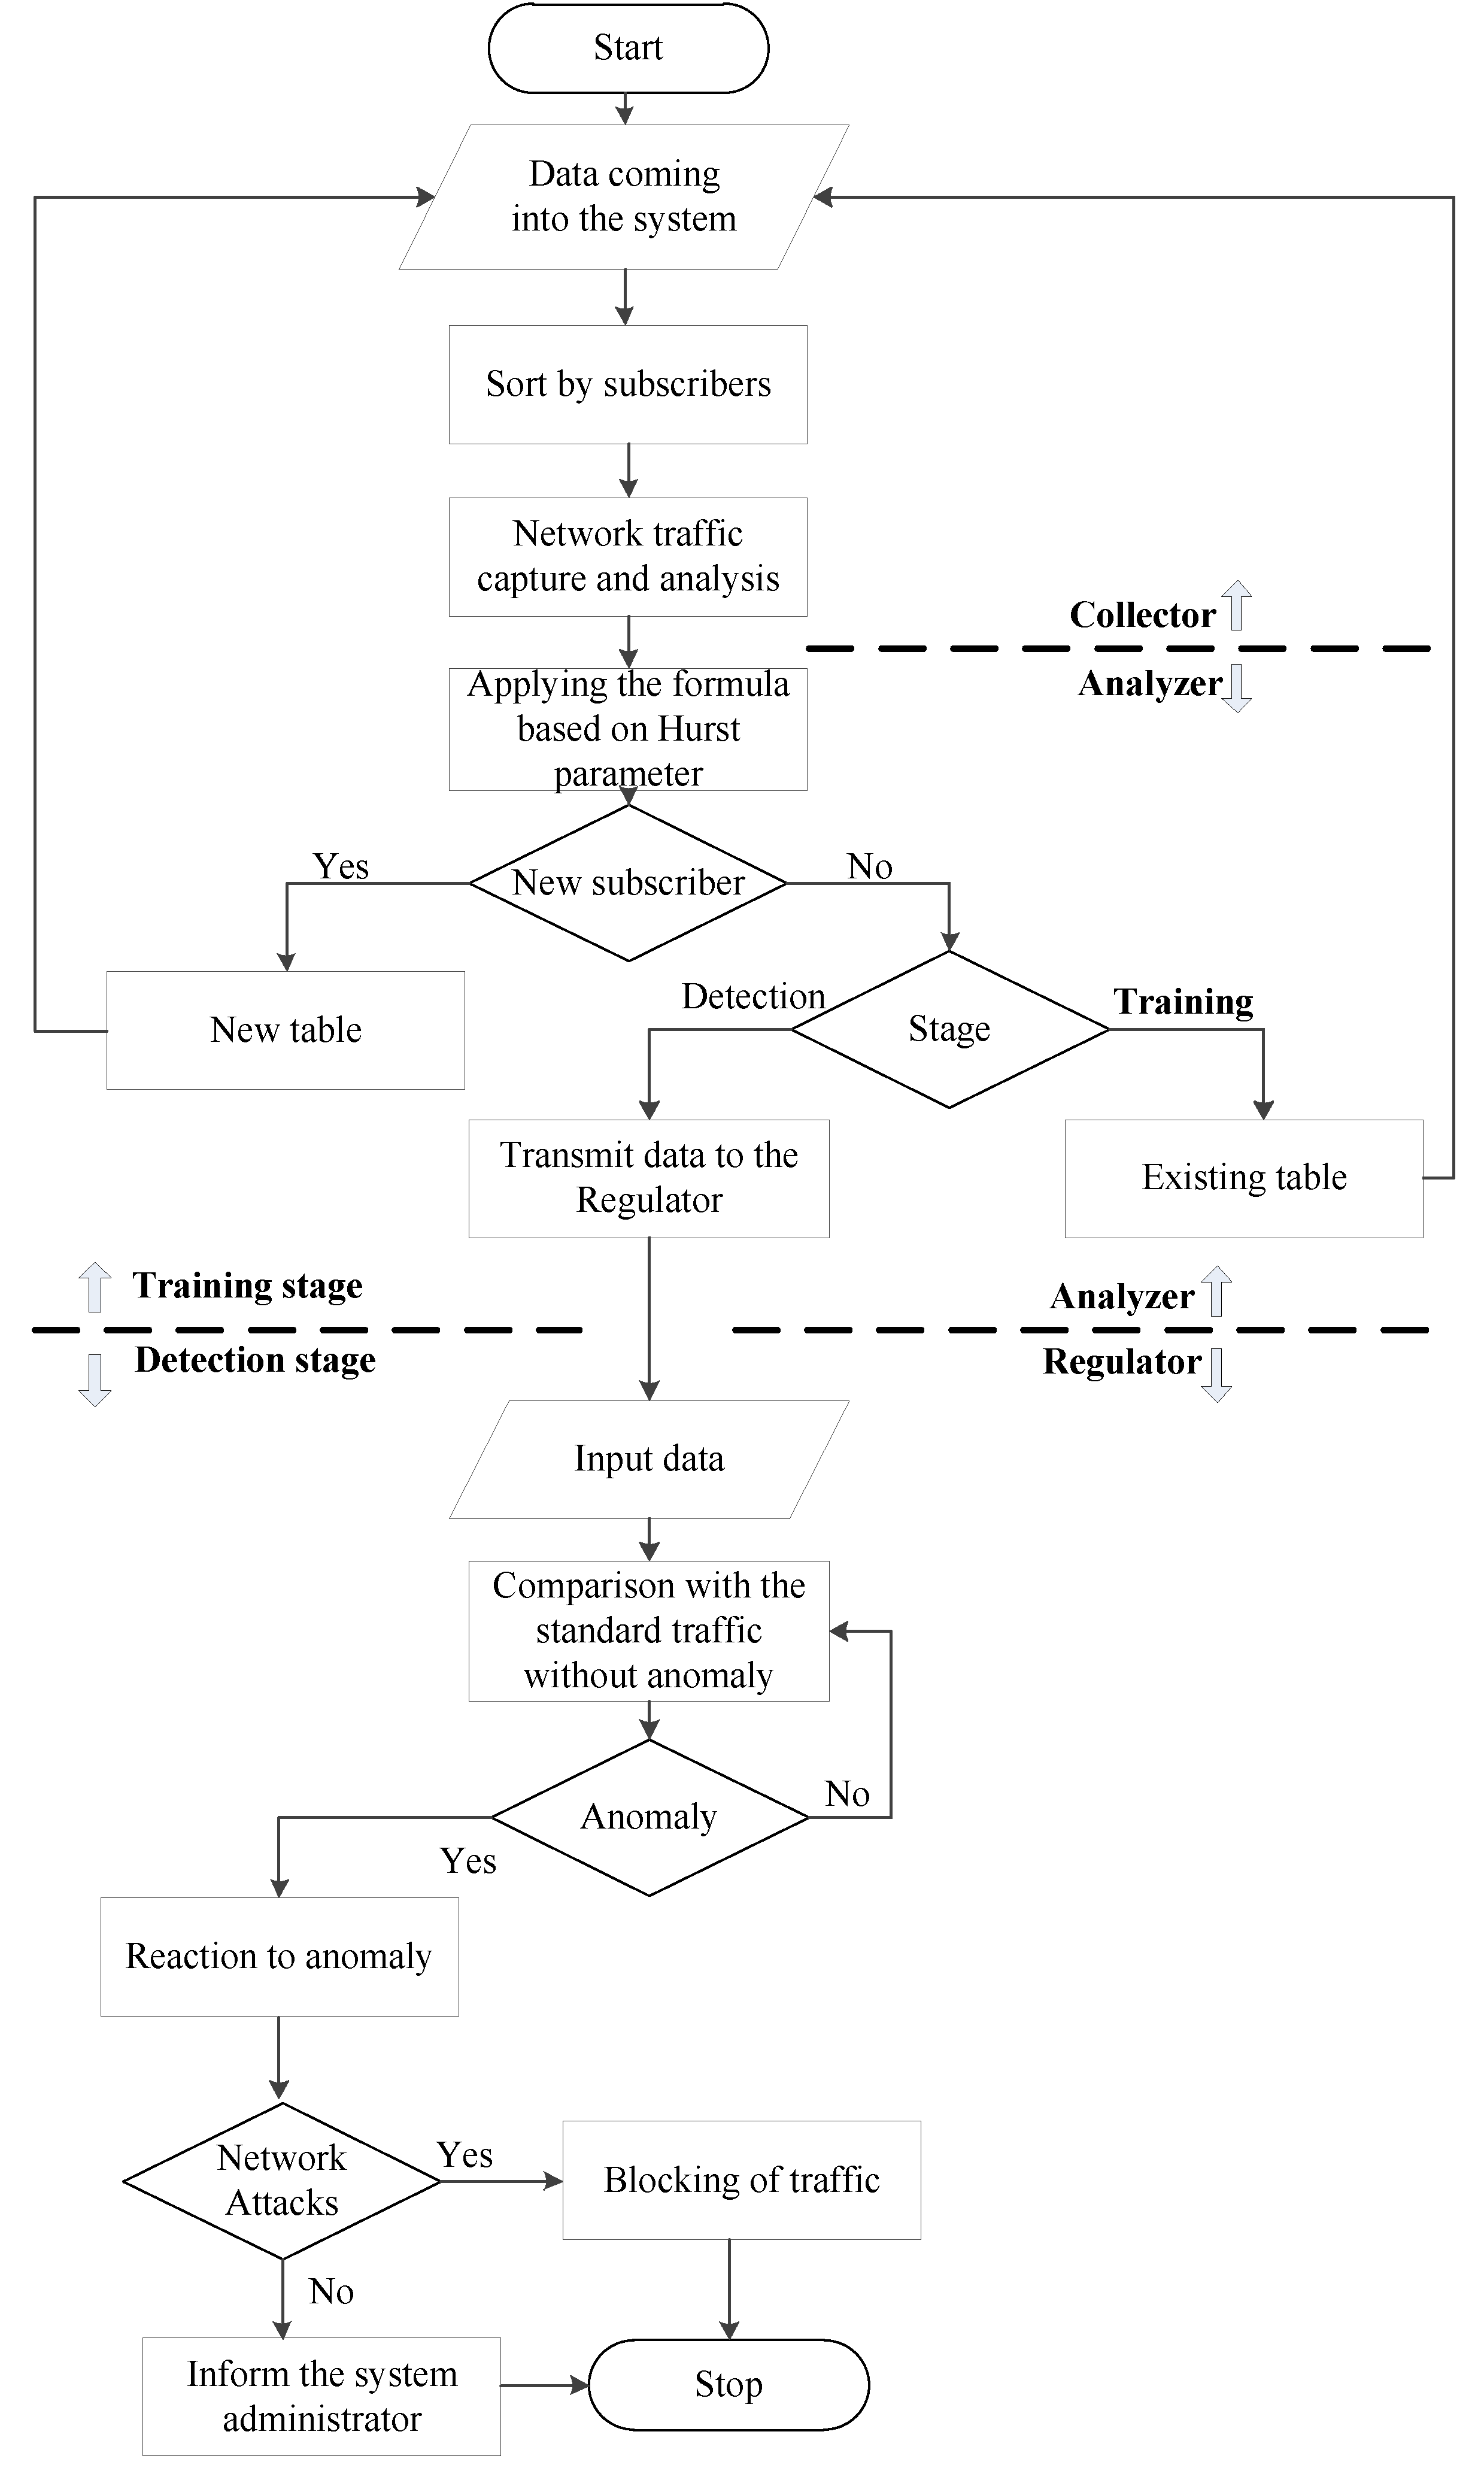
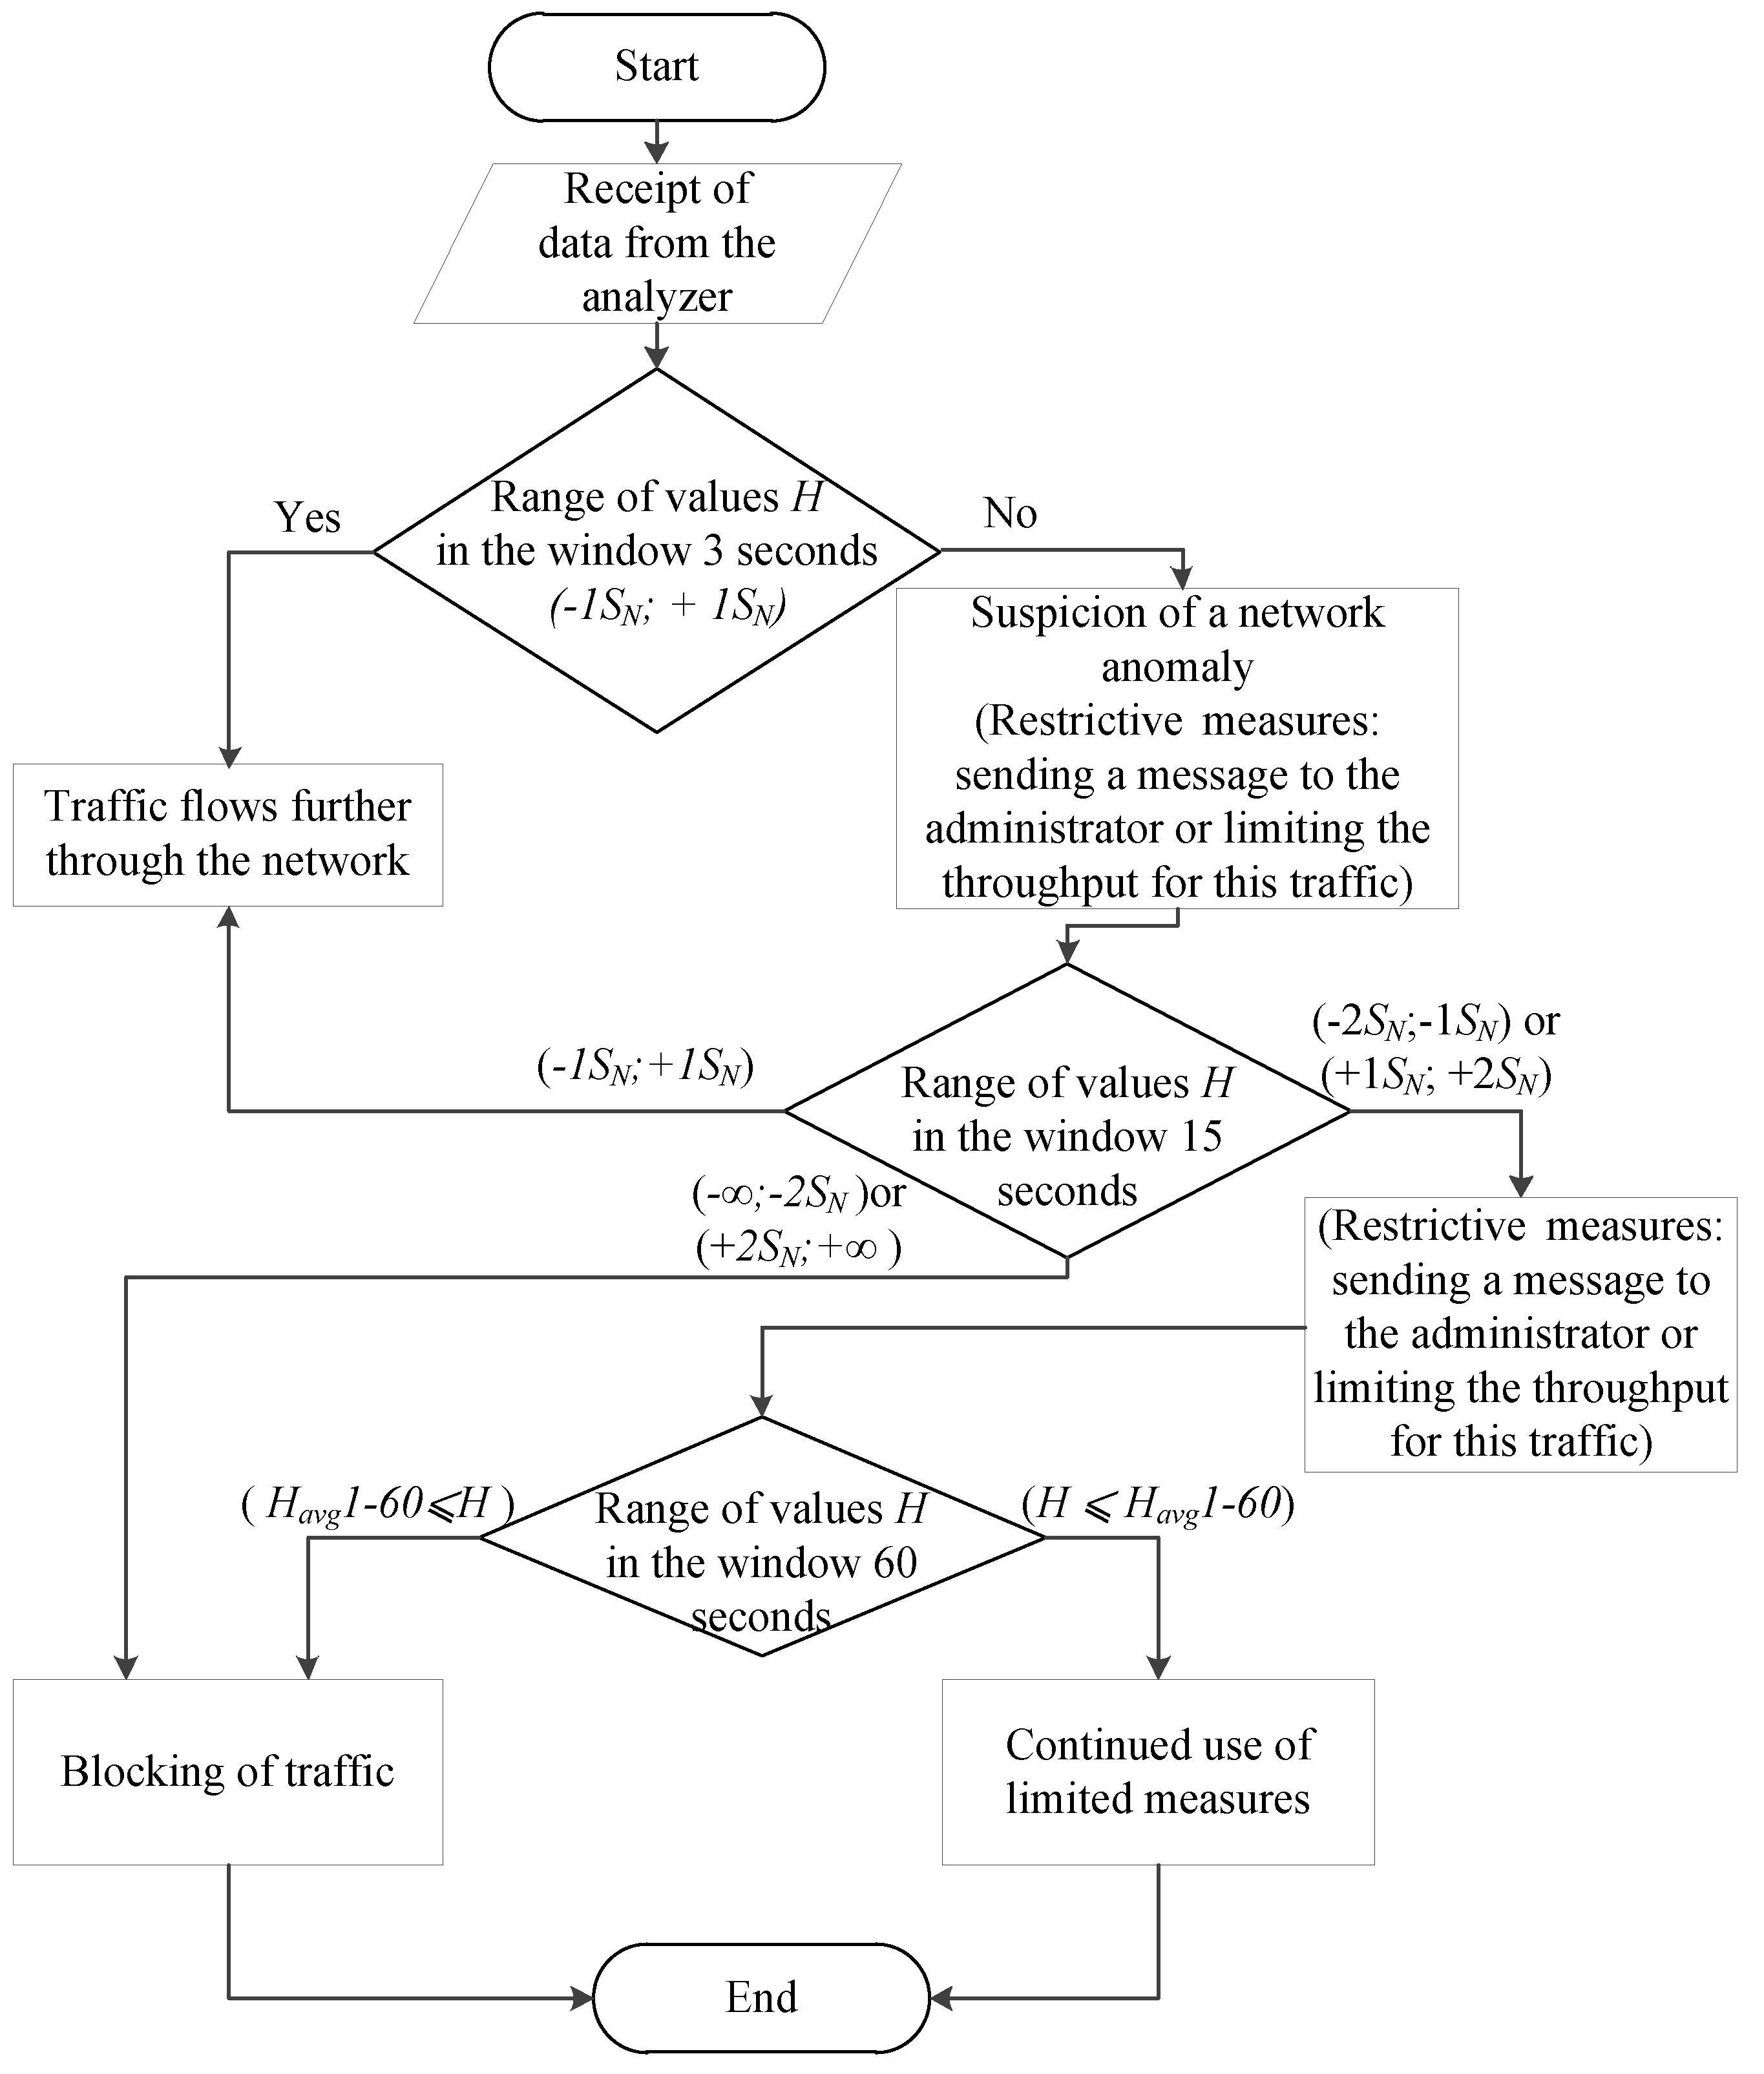
3.1. Block Diagram of the Network Anomaly Detection Algorithm Based On Hurst Parameter Estimation by R/S Method
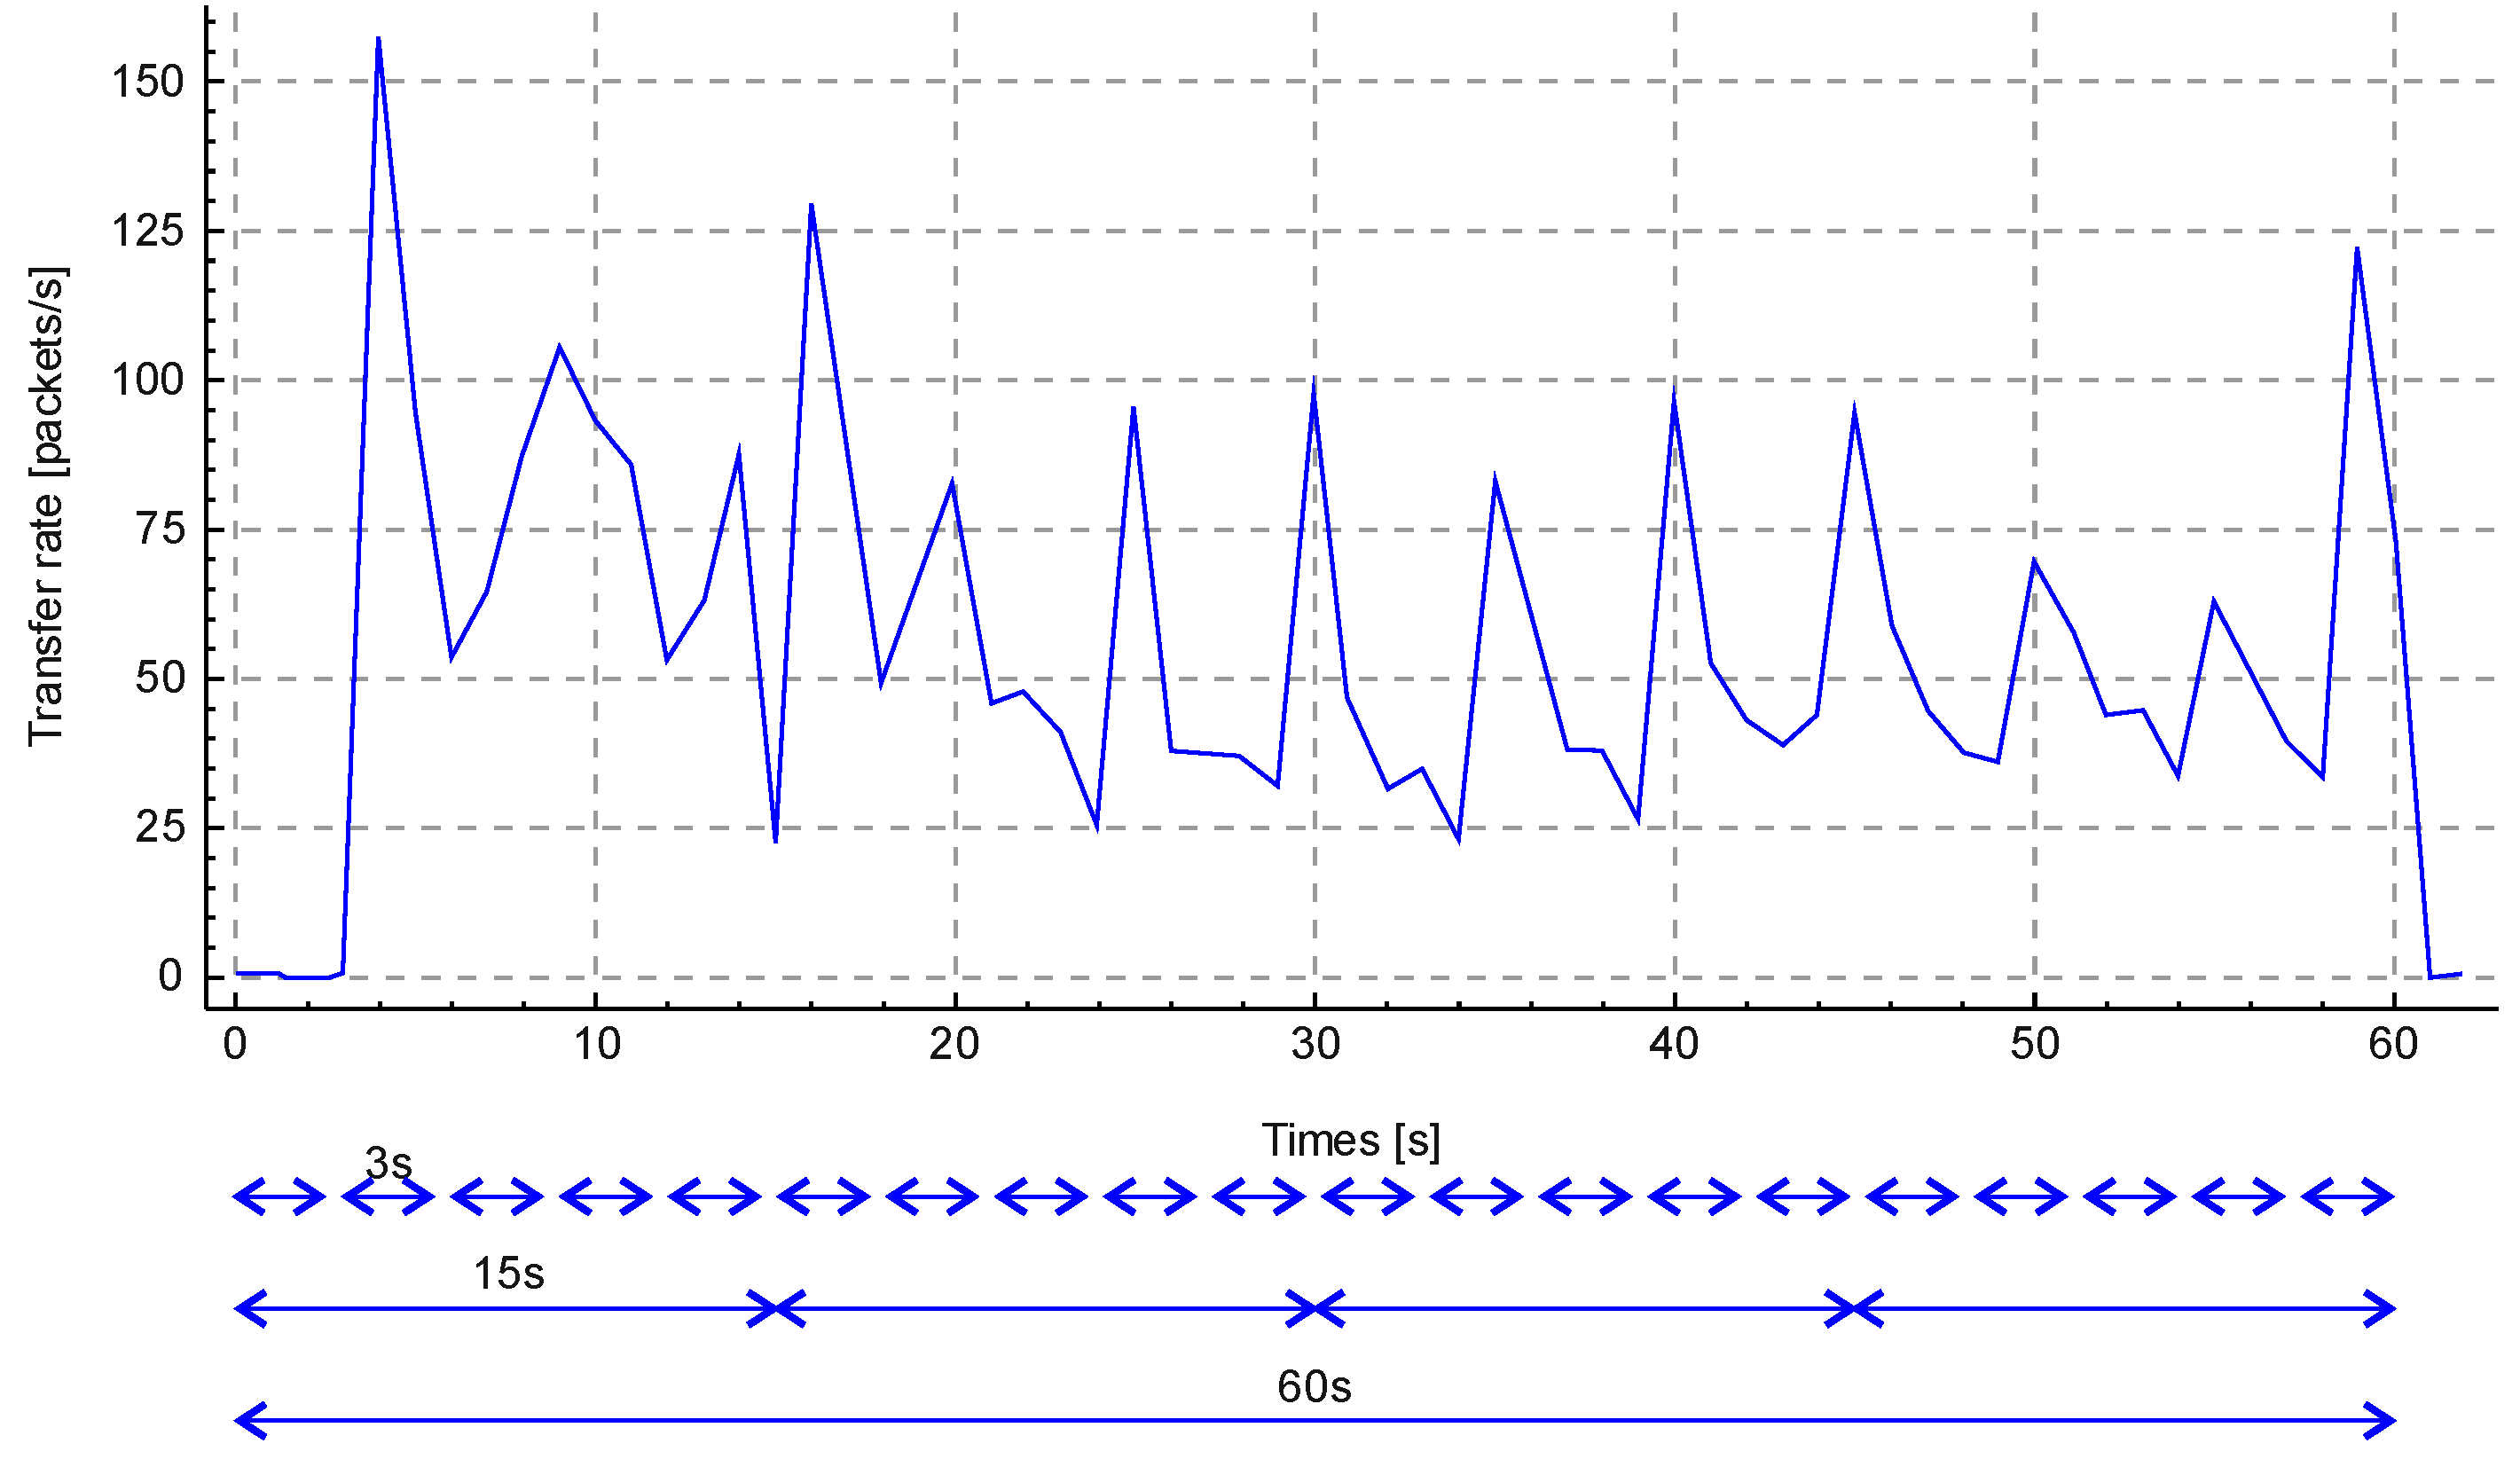
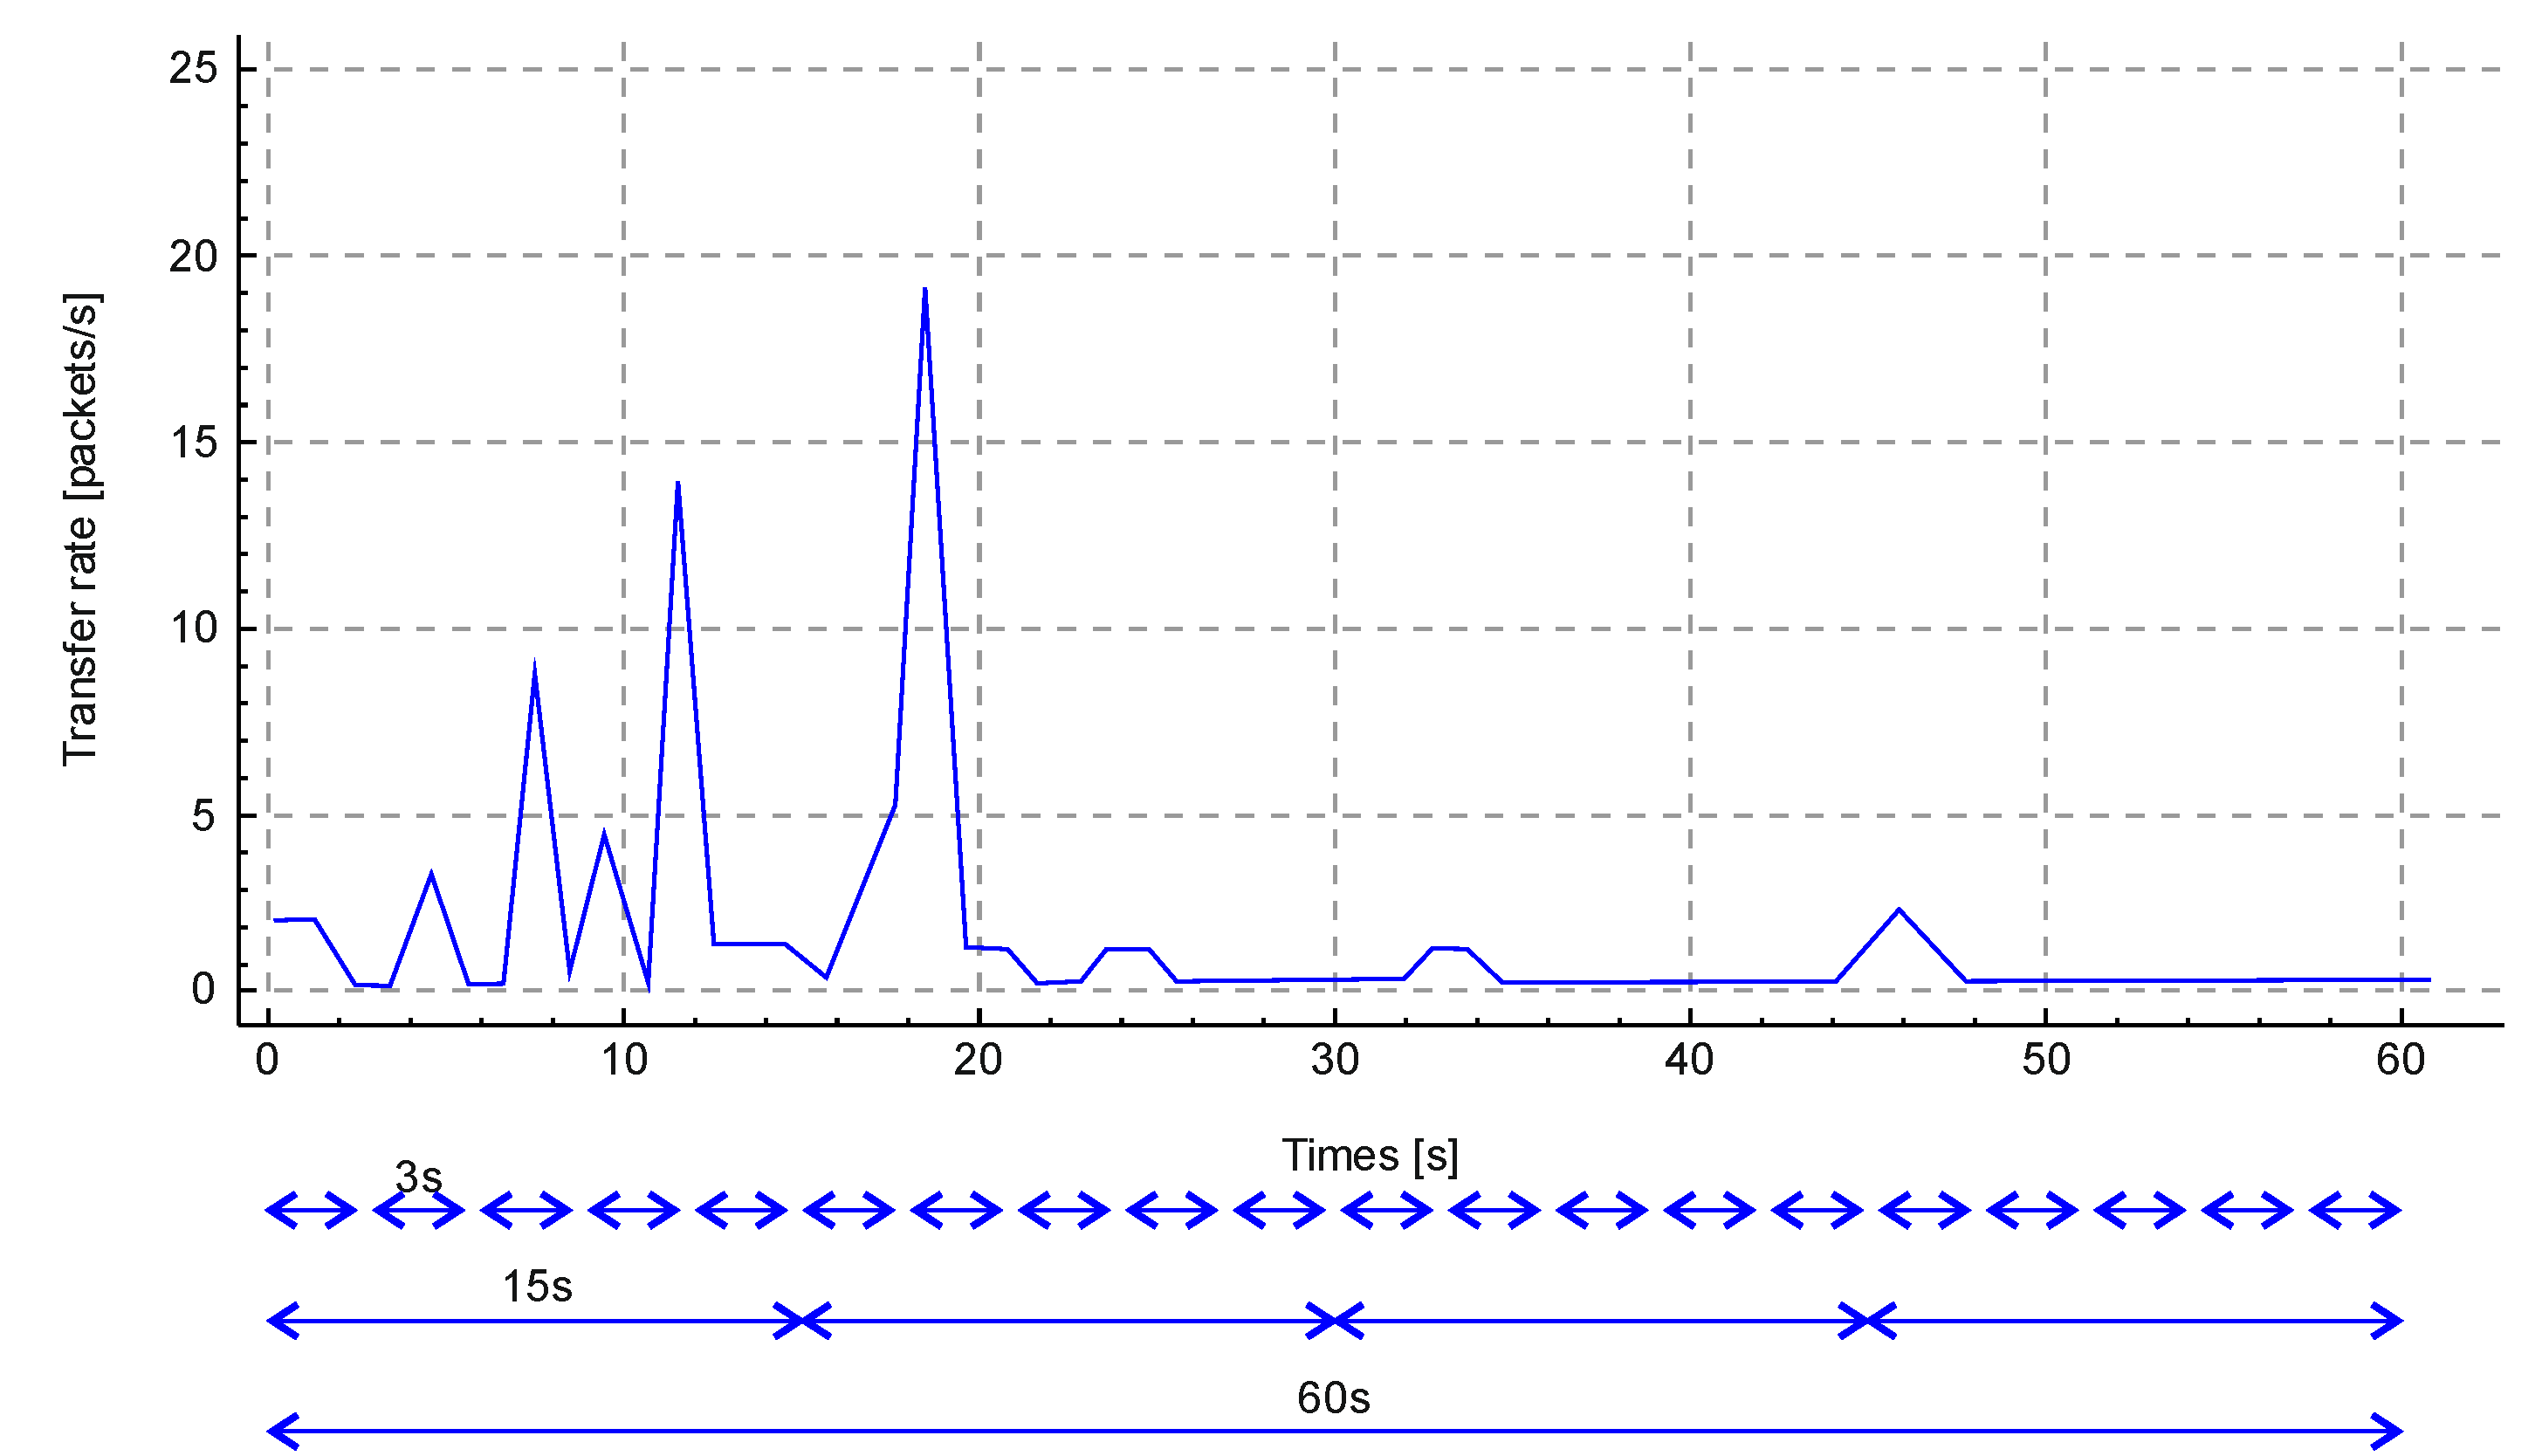
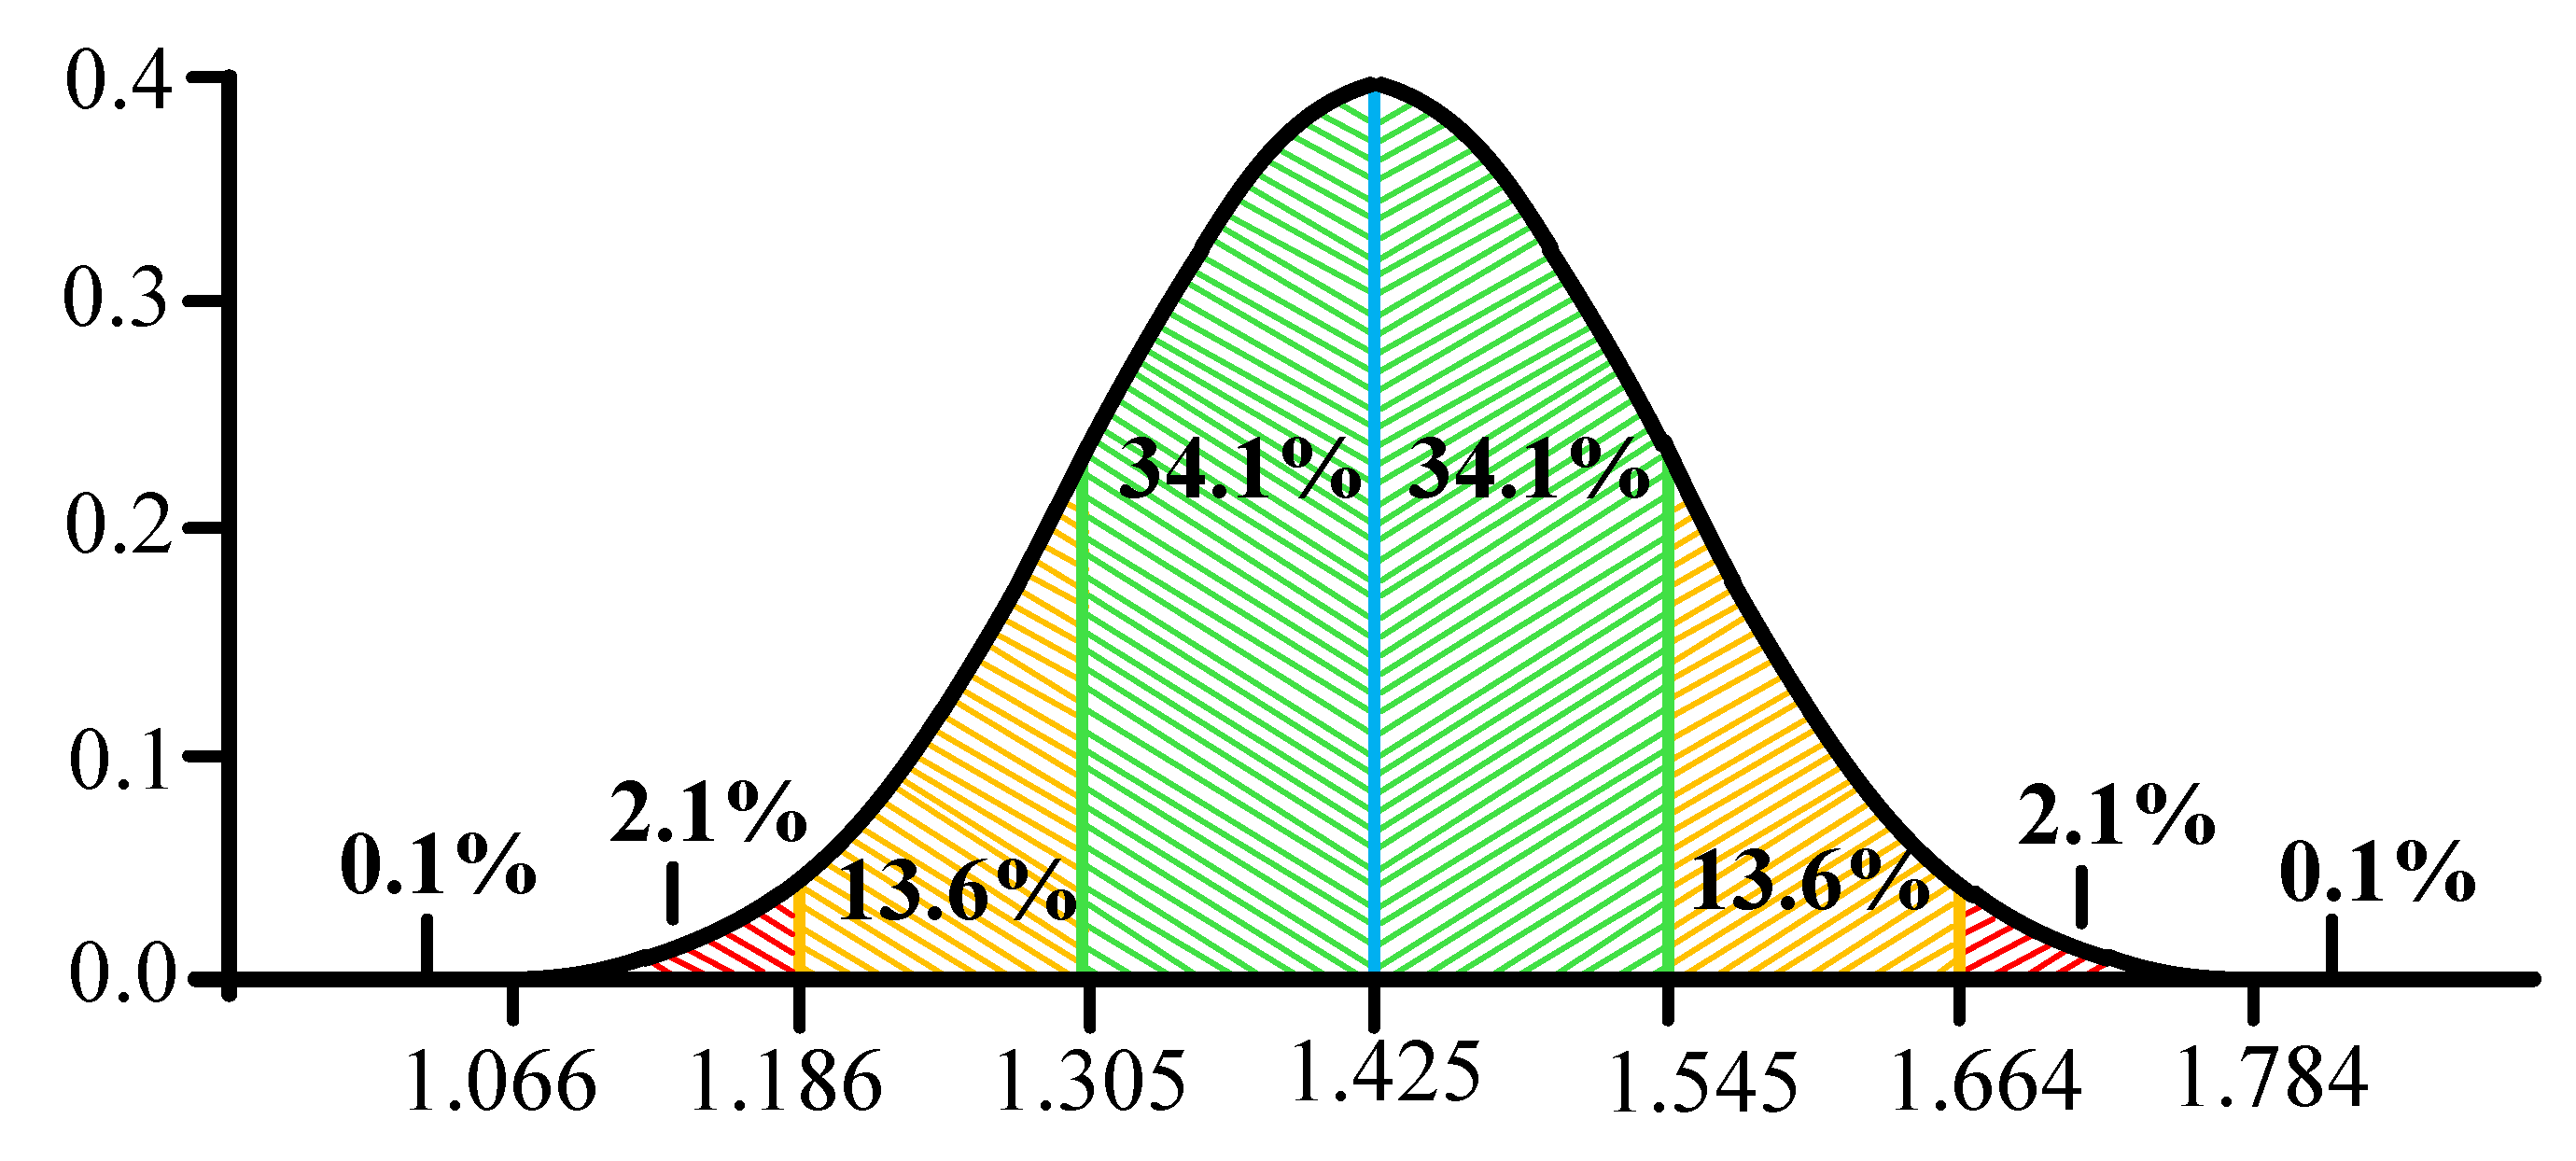
3.2. Demonstration of the Anomaly Criterion H Calculation on the Example of Web Traffic
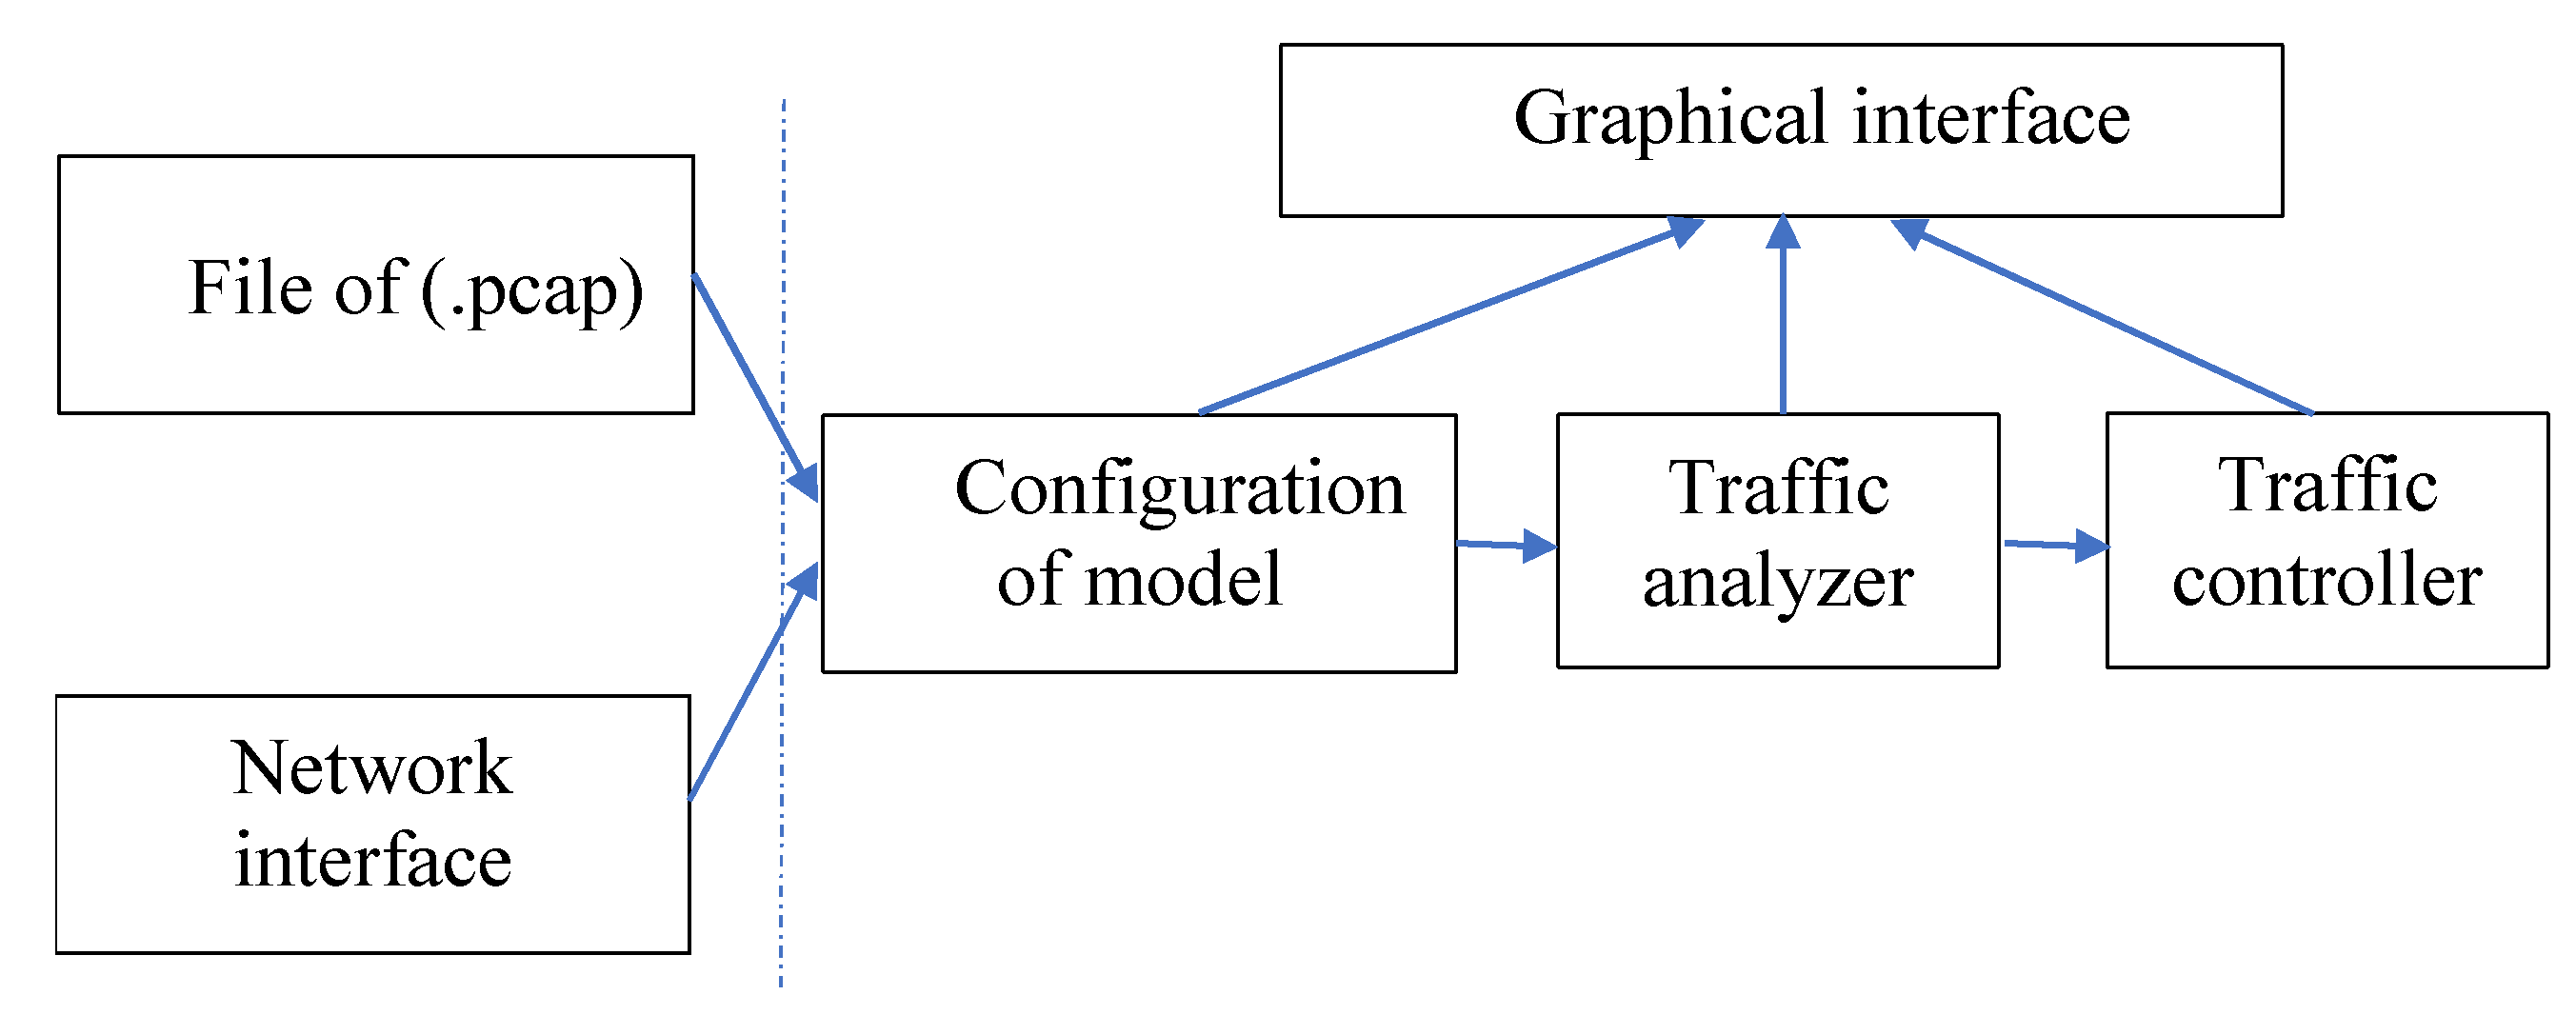
4. Development of Software DPI System for Network Traffic Analysis and Anomaly Detection
4.1. Algorithms for Network Traffic Capturing, Analyzing, and Detecting
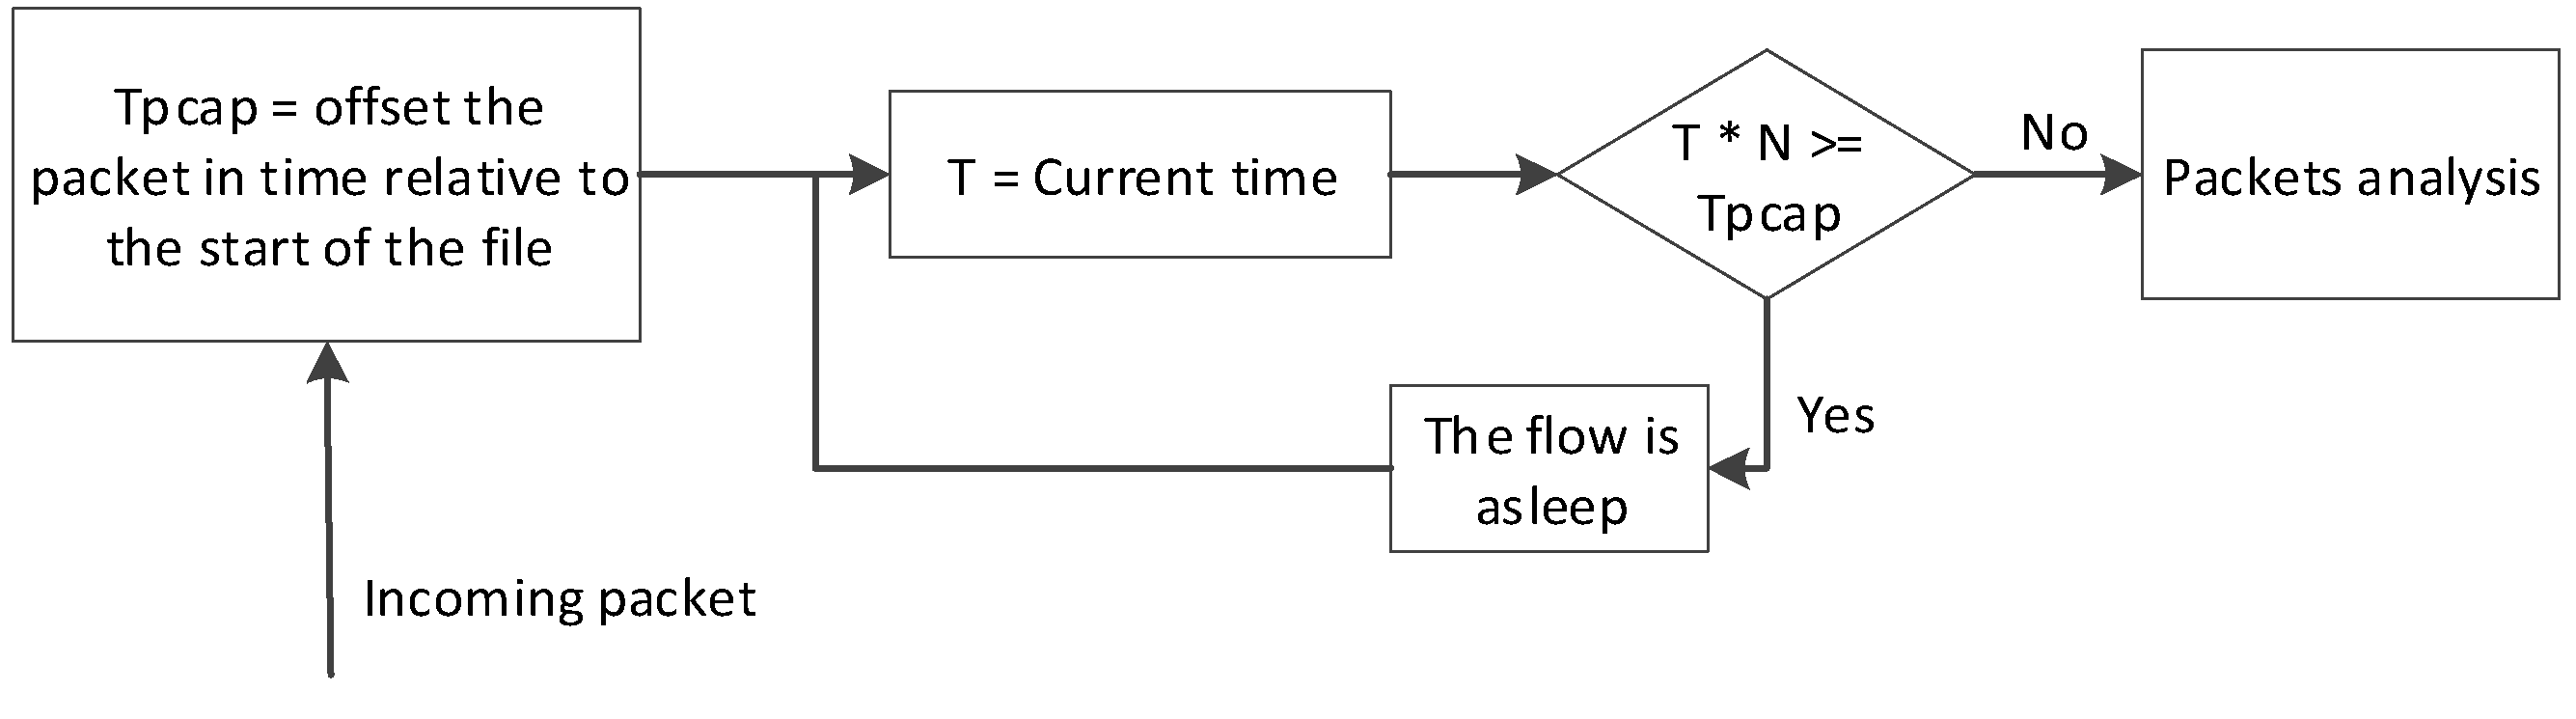
4.1.1. Algorithms for Capturing Data from the Input Interface
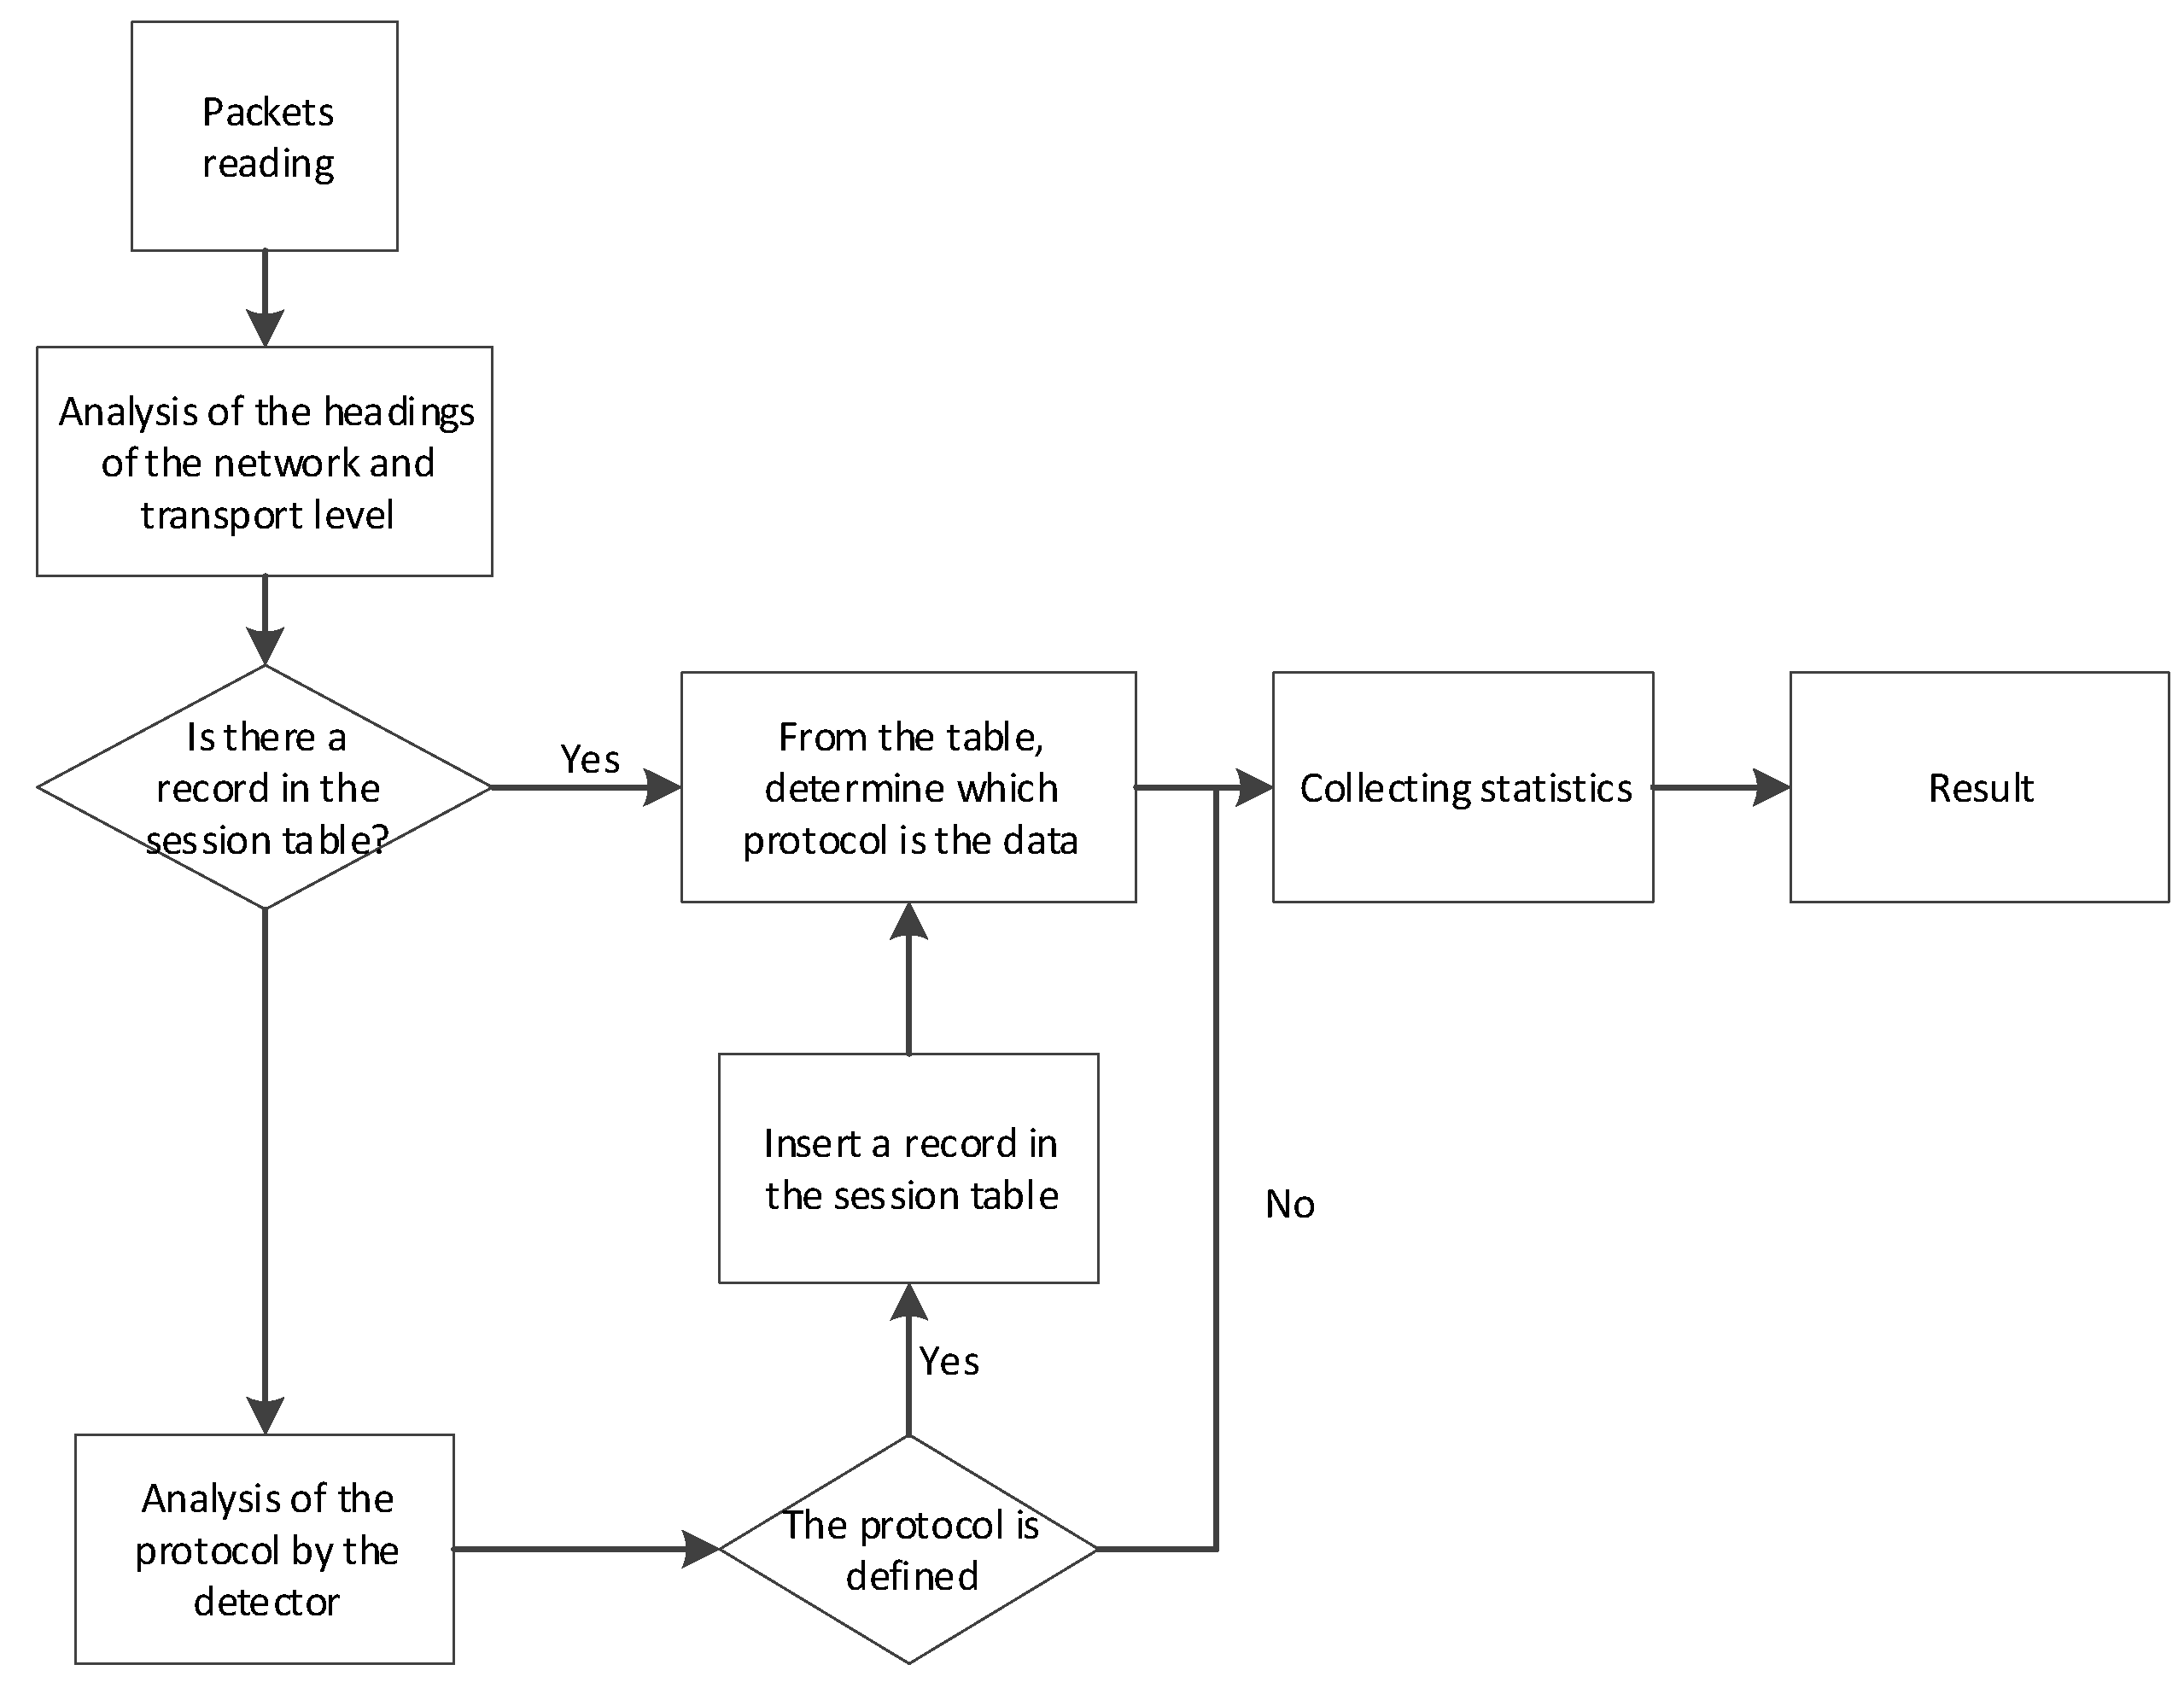
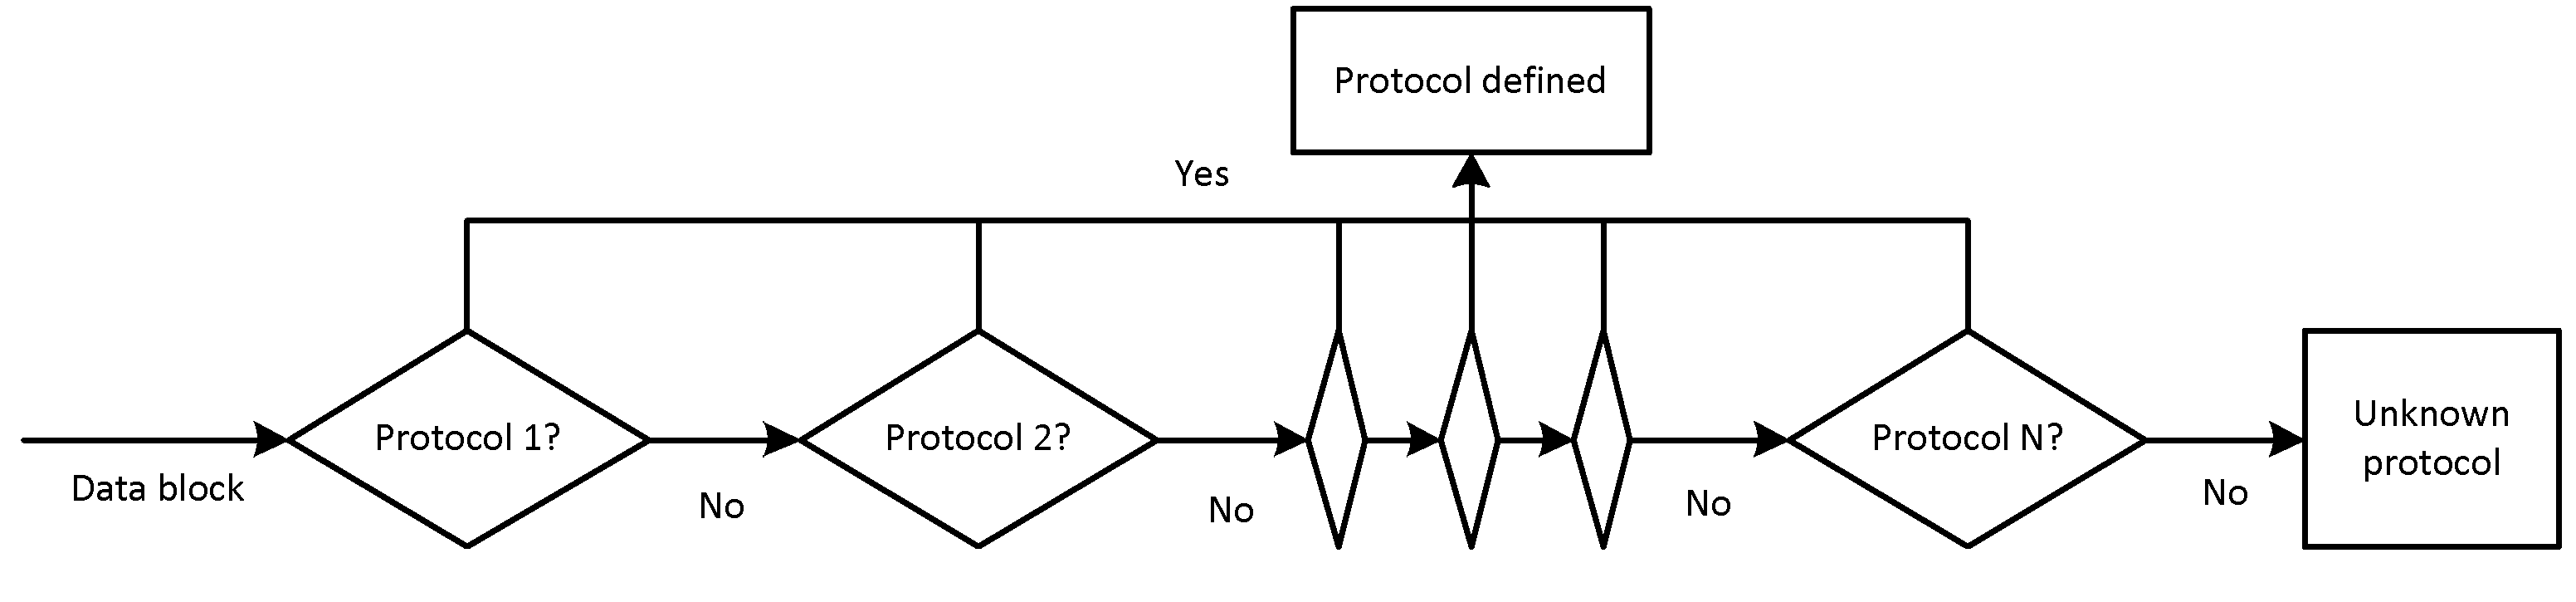
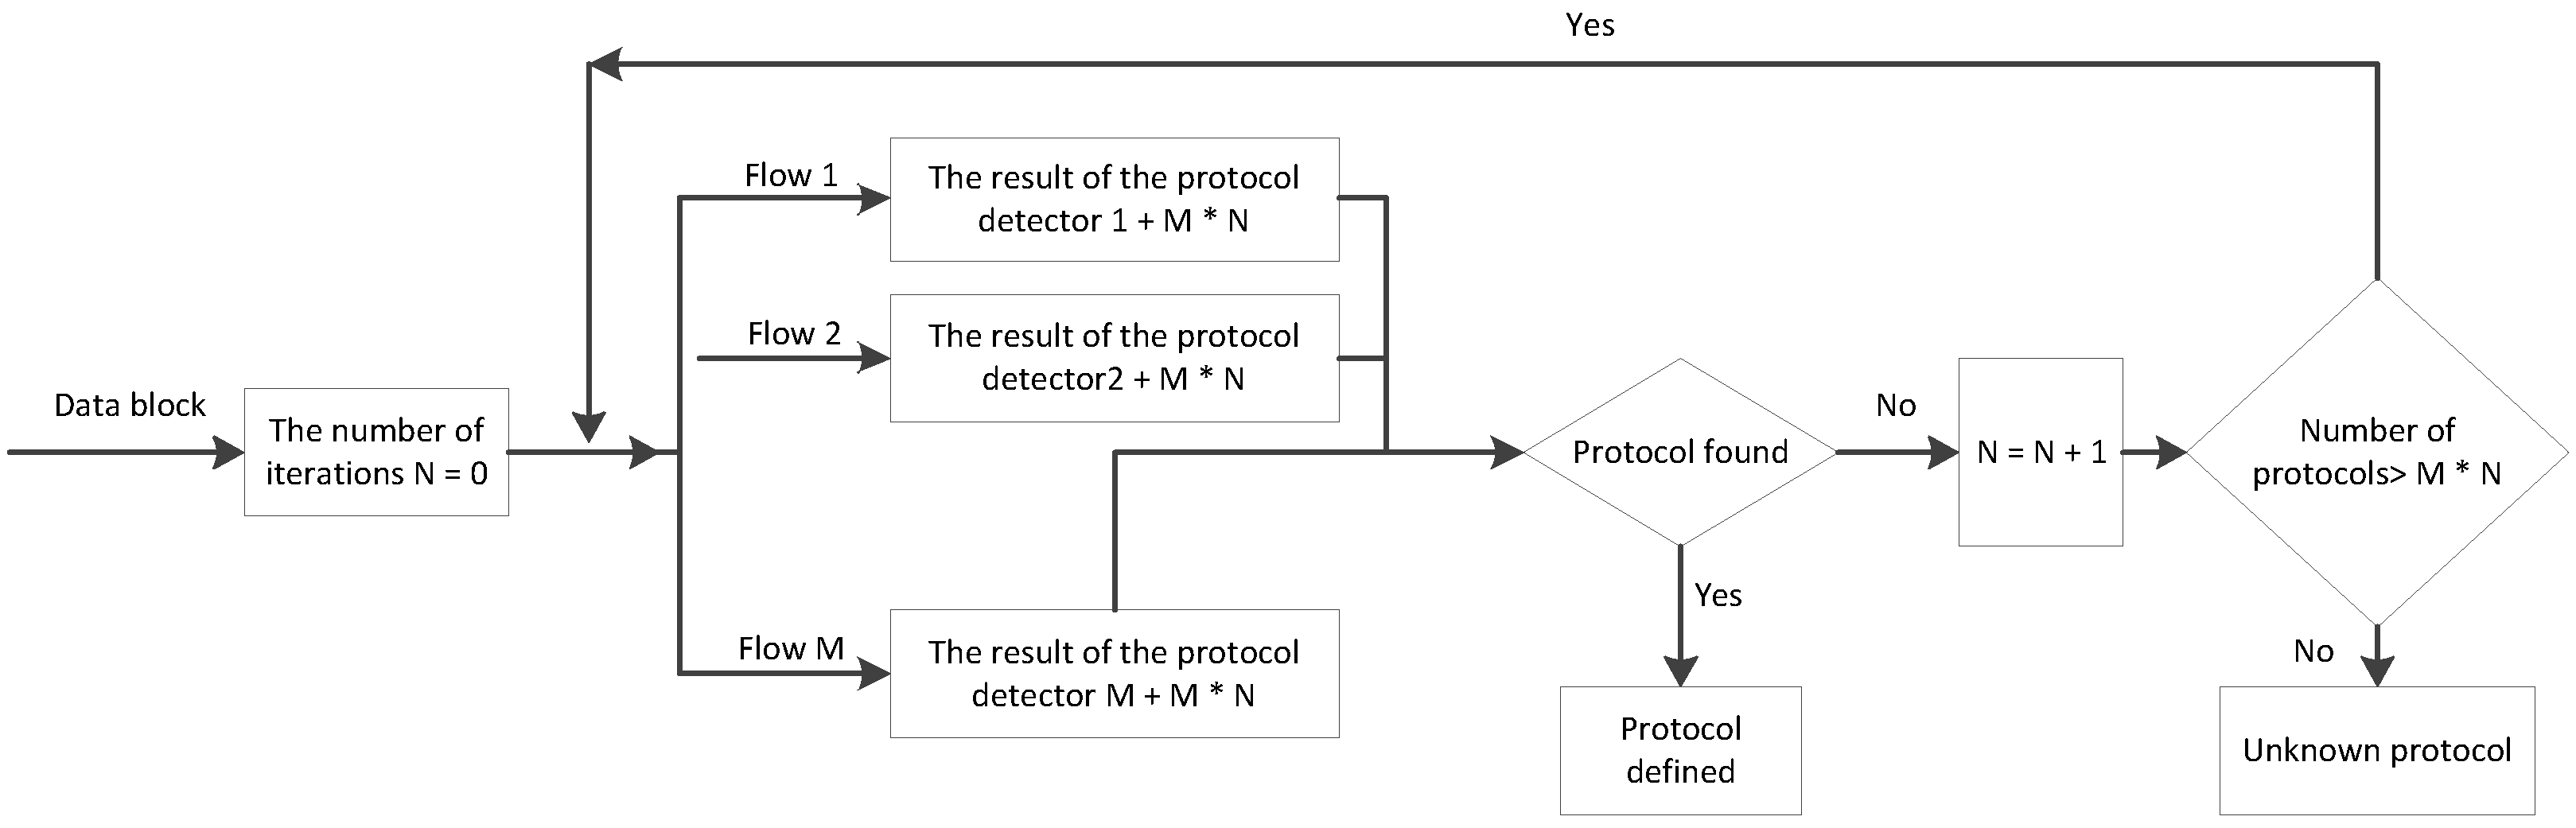
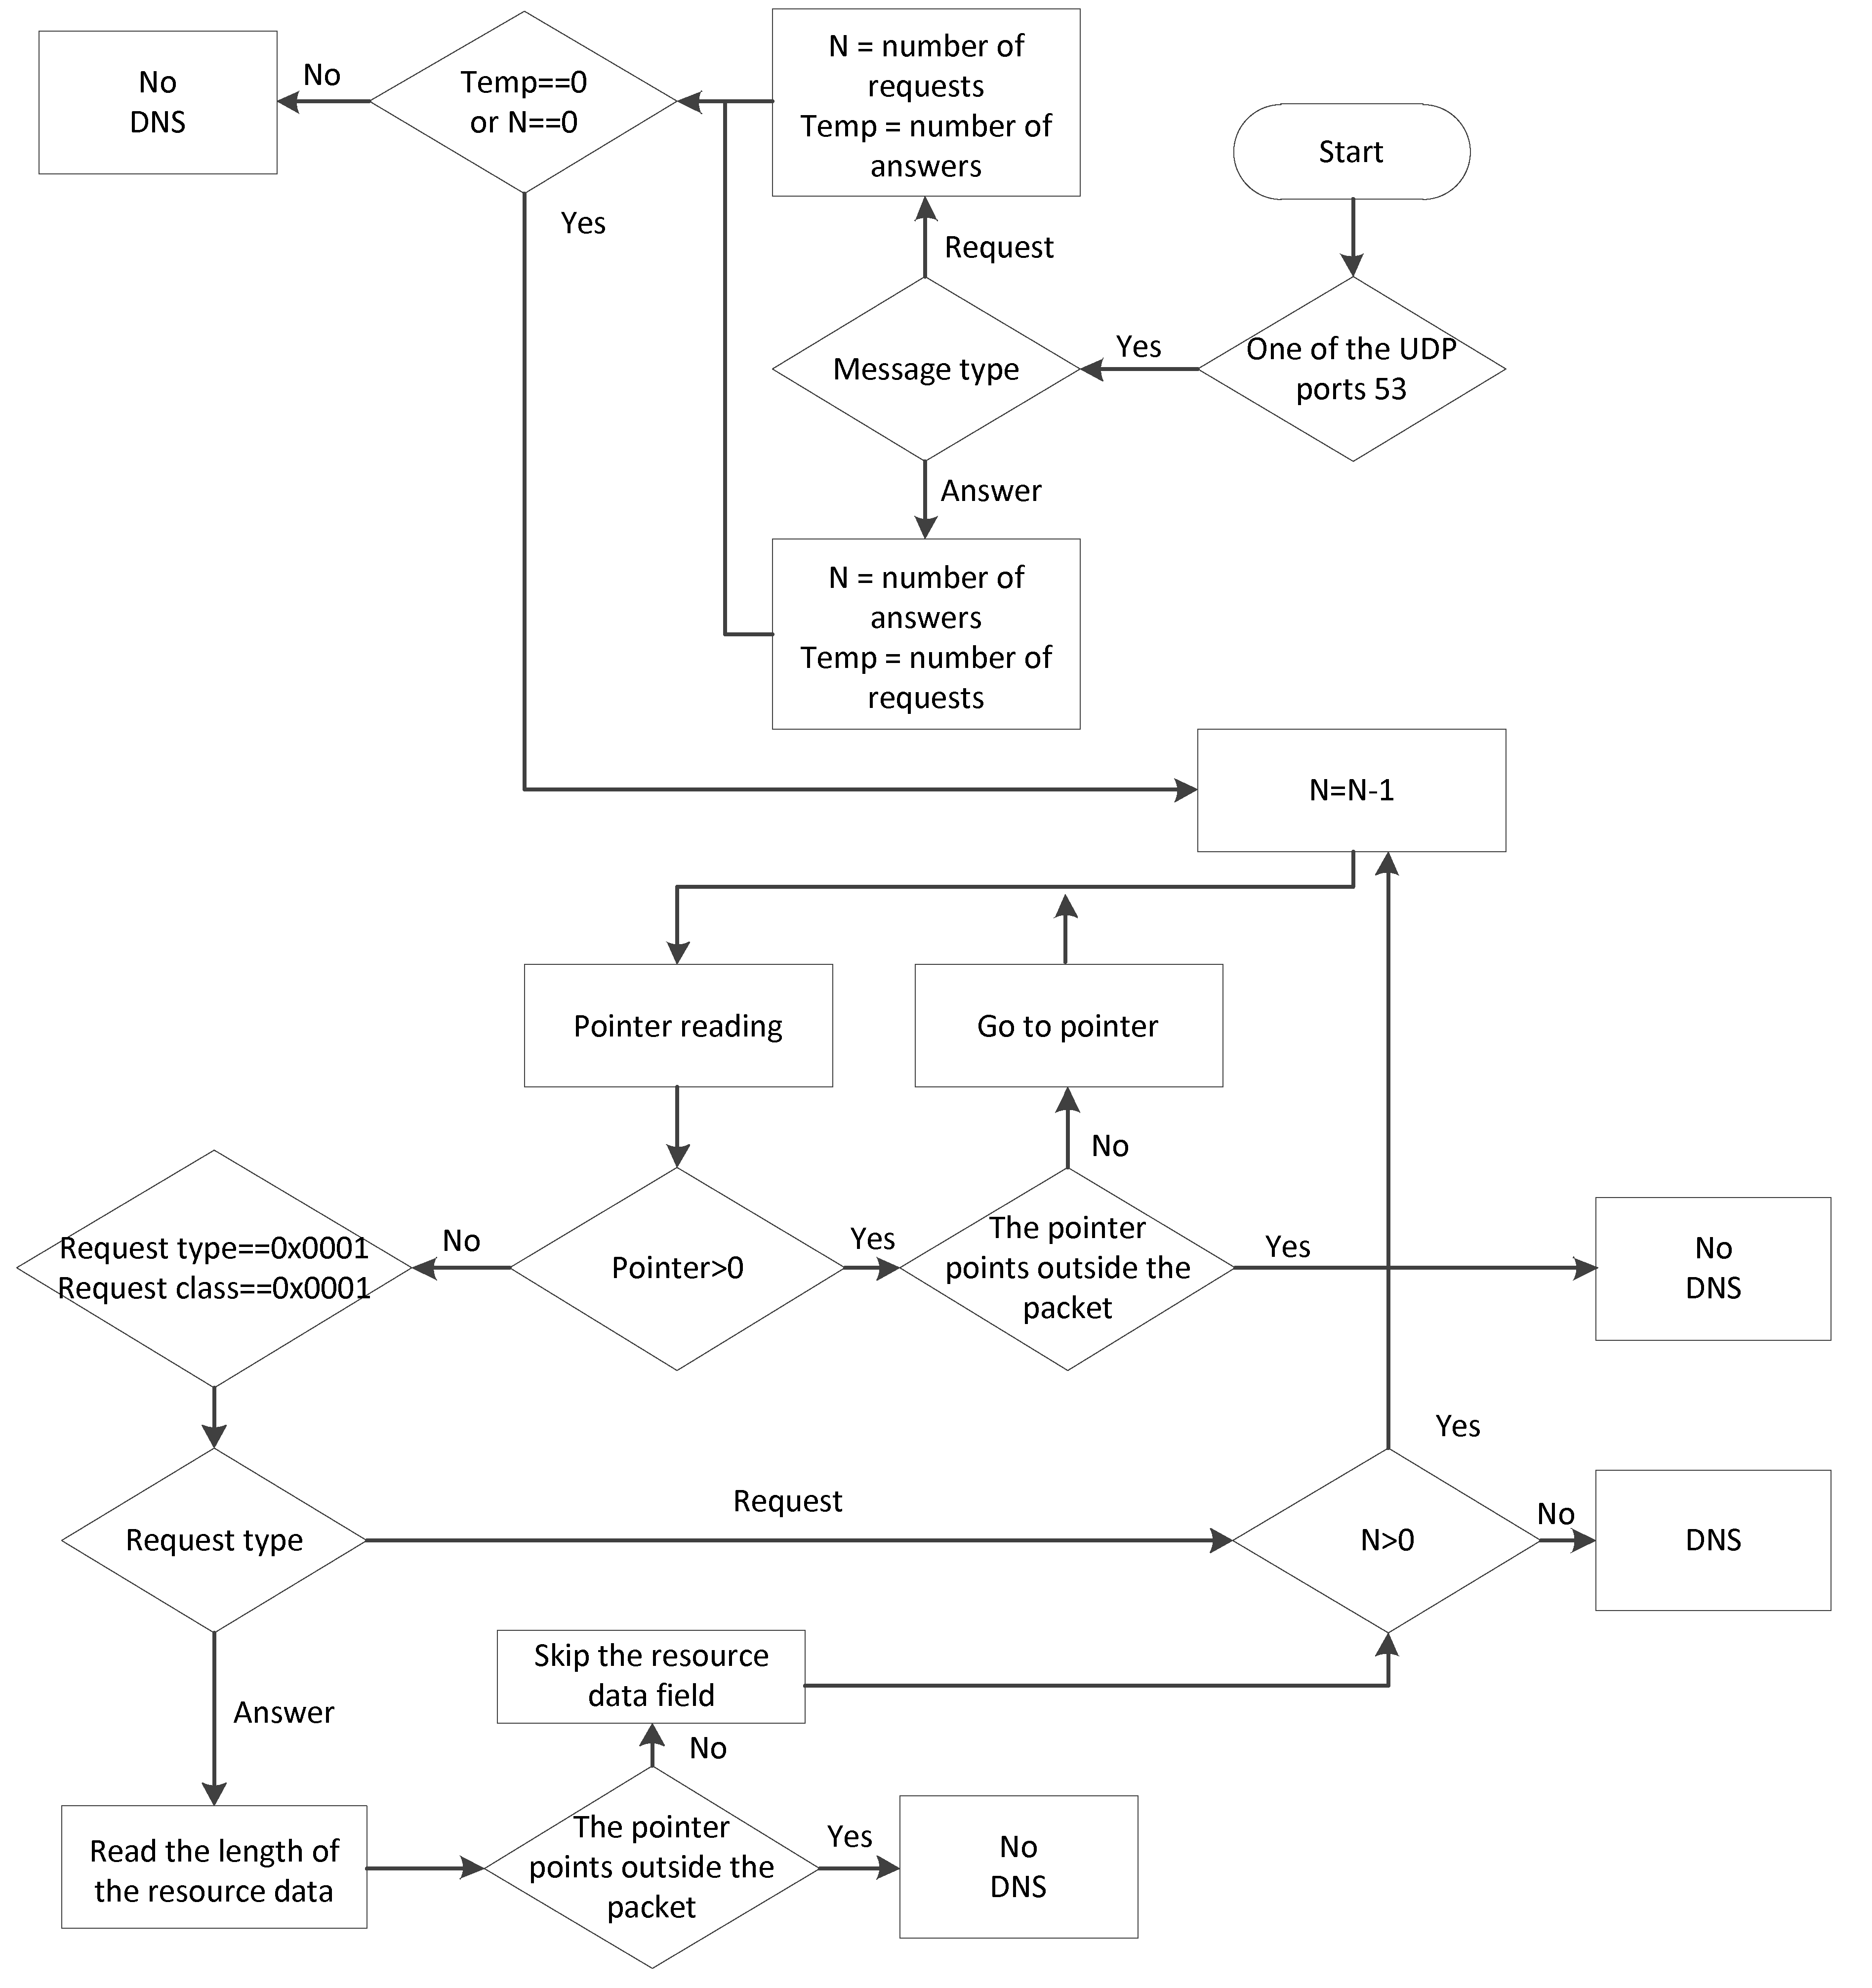
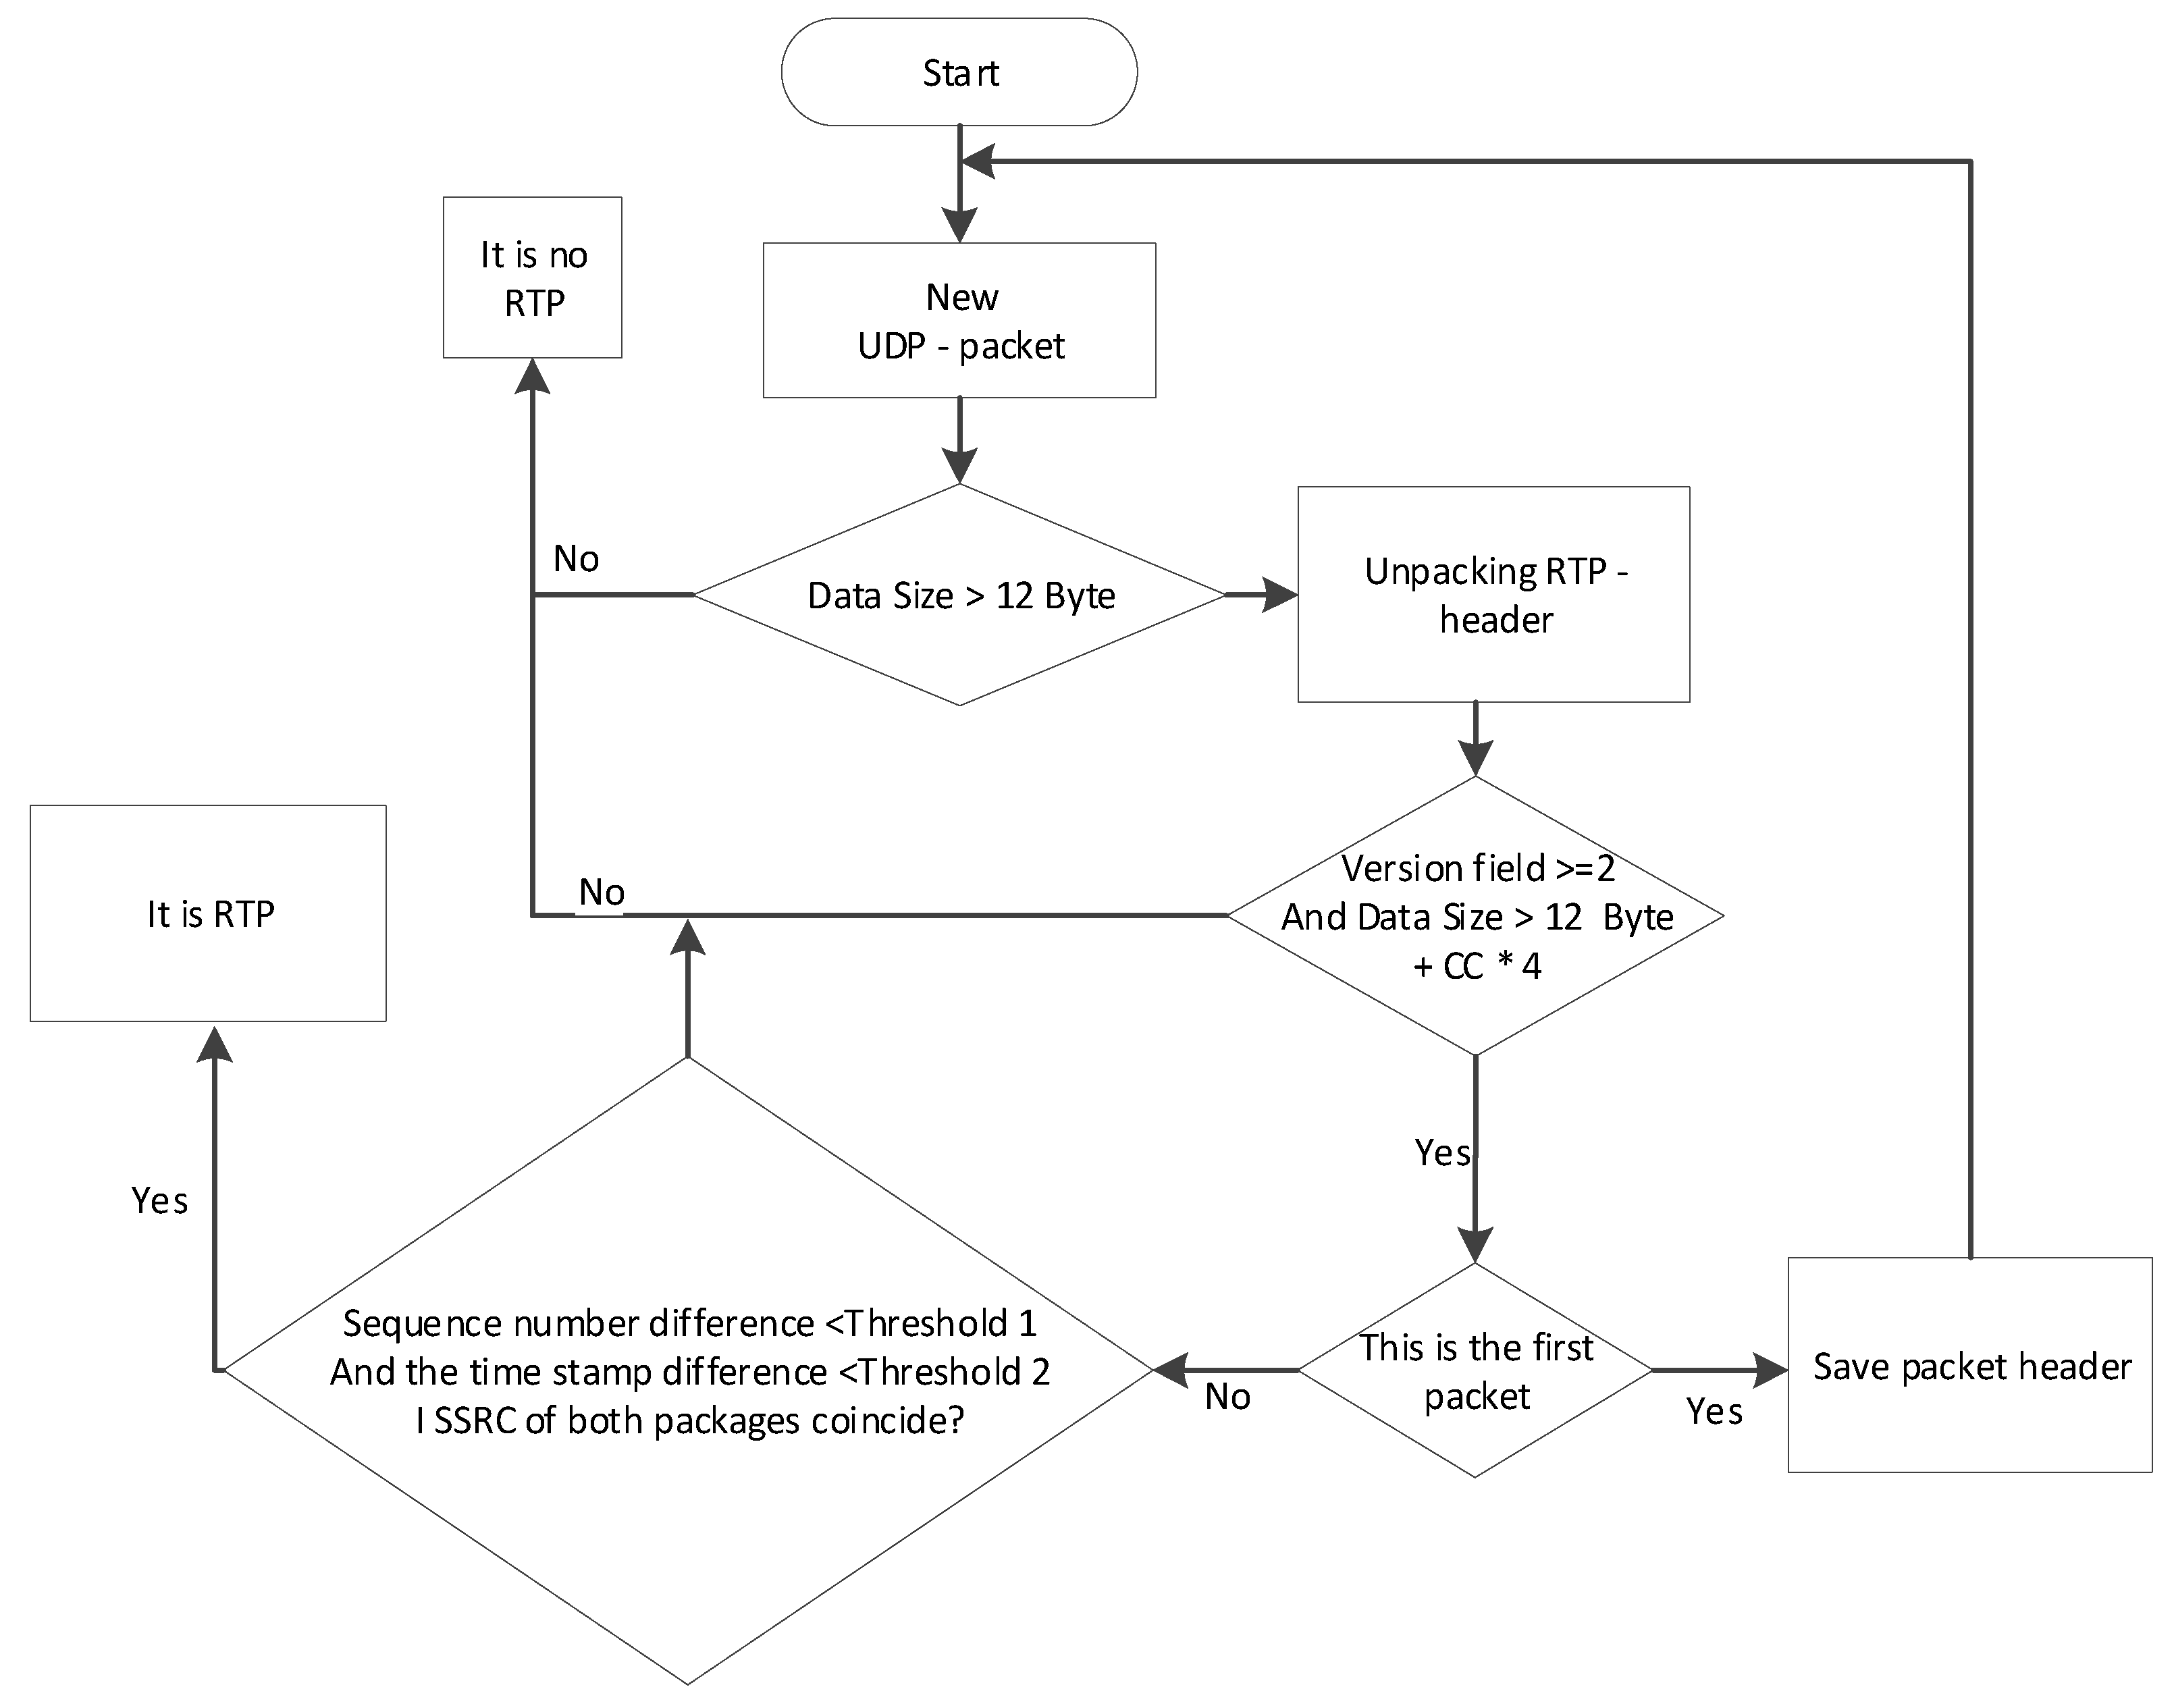
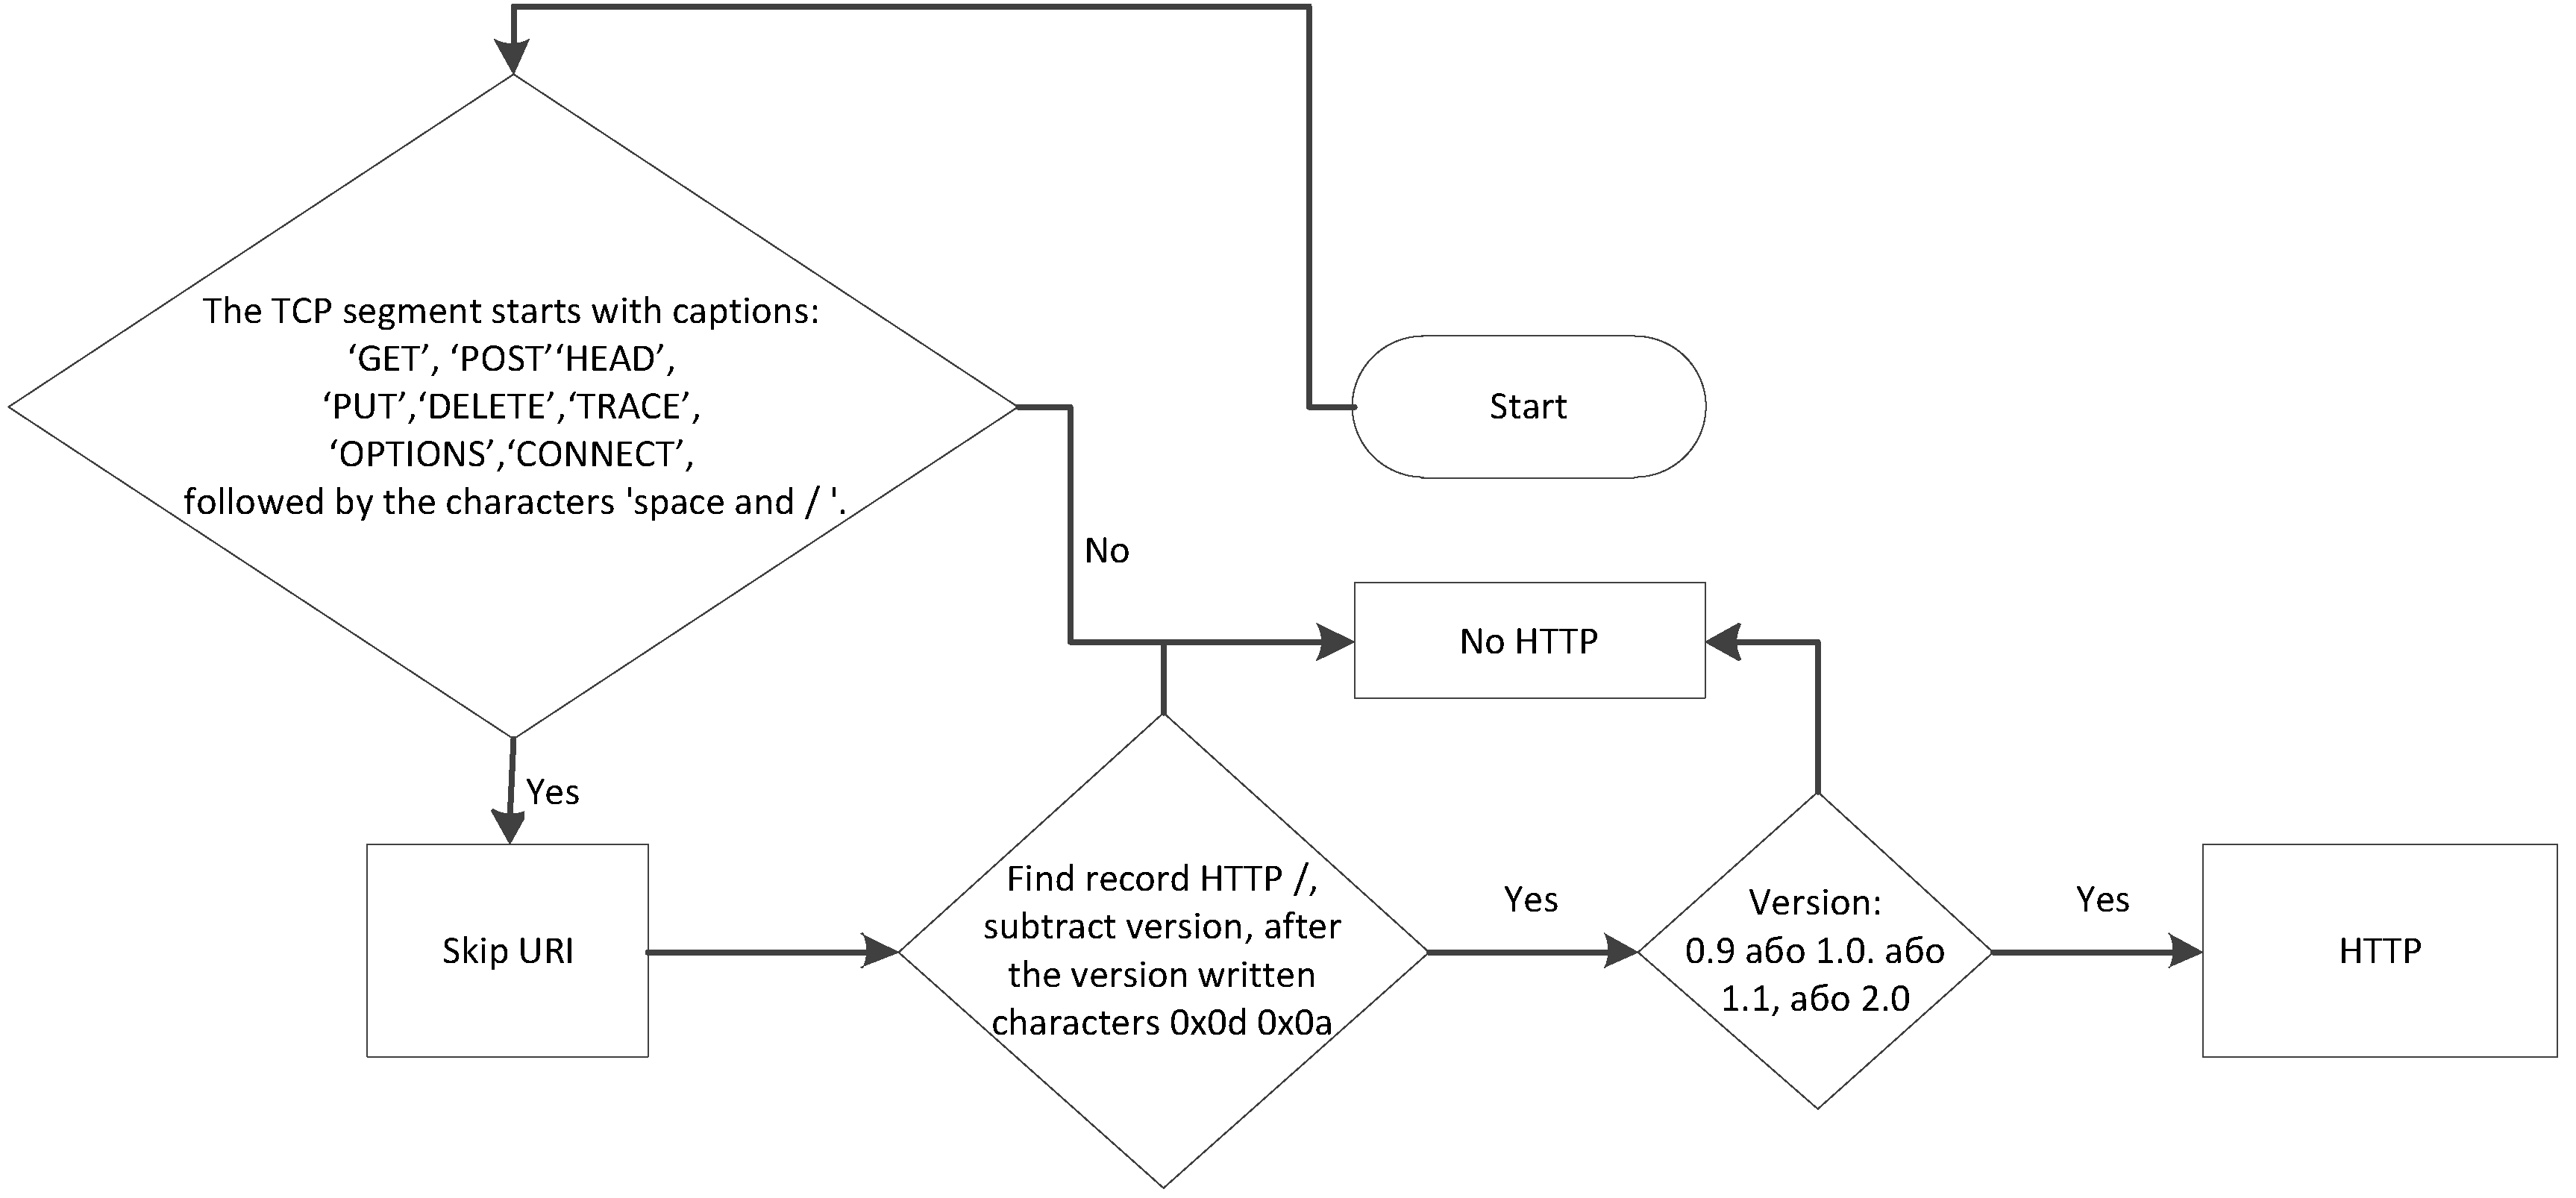
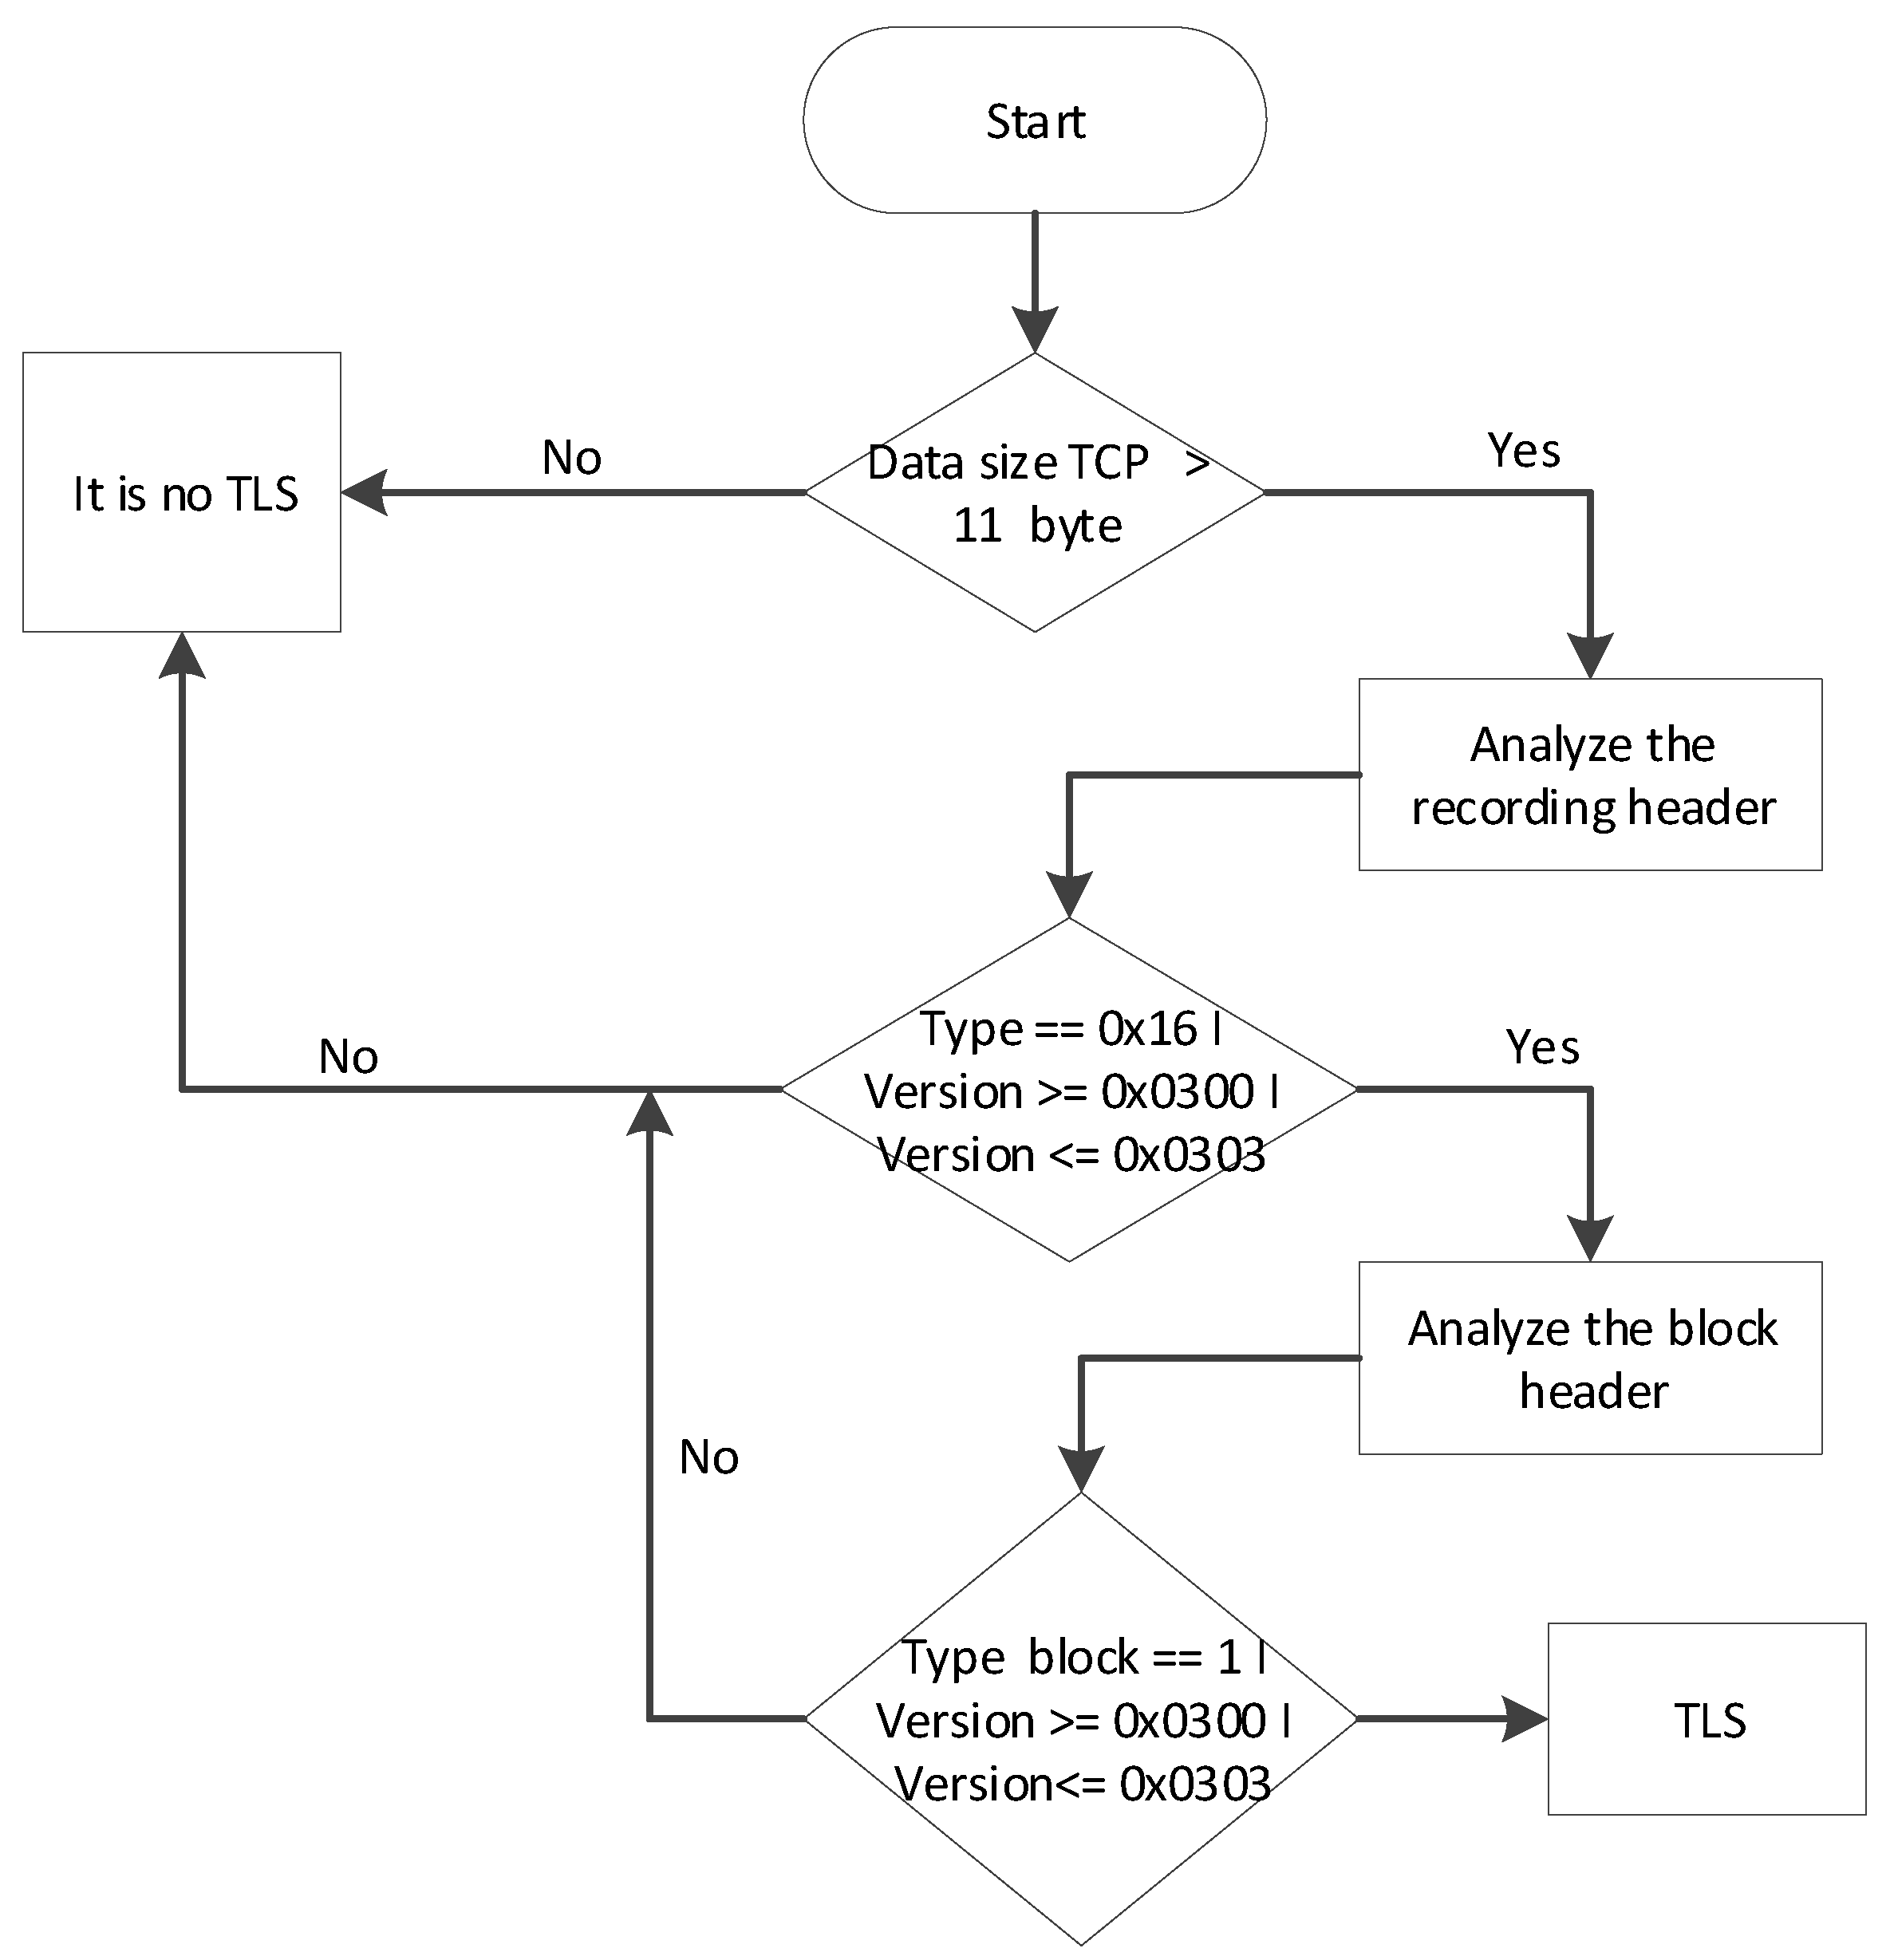
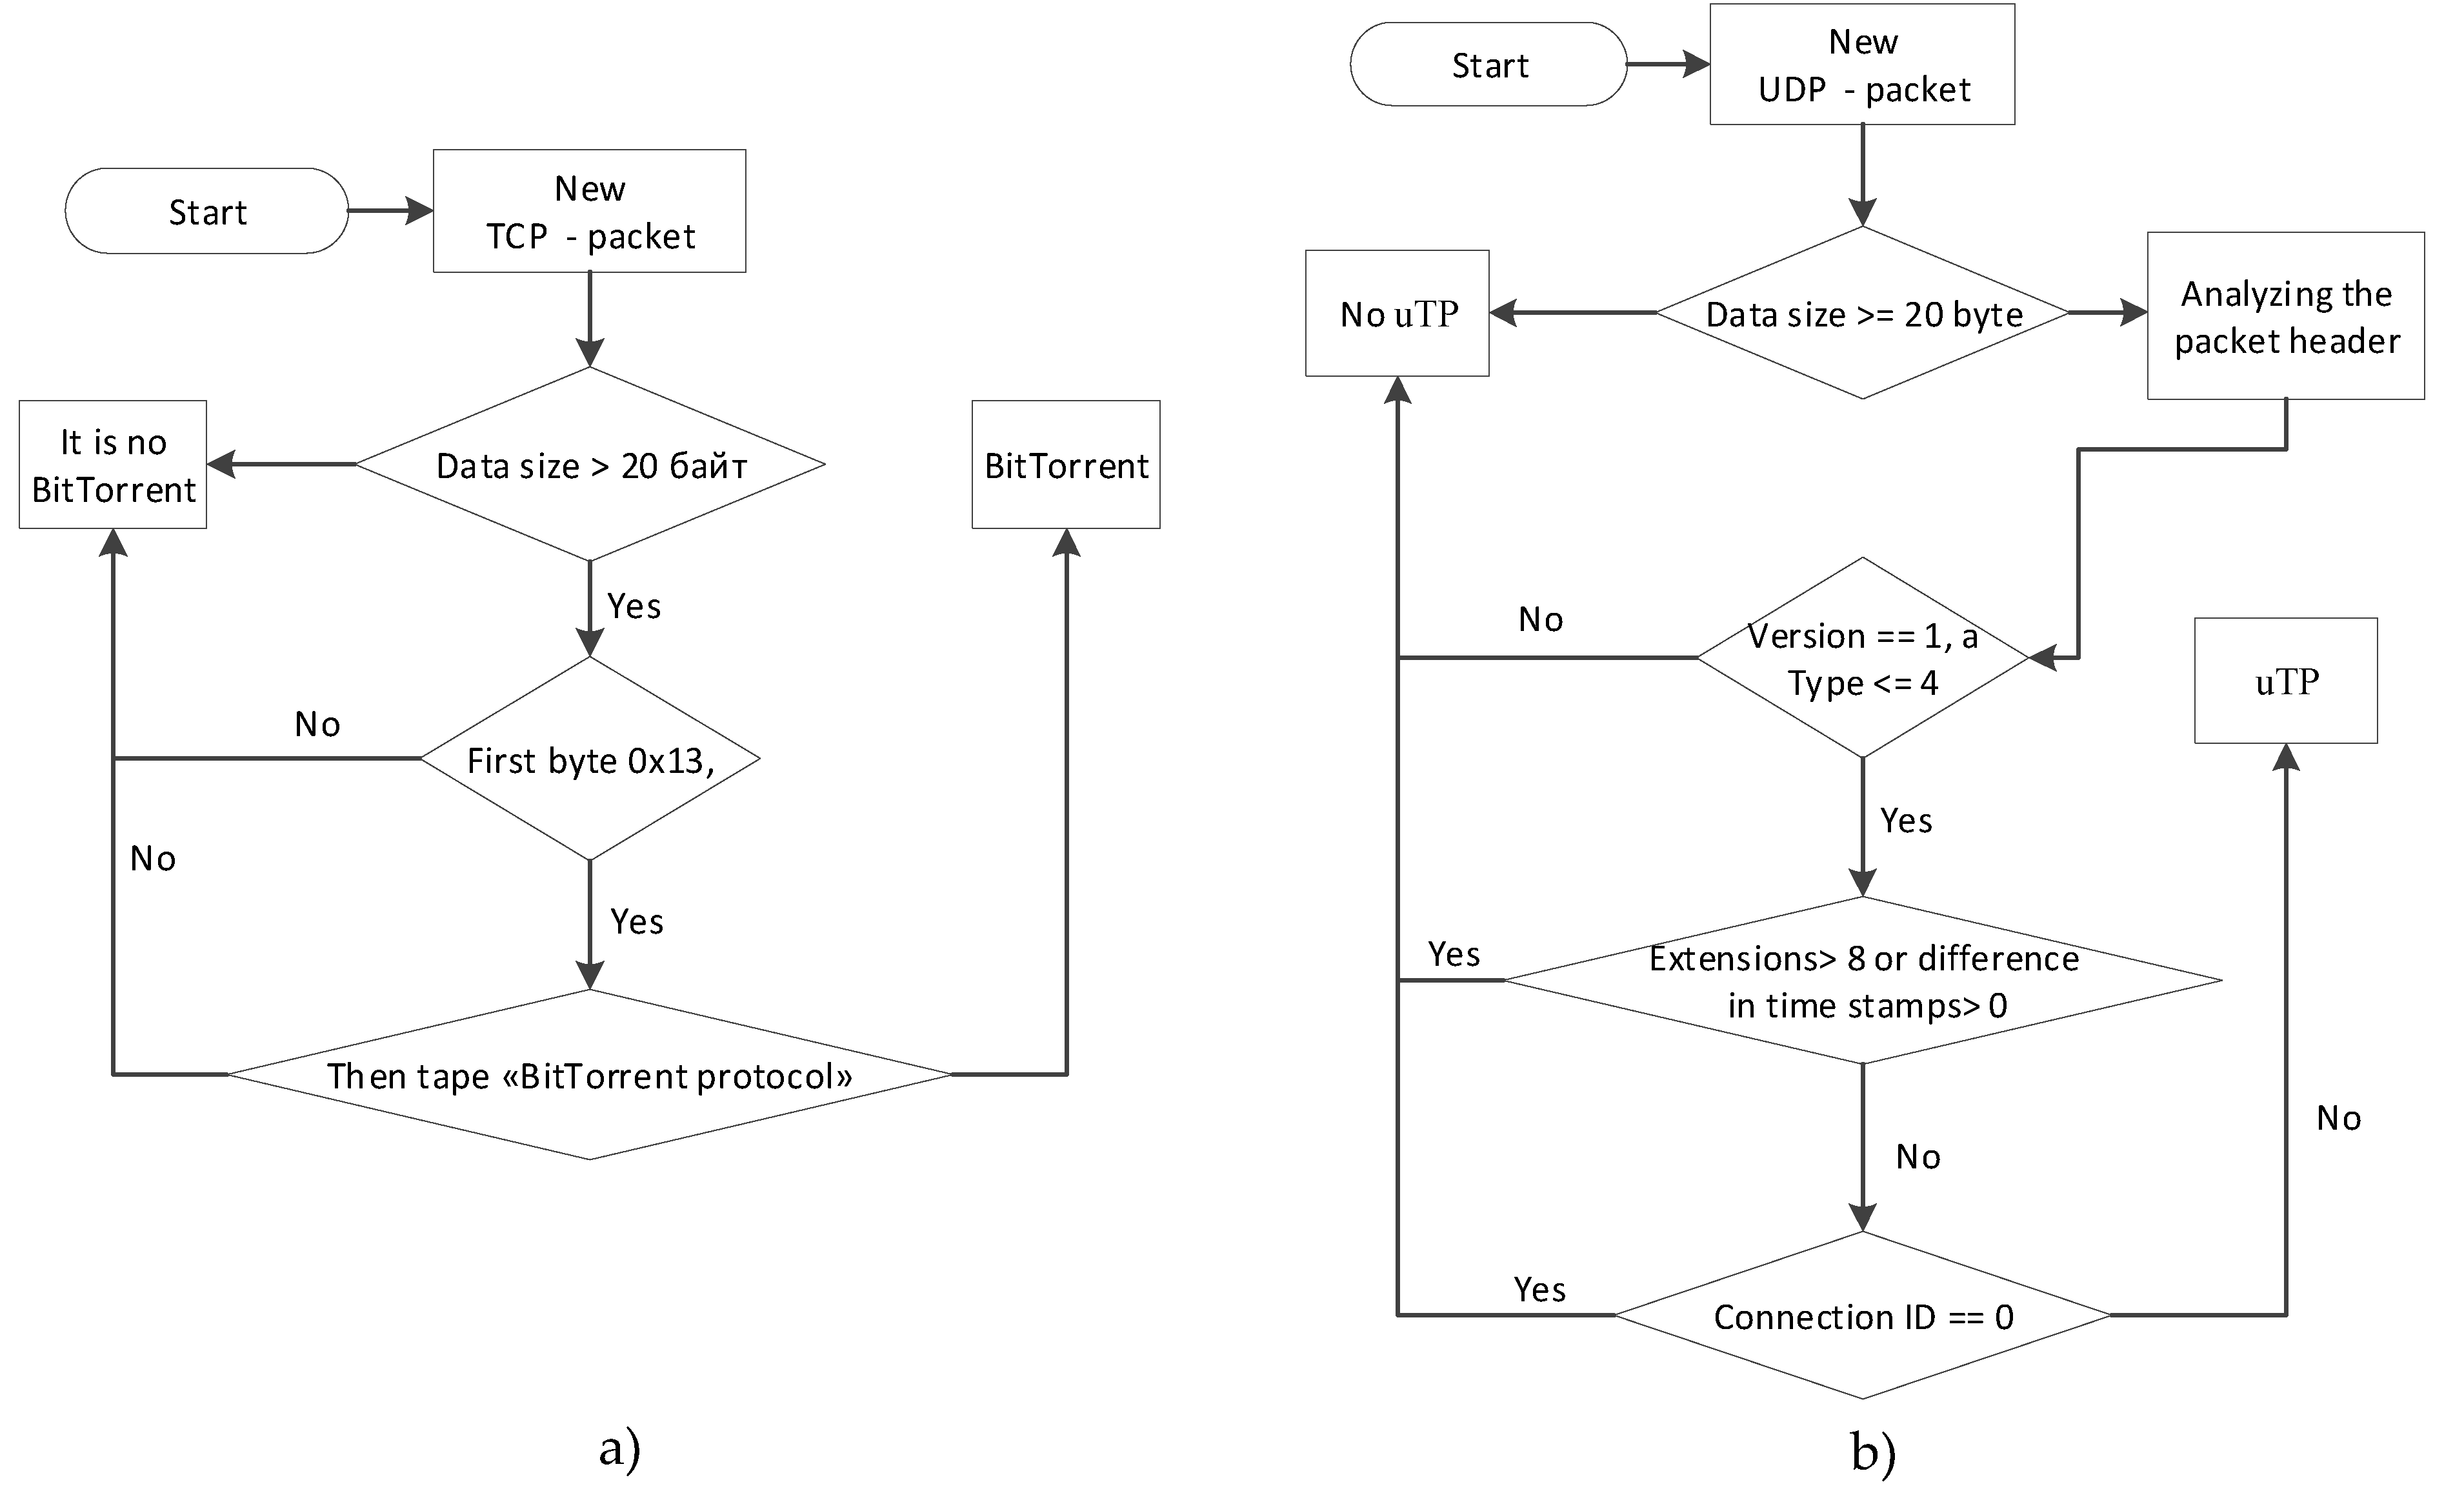
4.1.2. Development of Protocols Detector
- -
- Sequential (Figure 9)—used for low-speed data flows. Each of the detection algorithms is executed when the execution of the previous algorithm is blocked. One processor thread is used.
- -
- Parallel (Figure 10)—for high-speed data flows. Detection algorithms are executed in parallel, each in its own processor thread. When each thread has finished executing its own algorithm, if the protocol is defined by one of the algorithms, the execution stops; if not, each thread is provided with a new algorithm for execution.
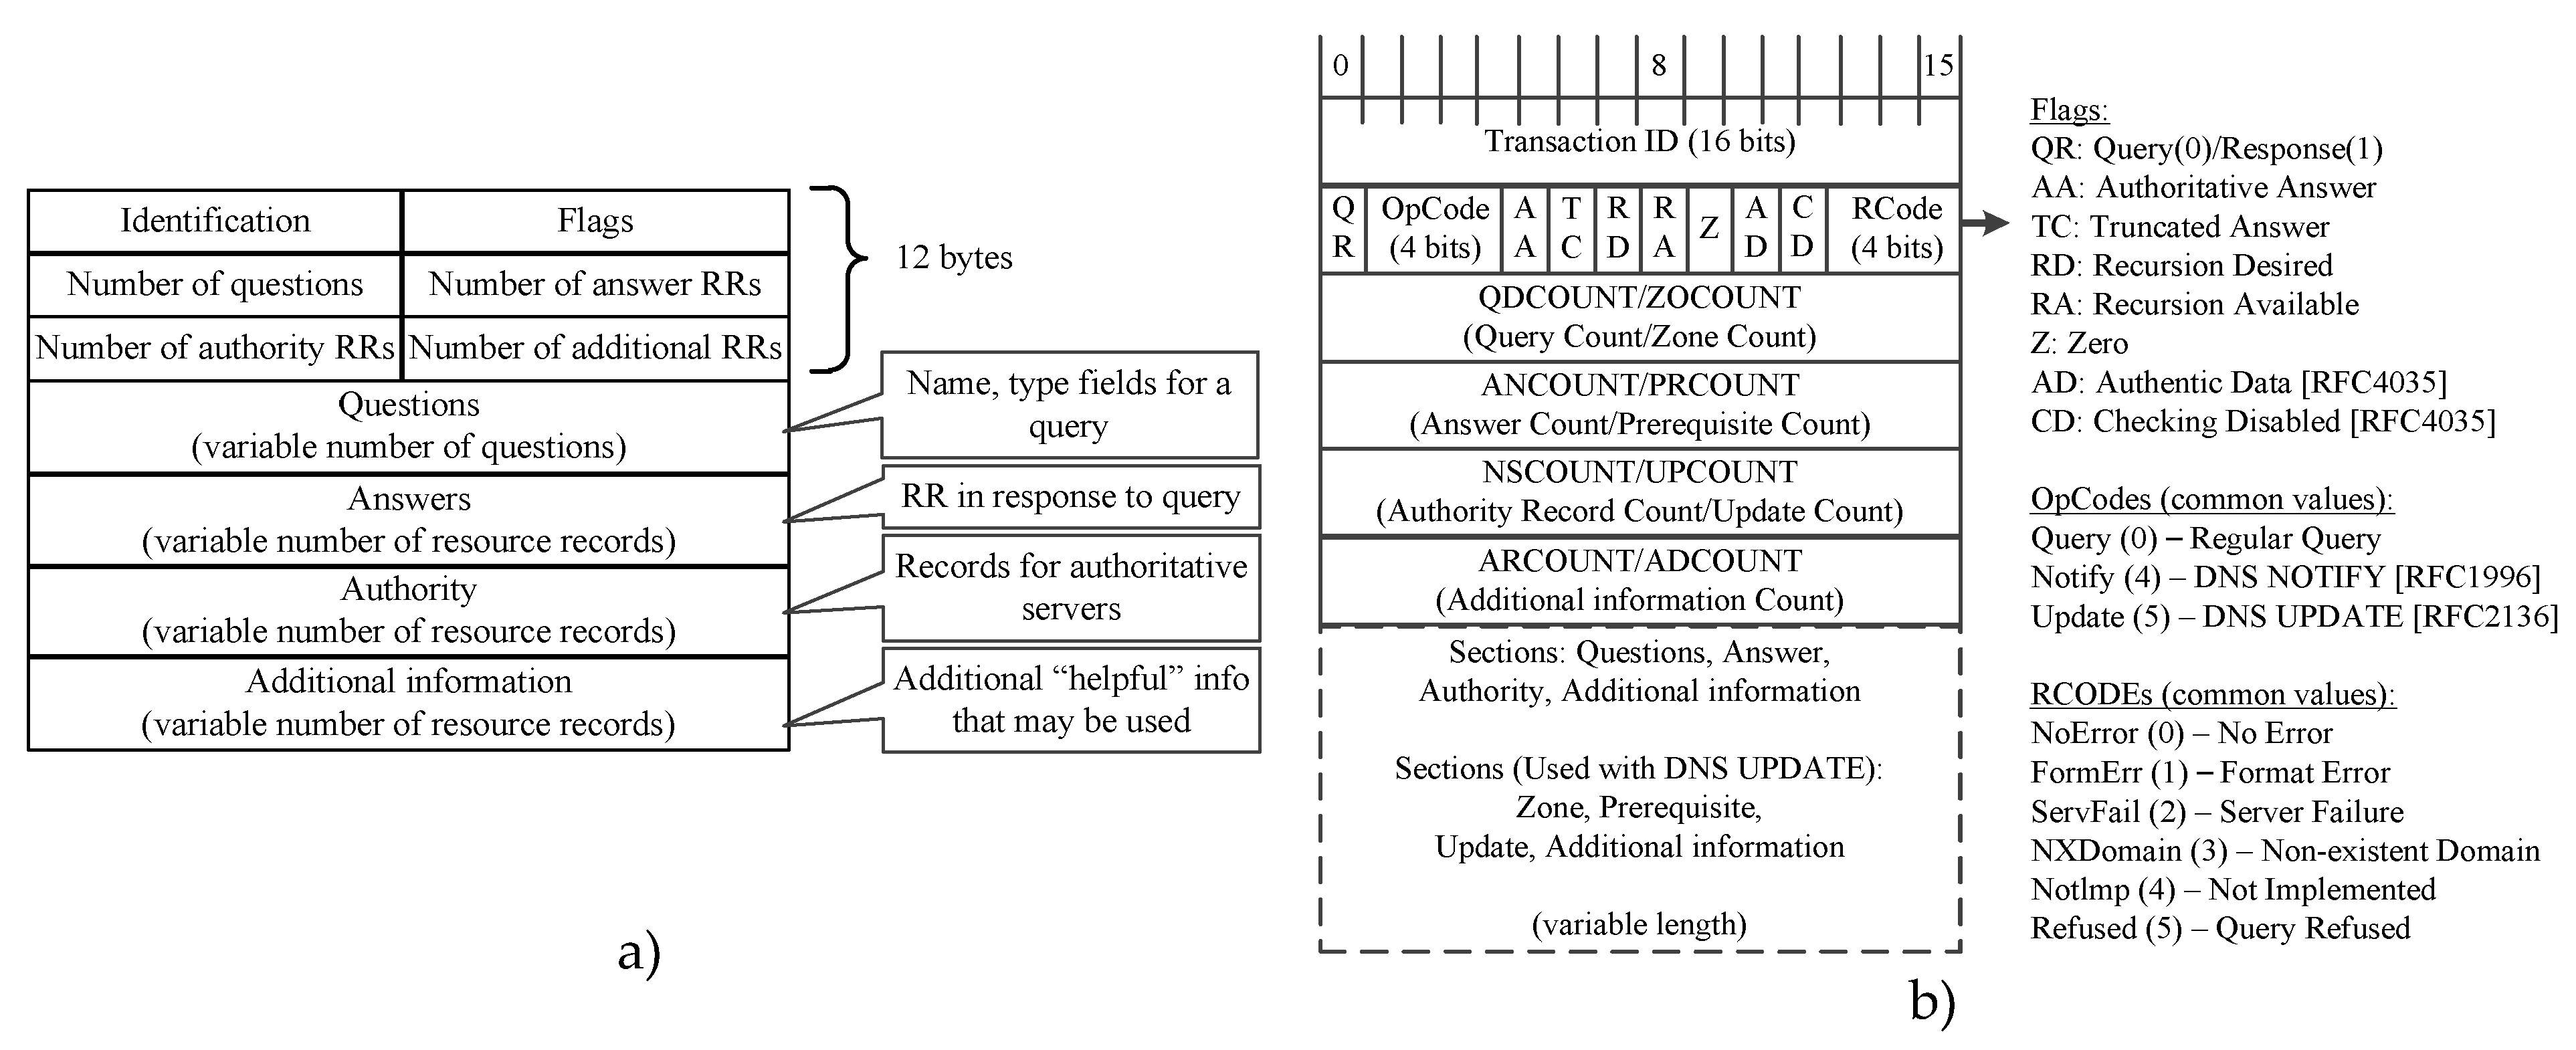
- -
- QR (Query Response)(message type) field with the size of 1 bit 0 denotes the request, 1 denotes the response
- -
- The zero field is 3 bits, which should be equal to 0.
- -
- Rcode is a 4-bit return code field. It takes the following values: 0 (no error) and 3 (name error).
- Type of package. This field can take values 0–4;
- Protocol version. For current version of the protocol 1;
- Extensions. This field is like TCP options. If this field is not zero, the extension field will be placed after the uTP header;
- The connection identifier. This field contains a random number that all packets belonging to a particular connection have;
- Time stamp. Contains the sending of the packet in microseconds;
- The difference in the time stamps. Defines the time a packet is transmitted over the network;
- The size of the window. Defines the number of packets that can be transmitted between hosts without confirmation;
- Sequential number of packets. Determines the current number of the packet;
- The number of the confirmed packet. Determines the last packet to which the confirmation was received.
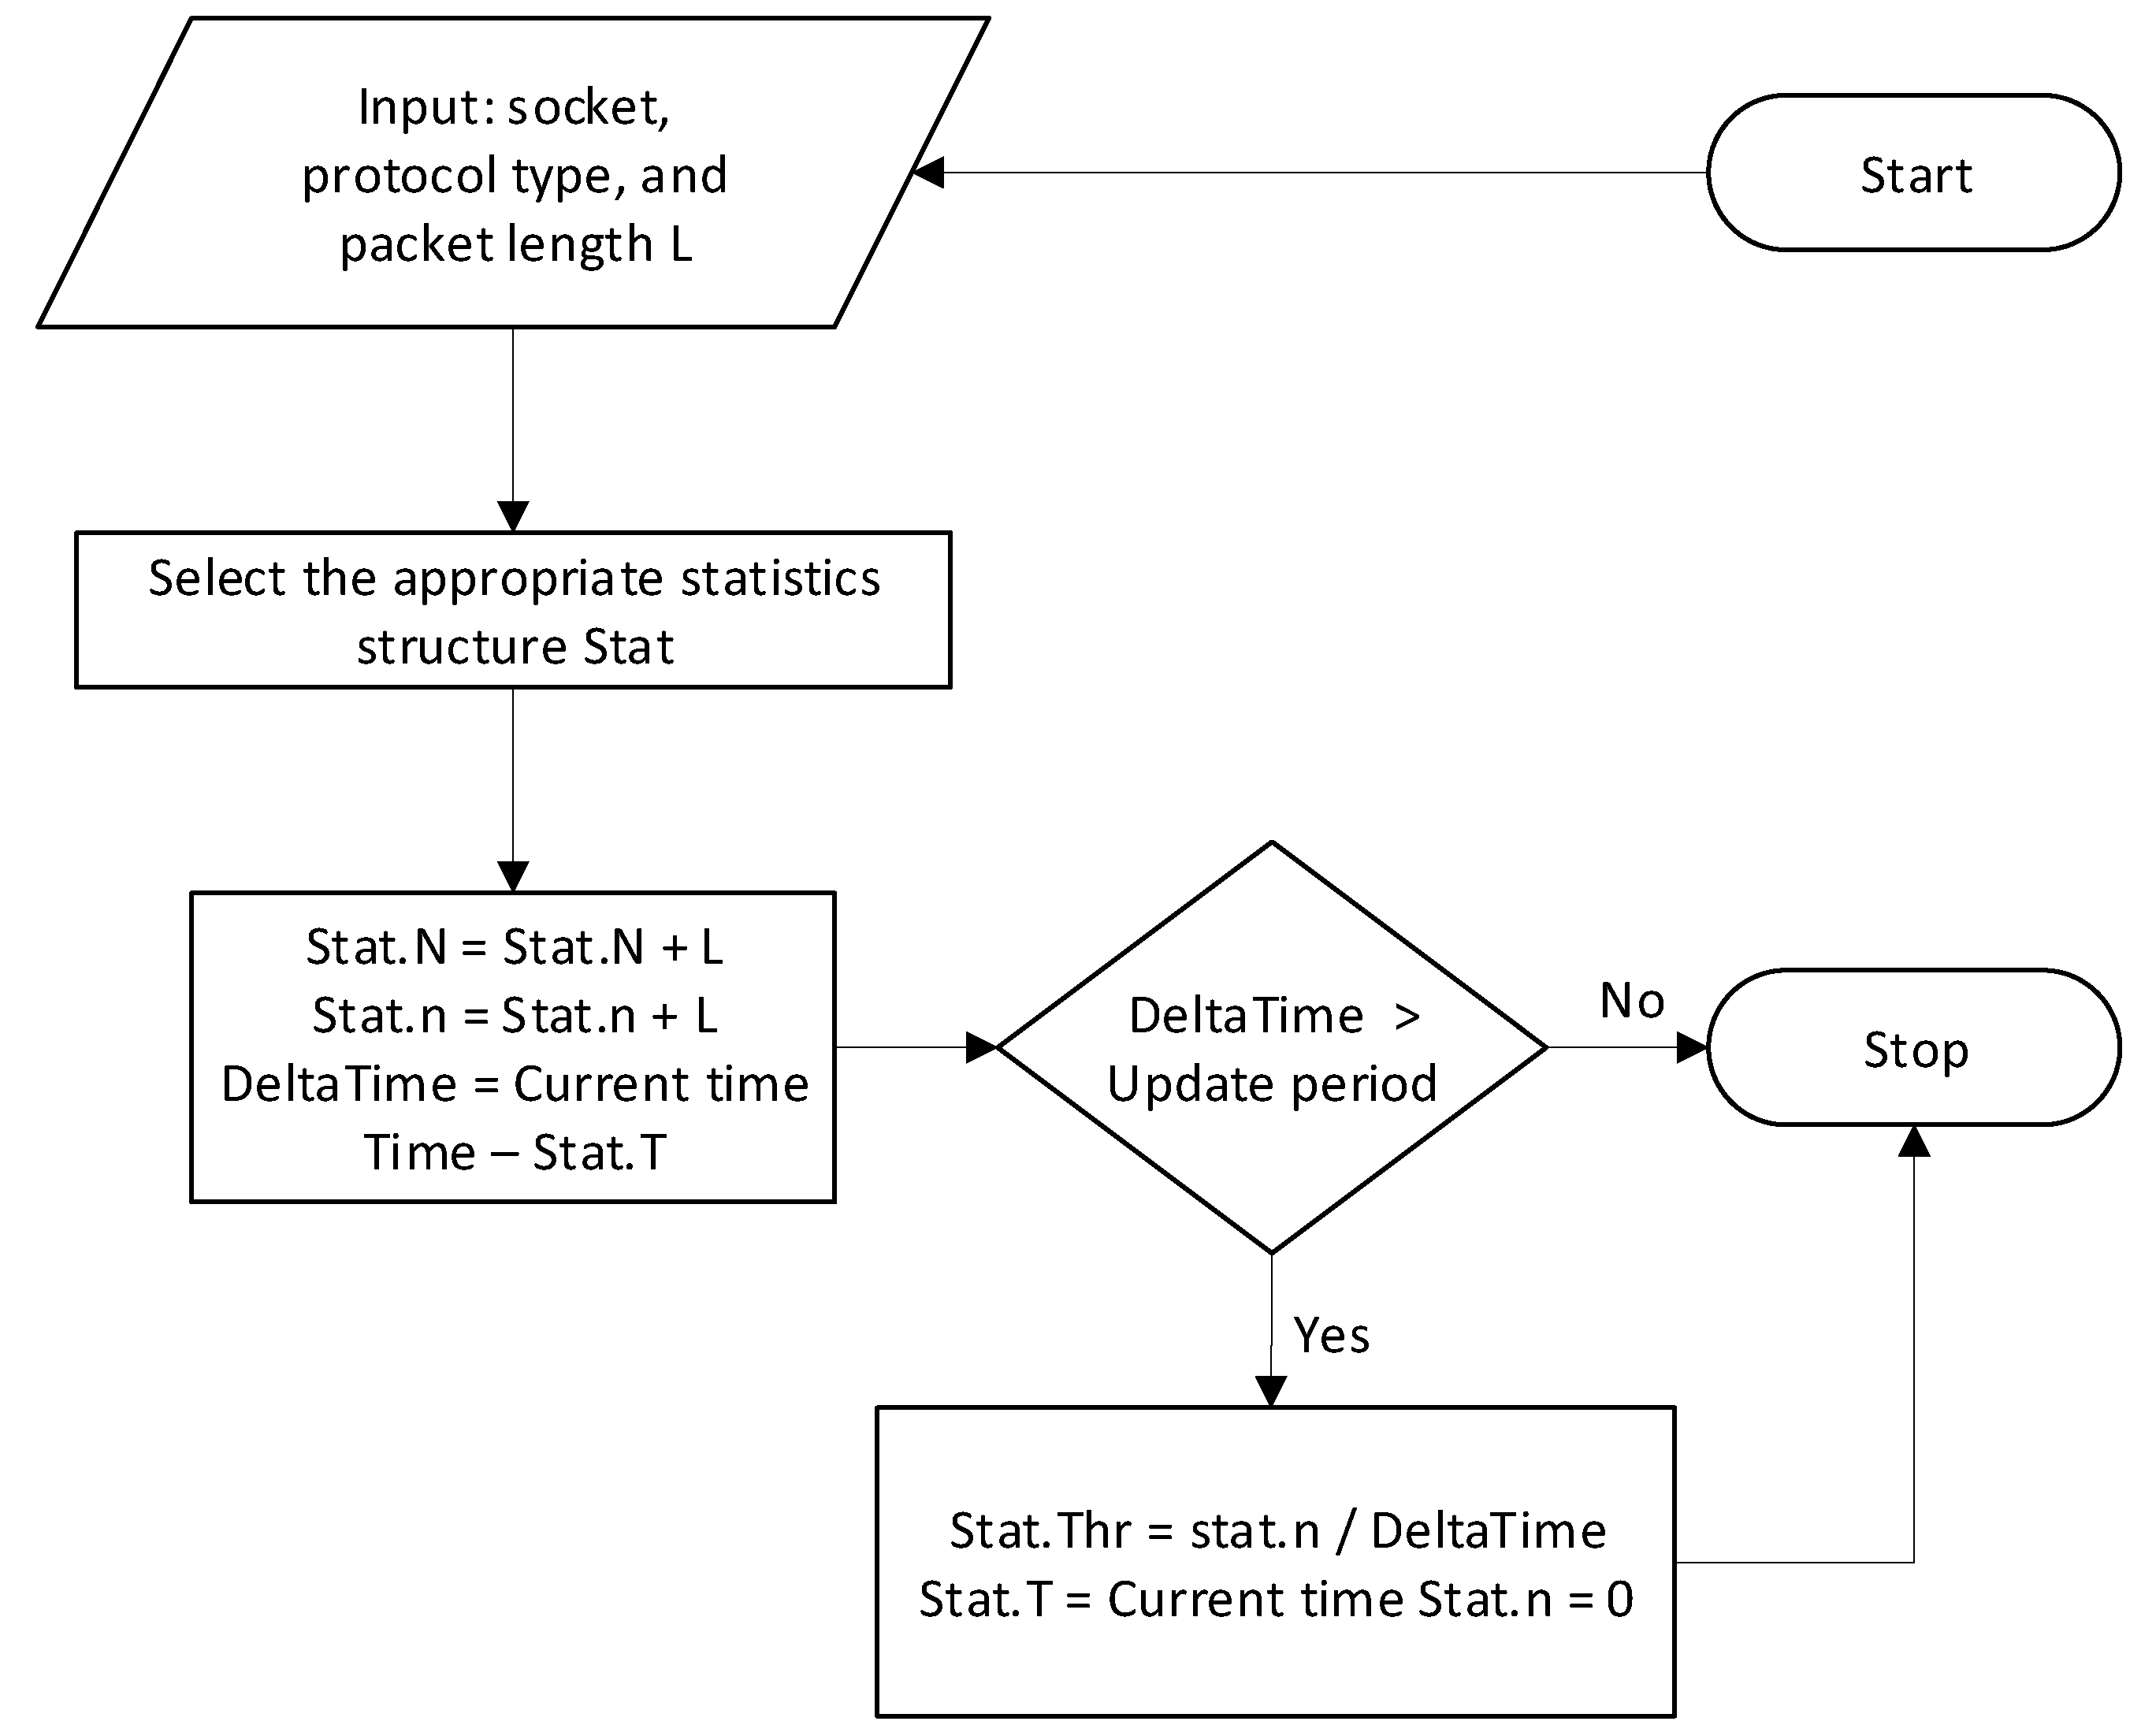
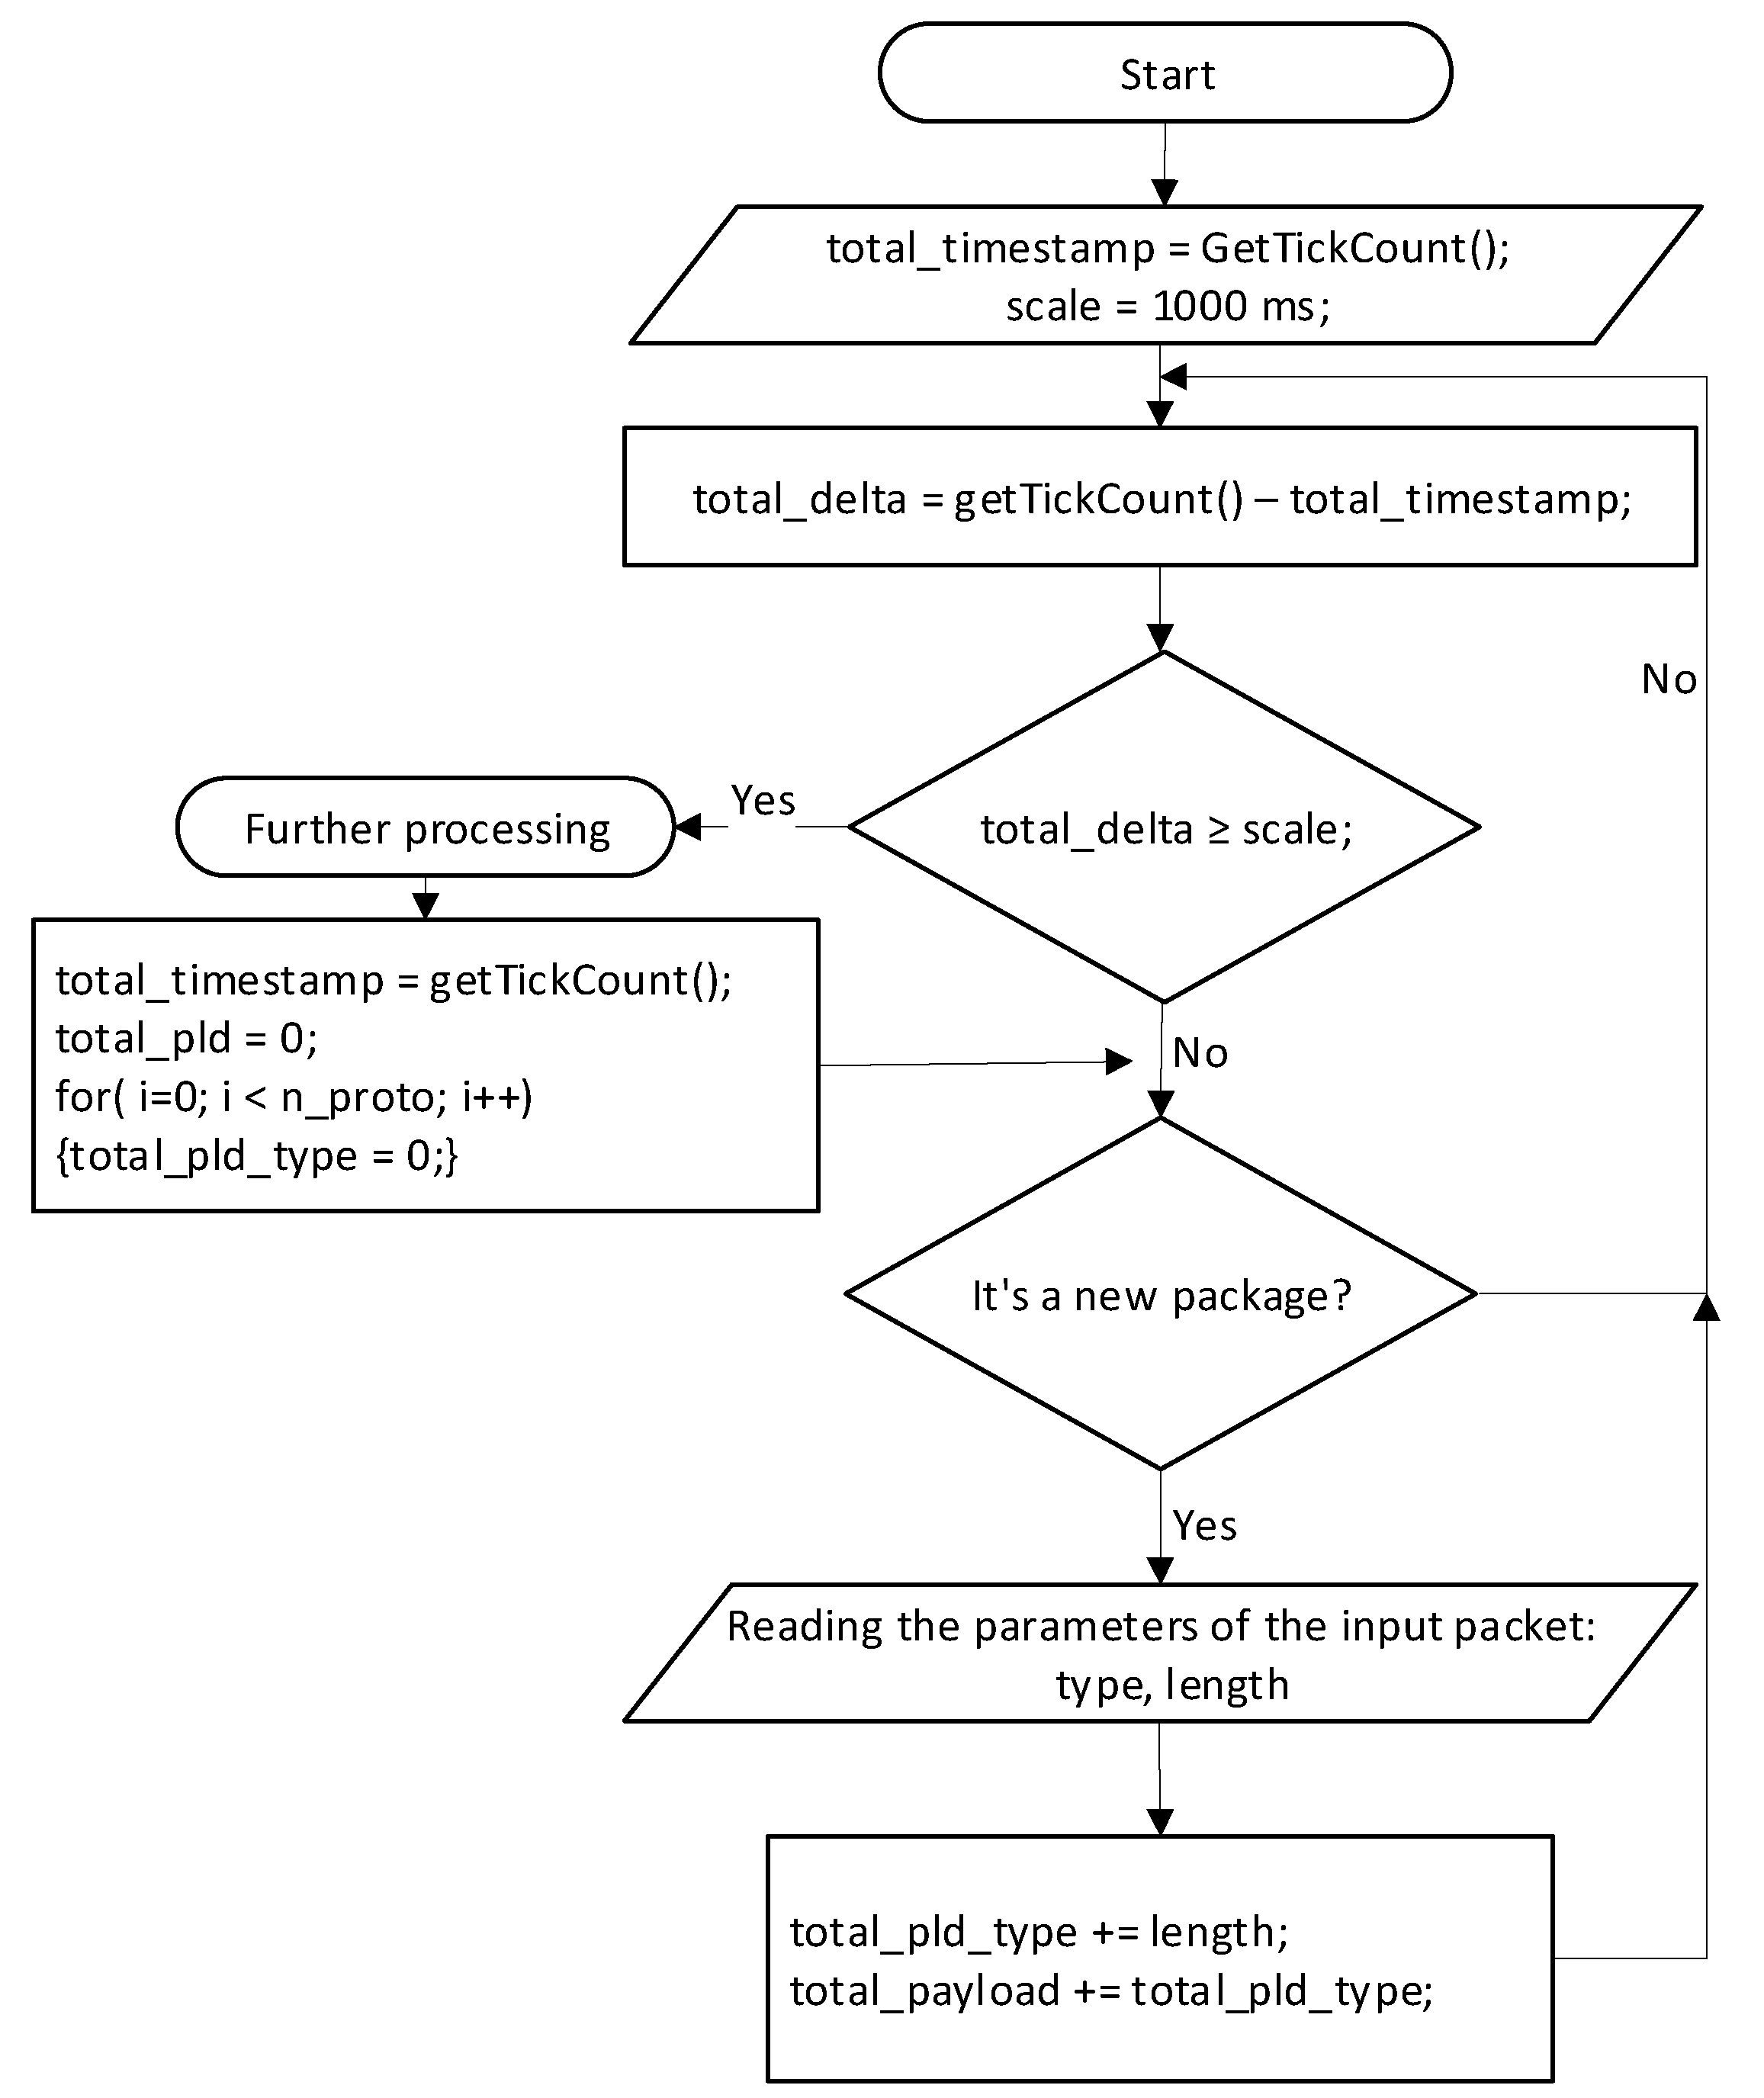
4.1.3. Statistics Collection Algorithm
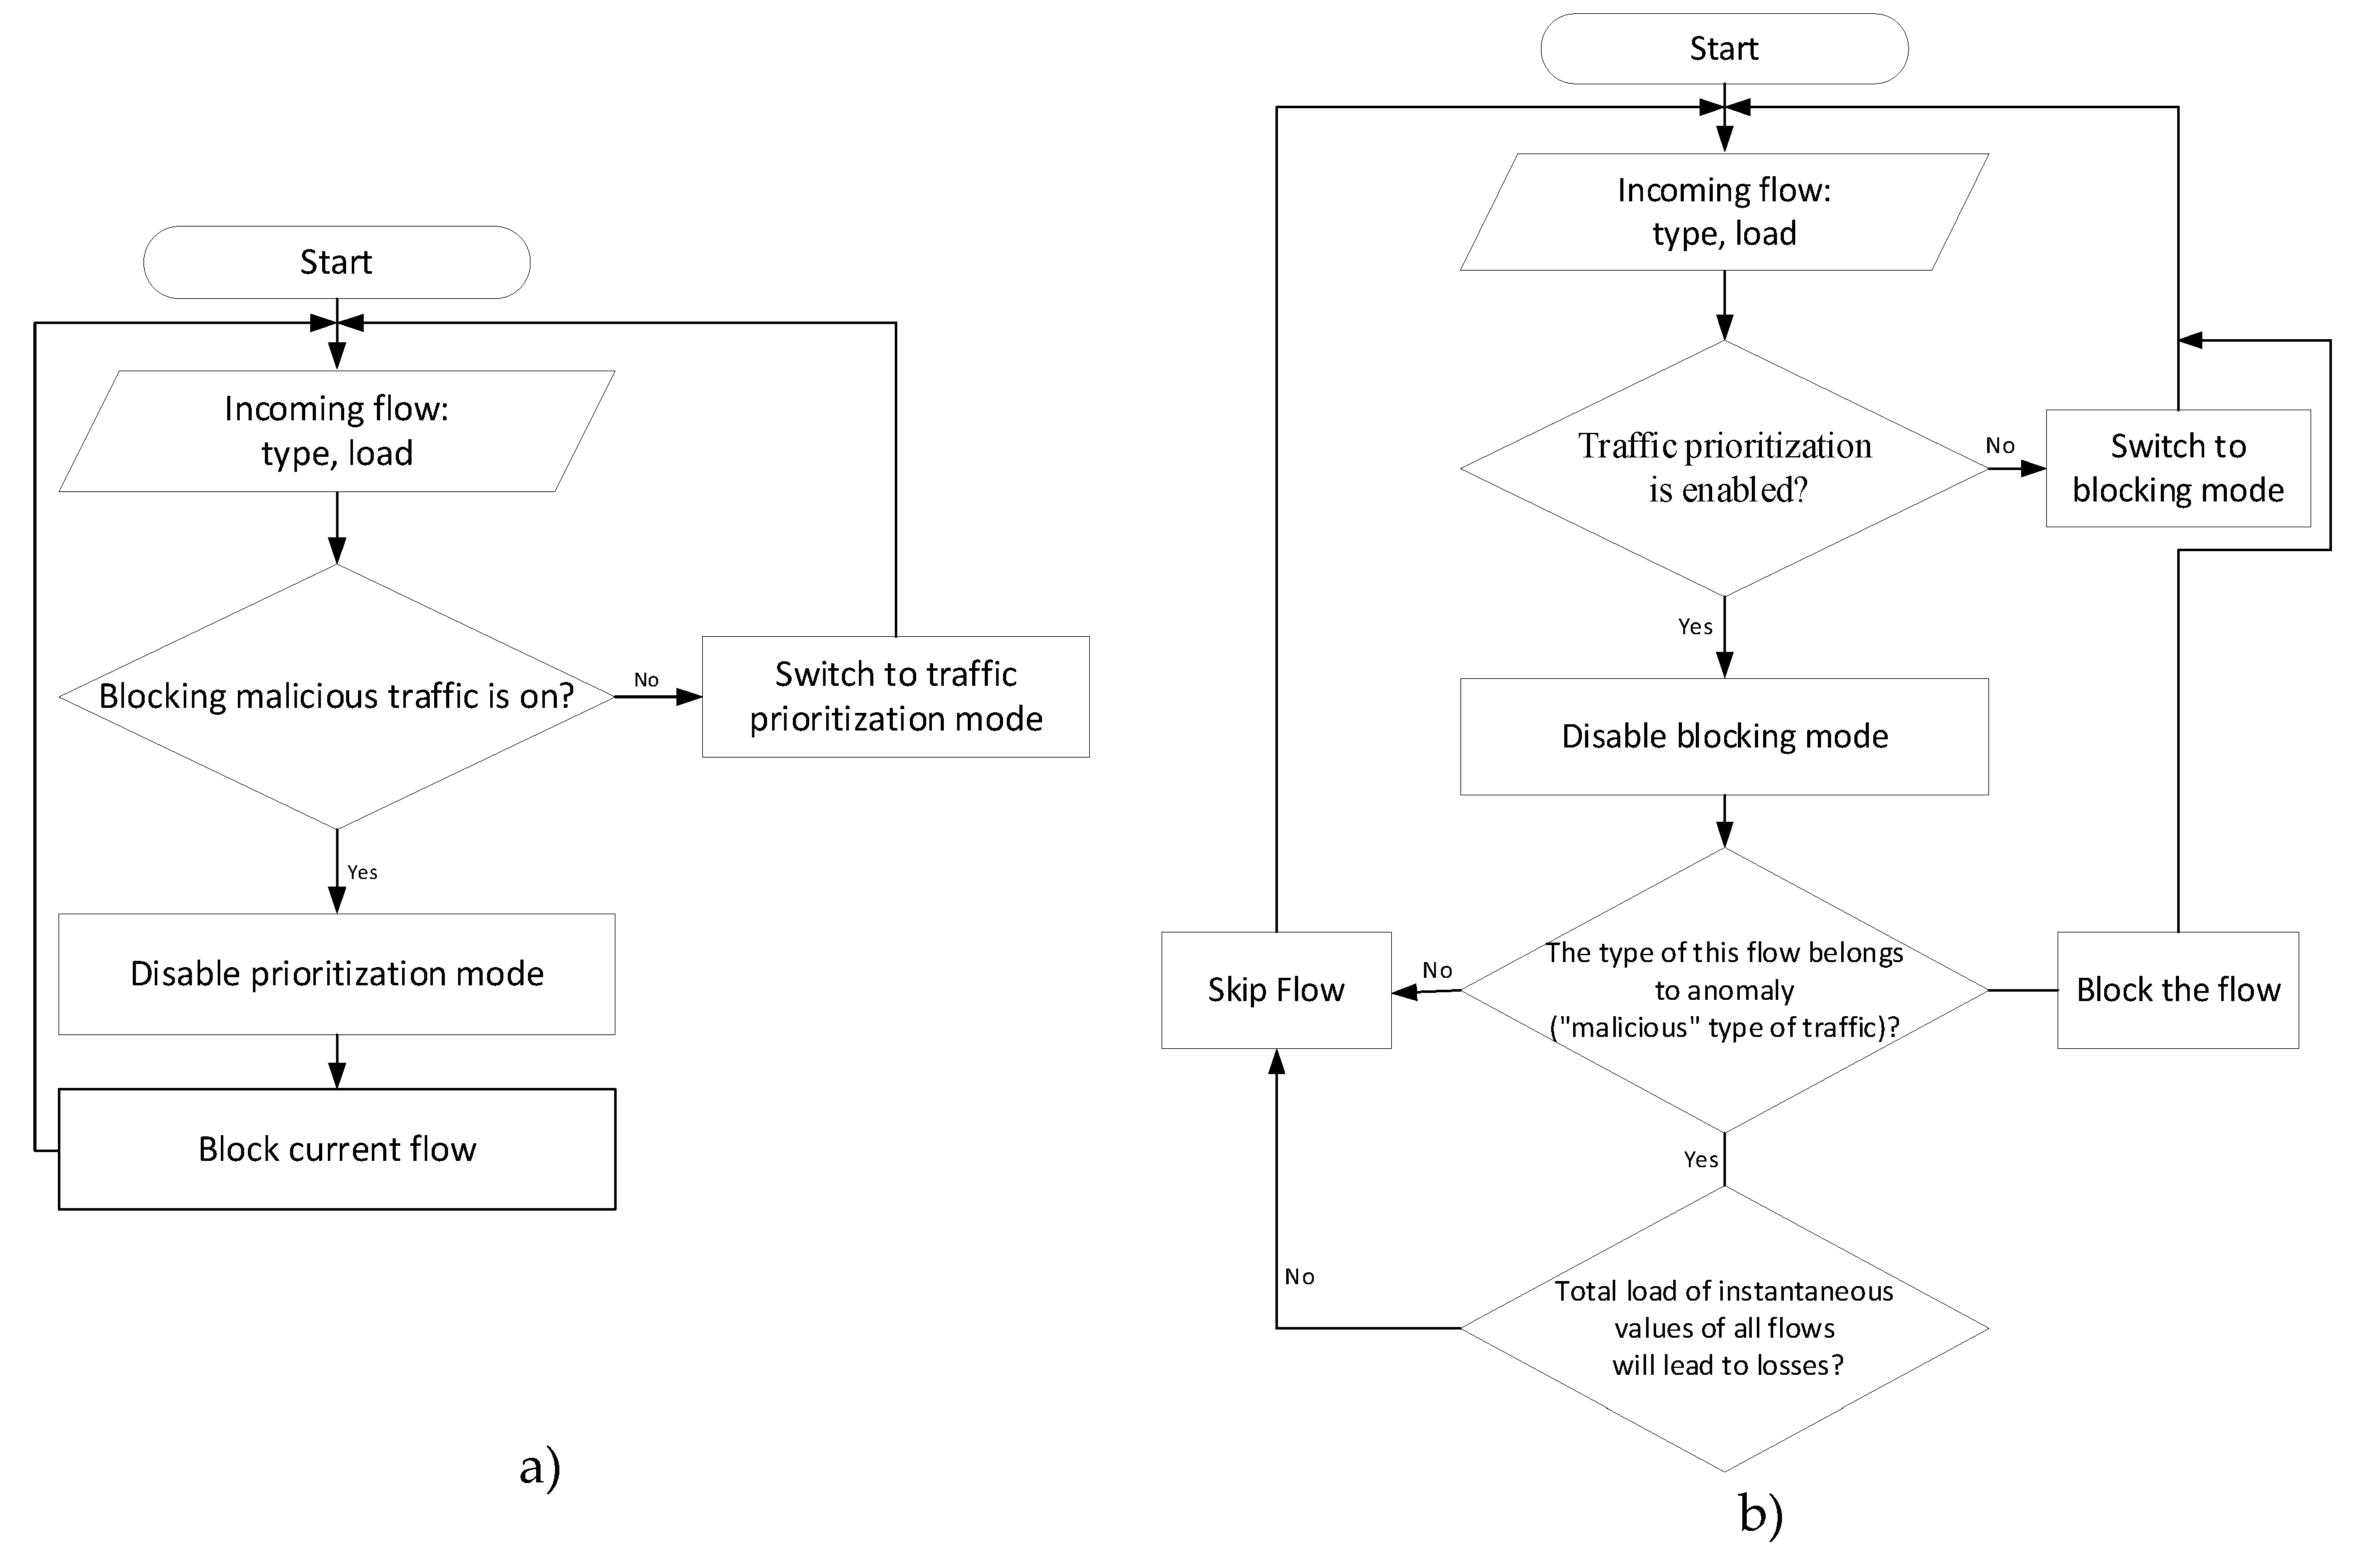
4.2. Algorithms for Network Traffic Capturing, Analyzing, and Detecting
5. Experimental Data and Result Analysis
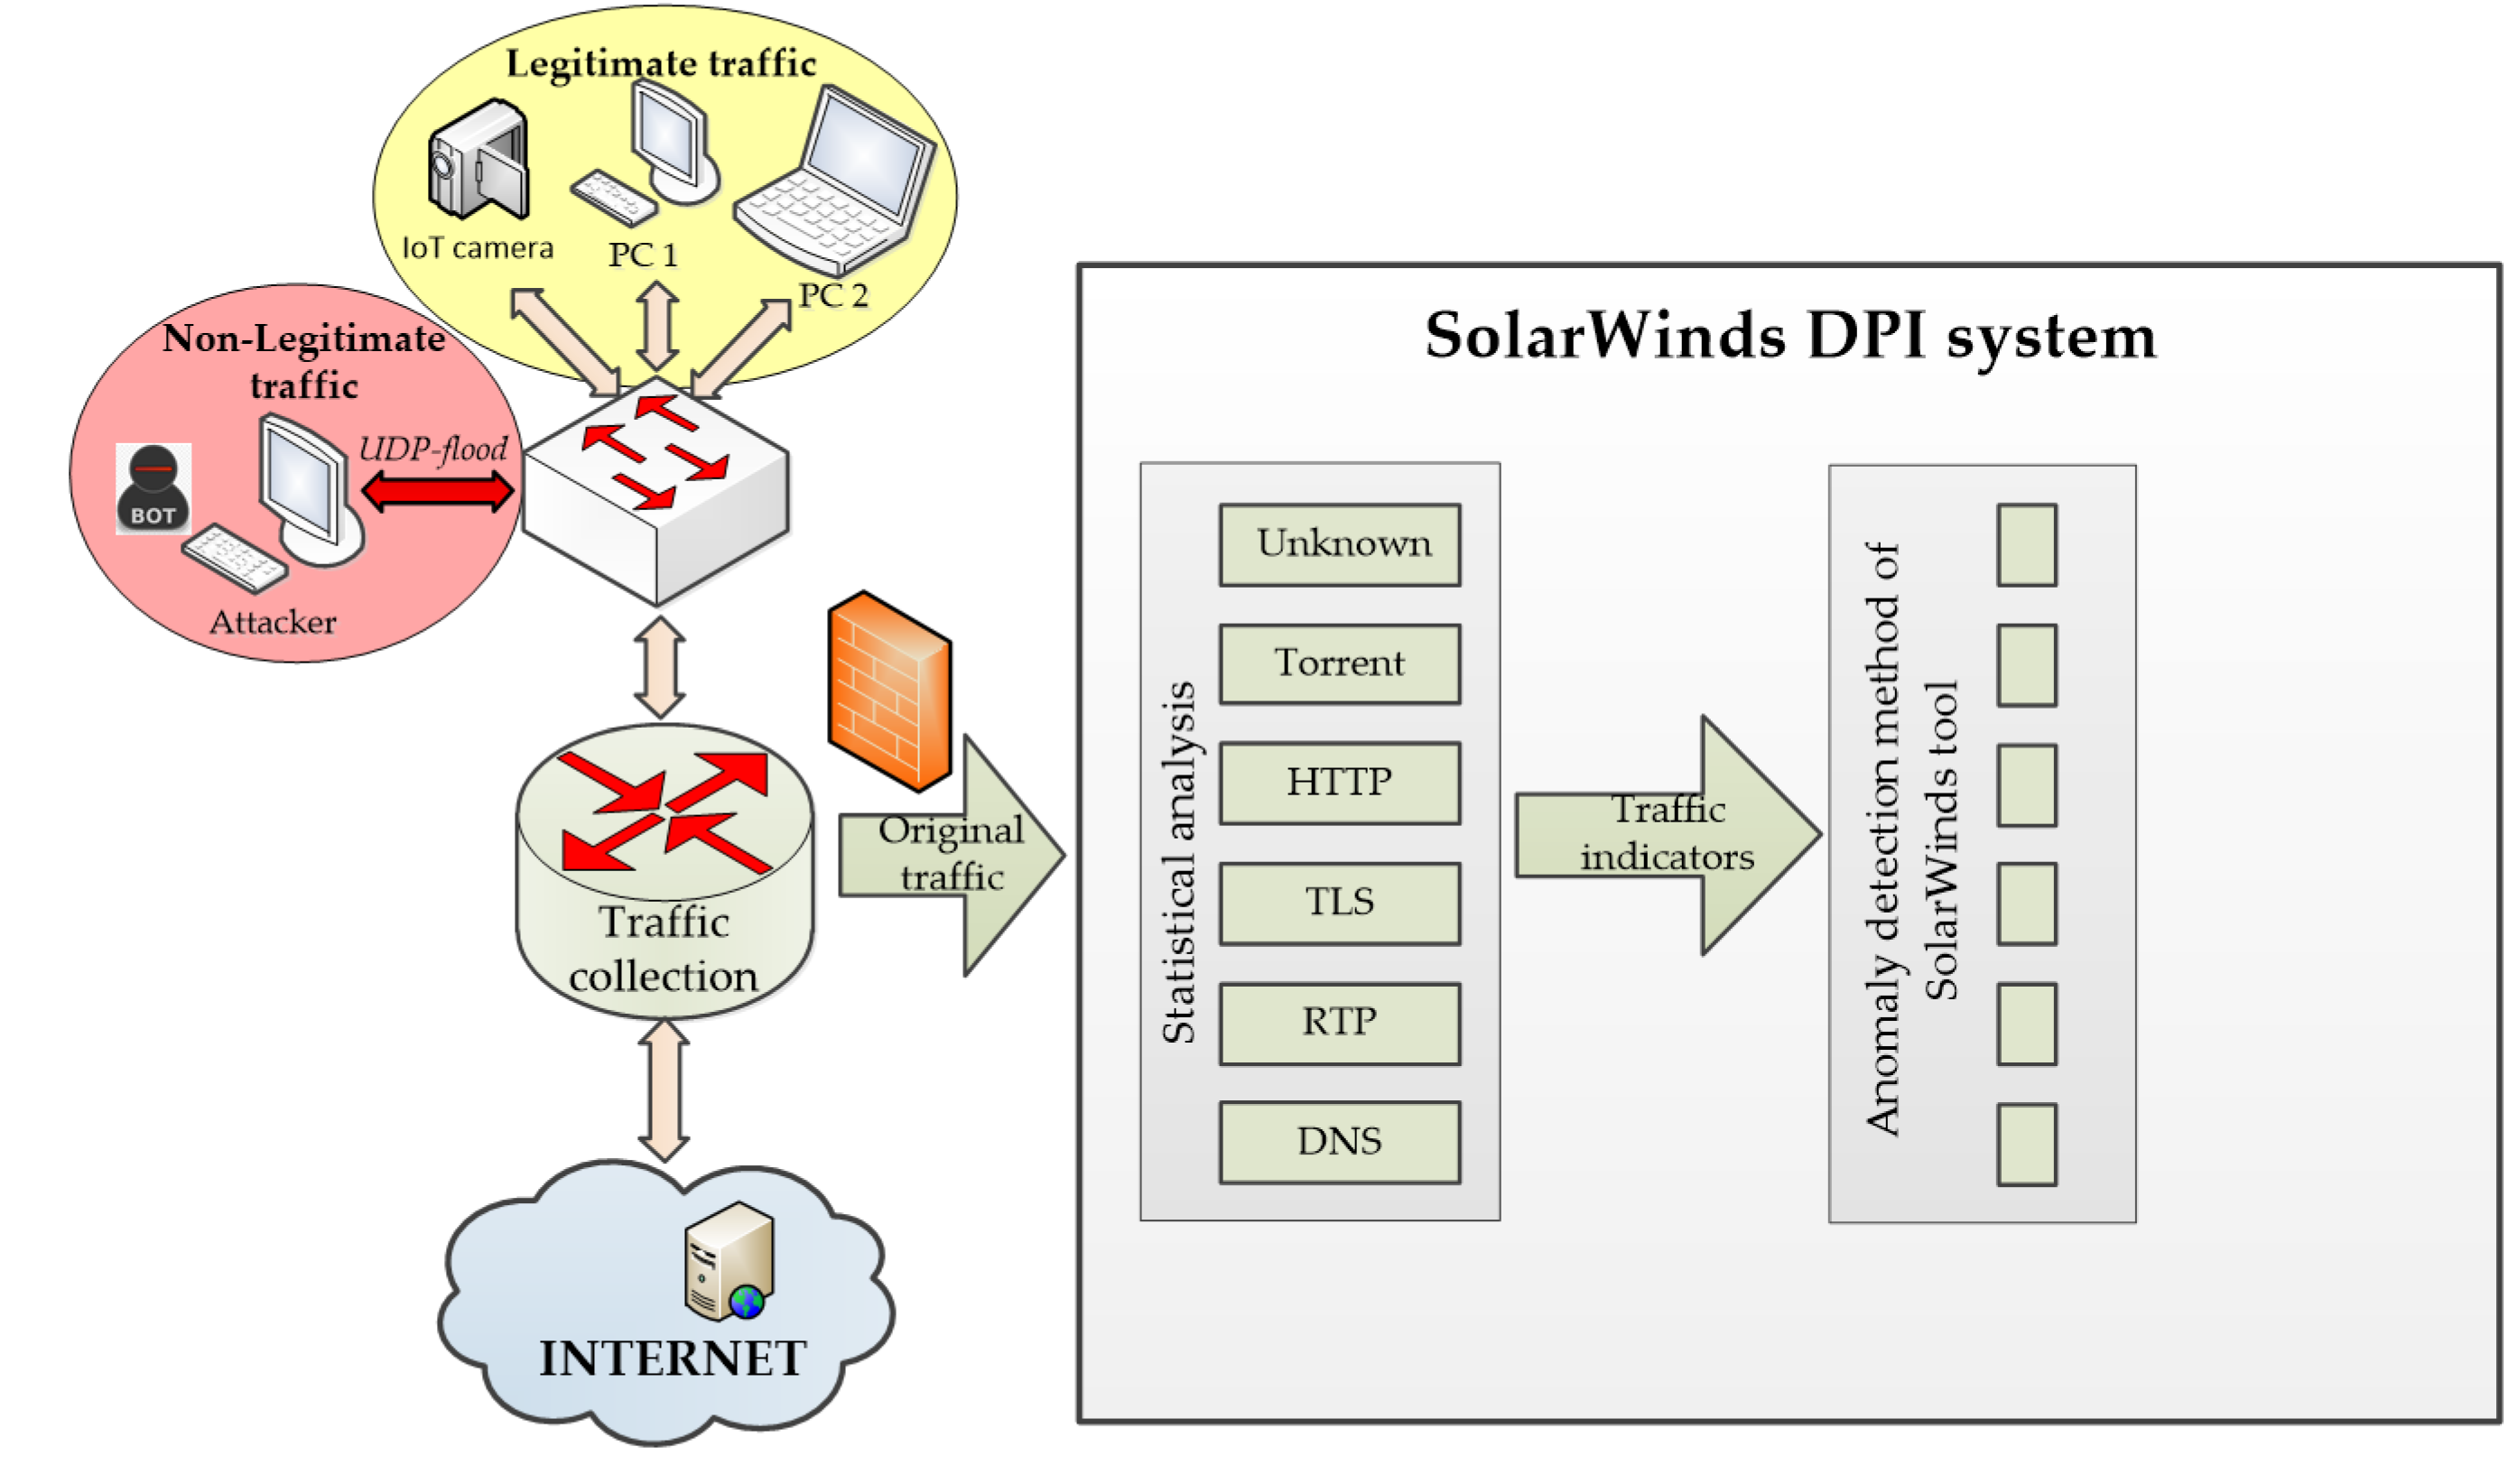
5.1. Test Bed for Network Traffic Analysis and Anomaly Detection
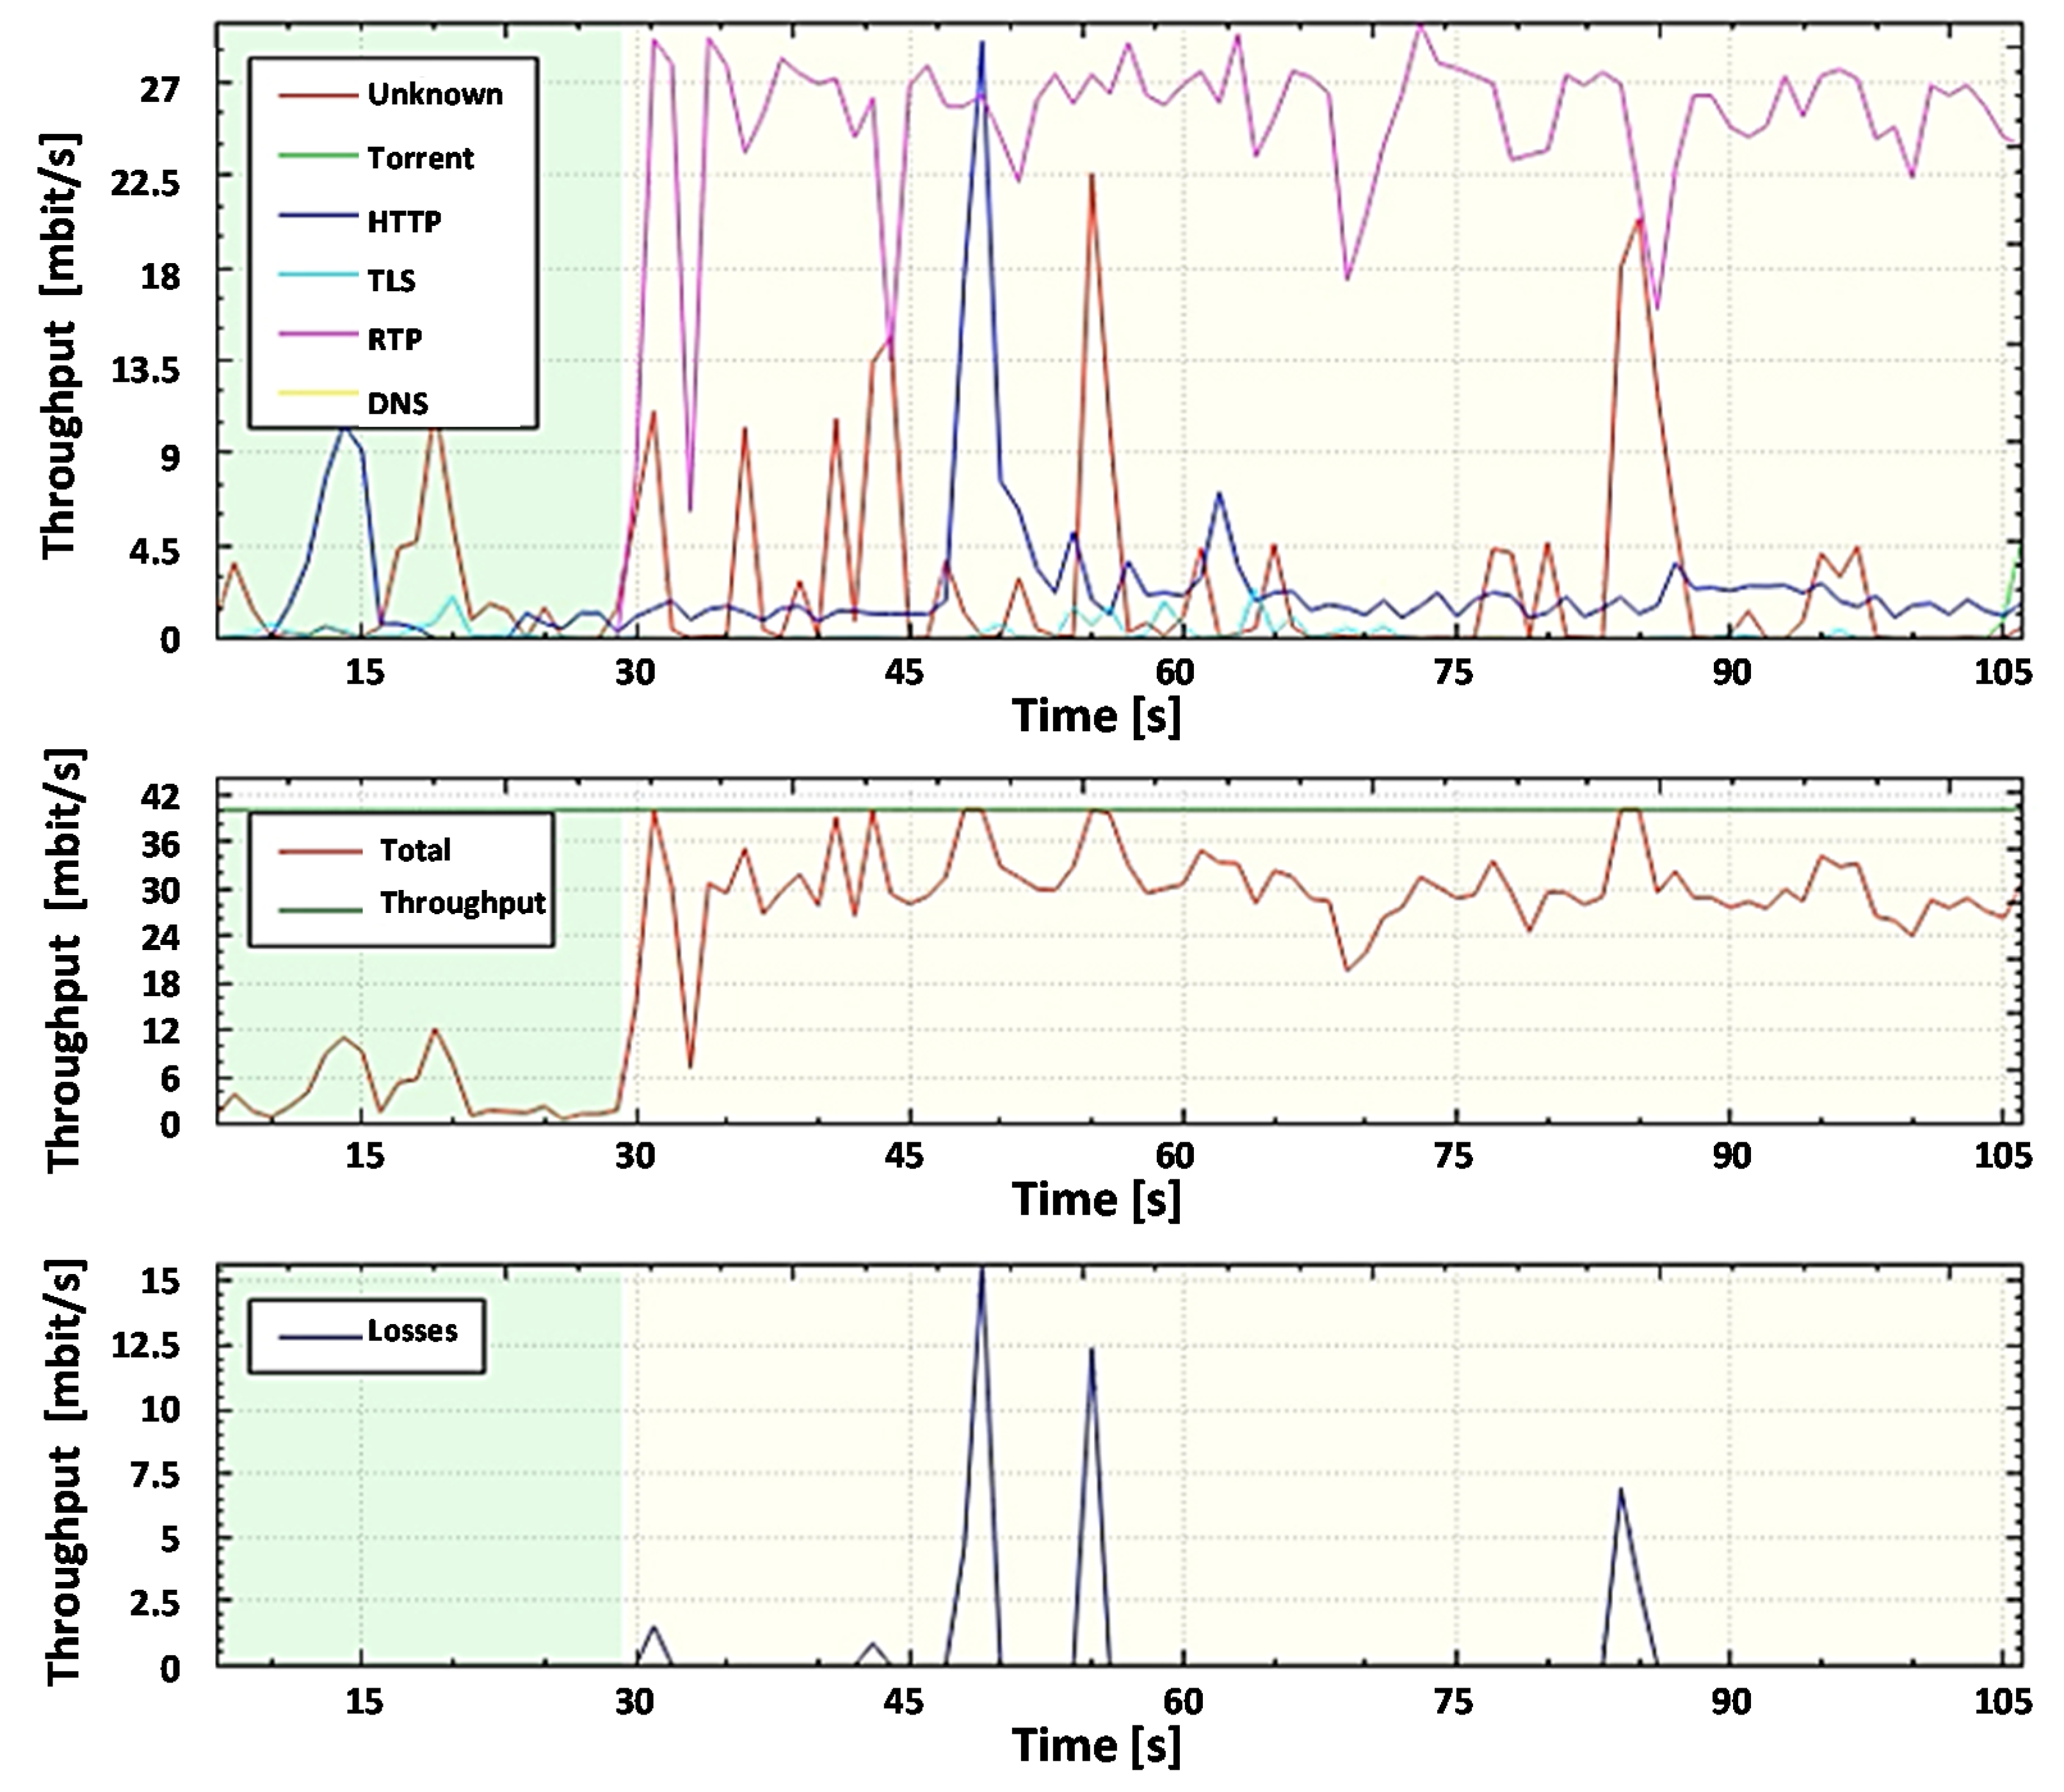
5.1.2. Traffic Analysis and Anomaly Detection Results Using Solarwinds DPI and Proposed DPI System (Transmitting Only Legitimate Traffic)
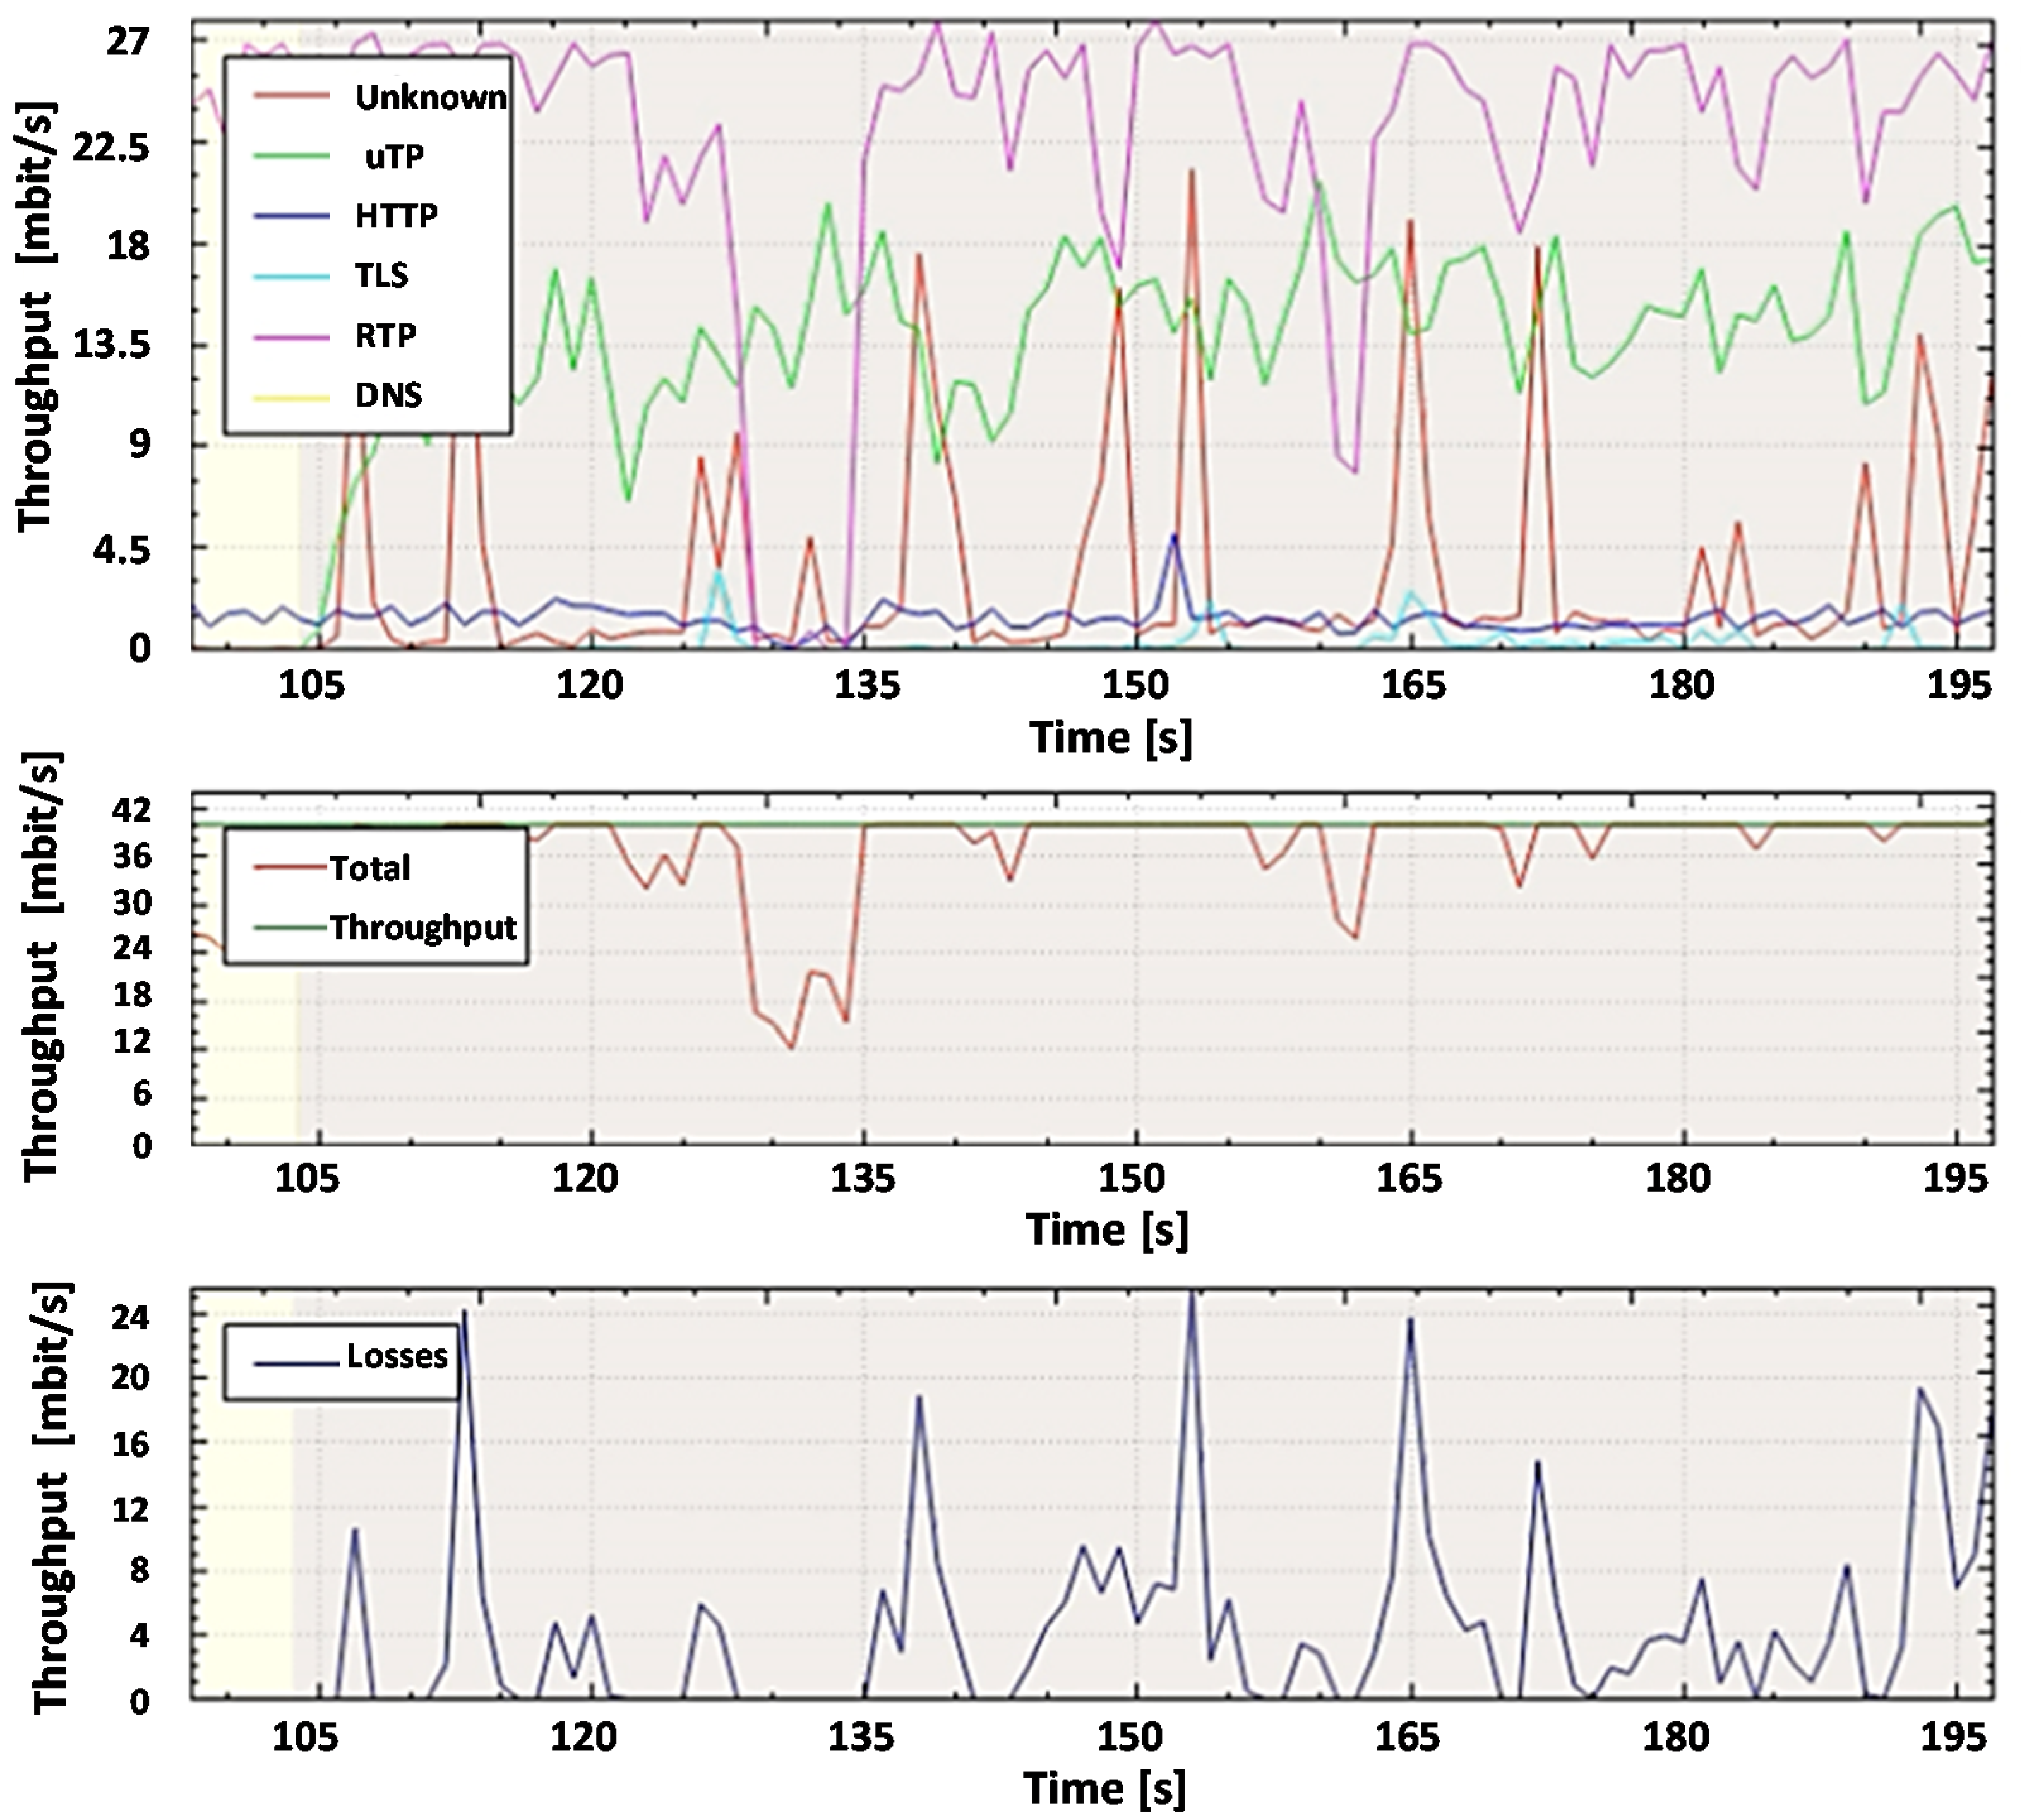
5.1.3. Traffic Analysis and Anomaly Detection Results Using Solarwinds Dpi System (Transmitting Legitimate and Non-Legitimate Traffic)
5.1.4. Traffic Analysis and Anomaly Detection Results Using Proposed DPI System (Transmitting Legitimate and Non-Legitimate Traffic)
6. Discussion
- -
- collection and processing of statistics on network load, providing administrators with detailed information on channel utilization;
- -
- dynamic traffic prioritization and bandwidth management for specific applications, providing optimized channel utilization;
- -
- network traffic management, using the capabilities of DPI solutions to redirect selected traffic to other traffic-handling devices;
- -
- scan traffic for viruses and network anomaly;
7. Conclusions
Author Contributions
Funding
Conflicts of Interest
References
- Zikria, Y.B.; Kim, S.W.; Hahm, O.; Afzal, M.K.; Aalsalem, M.Y. Internet of Things (IoT) Operating Systems Management: Opportunities, Challenges, and Solution. Sensors 2019, 19, 1793. [Google Scholar] [CrossRef] [PubMed] [Green Version]
- Meyer, T.; Arroyo, P.; Herrero, J.L.; Suárez, J.I.; Lozano, J. Wireless Sensor Network Combined with Cloud Computing for Air Quality Monitoring. Sensors 2019, 19, 691. [Google Scholar]
- Li, S.; Kim, J.G.; Han, D.H.; Lee, K.S. A Survey of Energy-Efficient Communication Protocols with QoS Guarantees in Wireless Multimedia Sensor Networks. Sensors 2019, 19, 199. [Google Scholar] [CrossRef] [PubMed] [Green Version]
- Hasan, M.; Islam, M.M.; Zarif, M.I.I.; Hashem, M.M.A. Attack and Anomaly Detection in IoT Sensors in IoT Sites Using Machine Learning Approaches. Internet Things 2019, 7, 100059. [Google Scholar] [CrossRef]
- Seliuchenko, M.; Beshley, M.; Kyryk, M.; Zhovtonoh, M. Automated Recovery of Server Applications for SDN-Based Internet of Things. In Proceedings of the 2019 3rd International Conference on Advanced Information and Communications Technologies (AICT), Lviv, Ukraine, 2–6 July 2019; pp. 149–152. [Google Scholar]
- Fernández Maimó, L.; Perales Gómez, Á.L.; García Clemente, F.J.; Gil Pérez, M.; Martínez Pérez, G. A Self-Adaptive Deep Learning-Based System for Anomaly Detection in 5G Networks. IEEE Access 2018, 6, 7700–7712. [Google Scholar] [CrossRef]
- Ten, C.-W.; Hong, J.; Liu, C.-C. Anomaly Detection for Cybersecurity of the Substations. IEEE Trans. Smart Grid 2011, 2, 865–873. [Google Scholar] [CrossRef]
- Pahl, M.-O.; Aubet, F.-X. All Eyes on You: Distributed Multi-Dimensional IoT Microservice Anomaly Detection. In Proceedings of the 2018 14th International Conference on Network and Service Management (CNSM), Rome, Italy, 5–9 November 2018; pp. 72–80. [Google Scholar]
- Khraisat, A.; Gondal, I.; Vamplew, P.; Kamruzzaman, J. Survey of Intrusion Detection Systems: Techniques, Datasets and Challenges. Cybersecur 2019, 2, 20. [Google Scholar] [CrossRef]
- YES! Encrypted Traffic Can Be Classified. Available online: https://www.thefastmode.com/expert-opinion/8510-yes-encrypted-traffic-can-be-classified (accessed on 25 February 2020).
- Beshley, M.; Romanchuk, V.; Chervenets, V.; Masiuk, A. Ensuring the Quality of Service Flows in Multiservice Infrastructure Based on Network Node Virtualization. In Proceedings of the 2016 International Conference Radio Electronics Info Communications (UkrMiCo), Kiev, Ukraine, 11–16 September 2016; pp. 1–3. [Google Scholar]
- Klymash, M.; Beshley, H.; Panchenko, O.; Beshley, M. Method for Optimal Use of 4G/5G Heterogeneous Network Resourses under M2M/IoT Traffic Growth Conditions. In Proceedings of the 2017 International Conference on Information and Telecommunication Technologies and Radio Electronics (UkrMiCo), Odessa, Ukraine, 11–15 September 2017; pp. 1–5. [Google Scholar]
- Michałowska, J.; Jozwik, J. Prediction of the parameters of magnetic field of CNC machine tools. Przeglad Elektrotechniczny 2019, 95, 134–136. [Google Scholar] [CrossRef] [Green Version]
- Reddy, J.M.; Hota, C. Heuristic-Based Real-Time P2P Traffic Identification. In Proceedings of the 2015 International Conference on Emerging Information Technology and Engineering Solutions, Pune, India, 20–21 February. 2015; pp. 38–43. [Google Scholar]
- Agarwal, B.; Mittal, N. Hybrid Approach for Detection of Anomaly Network Traffic Using Data Mining Techniques. Procedia Technol. 2012, 6, 996–1003. [Google Scholar] [CrossRef]
- Romanchuk, V.; Beshley, M.; Polishuk, A.; Seliuchenko, M. Method for Processing Multiservice Traffic in Network Node Based on Adaptive Management of Buffer Resource. In Proceedings of the 2018 14th International Conference on Advanced Trends in Radioelecrtronics, Telecommunications and Computer Engineering (TCSET), Slavske, Ukraine, 20–24 February 2018; pp. 1118–1122. [Google Scholar]
- Klymash, M.; Romanchuk, V.; Beshley, M.; Arthur, P. Investigation and Simulation of System for Data Flow Processing in Multiservice Nodes Using Virtualization Mechanisms. In Proceedings of the 2017 IEEE First Ukraine Conference on Electrical and Computer Engineering (UKRCON), Kiev, Ukraine, 29 May–2 June 2017; pp. 989–992. [Google Scholar]
- Garcia-Font, V.; Garrigues, C.; Rifà-Pous, H. A Comparative Study of Anomaly Detection Techniques for Smart City Wireless Sensor Networks. Sensors 2016, 16, 868. [Google Scholar] [CrossRef] [Green Version]
- Barsukov, I.S.; Bobreshov, A.M.; Riapolov, M.P. Fractal Analysis Based Detection of DoS/LDoS Network Attacks. In Proceedings of the 2019 International Russian Automation Conference (RusAutoCon), Sochi, Russia, 8–14 September 2019; pp. 1–5. [Google Scholar]
- Deka, R.K.; Bhattacharyya, D.K. Self-Similarity Based DDoS Attack Detection Using Hurst Parameter. Secur. Commun. Netw. 2016, 9, 4468–4481. [Google Scholar] [CrossRef]
- Goldstein, M.; Uchida, S. A Comparative Evaluation of Unsupervised Anomaly Detection Algorithms for Multivariate Data. PLoS ONE 2016, 11, e0152173. [Google Scholar] [CrossRef] [PubMed] [Green Version]
- Baek, S.; Kwon, D.; Kim, J.; Suh, S.C.; Kim, H.; Kim, I. Unsupervised Labeling for Supervised Anomaly Detection in Enterprise and Cloud Networks. In Proceedings of the 2017 IEEE 4th International Conference on Cyber Security and Cloud Computing (CSCloud), New York, NY, USA, 26–28 June 2017; pp. 205–210. [Google Scholar]
- Hussain, B.; Du, Q.; Ren, P. Semi-Supervised Learning Based Big Data-Driven Anomaly Detection in Mobile Wireless Networks. China Commun. 2018, 15, 41–57. [Google Scholar] [CrossRef]
- Feng, C.; Li, T.; Chana, D. Multi-Level Anomaly Detection in Industrial Control Systems via Package Signatures and LSTM Networks. In Proceedings of the 2017 47th Annual IEEE/IFIP International Conference on Dependable Systems and Networks (DSN), Denver, CO, USA, 26–29 June 2017; pp. 261–272. [Google Scholar]
- Ergen, T.; Kerpiççi, M. A Novel Anomaly Detection Approach Based on Neural Networks. In Proceedings of the 2018 26th Signal Processing and Communications Applications Conference (SIU), Izmir, Turkey, 2–5 May 2018; pp. 1–4. [Google Scholar]
- Tabatabaefar, M.; Miriestahbanati, M.; Grégoire, J.-C. Network Intrusion Detection through Artificial Immune System. In Proceedings of the 2017 Annual IEEE International Systems Conference (SysCon), Montreal, QC, Canada, 24–27 April 2017; pp. 1–6. [Google Scholar]
- Liu, Y.; Chen, Y.; Yu, H.; Fang, X.; Gong, C. Real Time Expert System for Anomaly Detection of Aerators Based on Computer Vision Technology and Existing Surveillance Cameras. arXiv 2018, arXiv:1810.04108. [Google Scholar]
- Nikolova, E.; Jecheva, V. Applications of Clustering Methods to Anomaly-Based Intrusion Detection Systems. In Proceedings of the 2015 8th International Conference on Database Theory and Application (DTA), Jeju, Korea, 25–28 November 2015; pp. 37–41. [Google Scholar]
- Solaimani, M.; Iftekhar, M.; Khan, L.; Thuraisingham, B. Statistical Technique for Online Anomaly Detection Using Spark over Heterogeneous Data from Multi-Source VMware Performance Data. In Proceedings of the 2014 IEEE International Conference on Big Data (Big Data), Washington, DC, USA, 27–30 October 2014; pp. 1086–1094. [Google Scholar]
- Klymash, M.; Beshley, H.; Seliuchenko, M.; Beshley, M. Algorithm for Clusterization, Aggregation and Prioritization of M2M Devices in Heterogeneous 4G/5G Network. In Proceedings of the 2017 4th International Scientific-Practical Conference Problems of Infocommunications. Science and Technology (PICST), Kharkov, Ukraine, 10–13 October 2017; pp. 182–186. [Google Scholar]
- Chae, Y. Representing Statistical Network-Based Anomaly Detection by Using Trust. Ph.D. Thesis, University of Rhode Island, South Kingstown, Rhode Island, 2017. [Google Scholar]
- Andrysiak, T.; Saganowski, Ł. Network Anomaly Detection Based on Statistical Models with Long-Memory Dependence. Theory and Engineering of Complex Systems and DependabilityZamojski, W., Mazurkiewicz, J., Sugier, J., Walkowiak, T., Kacprzyk, J., Eds.; Advances in Intelligent Systems and ComputingSpringer International Publishing: Cham, Switzerland, 2015; pp. 1–10. [Google Scholar]
- Zomaya, D. 7 Best Network Intrusion Detection Tools—What to Look for & Reviews. Comput. Perform. 2018. [Google Scholar]
- Larue-Langlois, R. Network-Based Intrusion Detection Systems: 5 Best NIDS Tools to Use. AddictiveTips 2019. [Google Scholar]
- Open Source IDS Tools: Comparing Suricata, Snort, Bro (Zeek), Linux. Available online: https://cybersecurity.att.com/blogs/security-essentials/open-source-intrusion-detection-tools-a-quick-overview (accessed on 3 February 2020).
- Nadiammai, G.V.; Hemalatha, M. Snort Based Network Traffic Anomaly Detector to Improve the Performance of Intrusion Detection System. Int. J. Adv. Res. Comput. Sci. 2012, 3, 9–13. [Google Scholar]
- Jakimoski, K.; Singhai, N.V. Improvement of Hardware Firewall’s Data Rates by Optimizing Suricata Performances. In Proceedings of the 2019 27th Telecommunications Forum (℡FOR), Belgrade, Serbia, 26–27 November 2019; pp. 1–4. [Google Scholar]
- Nam, K.; Kim, K. A Study on SDN Security Enhancement Using Open Source IDS/IPS Suricata. In Proceedings of the 2018 International Conference on Information and Communication Technology Convergence (ICTC), Jeju, South Korea, 17–19 October 2018; pp. 1124–1126. [Google Scholar]
- Deri, L.; Martinelli, M.; Bujlow, T.; Cardigliano, A. NDPI: Open-Source High-Speed Deep Packet Inspection. In Proceedings of the 2014 International Wireless Communications and Mobile Computing Conference (IWCMC), Nicosia, Cyprus, 4–8 August 2014; pp. 617–622. [Google Scholar]
- Doroud, H.; Aceto, G.; de Donato, W.; Jarchlo, E.A.; Lopez, A.M.; Guerrero, C.D.; Pescape, A. Speeding-Up DPI Traffic Classification with Chaining. In Proceedings of the 2018 IEEE Global Communications Conference (GLOBECOM), Abu Dhabi, United Arab Emirates, 9–13 December 2018; pp. 1–6. [Google Scholar]
- Aceto, G.; Ciuonzo, D.; Montieri, A.; Pescapé, A. Mobile Encrypted Traffic Classification Using Deep Learning: Experimental Evaluation, Lessons Learned, and Challenges. IEEE Trans. Netw. Serv. Manag. 2019, 16, 445–458. [Google Scholar] [CrossRef]
- Przystupa, K. Reliability Assessment Method of Device under Incomplete Monitoring of Failure. In Proceedings of the 2018 18th International Conference on Mechatronics—Mechatronika (ME), Brno, Czech Republic, 5–7 December 2018; pp. 1–6. [Google Scholar]
- Jun, S.; Kochan, O. Common mode noise rejection in measuring channels. Instrum. Exp. Tech. 2015, 58, 86–89. [Google Scholar] [CrossRef]
- Wojciechowski, S.; Wiackiewicz, M.; Krolczyk, G.M. Study on Metrological Relations between Instant Tool Displacements and Surface Roughness during Precise Ball End Milling. Measurement 2018, 129, 686–694. [Google Scholar] [CrossRef]
- Jun, S.; Kochan, O.; Kochan, R. Thermocouples with Built-In Self-Testing. Int. J. Thermophys. 2016, 37, 37. [Google Scholar] [CrossRef]
- Jun, S.; Kochan, O.; Chunzhi, W.; Kochan, R. Theoretical and Experimental Research of Error of Method of Thermocouple with Controlled Profile of Temperature Field. Meas. Sci. Rev. 2015, 15, 304–312. [Google Scholar] [CrossRef] [Green Version]
- Glowacz, A.; Glowacz, W.; Kozik, J.; Piech, K.; Gutten, M.; Caesarendra, W.; Liu, H.; Brumercik, F.; Irfan, M.; Khan, Z.F. Detection of Deterioration of Three-Phase Induction Motor Using Vibration Signals. Meas. Sci. Rev. 2019, 19, 241–249. [Google Scholar] [CrossRef] [Green Version]
- Wang, J.; Kochan, O.; Przystupa, K.; Su, J. Information-Measuring System to Study the Thermocouple with Controlled Temperature Field. Meas. Sci. Rev. 2019, 19, 161–169. [Google Scholar] [CrossRef] [Green Version]
- Rahman, M.A.; Asyhari, A.T. The Emergence of Internet of Things (IoT): Connecting Anything, Anywhere. Computers 2019, 8, 40. [Google Scholar] [CrossRef] [Green Version]
- Dudhe, P.V.; Kadam, N.V.; Hushangabade, R.M.; Deshmukh, M.S. Internet of Things (IOT): An Overview and Its Applications. In Proceedings of the 2017 International Conference on Energy, Communication, Data Analytics and Soft Computing (ICECDS), Chennai, India, 1–2 August 2017; pp. 2650–2653. [Google Scholar]
- Pieniak, D.; Przystupa, K.; Walczak, A.; Niewczas, A.M.; Krzyzak, A.; Bartnik, G.; Gil, L.; Lonkwic, P. Hydro-Thermal Fatigue of Polymer Matrix Composite Biomaterials. Materials 2019, 12, 3650. [Google Scholar] [CrossRef] [PubMed] [Green Version]
- Pieniak, D.; Walczak, A.; Niewczas, A.M.; Przystupa, K. The Effect of Thermocycling on Surface Layer Properties of Light Cured Polymer Matrix Ceramic Composites (PMCCs) Used in Sliding Friction Pair. Materials 2019, 12, 2776. [Google Scholar] [CrossRef] [Green Version]
- Przystupa, K. The methods analysis of hazards and product defects in food processing. Czech J. Food Sci. 2019, 37, 44–50. [Google Scholar] [CrossRef]
- Yang, X.; Chen, P.; Gao, S.; Niu, Q. CSI-Based Low-Duty-Cycle Wireless Multimedia Sensor Network for Security Monitoring. Electron. Lett. 2018, 54, 323–324. [Google Scholar] [CrossRef]
- Leppänen, R.F.; Hämäläinen, T. Network Anomaly Detection in Wireless Sensor Networks: A Review. In Internet of Things, Smart Spaces, and Next Generation Networks and Systems; Galinina, O., Andreev, S., Balandin, S., Koucheryavy, Y., Eds.; Lecture Notes in Computer Science; Springer International Publishing: Cham, Switzerland, 2019; pp. 196–207. [Google Scholar]
- Cauteruccio, F.; Fortino, G.; Guerrieri, A.; Liotta, A.; Mocanu, D.C.; Perra, C.; Terracina, G.; Torres Vega, M. Short-Long Term Anomaly Detection in Wireless Sensor Networks Based on Machine Learning and Multi-Parameterized Edit Distance. Inf. Fusion 2019, 52, 13–30. [Google Scholar] [CrossRef] [Green Version]
- Ramotsoela, D.; Abu-Mahfouz, A.; Hancke, G. A Survey of Anomaly Detection in Industrial Wireless Sensor Networks with Critical Water System Infrastructure as a Case Study. Sensors 2018, 18, 2491. [Google Scholar] [CrossRef] [PubMed] [Green Version]
- Dymora, P.; Mazurek, M. Anomaly Detection in IoT Communication Network Based on Spectral Analysis and Hurst Exponent. Appl. Sci. 2019, 9, 5319. [Google Scholar] [CrossRef] [Green Version]
- Ramapatruni, S.; Narayanan, S.N.; Mittal, S.; Joshi, A.; Joshi, K. Anomaly Detection Models for Smart Home Security. In Proceedings of the 2019 IEEE 5th Intl Conference on Big Data Security on Cloud (BigDataSecurity), IEEE Intl Conference on High Performance and Smart Computing, (HPSC) and IEEE Intl Conference on Intelligent Data and Security (IDS), Washington, DC, USA, 27–29 May 2019; pp. 19–24. [Google Scholar]
- El-Maghraby, R.T.; Elazim, N.M.A.; Bahaa-Eldin, A.M. A Survey on Deep Packet Inspection. In Proceedings of the 2017 12th International Conference on Computer Engineering and Systems (ICCES), Cairo, Egypt, 19–20 December 2017; pp. 188–197. [Google Scholar]
- Parvat, T.J.; Chandra, P. Performance Improvement of Deep Packet Inspection for Intrusion Detection. In Proceedings of the 2014 IEEE Global Conference on Wireless Computing Networking (GCWCN), Lonavala, India, 22–24 December 2014; pp. 224–228. [Google Scholar]
- Shankar, S.S.; PinXing, L.; Herkersdorf, A. Deep Packet Inspection in Residential Gateways and Routers: Issues and Challenges. In Proceedings of the 2014 International Symposium on Integrated Circuits (ISIC), Singapore, 10–12 December 2014; pp. 560–563. [Google Scholar]
- Klymash, M.; Beshley, M.; Koval, V. The Model of Prioritization of Services for Efficient Usage of Multiservice Network Resources. Proceedings of International Conference on Modern Problem of Radio Engineering, Telecommunications and Computer Science (TCSET), Lviv-Slavske, Ukraine, 21–24 February 2012; pp. 320–321. [Google Scholar]
- Chakrabarty, N. A Gaussian Approach to the Detection of Anomalous Behavior in Server Computers. Available online: https://medium.com/towards-artificial-intelligence/a-gaussian-approach-to-detection-of-anomalous-behavior-in-server-computers-c70f7c3c1d94 (accessed on 3 February 2020).
- Wang, S.; Xu, D.; Yan, S. Analysis and Application of Wireshark in TCP/IP Protocol Teaching. In Proceedings of the 2010 International Conference on E-Health Networking Digital Ecosystems and Technologies (EDT), Shenzhen, China, 17–18 April 2010; pp. 269–272. [Google Scholar]
- WinDivert: Windows Packet Divert. Available online: https://www.reqrypt.org/windivert.html (accessed on 3 February 2020).
- Xiaoguang, A.; Xiaofan, L. Packet Capture and Protocol Analysis Based on Winpcap. In Proceedings of the 2016 International Conference on Robots Intelligent System (ICRIS), Zhangjiajie, China, 27–28 August 2016; pp. 272–275. [Google Scholar]
- Romanchuk, V.; Beshley, M.; Panchenko, O.; Arthur, P. Design of Software Router with a Modular Structure and Automatic Deployment at Virtual Nodes. In Proceedings of the 2017 2nd International Conference on Advanced Information and Communication Technologies (AICT), Lviv, Ukraine, 4–7 July 2017; pp. 295–298. [Google Scholar]
- Seliuchenko, M.; Beshley, M.; Panchenko, O.; Klymash, M. Development of Monitoring System for End-to-End Packet Delay Measurement in Software-Defined Networks. In Proceedings of the 2016 13th International Conference on Modern Problems of Radio Engineering, Telecommunications and Computer Science (TCSET), Lviv, Ukraine, 23–26 February 2016; pp. 667–670. [Google Scholar]
- Beshley, M.; Seliuchenko, M.; Panchenko, O.; Polishuk, A. Adaptive Flow Routing Model in SDN. In Proceedings of the 2017 14th International Conference The Experience of Designing and Application of CAD Systems in Microelectronics (CADSM), Lviv, Ukraine, 21–25 February 2017; pp. 298–302. [Google Scholar]
- Sousa, F.R.M.; Cordeiro, L.C.; de Lima Filho, E.B. Bounded Model Checking of C++ Programs Based on the Qt Framework. In Proceedings of the 2015 IEEE 4th Global Conference on Consumer Electronics (GCCE), Osaka, Japan, 27–30 October 2015; pp. 179–180. [Google Scholar]
- Jaloudi, S. Communication Protocols of an Industrial Internet of Things Environment: A Comparative Study. Future Internet 2019, 11, 66. [Google Scholar] [CrossRef] [Green Version]
- Beshley, H.; Beshley, M.; Maksymyuk, T.; Strykhalyuk, I. Method of Centralized Resource Allocation in Virtualized Small Cells Network with IoT Overlay. In Proceedings of the 2018 14th International Conference on Advanced Trends in Radioelecrtronics, Telecommunications and Computer Engineering (TCSET), Slavske, Ukraine, 20–24 February 2018; pp. 1147–1151. [Google Scholar]
- Klymash, M.; Savchuk, R.; Pozdnyakov, P.; Beshley, M. The Researching and Modeling of Structures of Mobile Networks for Providing of Multiservice Radio Access. In Proceedings of the International Conference on Modern Problem of Radio Engineering, Telecommunications and Computer Science(TCSET), Lviv-Slavske, Ukraine, 21–24 February 2012; pp. 281–282. [Google Scholar]
- Demydov, I.; Seliuchenko, M.; Beshley, M.; Brych, M. Mobility Management and Vertical Handover Decision in an Always Best Connected Heterogeneous Network. In Proceedings of the Experience of Designing and Application of CAD Systems in Microelectronics (CADSM), Lviv, Ukraine, 24–27 February 2015; pp. 103–105. [Google Scholar]
- Ma, G.; Wang, C.; Liu, P.; Zhu, S. Sequential Similarity Detection Algorithm Based on Image Edge Feature. J. Shanghai Jiaotong Univ. (Sci.) 2014, 19, 79–83. [Google Scholar] [CrossRef]
- Lai, C.-M.; Huang, B.-C.; Huang, S.-Y.; Mao, C.-H.; Lee, H.-M. Detection of DNS Tunneling by Feature-Free Mechanism. In Proceedings of the 2018 IEEE Conference on Dependable and Secure Computing (DSC), Kaohsiung, Taiwan, 10–13 December 2018; pp. 1–2. [Google Scholar]
- Chapter 11. Name Resolution and the Domain Name System (DNS)—Shichao’s Notes. Available online: https://notes.shichao.io/tcpv1/ch11/ (accessed on 3 February 2020).
- Ahmed, I.; Badia, L.; Hussain, K. Evaluation of Deficit Round Robin Queue Discipline for Real-Time Traffic Management in an RTP/RTCP Environment. In Proceedings of the 2010 Fourth UKSim European Symposium on Computer Modeling and Simulation, Pisa, Italy, 17–19 November 2010; pp. 484–489. [Google Scholar]
- Huang, Z.; Xia, C.; Sun, B.; Xue, H. Analyzing and Summarizing the Web Server Detection Technology Based on HTTP. In Proceedings of the 2015 6th IEEE International Conference on Software Engineering and Service Science (ICSESS), Beijing, China, 23–25 September 2015; pp. 1042–1045. [Google Scholar]
- Han, S.; Kwon, H.; Hahn, C.; Koo, D.; Hur, J. A Survey on MITM and Its Countermeasures in the TLS Handshake Protocol. In Proceedings of the 2016 Eighth International Conference on Ubiquitous and Future Networks (ICUFN), Vienna, Austria, 5–8 July 2016; pp. 724–729. [Google Scholar]
- Testa, C.; Rossi, D. On the Impact of UTP on BitTorrent Completion Time. In Proceedings of the 2011 IEEE International Conference on Peer-to-Peer Computing, Kyoto, Japan, 31 August–2 September 2011; pp. 314–317. [Google Scholar]
- Galeano-Brajones, J.; Carmona-Murillo, J.; Valenzuela-Valdés, J.F.; Luna-Valero, F. Detection and Mitigation of DoS and DDoS Attacks in IoT-Based Stateful SDN: An Experimental Approach. Sensors 2020, 20, 816. [Google Scholar] [CrossRef] [Green Version]
- Jun, S.; Przystupa, K.; Beshley, M.; Kochan, O.; Beshley, H.; Klymash, M.; Wang, J.; Pieniak, D. A Cost-Efficient Software Based Router and Traffic Generator for Simulation and Testing of IP Network. Electronics 2020, 9, 40. [Google Scholar] [CrossRef] [Green Version]
- Glossary: Common DDoS Attack Types. Corero. 2019. Available online: https://www.corero.com/blog/glossary/ (accessed on 3 February 2020).

| IP.addr = XX.XX.XX.XX | Another.data | ||||
|---|---|---|---|---|---|
| Int., s. | H1 | H2 | H3 | H4 | Hn |
| Window.size = 3 sec. | |||||
| 1–3 | H1–31 | H1–32 | H1–33 | H1–34 | H1–3n |
| 4–6 | H4–61 | H4–62 | H4–63 | H4–64 | H4–6n |
| 7–9 | H7–91 | H7–92 | H7–93 | H7–94 | H7–9n |
| …–… | … | … | … | … | … |
| 58–60 | H58–601 | H58–602 | H58–603 | H58–604 | H58–60n |
| Havg(3sec) | Havg1 | Havg2 | Havg3 | Havg 4 | Havg n |
| SN(3sec) | SN(3sec)1 | SN(3sec)1 | SN(3sec)1 | SN(3sec)1 | SN(3sec)1 |
| Window.size = 15 sec. | |||||
| 1–15 | H1–151 | H1–152 | H1–153 | H1–154 | H1–15n |
| 16–30 | H16–301 | H16–302 | H16–303 | H16–304 | H16–30n |
| 31–45 | H31–451 | H31–452 | H31–453 | H31–454 | H31–45n |
| 46–60 | H46–601 | H46–602 | H46–603 | H46–604 | H46–60n |
| Havg(15sec) | Havg1 | Havg2 | Havg3 | Havg 4 | Havg n |
| SN(15sec) | SN (15sec)1 | SN (15sec)1 | SN (15sec)1 | SN (15sec)1 | SN (15sec)1 |
| Window.size = 60 sec. | |||||
| 1–60 | H1–31 | H1–32 | H1–33 | H1–34 | H1–3n |
| Havg(60sec) | Havg 1 | Havg2 | Havg 3 | Havg 4 | Havg n |
| Int., s. = 3 | H3 | Int., s. = 15 | H15 | Int., s. = 60 | H60 |
|---|---|---|---|---|---|
| 1–3 | 1.35 | 1–15 | 0.4 | 1–60 | 0.5 |
| 4–6 | 1.35 | ||||
| 7–9 | 1.33 | ||||
| 10–12 | 1.7 | ||||
| 13–15 | 1.7 | ||||
| 16–18 | 1.65 | 16–30 | 0.6 | ||
| 19–21 | 1.35 | ||||
| 22–24 | 1.35 | ||||
| 25–27 | – | ||||
| 28–30 | – | ||||
| 31–33 | 1.35 | 31–45 | 0.62 | ||
| 34–36 | |||||
| 37–39 | |||||
| 40–42 | |||||
| 43–45 | 1.7 | ||||
| 46–48 | 1.35 | 46–60 | 0.67 | ||
| 49–51 | |||||
| 52–54 | |||||
| 55–57 | |||||
| 58–60 | |||||
| Havg(3sec) | 1.47 | Havg (15sec) | 0.57 | Havg (60sec) | 0.5 |
| SN(3sec) | 0.16 | SN (15sec) | 0.19 | – | – |
| Int., s. = 3 | H3 | Int., s. = 15 | H15 | Int., s. = 60 | H60 |
|---|---|---|---|---|---|
| 1–3 | 1.355 | 1–15 | 0.631 | 1–60 | 0.403 |
| 4–6 | 1.355 | ||||
| 7–9 | – | ||||
| 10–12 | – | ||||
| 13–15 | – | ||||
| 16–18 | 1.611 | 16–30 | 0.470 | ||
| 19–21 | 1.611 | ||||
| 22–24 | 1.611 | ||||
| 25–27 | 1.355 | ||||
| 28–30 | 1.355 | 31–45 | 0.631 | 1–60 | 0.403 |
| 31–33 | 1.355 | 31–45 | 0.631 | ||
| 34–36 | – | ||||
| 37–39 | – | ||||
| 40–42 | – | ||||
| 43–45 | 1.355 | ||||
| 46–48 | – | 46–60 | 0.438 | ||
| 49–51 | – | ||||
| 52–54 | 1.355 | ||||
| 55–57 | – | ||||
| 58–60 | 1.355 | ||||
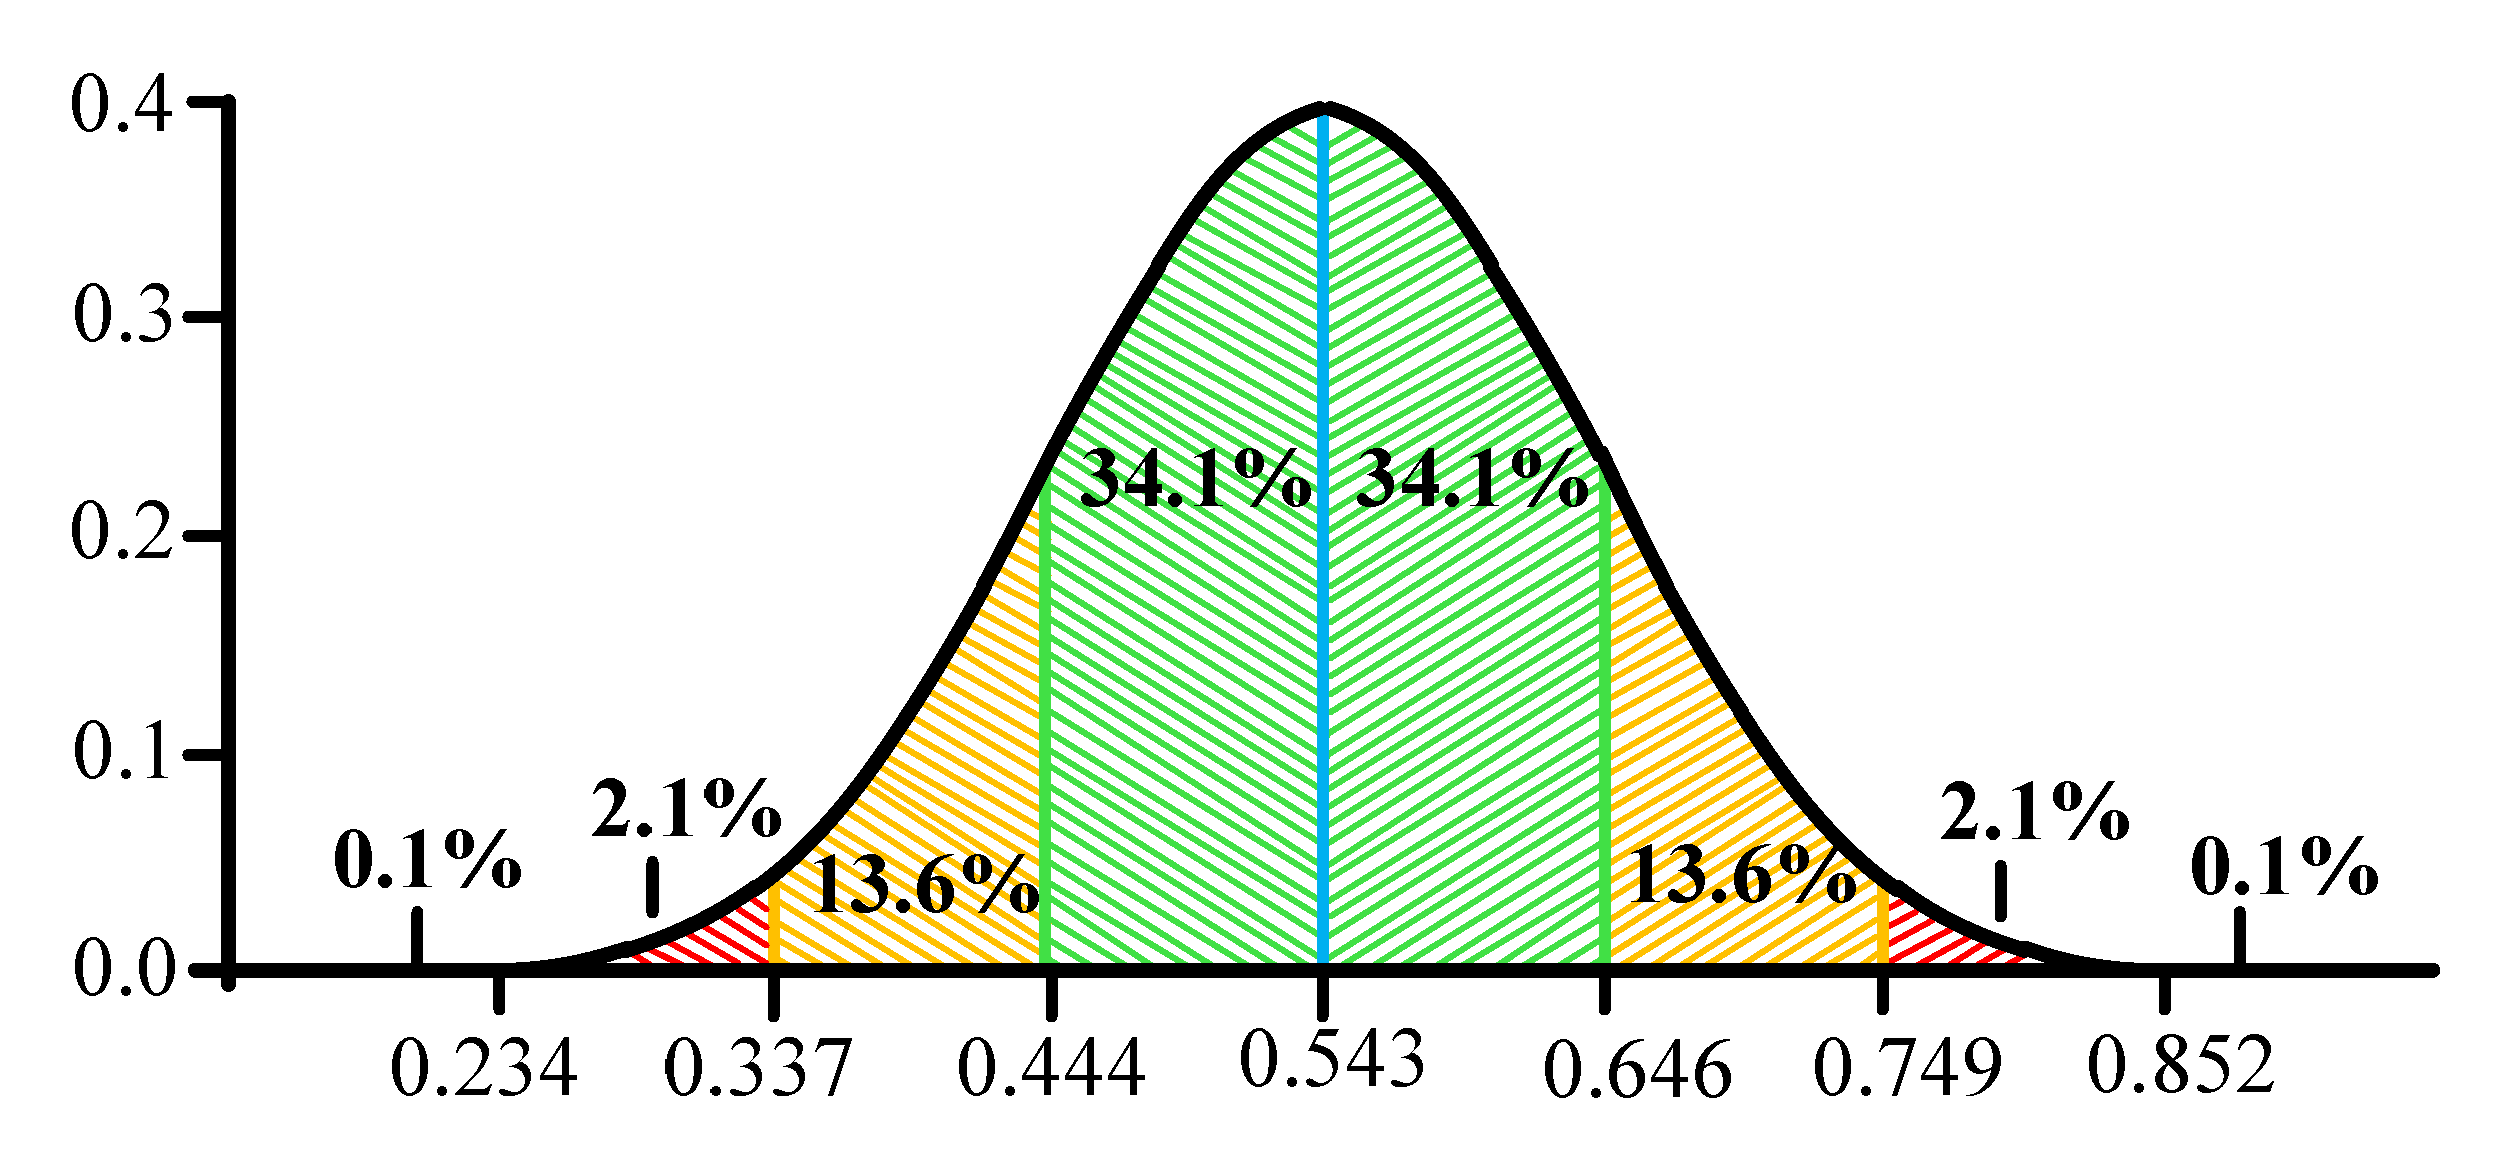
| Havg(3sec) | 1.425 | Havg (15sec) | 0.543 | Havg (60sec) | 0.403 |
| SN (3sec) | 0.120 | SN (15sec) | 0.103 | – | – |
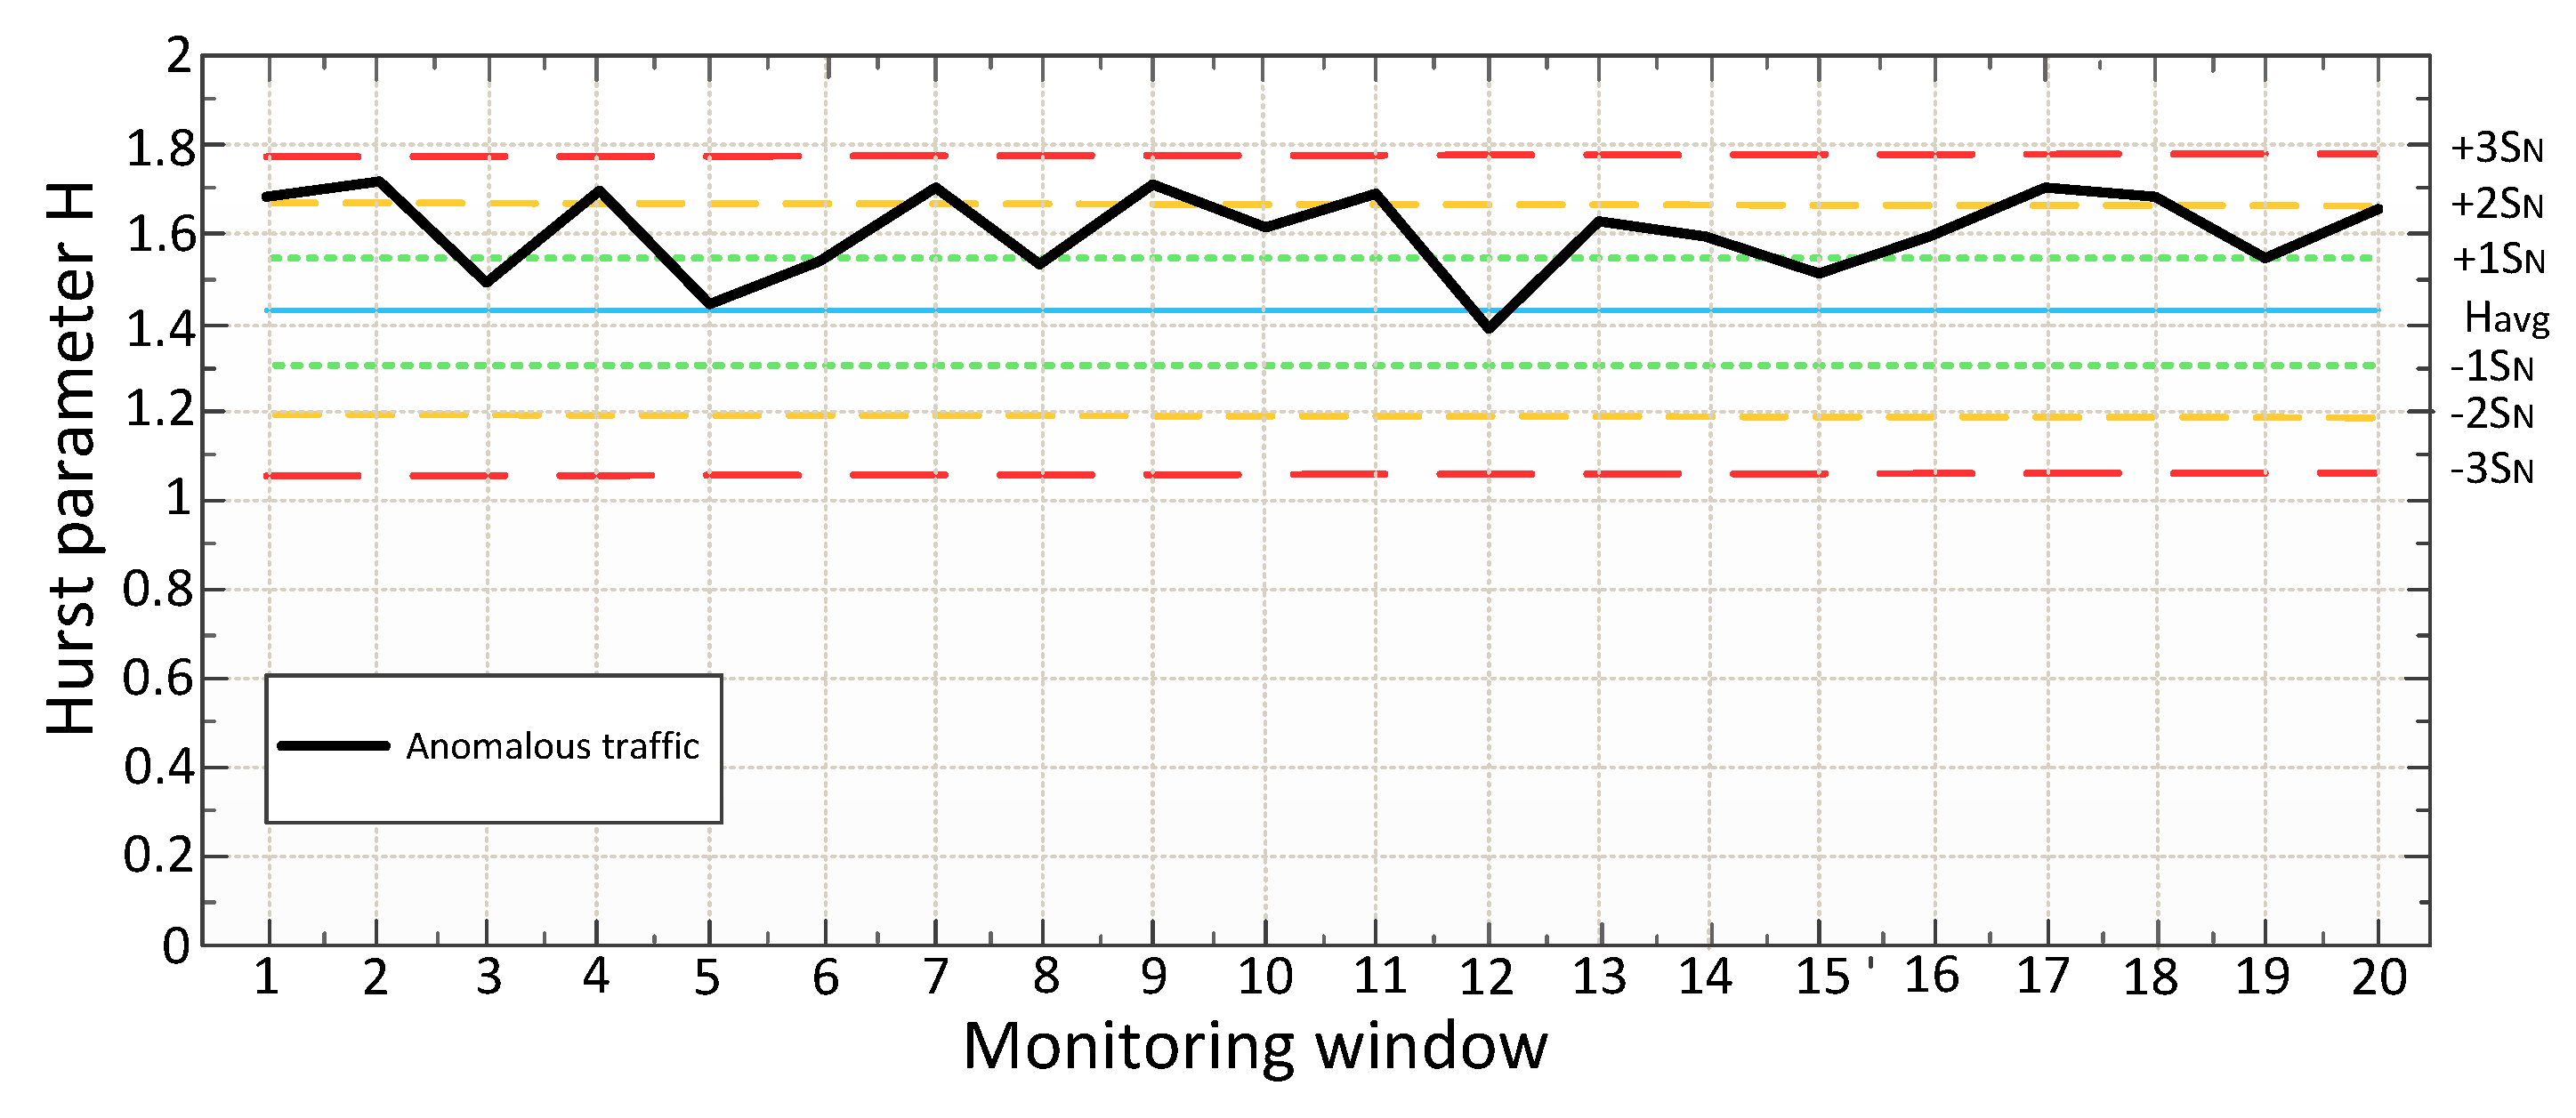
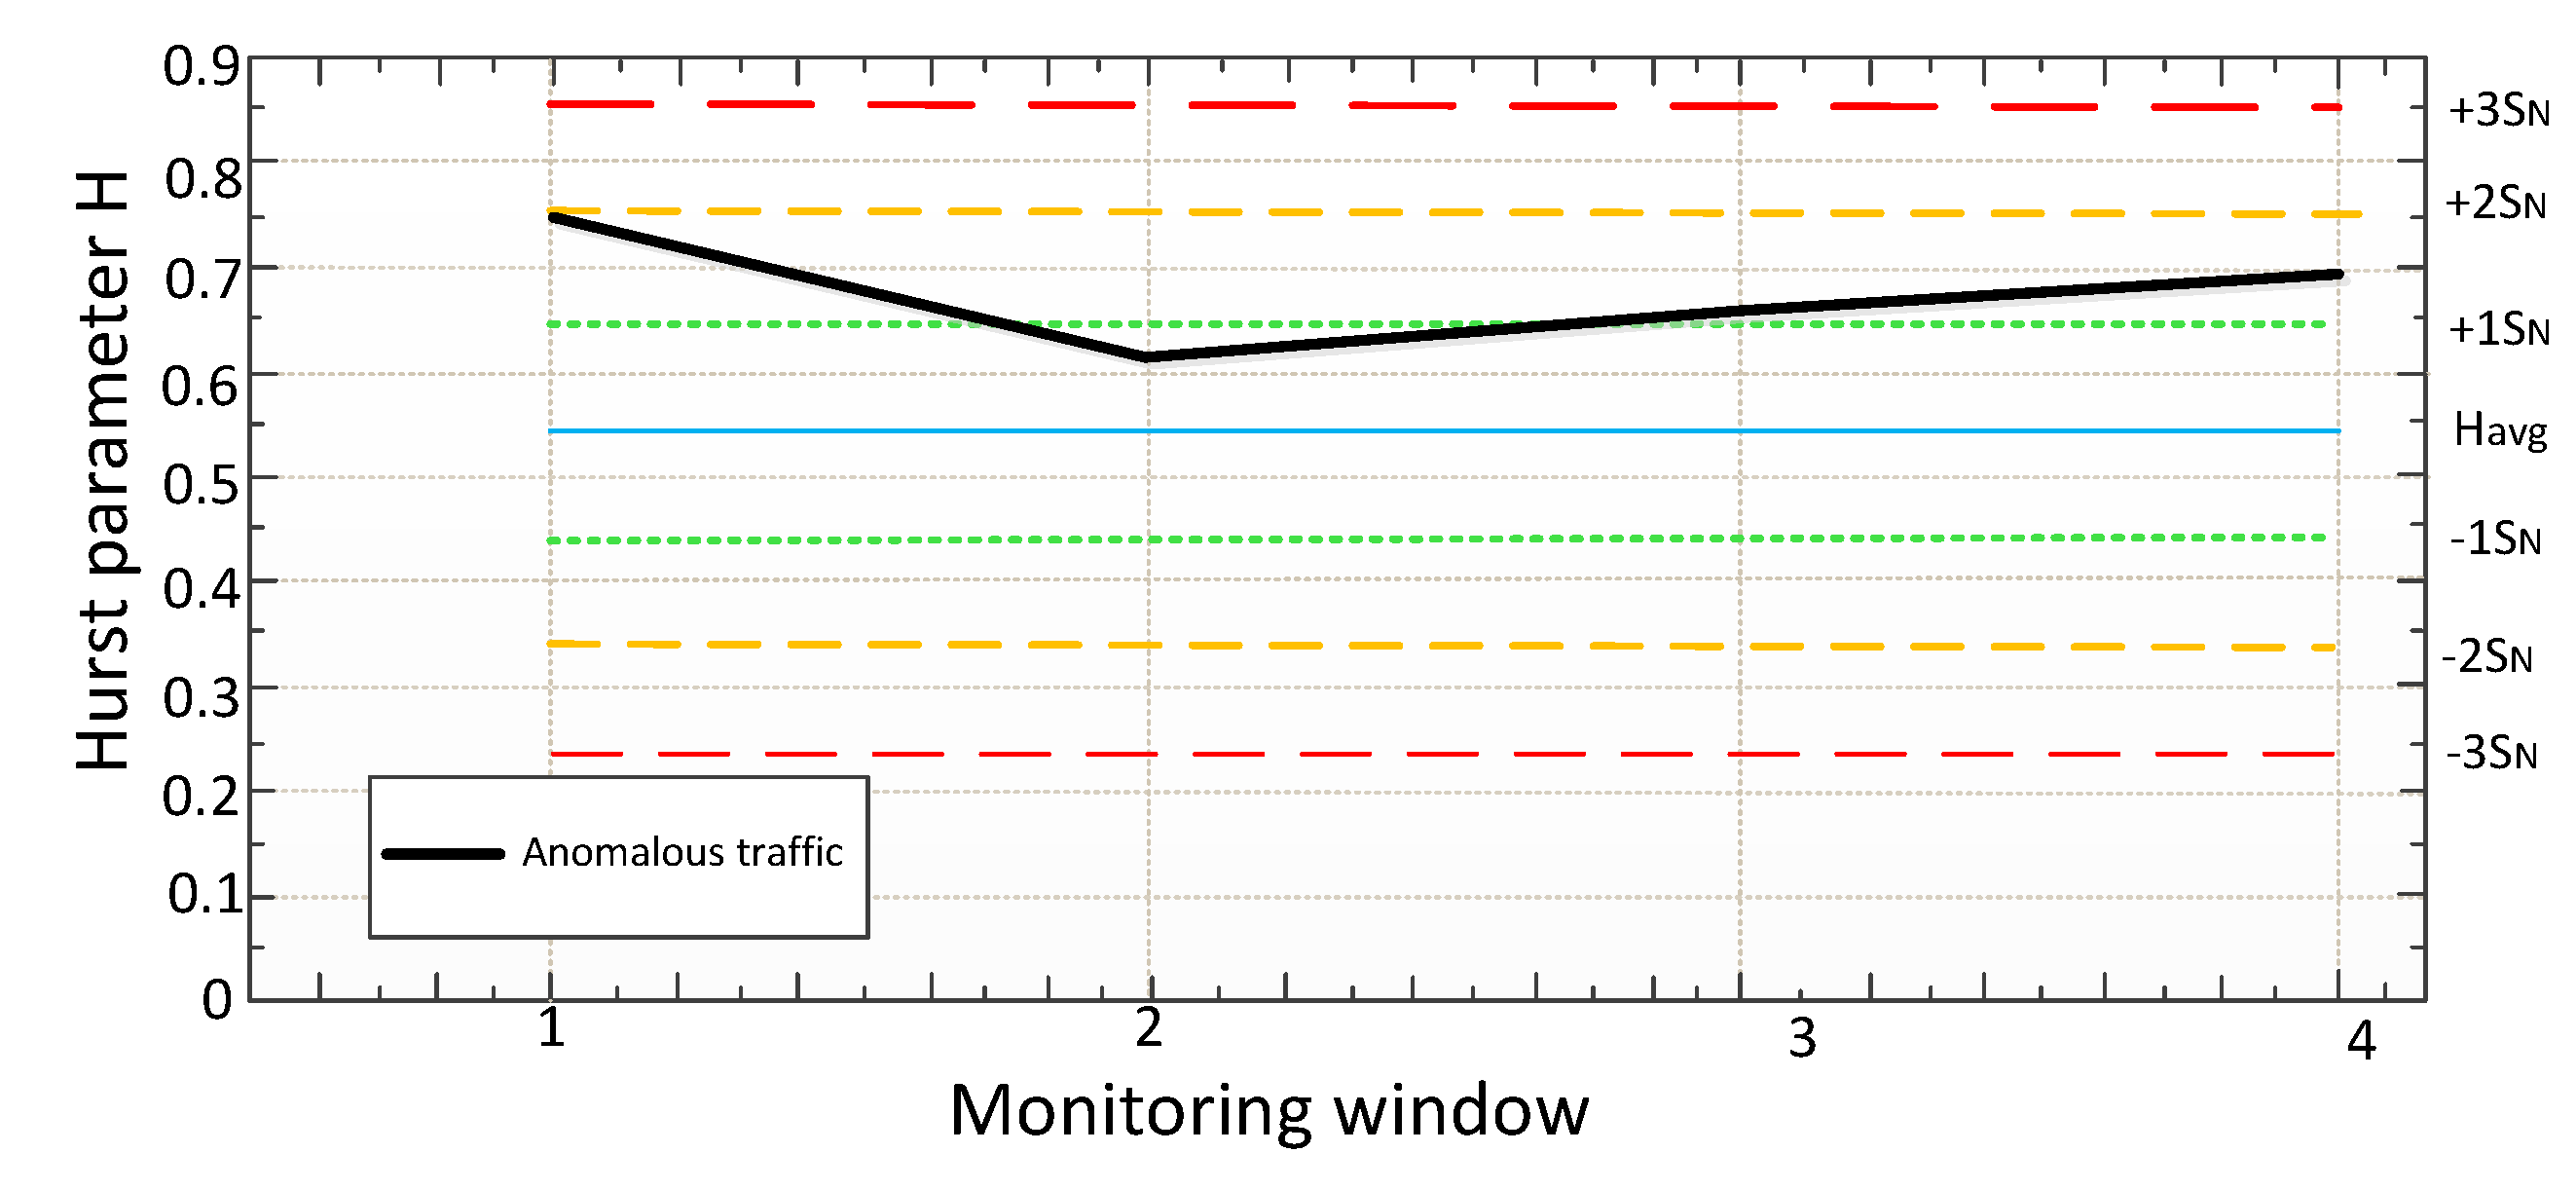
| Int., s. = 3 | H3 | Int., s. = 15 | H15 | Int., s. = 60 | H60 |
|---|---|---|---|---|---|
| 1–3 | 1.681 | 1–15 | 0.745 | 1–60 | 0.599 |
| 4–6 | 1.709 | ||||
| 7–9 | 1.489 | ||||
| 10–12 | 1.705 | ||||
| 13–15 | 1.437 | 1–15 | 0.745 | 1–60 | 0.599 |
| 16–18 | 1.539 | 16–30 | 0.613 | 1–60 | 0.599 |
| 19–21 | 1.706 | ||||
| 22–24 | 1.526 | ||||
| 25–27 | 1.708 | ||||
| 28–30 | 1.607 | ||||
| 31–33 | 1.691 | 31–45 | 0.659 | ||
| 34–36 | 1.392 | ||||
| 37–39 | 1.630 | ||||
| 40–42 | 1.596 | ||||
| 43–45 | 1.507 | ||||
| 46–48 | 1.592 | 46–60 | 0.694 | ||
| 49–51 | 1.703 | ||||
| 52–54 | 1.682 | ||||
| 55–57 | 1.547 | ||||
| 58–60 | 1.647 |
© 2020 by the authors. Licensee MDPI, Basel, Switzerland. This article is an open access article distributed under the terms and conditions of the Creative Commons Attribution (CC BY) license (http://creativecommons.org/licenses/by/4.0/).
Share and Cite
Song, W.; Beshley, M.; Przystupa, K.; Beshley, H.; Kochan, O.; Pryslupskyi, A.; Pieniak, D.; Su, J. A Software Deep Packet Inspection System for Network Traffic Analysis and Anomaly Detection. Sensors 2020, 20, 1637. https://doi.org/10.3390/s20061637
Song W, Beshley M, Przystupa K, Beshley H, Kochan O, Pryslupskyi A, Pieniak D, Su J. A Software Deep Packet Inspection System for Network Traffic Analysis and Anomaly Detection. Sensors. 2020; 20(6):1637. https://doi.org/10.3390/s20061637
Chicago/Turabian StyleSong, Wenguang, Mykola Beshley, Krzysztof Przystupa, Halyna Beshley, Orest Kochan, Andrii Pryslupskyi, Daniel Pieniak, and Jun Su. 2020. "A Software Deep Packet Inspection System for Network Traffic Analysis and Anomaly Detection" Sensors 20, no. 6: 1637. https://doi.org/10.3390/s20061637
APA StyleSong, W., Beshley, M., Przystupa, K., Beshley, H., Kochan, O., Pryslupskyi, A., Pieniak, D., & Su, J. (2020). A Software Deep Packet Inspection System for Network Traffic Analysis and Anomaly Detection. Sensors, 20(6), 1637. https://doi.org/10.3390/s20061637