Sleep in the Natural Environment: A Pilot Study

 ,
,  , , ,
, , ,
Abstract
1. Introduction
2. State-of-the-Art
3. Materials and Methods
3.1. Research Setting
3.2. Recruitment Methods
3.3. Inclusion and Exclusion Criteria
3.4. Onboarding Questionnaires
3.5. Technology Setup and Testing
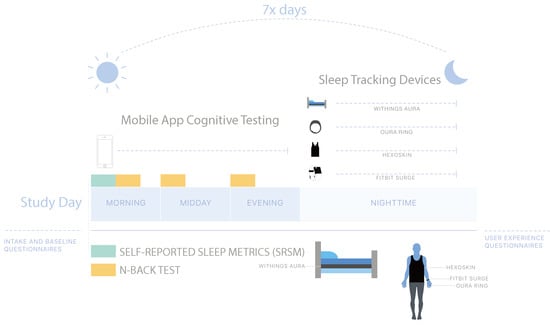
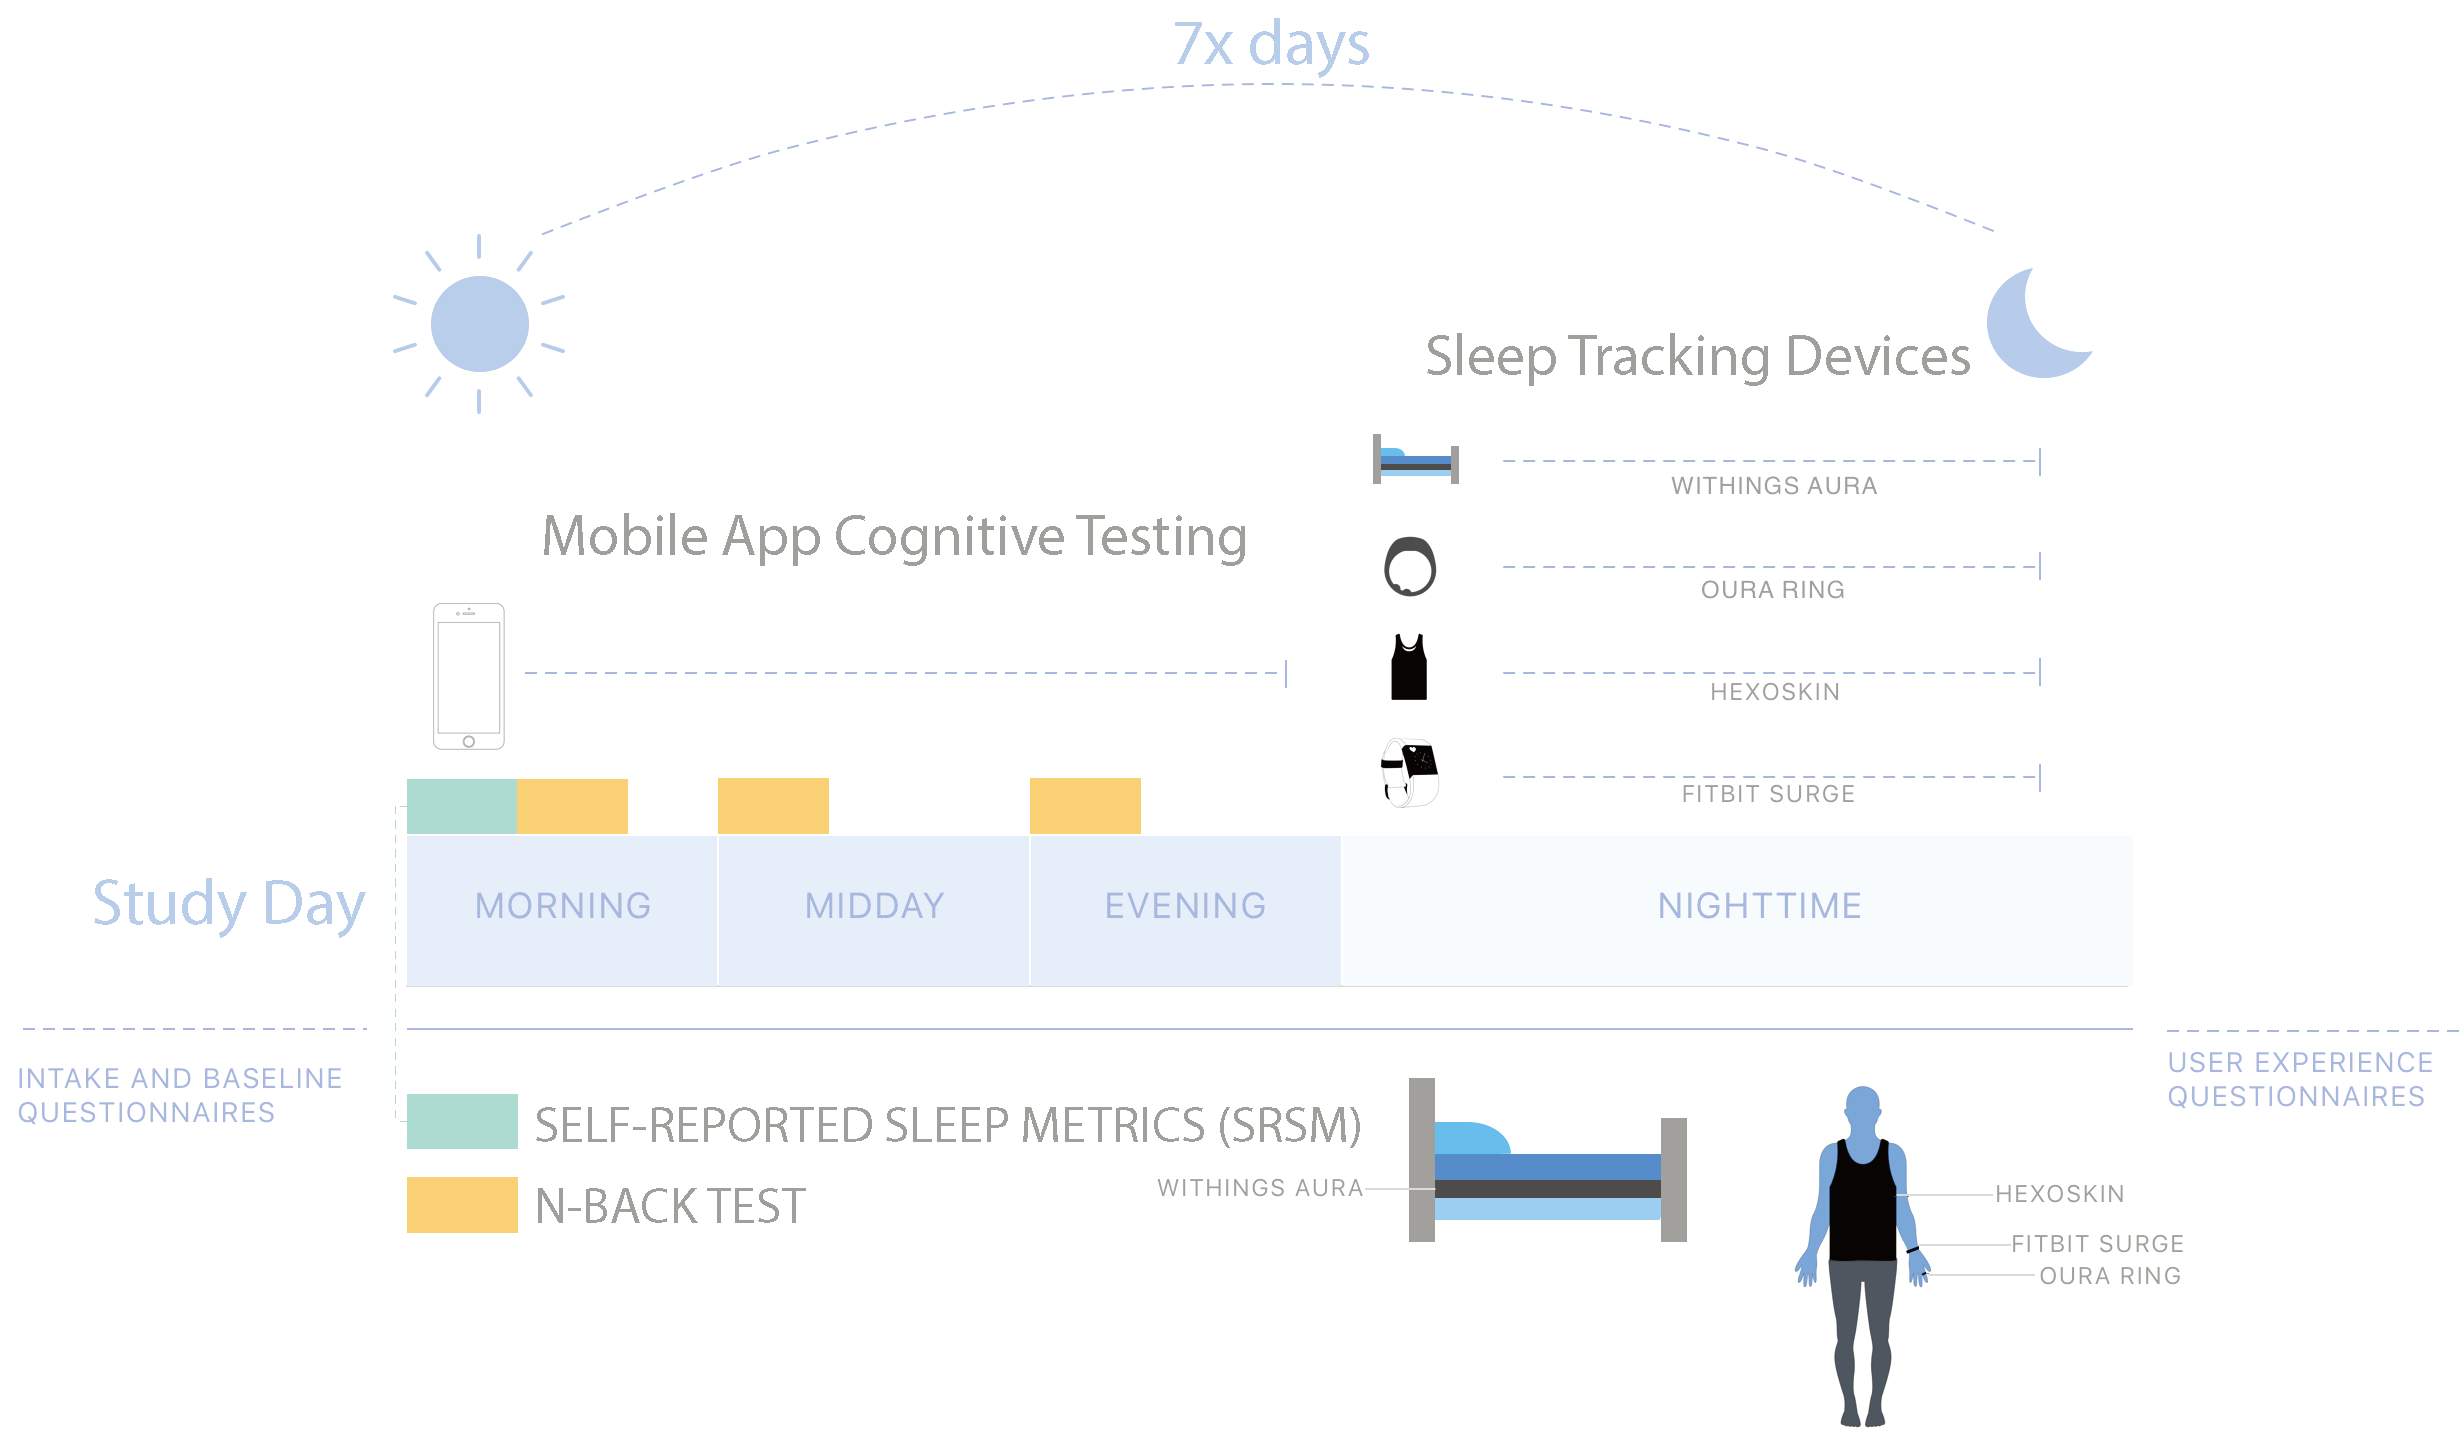
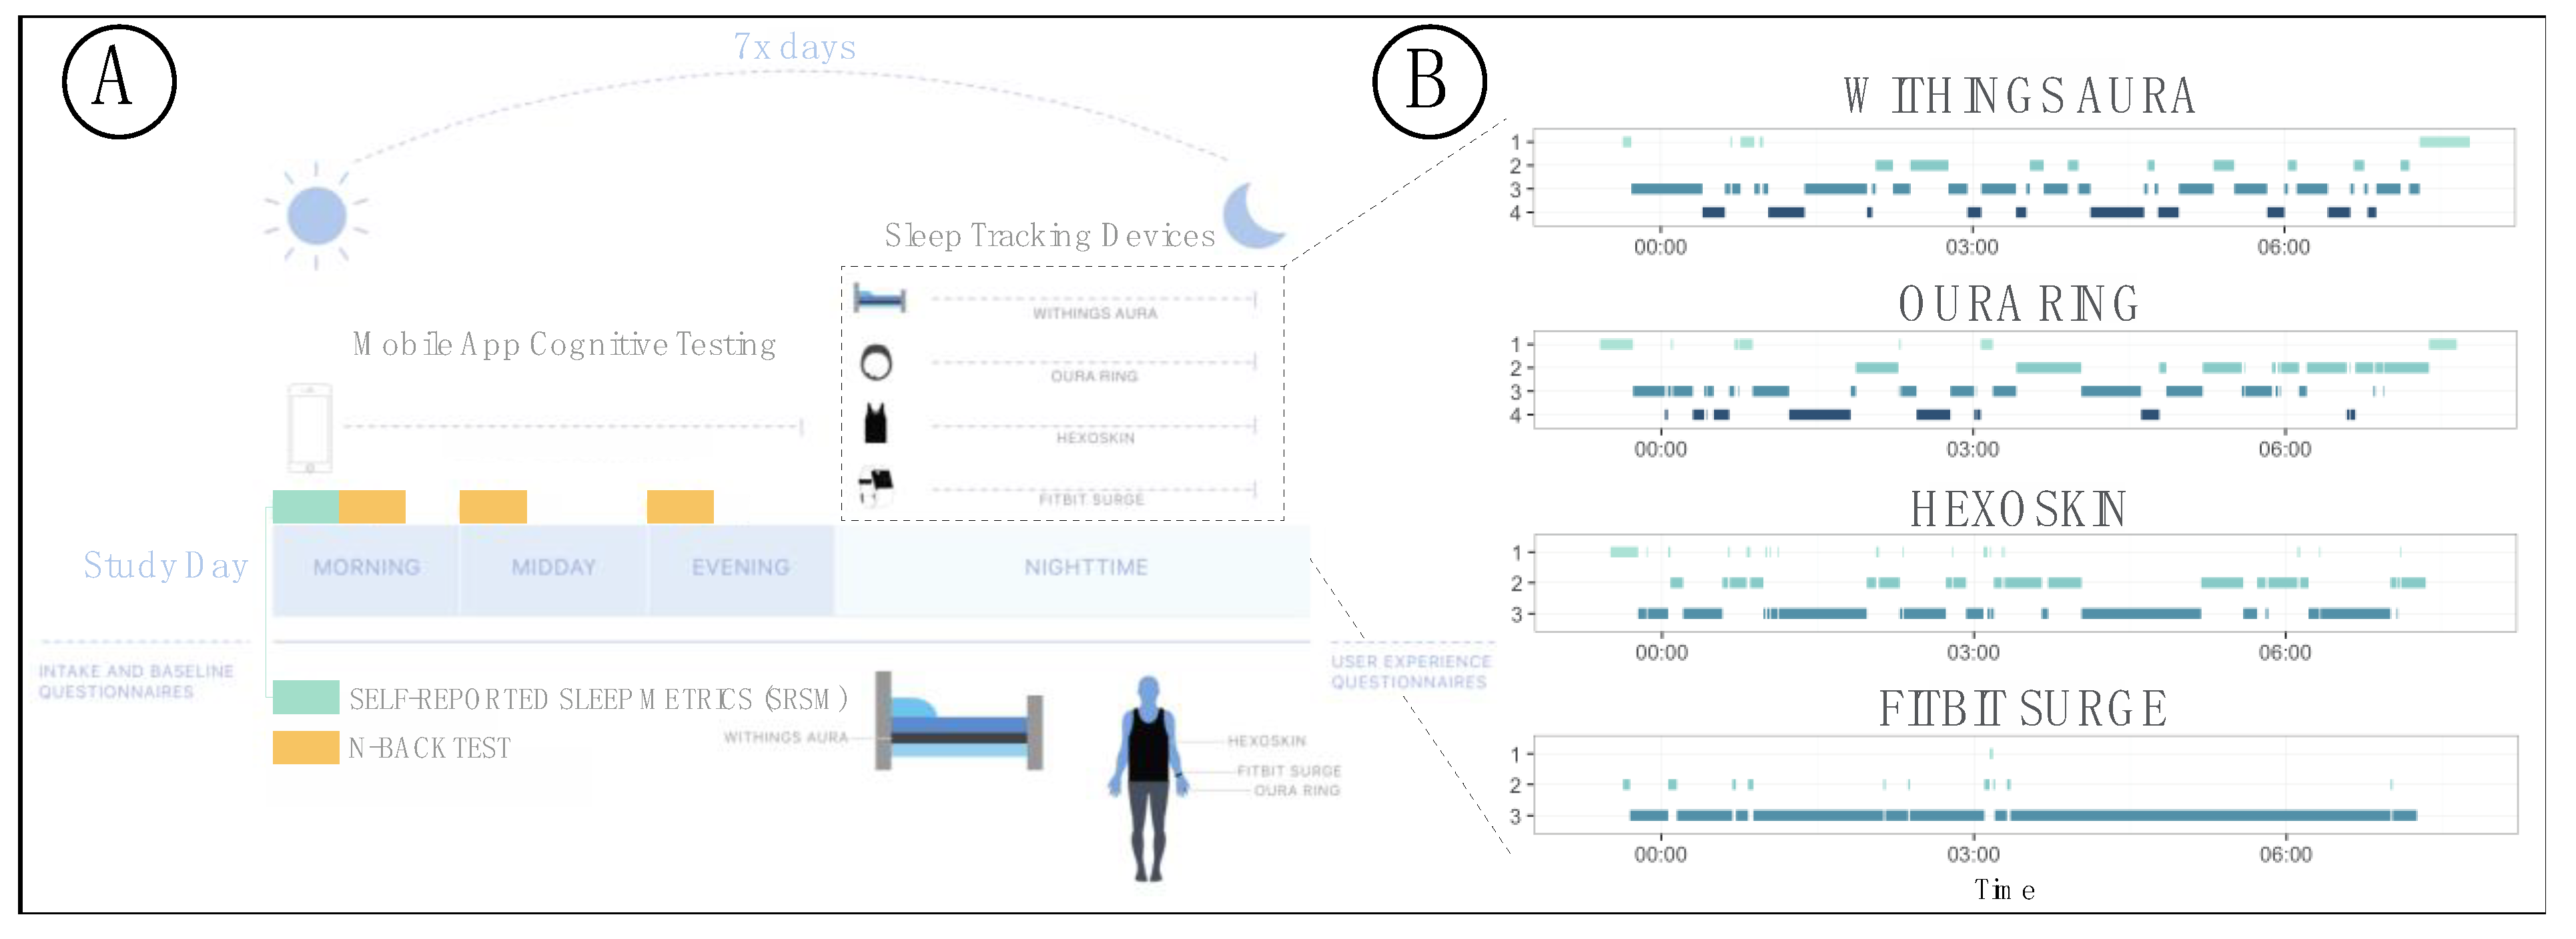
3.6. Sleep Monitoring and Device-Specific Parameters
3.7. Daily Questionnaires and n-Back Tests
3.7.1. n-Back Tests
3.7.2. SRSMs
3.8. n-Back Test Scoring
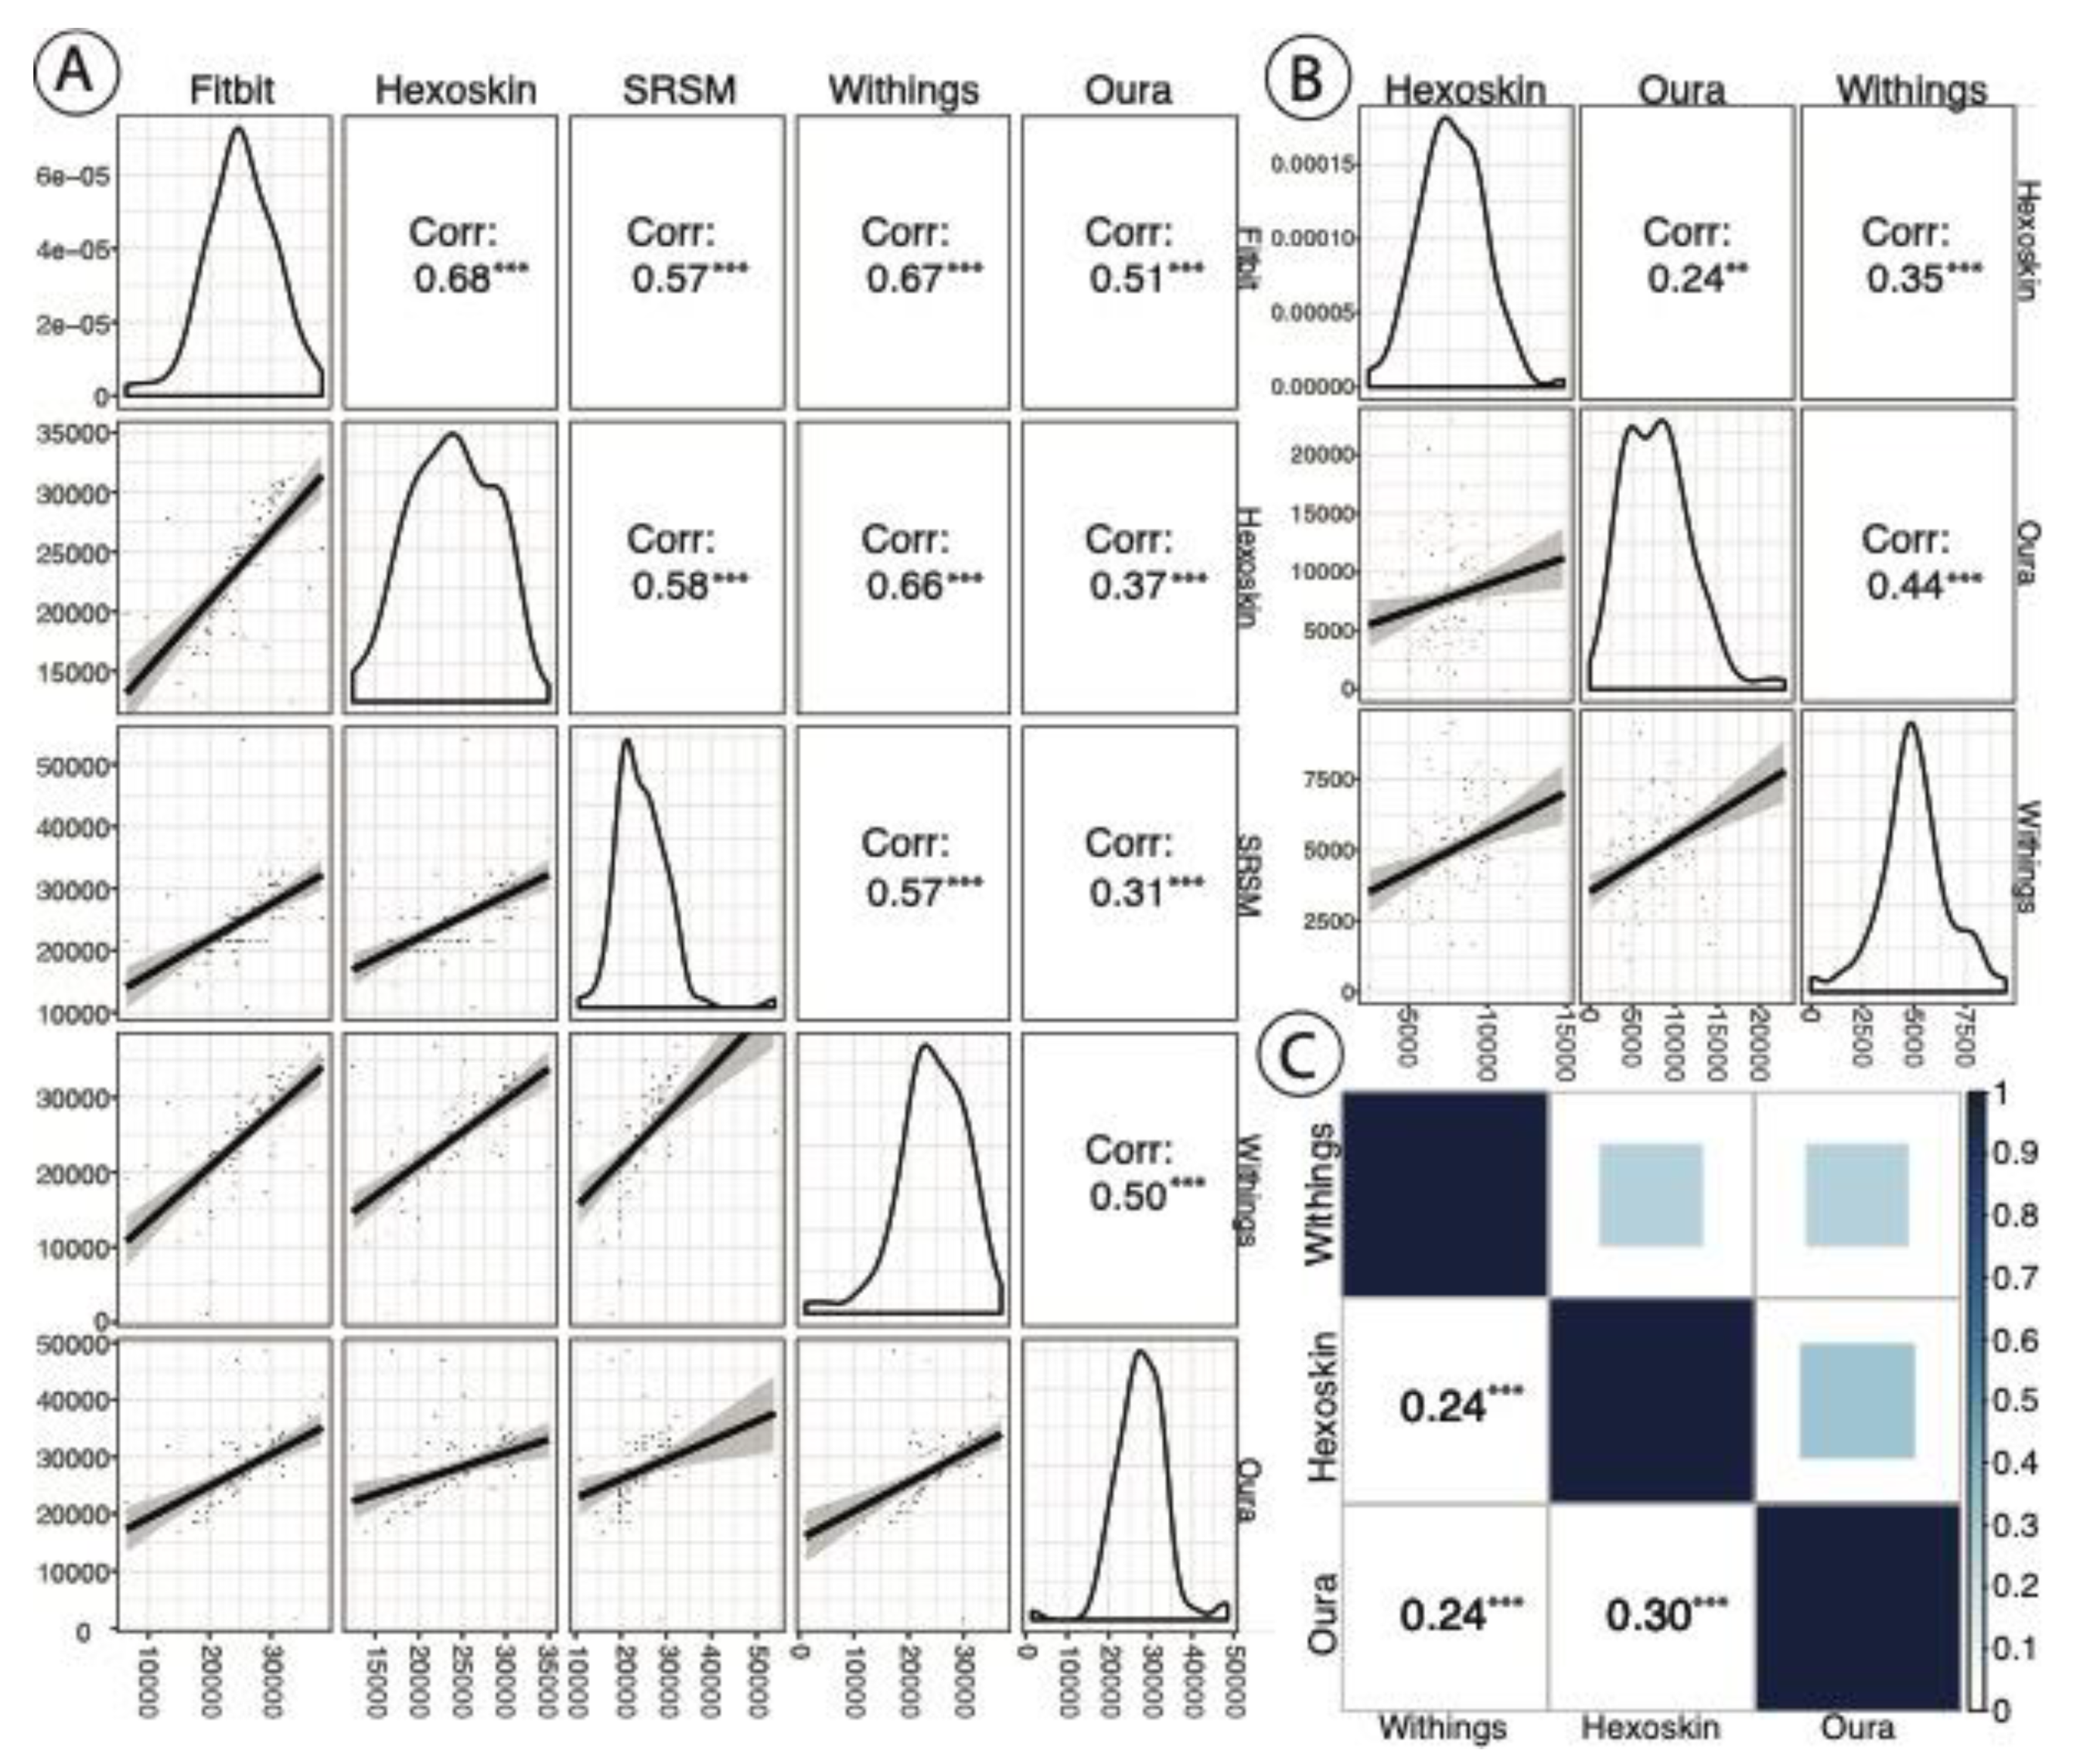
3.9. Inter-Device Comparisons for Sleep Staging and Metrics
3.10. Statistical Models Linking Device Data to PSQI and n-Back Scores
3.11. Analysis of Missing Data
4. Results
4.1. Summary of Study Population
4.2. Inter-Device Comparisons for Sleep Stages and Metrics
4.3. PSQI, Cognitive Scores, and SRSMs vs. Device Data
4.4. Cognitive Scores vs. Participant Summary Data
4.5. Correlation between MEQ Preference and Cognitive Test Response Rates
5. Discussion
5.1. Study Limitations
5.2. Considerations Related to Cognitive Metrics and Self-Reported Sleep Quality Indices
6. Conclusions
Supplementary Materials
Author Contributions
Funding
Acknowledgments
Conflicts of Interest
References
- National Center on Sleep Disorders Research. National Institutes of Health Sleep Disorders Research Plan; National Institutes of Health: Bethesda, MD, USA, 2011. [Google Scholar]
- Liu, Y.; Wheaton, A.G.; Chapman, D.P.; Cunningham, T.J.; Lu, H.; Croft, J.B. Prevalence of Healthy Sleep Duration among Adults—United States, 2014. MMWR Morb. Mortal. Wkly. Rep. 2016, 65, 137–141. [Google Scholar] [CrossRef] [PubMed]
- Shan, Z.; Ma, H.; Xie, M.; Yan, P.; Guo, Y.; Bao, W.; Rong, Y.; Jackson, C.L.; Hu, F.B.; Liu, L. Sleep duration and risk of type 2 diabetes: A meta-analysis of prospective studies. Diabetes Care 2015, 38, 529–537. [Google Scholar] [CrossRef]
- Huang, T.; Redline, S. Cross-sectional and Prospective Associations of Actigraphy-Assessed Sleep Regularity With Metabolic Abnormalities: The Multi-Ethnic Study of Atherosclerosis. Diabetes Care 2019, 42, 1422–1429. [Google Scholar] [CrossRef] [PubMed]
- Sanchez-de-la-Torre, M.; Campos-Rodriguez, F.; Barbe, F. Obstructive sleep apnoea and cardiovascular disease. Lancet Respir. Med. 2013, 1, 61–72. [Google Scholar] [CrossRef]
- Liu, R.Q.; Qian, Z.; Trevathan, E.; Chang, J.J.; Zelicoff, A.; Hao, Y.T.; Lin, S.; Dong, G.H. Poor sleep quality associated with high risk of hypertension and elevated blood pressure in China: Results from a large population-based study. Hypertens Res. 2016, 39, 54–59. [Google Scholar] [CrossRef] [PubMed]
- Chastin, S.F.; Palarea-Albaladejo, J.; Dontje, M.L.; Skelton, D.A. Combined Effects of Time Spent in Physical Activity, Sedentary Behaviors and Sleep on Obesity and Cardio-Metabolic Health Markers: A Novel Compositional Data Analysis Approach. PLoS ONE 2015, 10, e0139984. [Google Scholar] [CrossRef]
- Alvaro, P.K.; Roberts, R.M.; Harris, J.K. A Systematic Review Assessing Bidirectionality between Sleep Disturbances, Anxiety, and Depression. Sleep 2013, 36, 1059–1068. [Google Scholar] [CrossRef]
- Hafner, M.; Stepanek, M.; Taylor, J.; Troxel, W.M.; van Stolk, C. Why Sleep Matters-The Economic Costs of Insufficient Sleep: A Cross-Country Comparative Analysis. Rand Health Q. 2017, 6, 11. [Google Scholar]
- O’Connor, C.; Thornley, K.S.; Hanly, P.J. Gender Differences in the Polysomnographic Features of Obstructive Sleep Apnea. Am. J. Respir. Crit. Care Med. 2000, 161, 1465–1472. [Google Scholar] [CrossRef]
- Redline, S.; Tishler, P.V.; Hans, M.G.; Tosteson, T.D.; Strohl, K.P.; Spry, K. Racial differences in sleep-disordered breathing in African-Americans and Caucasians. Am. J. Respir. Crit. Care Med. 1997, 155, 186–192. [Google Scholar] [CrossRef]
- Kiley, J.P.; Twery, M.J.; Gibbons, G.H. The National Center on Sleep Disorders Research—Progress and promise. Sleep 2019, 42. [Google Scholar] [CrossRef] [PubMed]
- Newell, J.; Mairesse, O.; Verbanck, P.; Neu, D. Is a one-night stay in the lab really enough to conclude? First-night effect and night-to-night variability in polysomnographic recordings among different clinical population samples. Psychiatry Res. 2012, 200, 795–801. [Google Scholar] [CrossRef] [PubMed]
- Means, M.K.; Edinger, J.D.; Glenn, D.M.; Fins, A.I. Accuracy of sleep perceptions among insomnia sufferers and normal sleepers. Sleep Med. 2003, 4, 285–296. [Google Scholar] [CrossRef]
- Fry, J.M.; DiPhillipo, M.A.; Curran, K.; Goldberg, R.; Baran, A.S. Full Polysomnography in the Home. Sleep 1998, 21, 635–642. [Google Scholar] [CrossRef] [PubMed][Green Version]
- Peake, J.M.; Kerr, G.; Sullivan, J.P. A Critical Review of Consumer Wearables, Mobile Applications, and Equipment for Providing Biofeedback, Monitoring Stress, and Sleep in Physically Active Populations. Front. Physiol. 2018, 9. [Google Scholar] [CrossRef] [PubMed]
- Bianchi, M.T. Sleep devices: Wearables and nearables, informational and interventional, consumer and clinical. Metabolism 2018, 84, 99–108. [Google Scholar] [CrossRef]
- de Zambotti, M.; Goldstone, A.; Claudatos, S.; Colrain, I.M.; Baker, F.C. A validation study of Fitbit Charge 2™ compared with polysomnography in adults. Chronobiol. Int. 2018, 35, 465–476. [Google Scholar] [CrossRef]
- de Zambotti, M.; Rosas, L.; Colrain, I.M.; Baker, F.C. The Sleep of the Ring: Comparison of the ŌURA Sleep Tracker Against Polysomnography. Behav. Sleep Med. 2019, 17, 124–136. [Google Scholar] [CrossRef]
- de Zambotti, M.; Claudatos, S.; Inkelis, S.; Colrain, I.M.; Baker, F.C. Evaluation of a consumer fitness-tracking device to assess sleep in adults. Chronobiol. Int. 2015, 32, 1024–1028. [Google Scholar] [CrossRef]
- Meltzer, L.J.; Hiruma, L.S.; Avis, K.; Montgomery-Downs, H.; Valentin, J. Comparison of a Commercial Accelerometer with Polysomnography and Actigraphy in Children and Adolescents. Sleep 2015, 38, 1323–1330. [Google Scholar] [CrossRef]
- Montgomery-Downs, H.E.; Insana, S.P.; Bond, J.A. Movement toward a novel activity monitoring device. Sleep Breath. 2012, 16, 913–917. [Google Scholar] [CrossRef] [PubMed]
- Liu, W.; Ploderer, B.; Hoang, T. In Bed with Technology: Challenges and Opportunities for Sleep Tracking. In Proceedings of the Annual Meeting of the Australian Special Interest Group for Computer Human Interaction, Parkville, Australia, 7–10 December 2015; pp. 142–151. [Google Scholar]
- Piwek, L.; Ellis, D.A.; Andrews, S.; Joinson, A. The Rise of Consumer Health Wearables: Promises and Barriers. PLoS Med. 2016, 13, e1001953. [Google Scholar] [CrossRef] [PubMed]
- Murakami, H.; Kawakami, R.; Nakae, S.; Nakata, Y.; Ishikawa-Takata, K.; Tanaka, S.; Miyachi, M. Accuracy of Wearable Devices for Estimating Total Energy Expenditure: Comparison with Metabolic Chamber and Doubly Labeled Water Method. JAMA Intern. Med. 2016, 176, 702–703. [Google Scholar] [CrossRef] [PubMed]
- Xie, J.; Wen, D.; Liang, L.; Jia, Y.; Gao, L.; Lei, J. Evaluating the Validity of Current Mainstream Wearable Devices in Fitness Tracking Under Various Physical Activities: Comparative Study. JMIR Mhealth Uhealth 2018, 6, e94. [Google Scholar] [CrossRef] [PubMed]
- Lee, J.-M.; Byun, W.; Keill, A.; Dinkel, D.; Seo, Y. Comparison of Wearable Trackers’ Ability to Estimate Sleep. Int. J. Environ. Res. Public Health 2018, 15, 1265. [Google Scholar] [CrossRef] [PubMed]
- Rosvold, H.E.; Mirsky, A.F.; Sarason, I.; Bransome Jr, E.D.; Beck, L.H. A continuous performance test of brain damage. J. Consult. Psychol. 1956, 20, 343. [Google Scholar] [CrossRef]
- Buysse, D.J.; Hall, M.L.; Strollo, P.J.; Kamarck, T.W.; Owens, J.; Lee, L.; Reis, S.E.; Matthews, K.A. Relationships between the Pittsburgh Sleep Quality Index (PSQI), Epworth Sleepiness Scale (ESS), and clinical/polysomnographic measures in a community sample. J. Clin. Sleep Med. 2008, 4, 563–571. [Google Scholar] [CrossRef]
- Kane, M.J.; Conway, A.R.A.; Miura, T.K.; Colflesh, G.J.H. Working memory, attention control, and the n-back task: A question of construct validity. J. Exp. Psychol. Learn. Mem. Cognit. 2007, 33, 615–622. [Google Scholar] [CrossRef]
- Killgore, W.D.S. Effects of sleep deprivation on cognition. Prog. Brain Res. 2010, 185, 105–129. [Google Scholar]
- Perez, M.V.; Mahaffey, K.W.; Hedlin, H.; Rumsfeld, J.S.; Garcia, A.; Ferris, T.; Balasubramanian, V.; Russo, A.M.; Rajmane, A.; Cheung, L. Large-scale assessment of a smartwatch to identify atrial fibrillation. N. Engl. J. Med. 2019, 381, 1909–1917. [Google Scholar] [CrossRef]
- Miotto, R.; Danieletto, M.; Scelza, J.R.; Kidd, B.A.; Dudley, J.T. Reflecting health: Smart mirrors for personalized medicine. NPJ Digit. Med. 2018, 1, 1–7. [Google Scholar] [CrossRef] [PubMed]


| ID | Gender | Age | PSQI | MEQ | SF-36 Scores | |||||||
|---|---|---|---|---|---|---|---|---|---|---|---|---|
| Physical Functioning | Role Limitations (Physical) | Role Limitations (Emotional) | Energy | Emotional Well-Being | Social Functioning | Pain | General Health | |||||
| 1 | F | 23 | 1 | 50 | 100 | 100 | 100.0 | 50 | 68 | 87.5 | 100.0 | 55 |
| 2 | F | 26 | 4 | 47 | 90 | 100 | 66.7 | 45 | 72 | 100.0 | 100.0 | 60 |
| 3 | F | 27 | 5 | 52 | 100 | 100 | 100.0 | 45 | 56 | 87.5 | 90.0 | 50 |
| 4 | F | 27 | 2 | 36 | 100 | 100 | 100.0 | 65 | 80 | 75.0 | 100.0 | 55 |
| 5 | F | 27 | 4 | 58 | 100 | 100 | 100.0 | 50 | 76 | 87.5 | 90.0 | 55 |
| 6 | F | 28 | 3 | 52 | 100 | 100 | 100.0 | 55 | 76 | 75.0 | 100.0 | 60 |
| 7 | F | 28 | 3 | 40 | 90 | 100 | 33.3 | 50 | 72 | 87.5 | 67.5 | 55 |
| 8 | F | 29 | 12 | 35 | 100 | 100 | 0 | 15 | 36 | 50.0 | 67.5 | 55 |
| 9 | F | 31 | 4 | 49 | 95 | 100 | 100.0 | 60 | 84 | 100.0 | 100.0 | 55 |
| 10 | F | 39 | 4 | 49 | 60 | 50 | 100.0 | 45 | 44 | 87.5 | 77.5 | 55 |
| 11 | F | 41 | 5 | 53 | 100 | 100 | 100.0 | 95 | 96 | 100.0 | 100.0 | 60 |
| 12 | M | 25 | 10 | 55 | 100 | 100 | 66.7 | 85 | 76 | 100.0 | 100.0 | 60 |
| 13 | M | 29 | 5 | 52 | 100 | 100 | 100.0 | 50 | 88 | 100.0 | 100.0 | 50 |
| 14 | M | 29 | 4 | 41 | 100 | 100 | 100.0 | 50 | 76 | 100.0 | 100.0 | 60 |
| 15 | M | 31 | 3 | 56 | 95 | 100 | 100.0 | 65 | 80 | 75.0 | 90.0 | 50 |
| 16 | M | 34 | 12 | 73 | 100 | 100 | 66.7 | 50 | 52 | 62.5 | 100.0 | 55 |
| 17 | M | 35 | 6 | 52 | 100 | 100 | 100.0 | 75 | 80 | 100.0 | 100.0 | 50 |
| 18 | M | 37 | 3 | 61 | 90 | 100 | 66.7 | 50 | 80 | 87.5 | 90.0 | 55 |
| 19 | M | 39 | 8 | 72 | 100 | 100 | 100.0 | 80 | 88 | 100.0 | 100.0 | 55 |
| 20 | M | 41 | 6 | 55 | 95 | 100 | 100.0 | 50 | 84 | 100.0 | 80.0 | 55 |
| 21 | M | 41 | 9 | 52 | 95 | 100 | 66.7 | 35 | 52 | 87.5 | 70.0 | 60 |
| MIN | 23 | 1 | 35 | 60 | 50 | 0 | 15 | 36 | 50 | 67.5 | 50 | |
| MEDIAN | 29 | 4 | 52 | 100 | 100 | 100 | 50 | 76 | 87.5 | 100 | 55 | |
| MAX | 41 | 12 | 73 | 100 | 100 | 100 | 95 | 96 | 100 | 100 | 60 | |
| Device | Metric | n | Mean | St. Dev | Min | Pctl (25) | Pctl (75) | Max |
|---|---|---|---|---|---|---|---|---|
| Fitbit | Efficiency | 129 | 94.70 | 15.70 | 31.00 | 94.00 | 97.00 | 193.00 |
| TSD All | 129 | 7.47 | 1.47 | 3.78 | 6.50 | 8.43 | 11.40 | |
| TSD | 129 | 7.58 | 1.58 | 1.78 | 5.98 | 7.93 | 10.75 | |
| Start-End | 129 | 7.58 | 1.73 | 3.78 | 6.50 | 8.48 | 15.87 | |
| Wakeups | 129 | 1.60 | 1.20 | 0.00 | 1.00 | 2.00 | 8.00 | |
| Hexoskin | Efficiency | 114 | 92.40 | 4.40 | 70.30 | 91.10 | 95.30 | 97.80 |
| TSD | 114 | 6.72 | 1.31 | 3.45 | 5.78 | 7.81 | 9.69 | |
| Start-End | 135 | 7.57 | 1.42 | 3.93 | 6.57 | 8.58 | 11.43 | |
| REM | 123 | 2.15 | 0.57 | 0.69 | 1.77 | 2.53 | 4.12 | |
| Latency | 114 | 0.29 | 0.26 | 0.07 | 0.12 | 0.38 | 1.56 | |
| Oura | Efficiency | 127 | 89.70 | 14.40 | 24.00 | 84.00 | 93.00 | 164.00 |
| TSD | 128 | 7.69 | 1.72 | 0.42 | 6.73 | 8.75 | 13.48 | |
| Start-End | 130 | 10.67 | 11.63 | 4.62 | 6.97 | 9.55 | 117.60 | |
| REM | 127 | 2.17 | 1.11 | 0.00 | 1.29 | 2.81 | 6.38 | |
| Deep | 127 | 1.12 | 0.58 | 0.00 | 0.73 | 1.44 | 2.58 | |
| Wakeups | 127 | 2.40 | 1.90 | 0.00 | 1.00 | 4.00 | 7.00 | |
| Latency | 127 | 0.26 | 0.25 | 0.01 | 0.11 | 0.30 | 1.58 | |
| Withings | Efficiency | 141 | 84.10 | 20.50 | 20.50 | 74.80 | 90.10 | 179.80 |
| TSD All | 141 | 8.99 | 2.89 | 0.53 | 7.45 | 10.12 | 27.03 | |
| TSD | 141 | 6.97 | 1.75 | 0.33 | 5.95 | 8.15 | 10.97 | |
| Start-End | 141 | 9.30 | 4.45 | 0.42 | 7.08 | 9.73 | 34.55 | |
| REM | 141 | 1.40 | 0.46 | 0.00 | 1.15 | 1.67 | 2.63 | |
| Deep | 141 | 1.74 | 0.58 | 0.00 | 1.42 | 2.15 | 3.67 | |
| Light | 141 | 3.83 | 0.98 | 0.33 | 3.22 | 4.45 | 6.03 | |
| Wakeups | 141 | 2.40 | 2.60 | 0.00 | 0.00 | 3.00 | 13.00 | |
| Latency | 141 | 0.32 | 0.36 | 0.00 | 0.08 | 0.42 | 2.37 | |
| Wakeup Duration | 141 | 1.38 | 2.14 | 0.03 | 0.53 | 1.50 | 17.48 | |
| SRSMs | Start-End | 122 | 7.34 | 1.45 | 4.50 | 6.35 | 8.24 | 12.33 |
| TSD | 122 | 6.91 | 1.56 | 3.00 | 6.00 | 7.78 | 15.00 | |
| Latency | 122 | 0.24 | 0.23 | 0.02 | 0.08 | 0.33 | 2.00 |
| PSQI | Cognitive scores (p Value) | |||||||
|---|---|---|---|---|---|---|---|---|
| Device | Feature | Coefficient | Std. Error | p-Value | R2 | Morning | Afternoon | Evening |
| Fitbit | TSD | −0.273 | 0.544 | 0.622 | 0.014 | 0.825 | 0.511 | 0.610 |
| Wakeups | 1.570 | 1.005 | 0.136 | 0.119 | 0.329 | 0.672 | 0.857 | |
| Withings | TSD | −0.125 | 0.498 | 0.804 | 0.004 | 0.110 | 0.497 | 0.409 |
| Latency | −2.080 | 2.83 | 0.472 | 0.0291 | 0.869 | 0.016 ** | 0.013 ** | |
| Efficiency | 0.010 | 0.060 | 0.869 | 0.002 | 0.315 | 0.148 | 0.194 | |
| Wakeups | 0.352 | 0.427 | 0.421 | 0.036 | 0.888 | 0.361 | 0.378 | |
| REM | 0.260 | 1.962 | 0.896 | 0.001 | 0.342 | 0.617 | 0.557 | |
| Oura | TSD | −1.004 | 0.305 | 0.004 *** | 0.376 | 0.265 | 0.197 | 0.221 |
| Latency | −7.311 | 4.445 | 0.117 | 0.131 | 0.366 | 0.499 | 0.563 | |
| Efficiency | −0.092 | 0.040 | 0.033 ** | 0.228 | 0.285 | 0.332 | 0.301 | |
| Wakeups | 0.168 | 0.491 | 0.736 | 0.006 | 0.226 | 0.184 | 0.289 | |
| REM | −0.526 | 0.715 | 0.471 | 0.029 | 0.656 | 0.732 | 0.713 | |
| Hexoskin | TSD | 0.187 | 0.702 | 0.793 | 0.004 | 0.206 | 0.289 | 0.235 |
| Latency | 1.249 | 4.444 | 0.782 | 0.004 | 0.995 | 0.481 | 0.718 | |
| Efficiency | −0.226 | 0.272 | 0.417 | 0.037 | 0.530 | 0.527 | 0.798 | |
| REM | 0.397 | 1.833 | 0.831 | 0.003 | 0.128 | 0.186 | 0.180 | |
| SRSM | TSD | −0.725 | 0.558 | 0.210 | 0.086 | 0.725 | 0.361 | 0.273 |
| Latency | 1.846 | 4.033 | 0.653 | 0.012 | 0.935 | 0.210 | 0.261 | |
| Observations | 20 | 16 | 19 | 18 | ||||
| Cognitive Scores (p Value) | |||
|---|---|---|---|
| Feature | Morning | Afternoon | Evening |
| PSQI | 0.531 | 0.083 * | 0.057 ** |
| MEQ | 0.529 | 0.057 | 0.120 |
| Emotional Role Limitations | 0.665 | 0.005 *** | 0.003 *** |
| Energy | 0.700 | 0.018 ** | 0.010 *** |
| General Health | 0.769 | 0.823 | 0.961 |
| Physical | 0.014 ** | 0.745 | 0.597 |
| Social | 0.170 | 0.004 *** | 0.002 *** |
| Well-being | 0.078 * | 0.005 *** | 0.001 *** |
| Observations | 16 | 19 | 18 |
© 2020 by the authors. Licensee MDPI, Basel, Switzerland. This article is an open access article distributed under the terms and conditions of the Creative Commons Attribution (CC BY) license (http://creativecommons.org/licenses/by/4.0/).
Share and Cite
Chaudhry, F.F.; Danieletto, M.; Golden, E.; Scelza, J.; Botwin, G.; Shervey, M.; De Freitas, J.K.; Paranjpe, I.; Nadkarni, G.N.; Miotto, R.; et al. Sleep in the Natural Environment: A Pilot Study. Sensors 2020, 20, 1378. https://doi.org/10.3390/s20051378
Chaudhry FF, Danieletto M, Golden E, Scelza J, Botwin G, Shervey M, De Freitas JK, Paranjpe I, Nadkarni GN, Miotto R, et al. Sleep in the Natural Environment: A Pilot Study. Sensors. 2020; 20(5):1378. https://doi.org/10.3390/s20051378
Chicago/Turabian StyleChaudhry, Fayzan F., Matteo Danieletto, Eddye Golden, Jerome Scelza, Greg Botwin, Mark Shervey, Jessica K. De Freitas, Ishan Paranjpe, Girish N. Nadkarni, Riccardo Miotto, and et al. 2020. "Sleep in the Natural Environment: A Pilot Study" Sensors 20, no. 5: 1378. https://doi.org/10.3390/s20051378
APA StyleChaudhry, F. F., Danieletto, M., Golden, E., Scelza, J., Botwin, G., Shervey, M., De Freitas, J. K., Paranjpe, I., Nadkarni, G. N., Miotto, R., Glowe, P., Stock, G., Percha, B., Zimmerman, N., Dudley, J. T., & Glicksberg, B. S. (2020). Sleep in the Natural Environment: A Pilot Study. Sensors, 20(5), 1378. https://doi.org/10.3390/s20051378