Structural Damage Localization and Quantification Based on a CEEMDAN Hilbert Transform Neural Network Approach: A Model Steel Truss Bridge Case Study


Abstract
:1. Introduction
1.1. Background
1.2. Motivation
2. Theoretical Background
2.1. Complete Ensemble Empirical Mode Decomposition with Adaptive Noise
- Add E1(wi(t)) (i = 1, 2, …, I), to the initial signal, x(t), where wi, β, and I indicate the ith added white Gaussian noise, the amplitude of the ith added white noise, and ensemble size, respectively:xi(t) = x(t) + β0E1(wi(t))
- Calculate the first IMF () through the first residue (i.e., r1(t)) as follows:where M (·) is the operator that represents the local means of a signal.
- Obtain the second IMF , where , and E2(wi(t)) is the second IMF of EEMD.
- Repeat Step 3 to obtain jth IMF of CEEMDAN wherewhere βj = ε0std[rj(t)] is the signal-noise ratio (SNR).
2.2. Hilbert–Huang Transform (HHT)
2.3. Applications of ANNs
2.4. Damage Indices Based on the CEEMDAN-HT-ANN Model
3. Applications
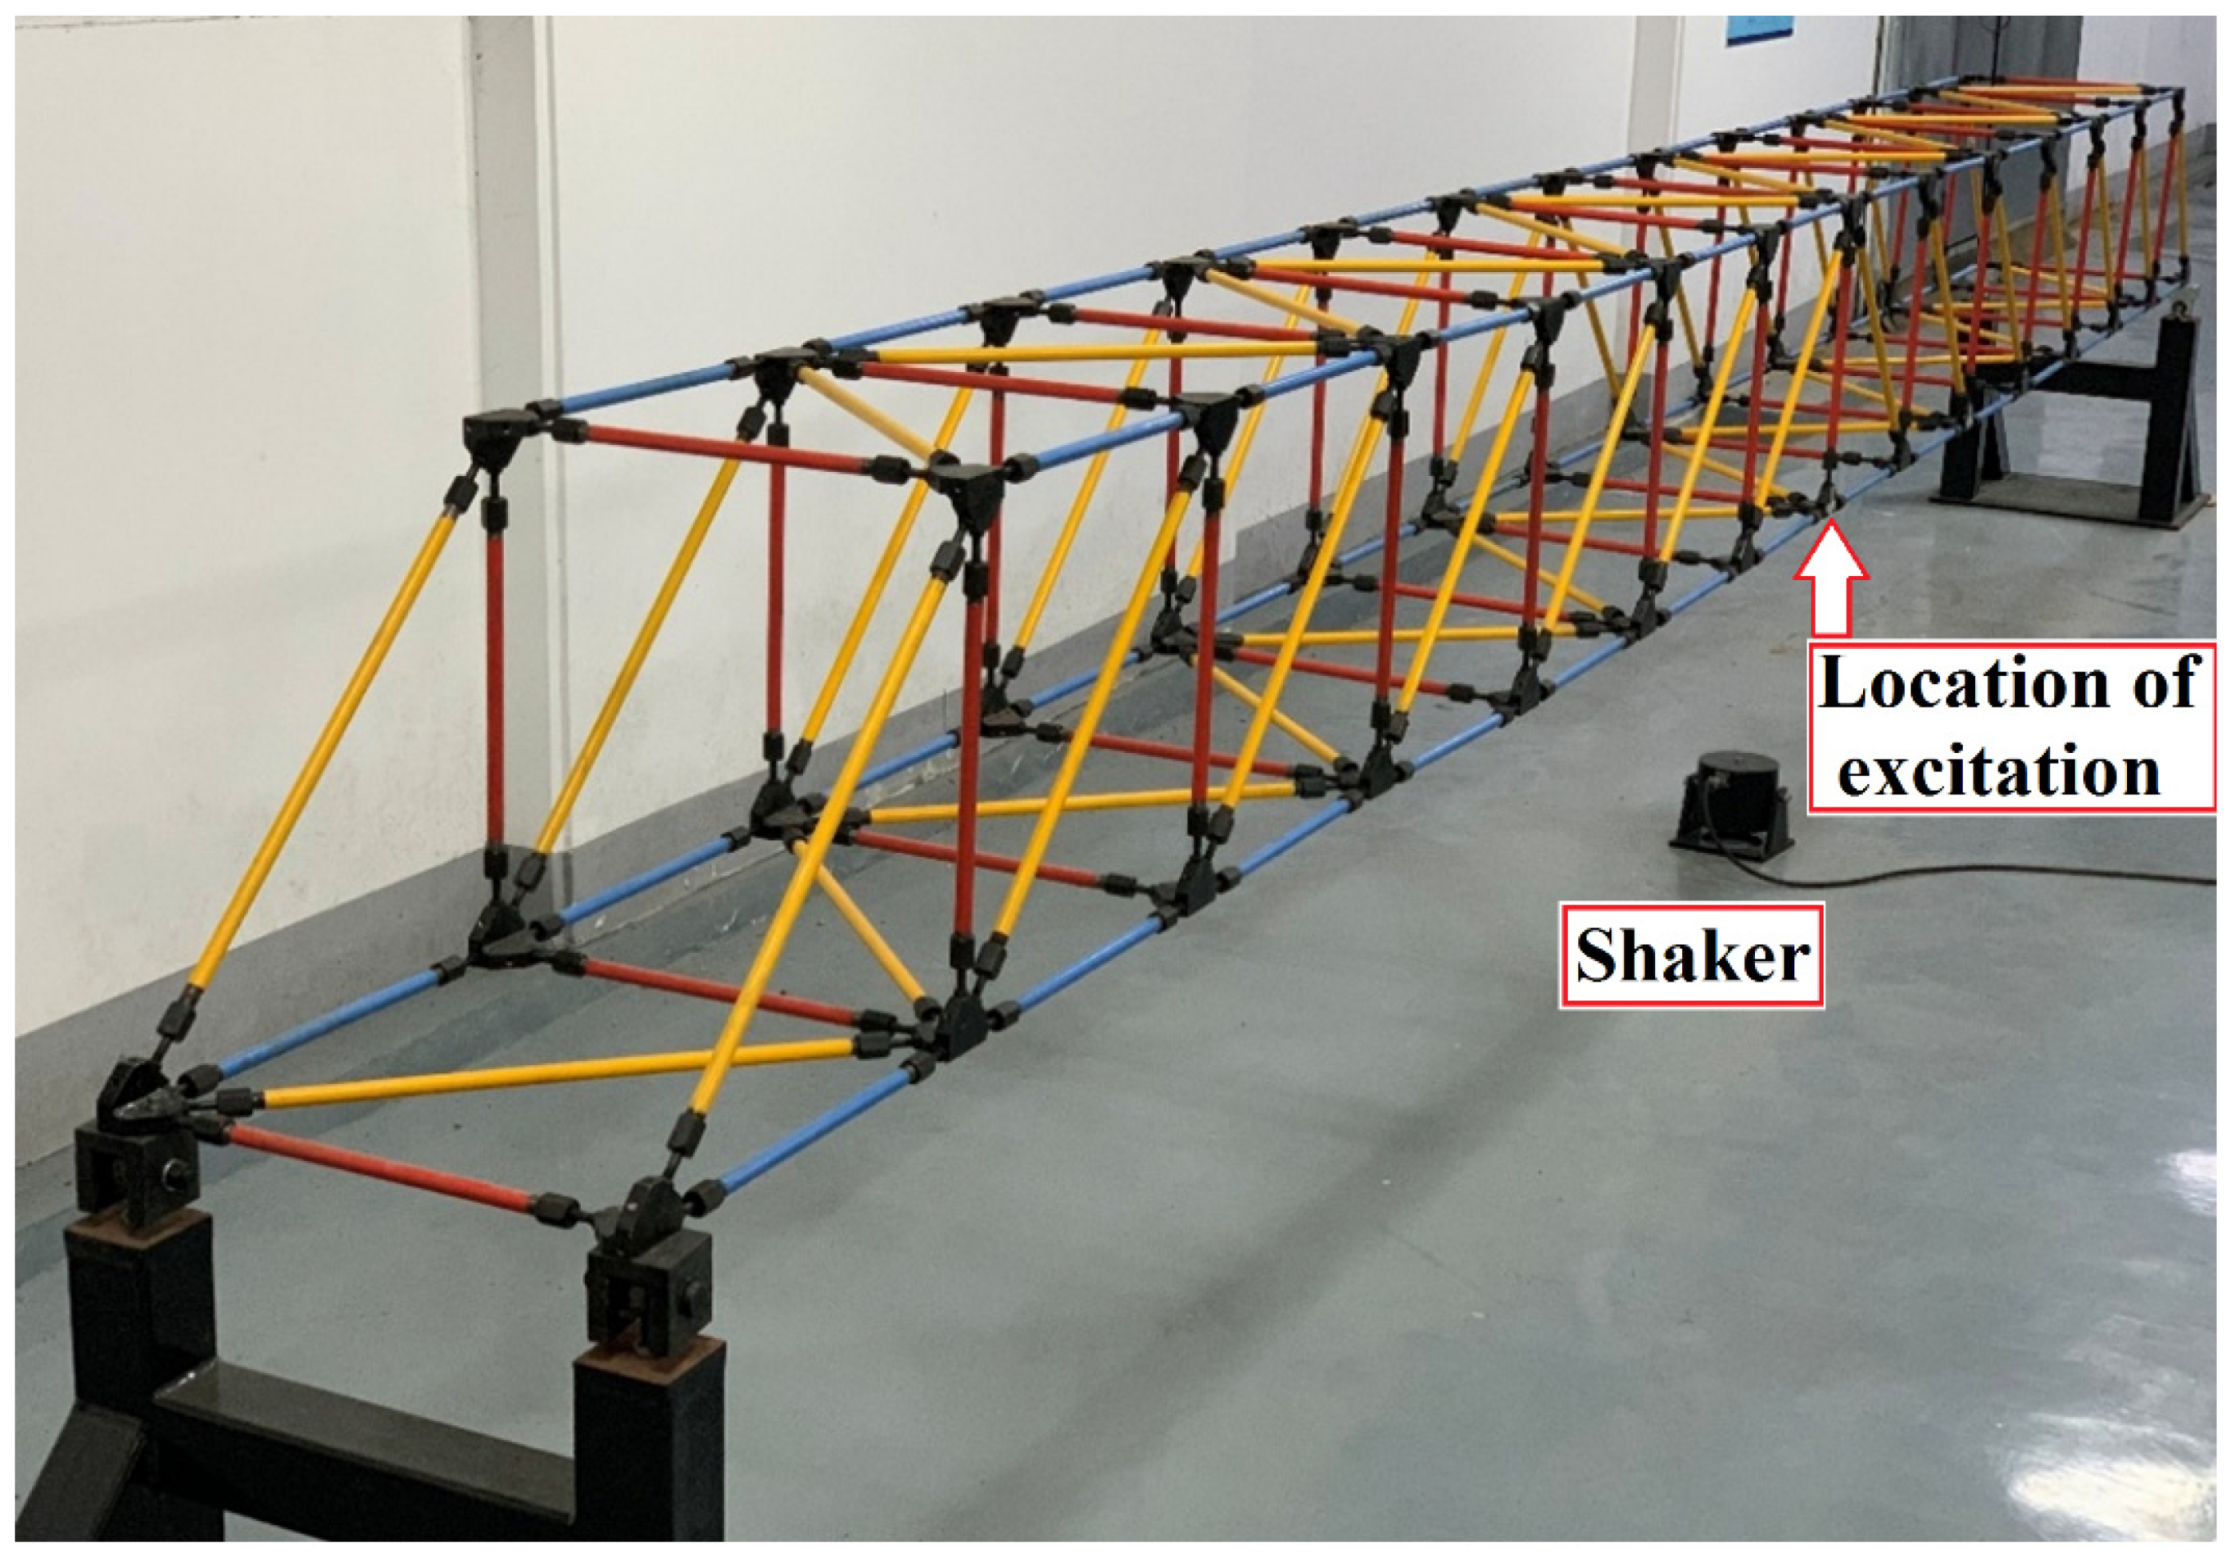
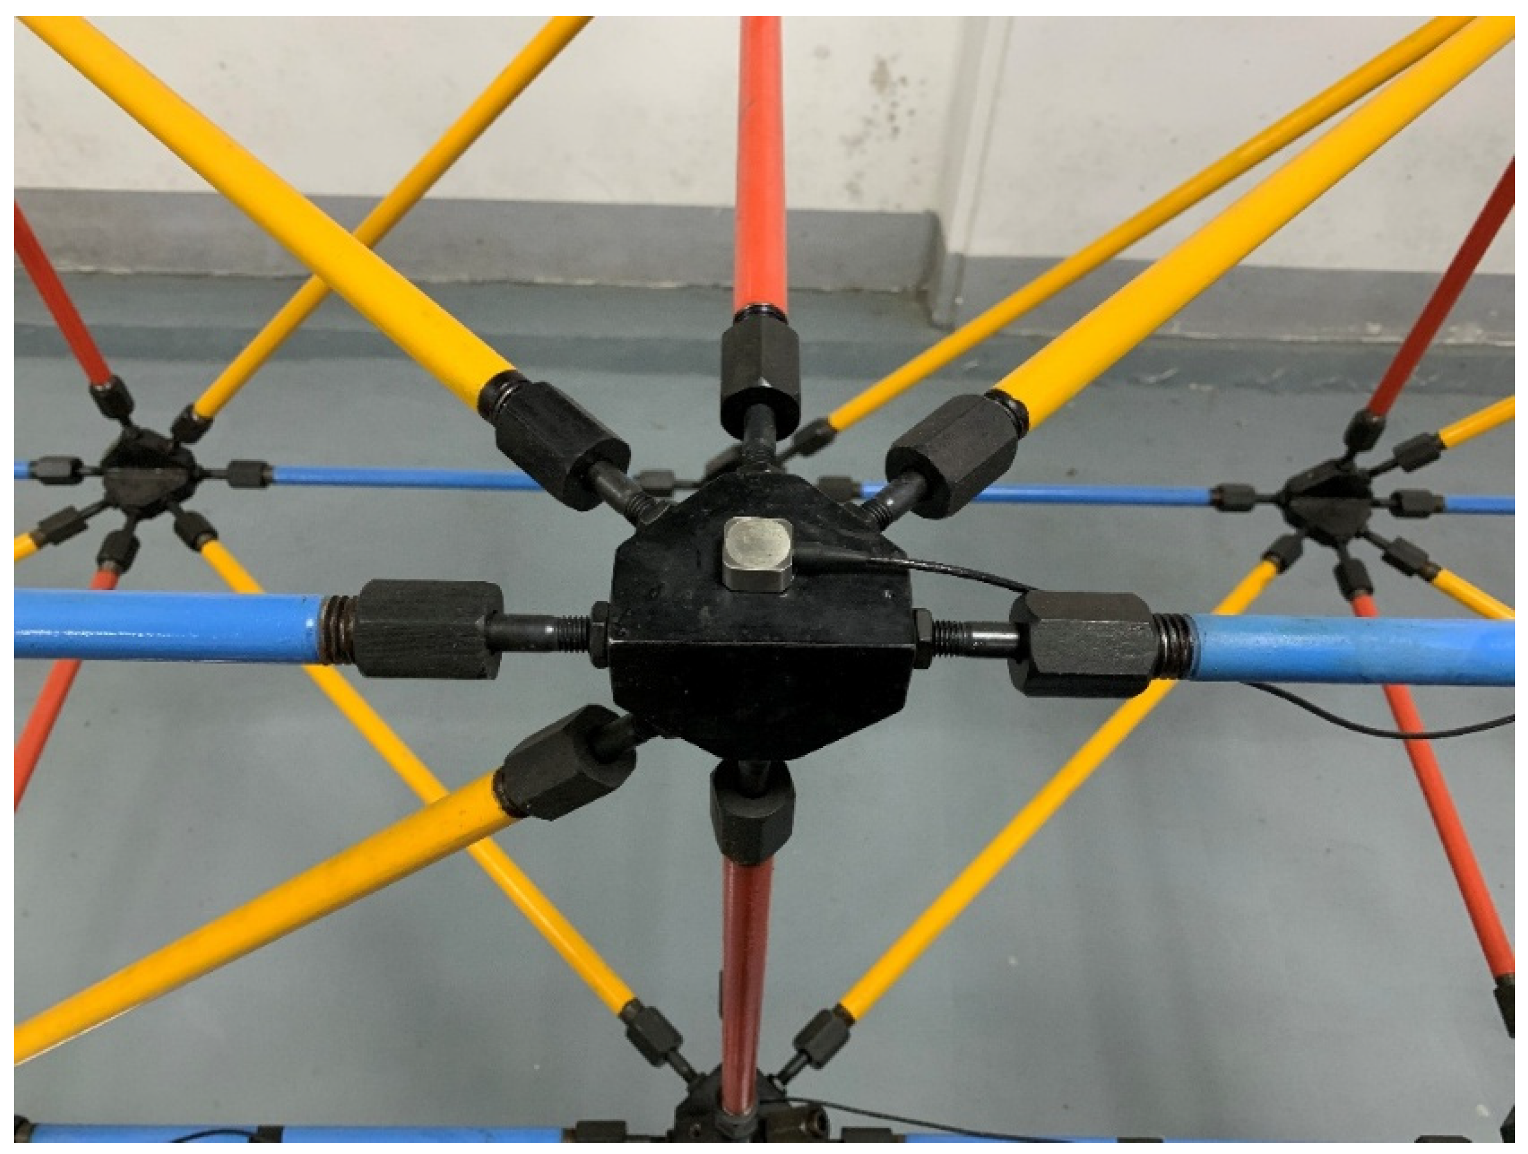
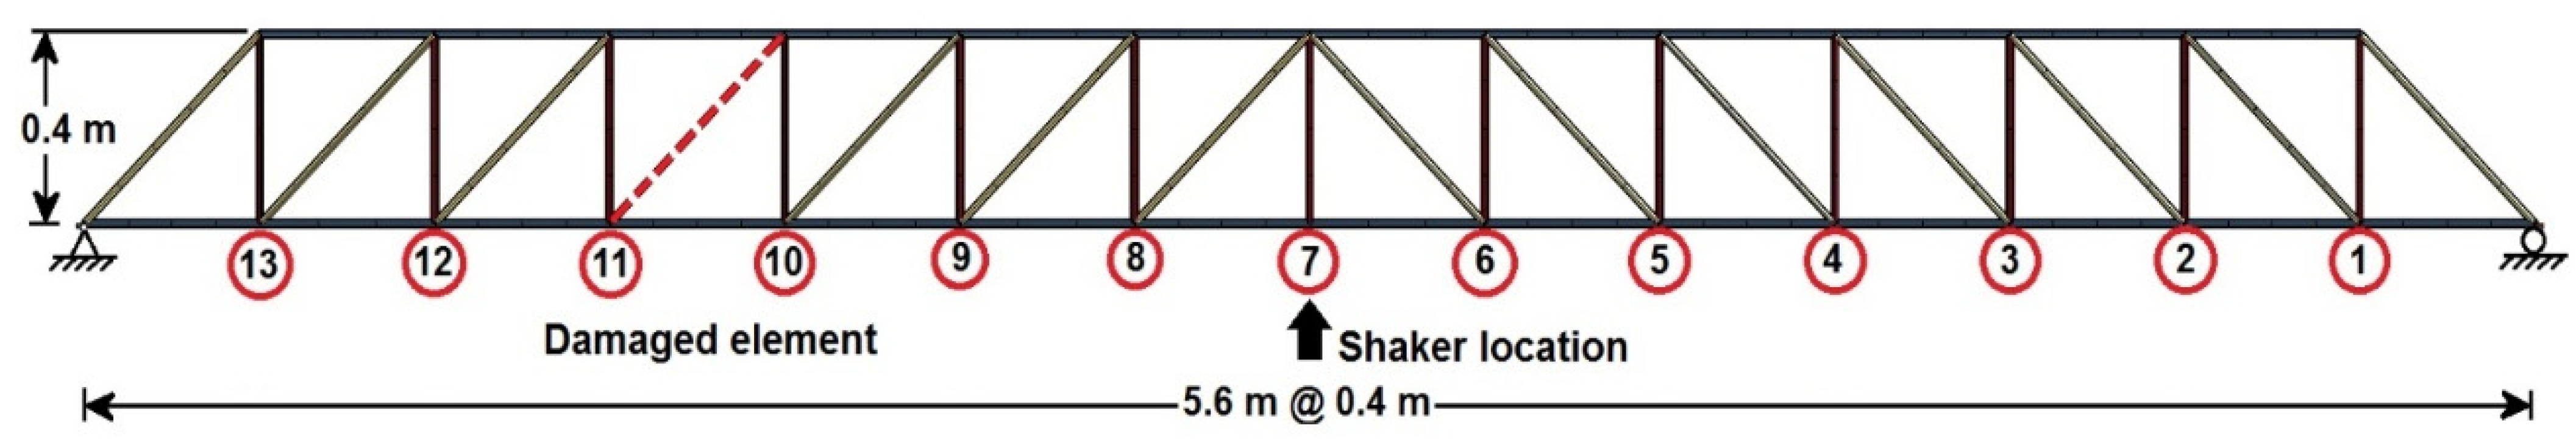
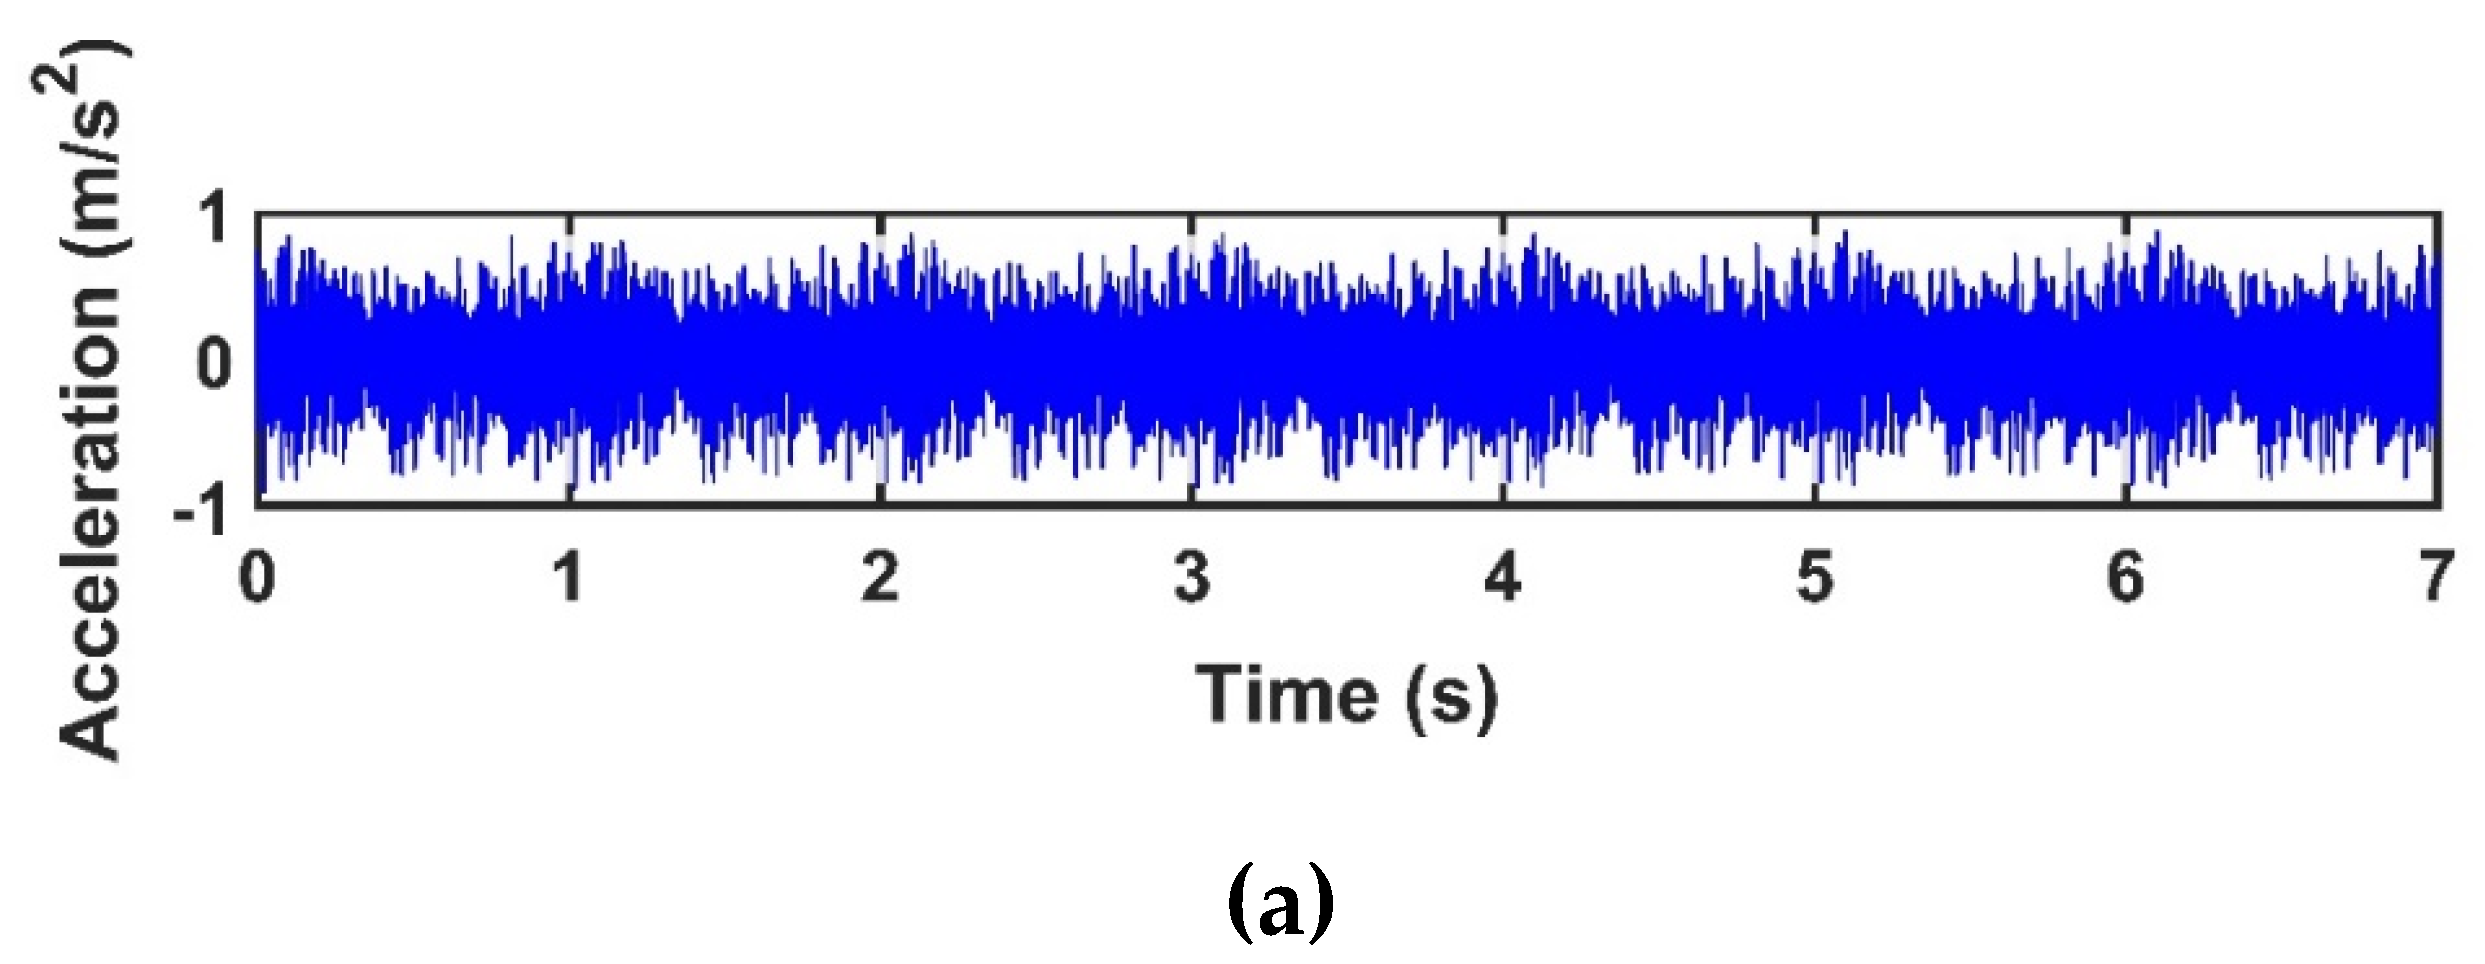
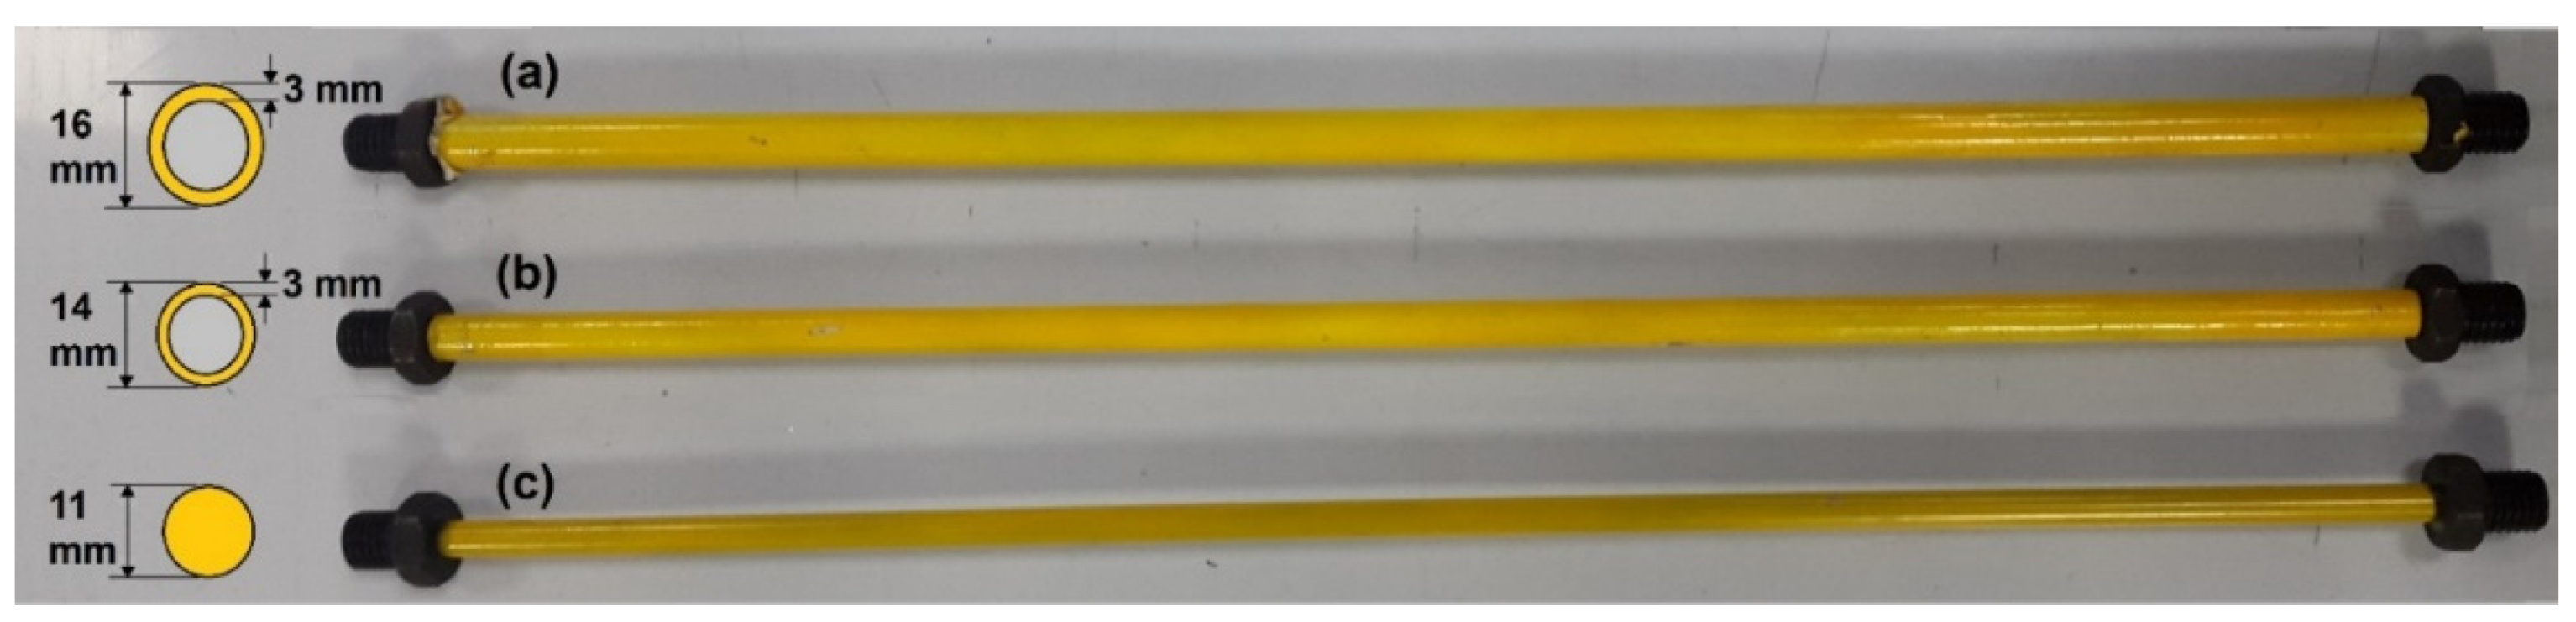
3.1. Experimental Setup
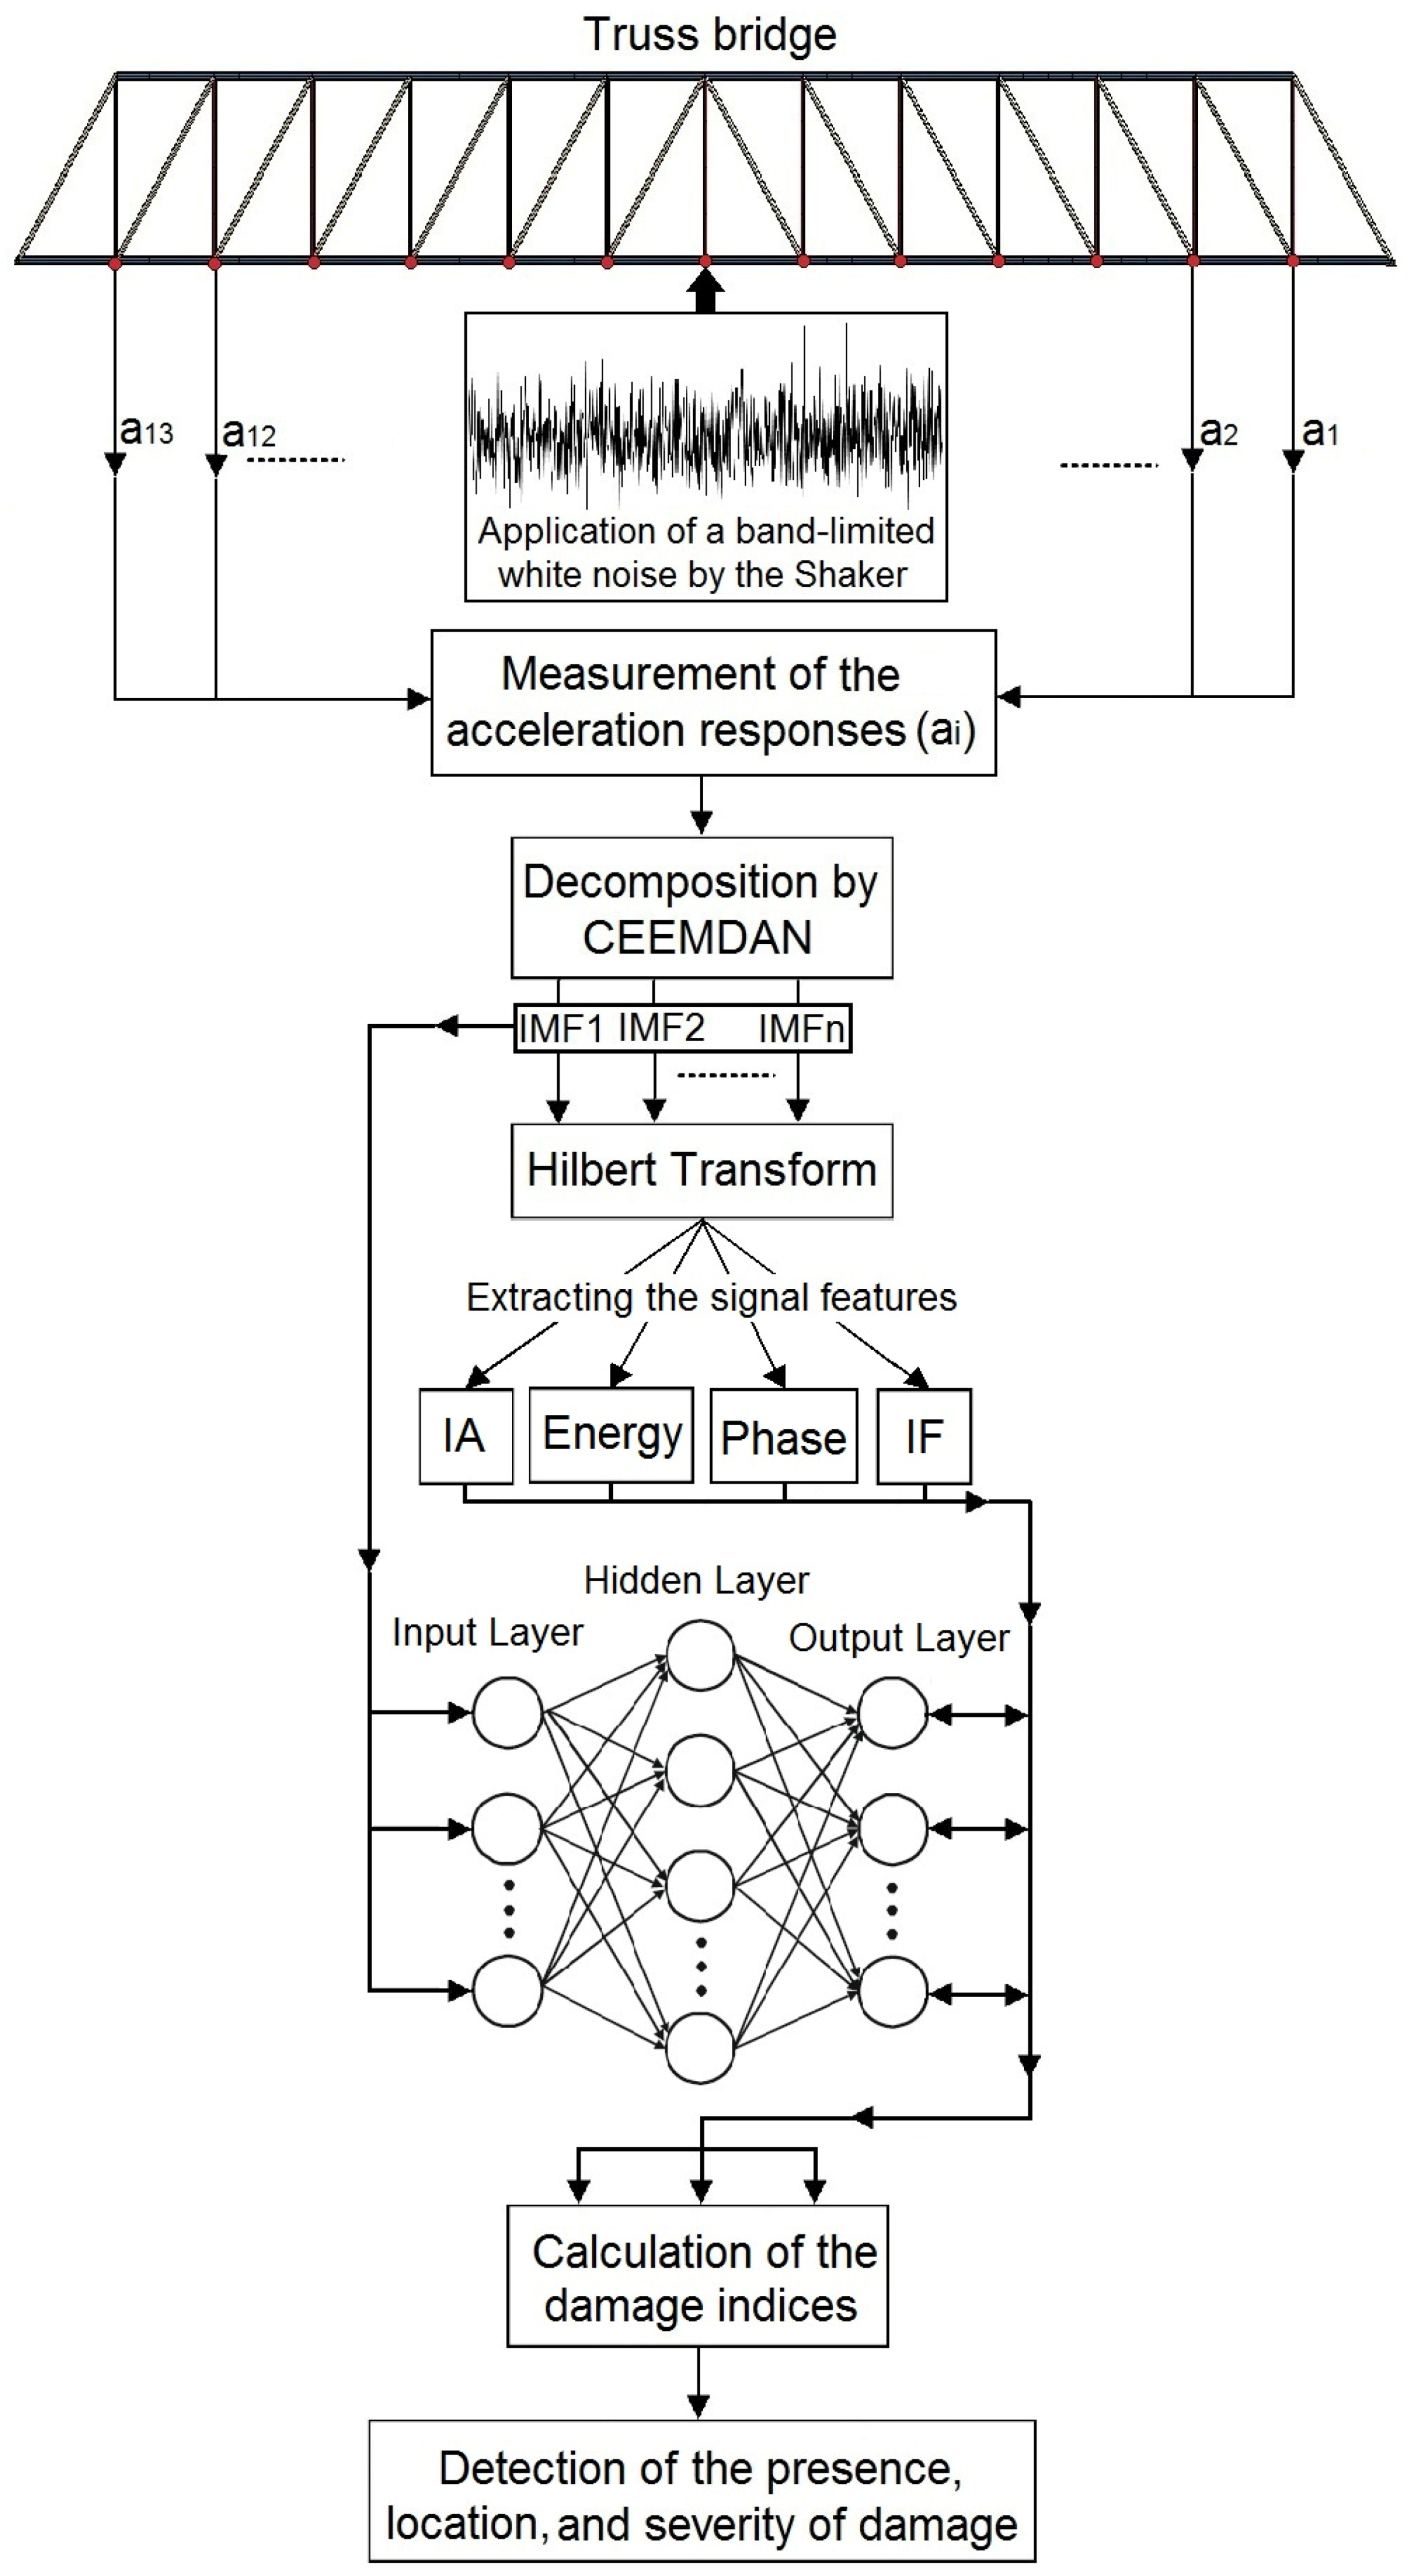
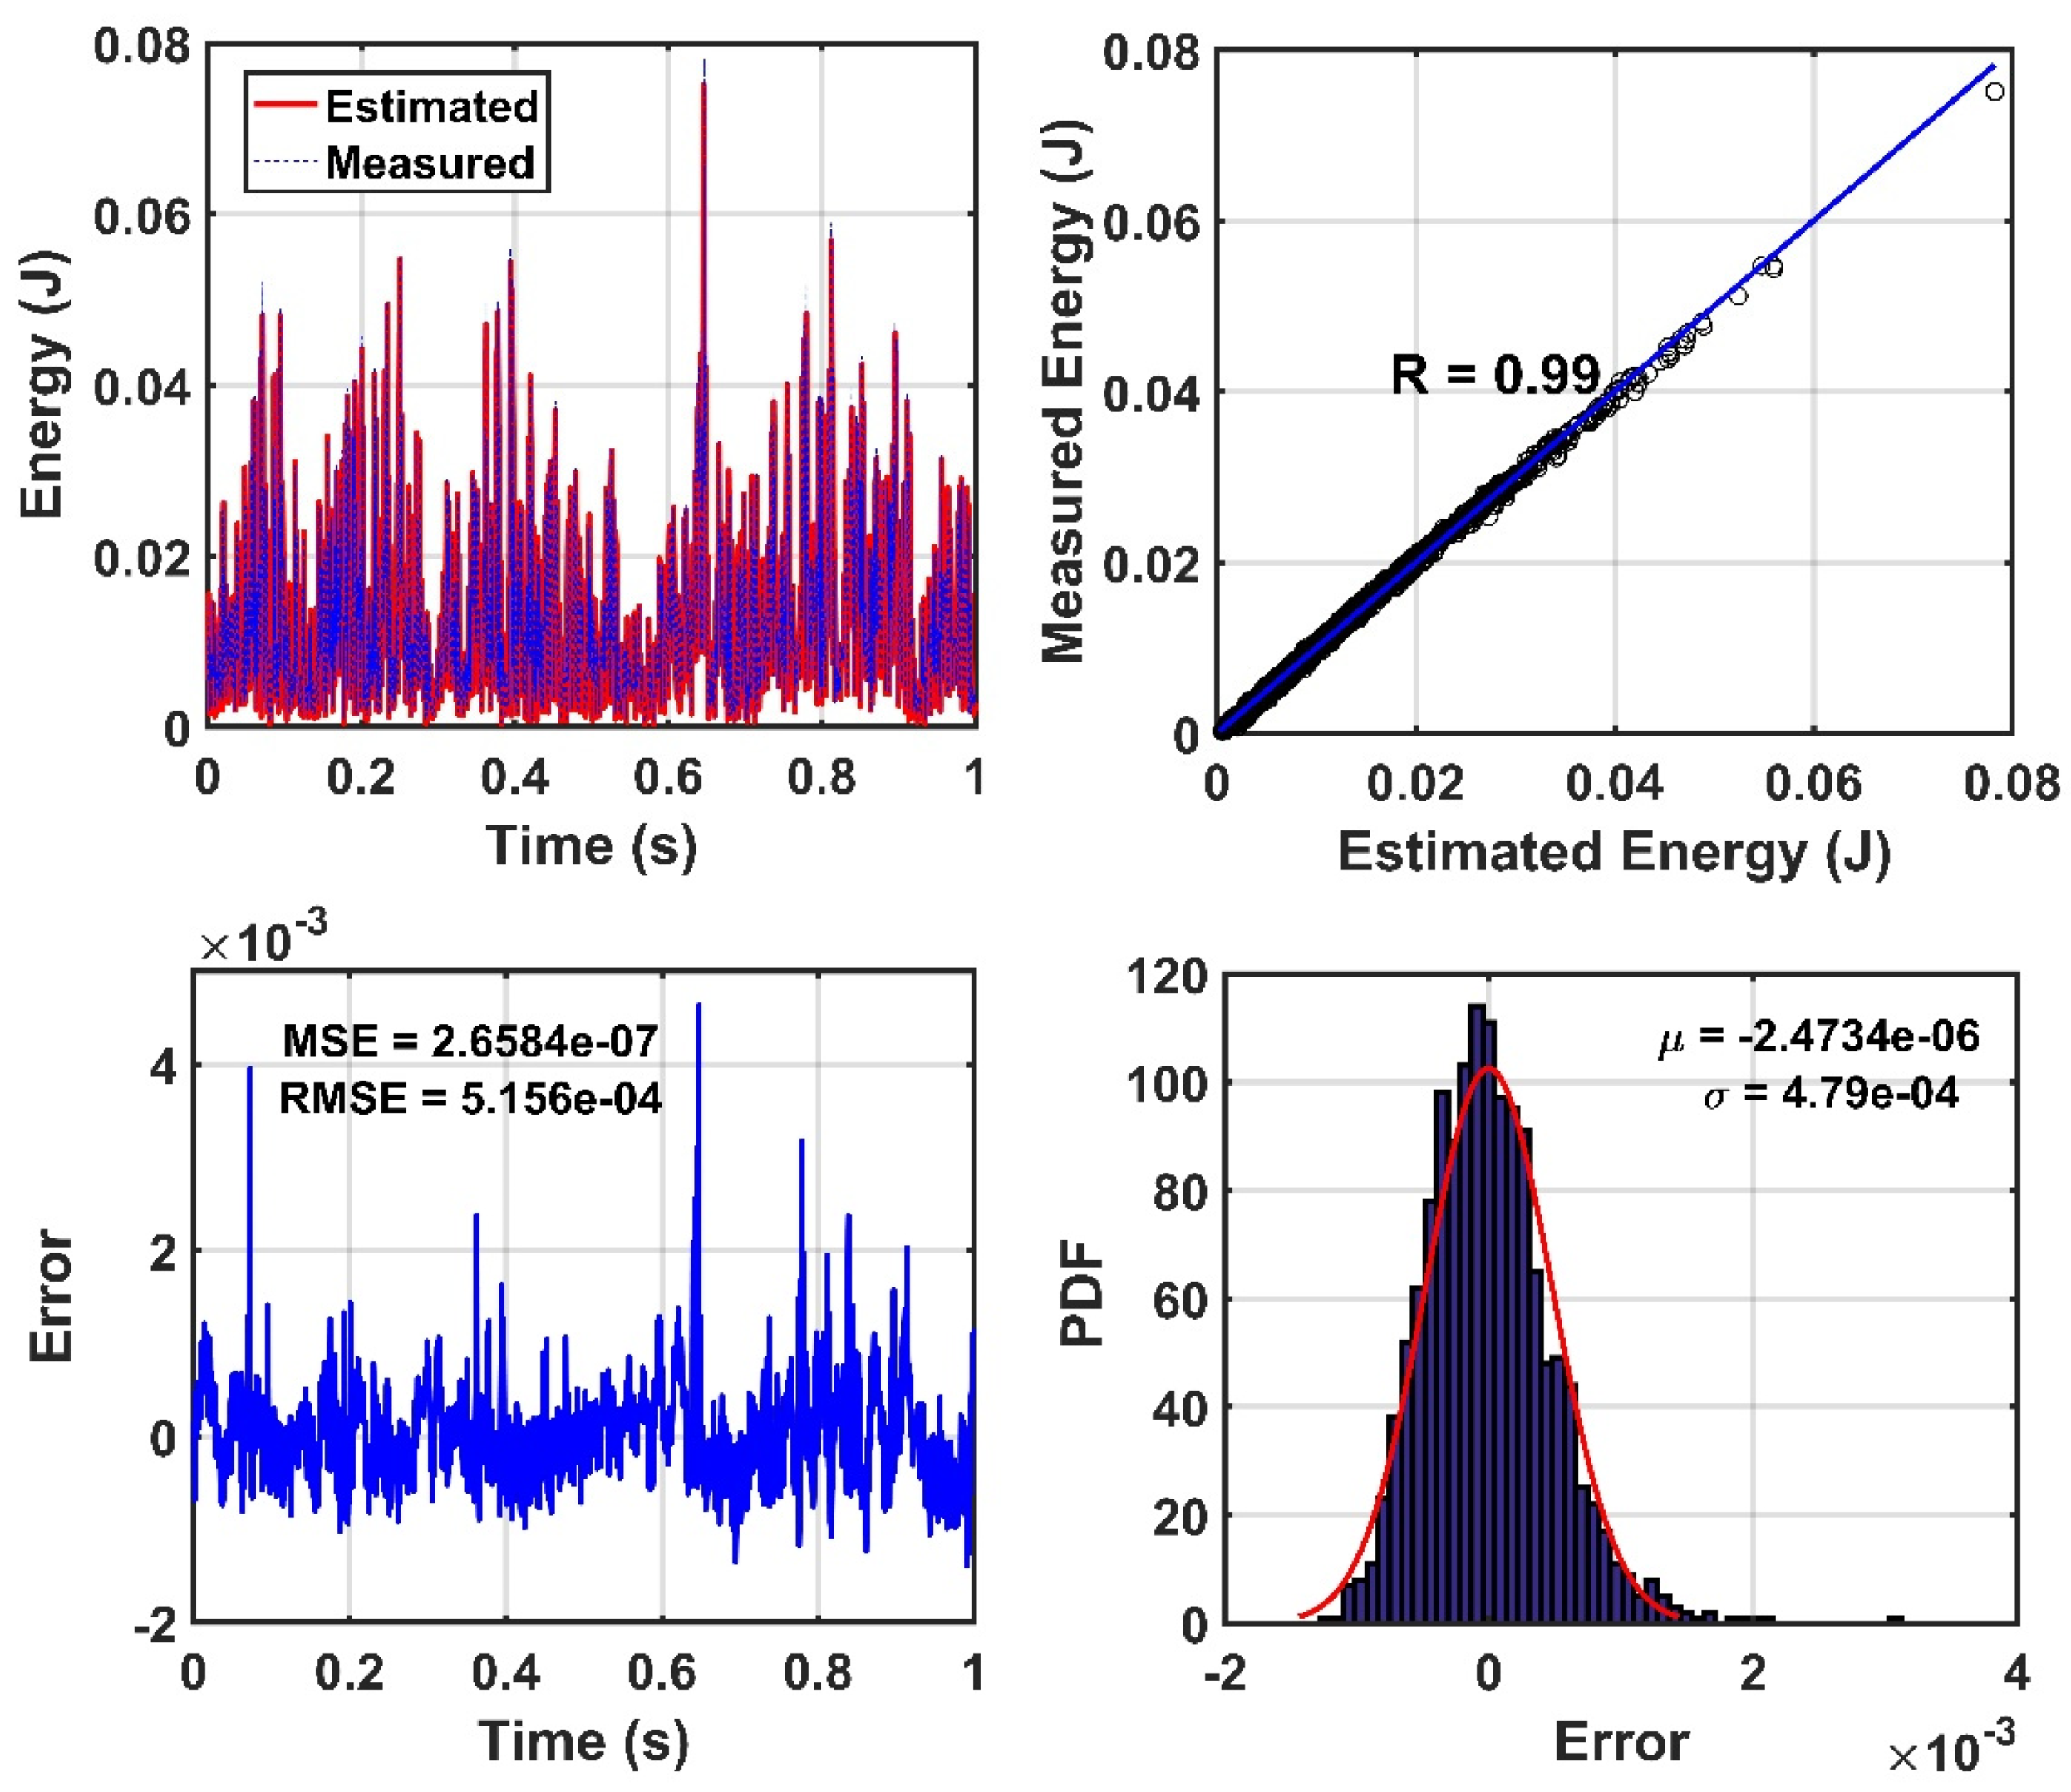
3.2. Procedure of the CEEMDAN-HHT-ANN Damage Detection Method
4. Result and Discussion
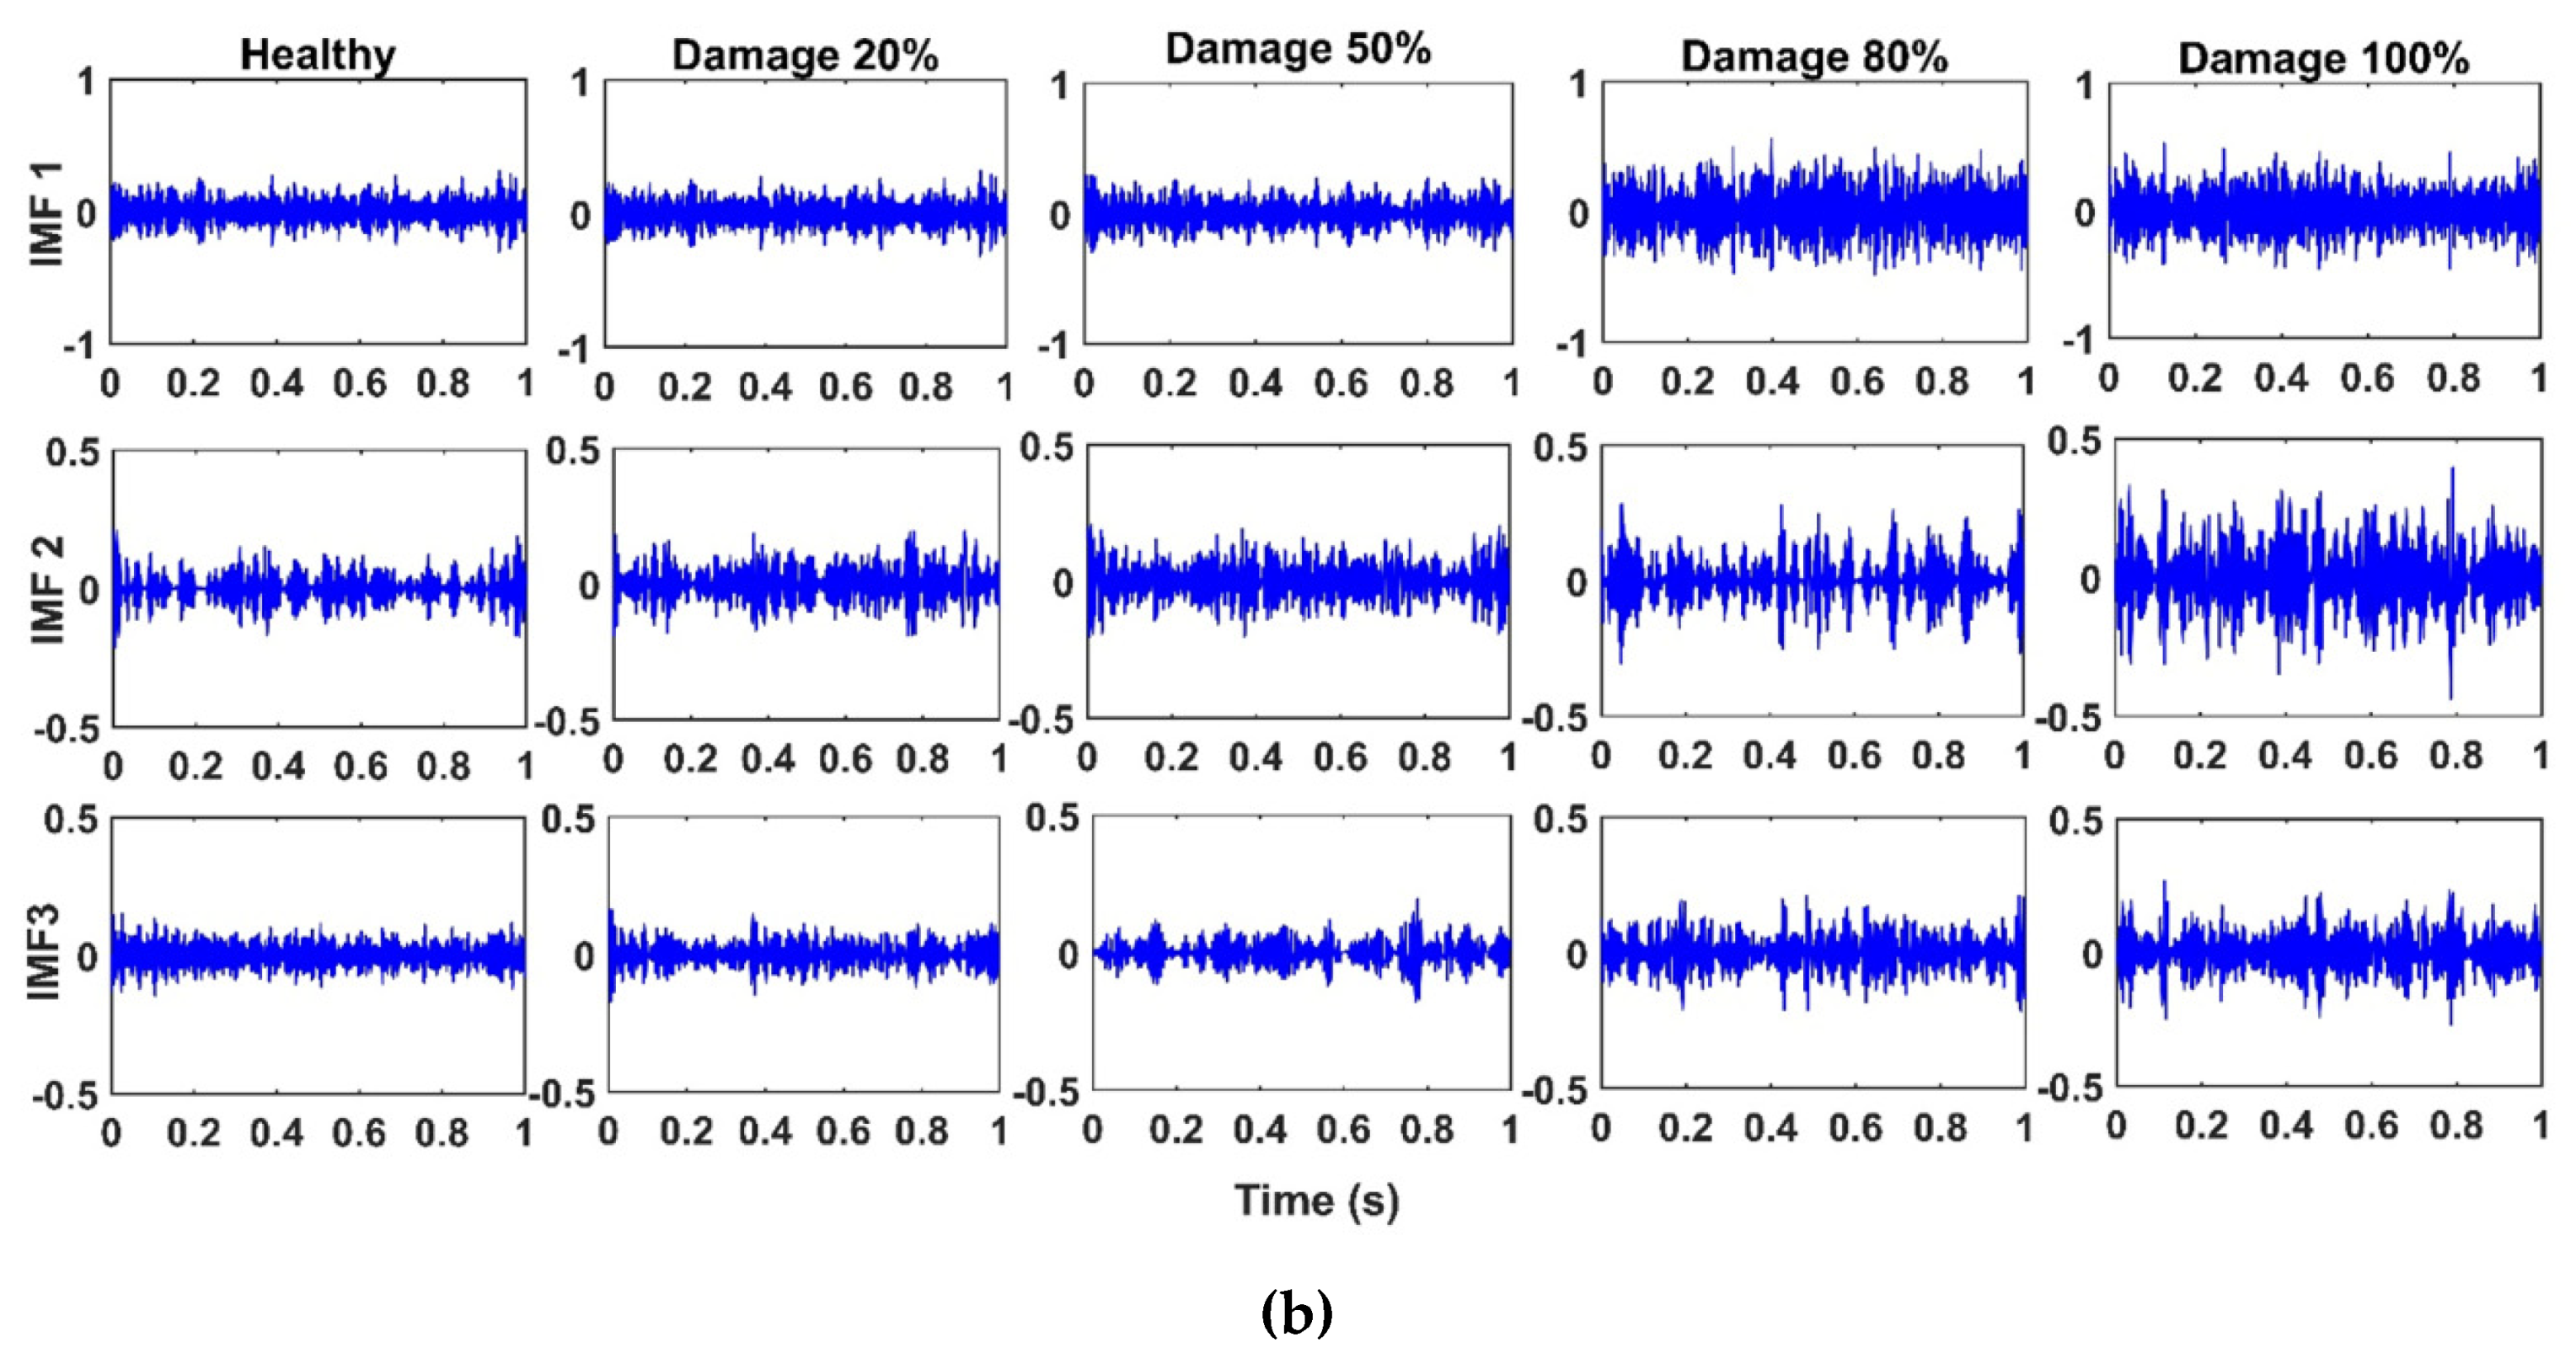
4.1. Detection of the Presence and Severity of Damage
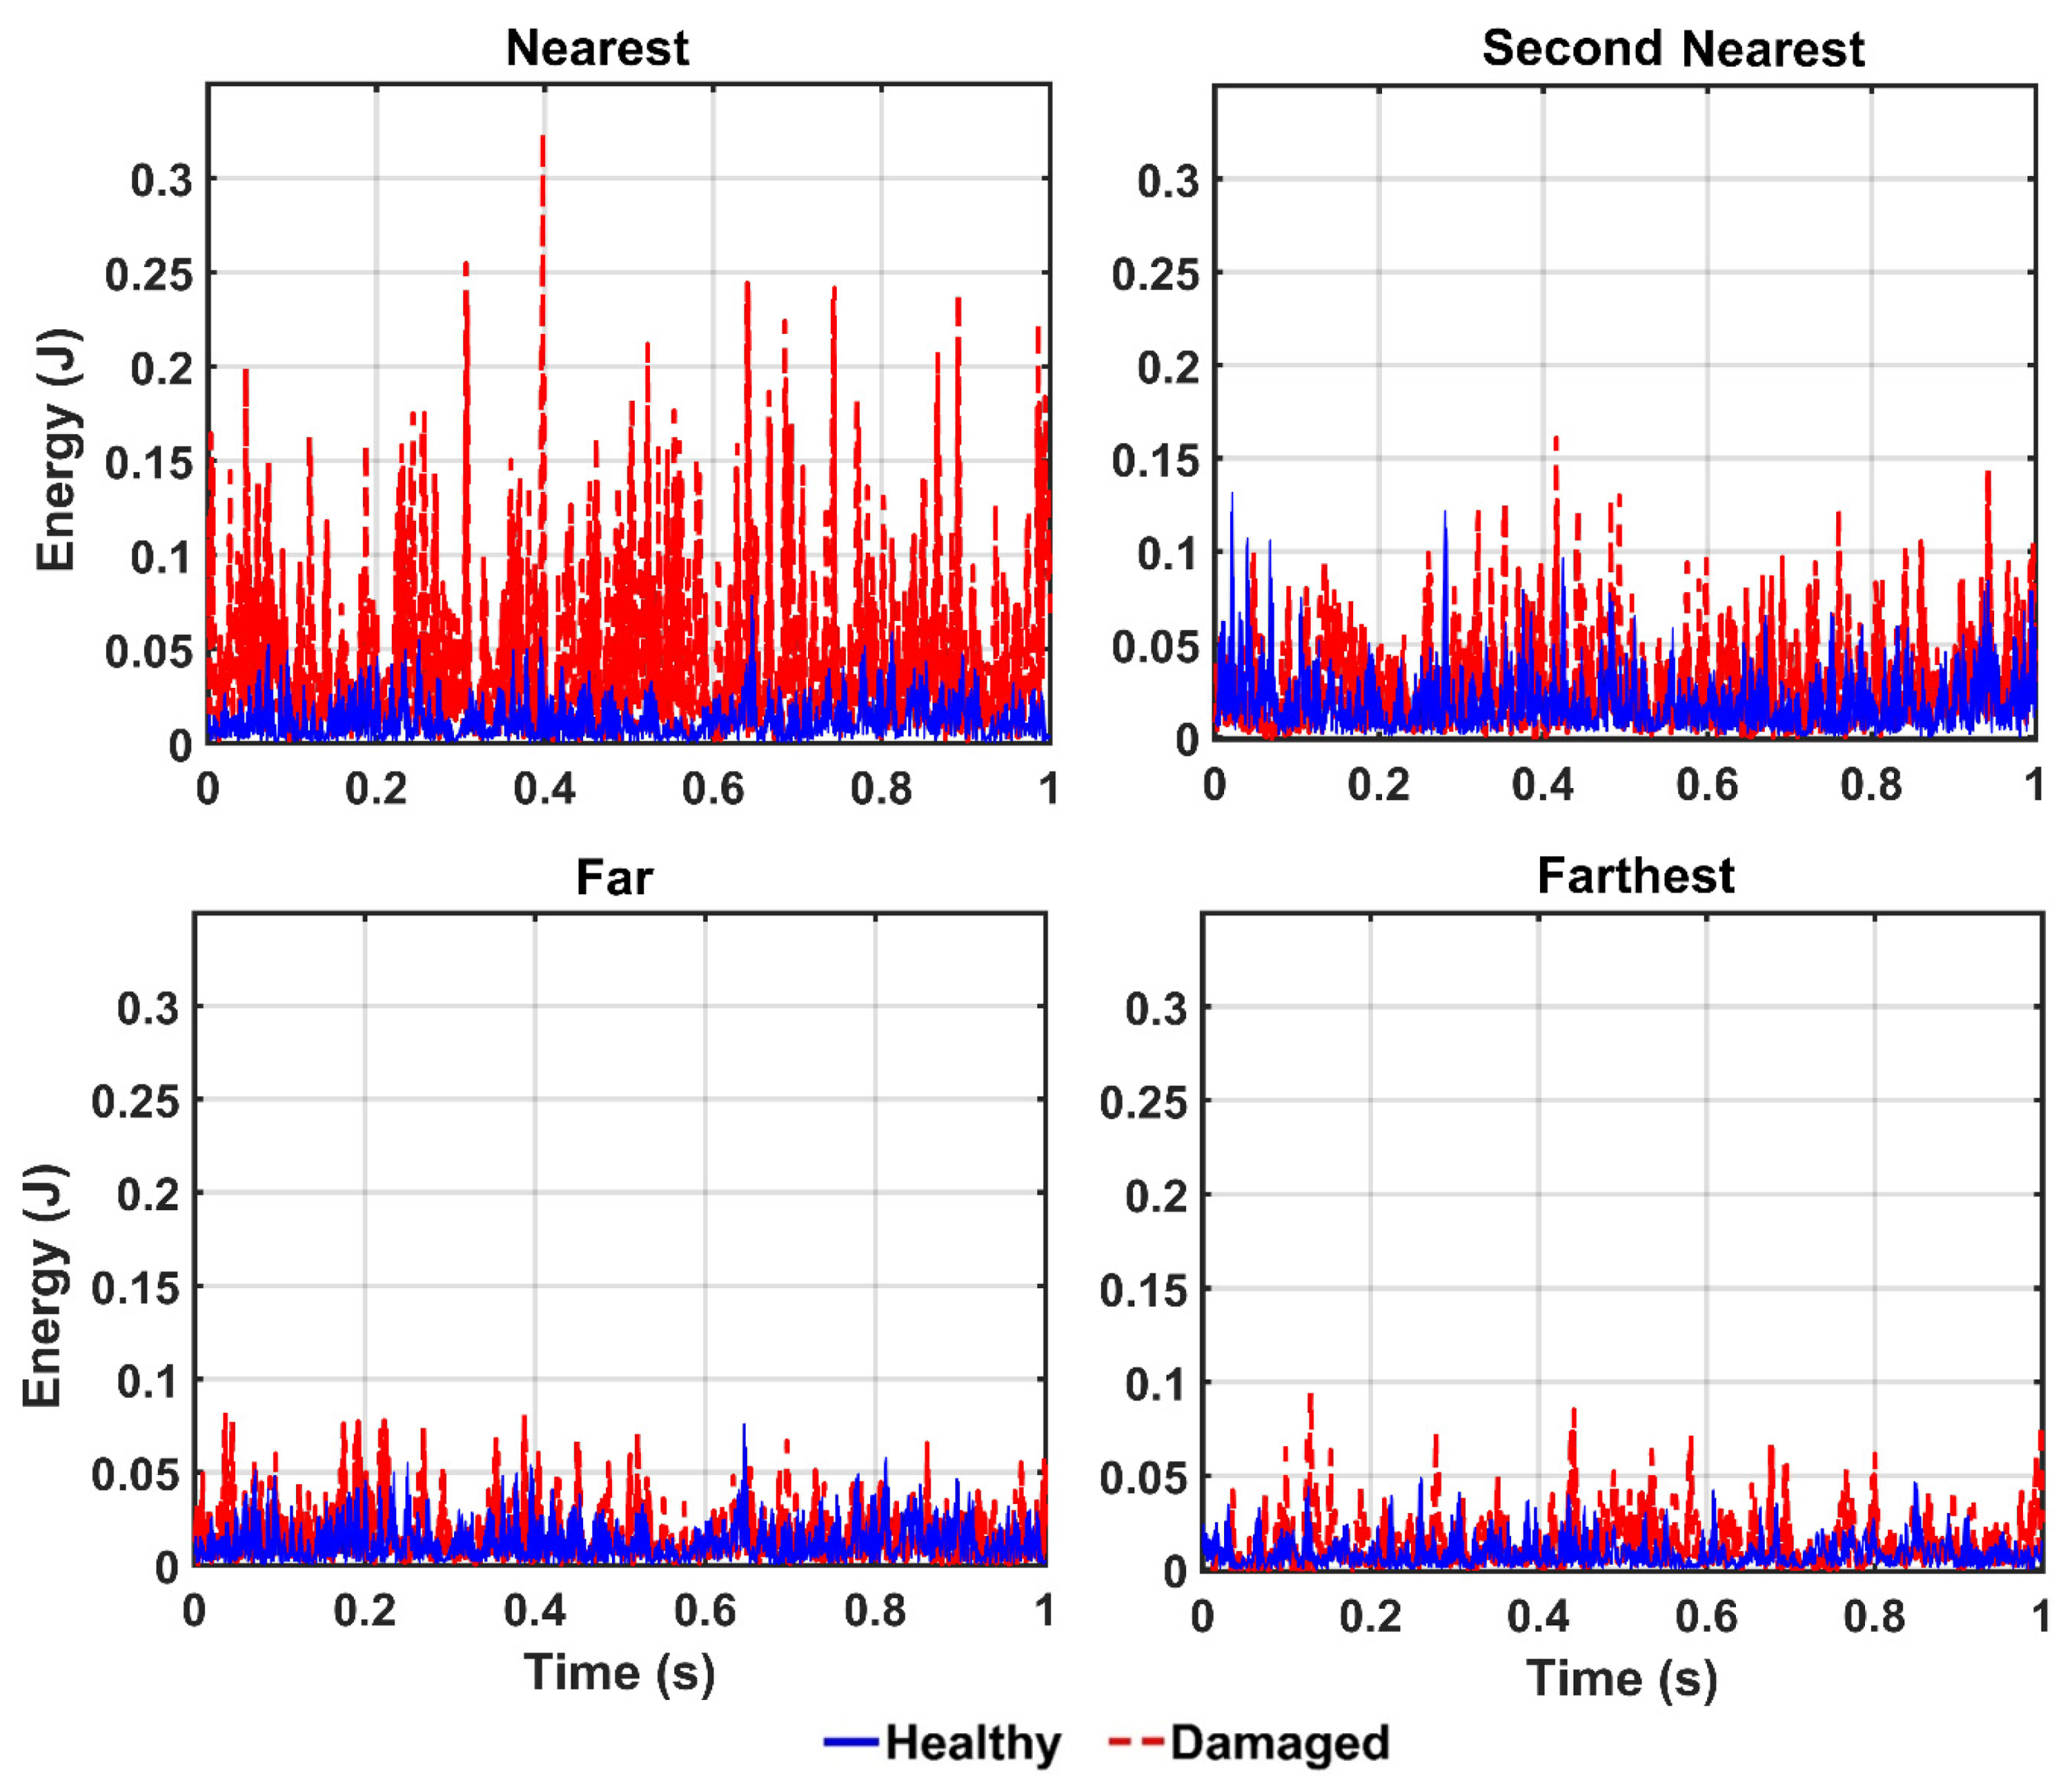
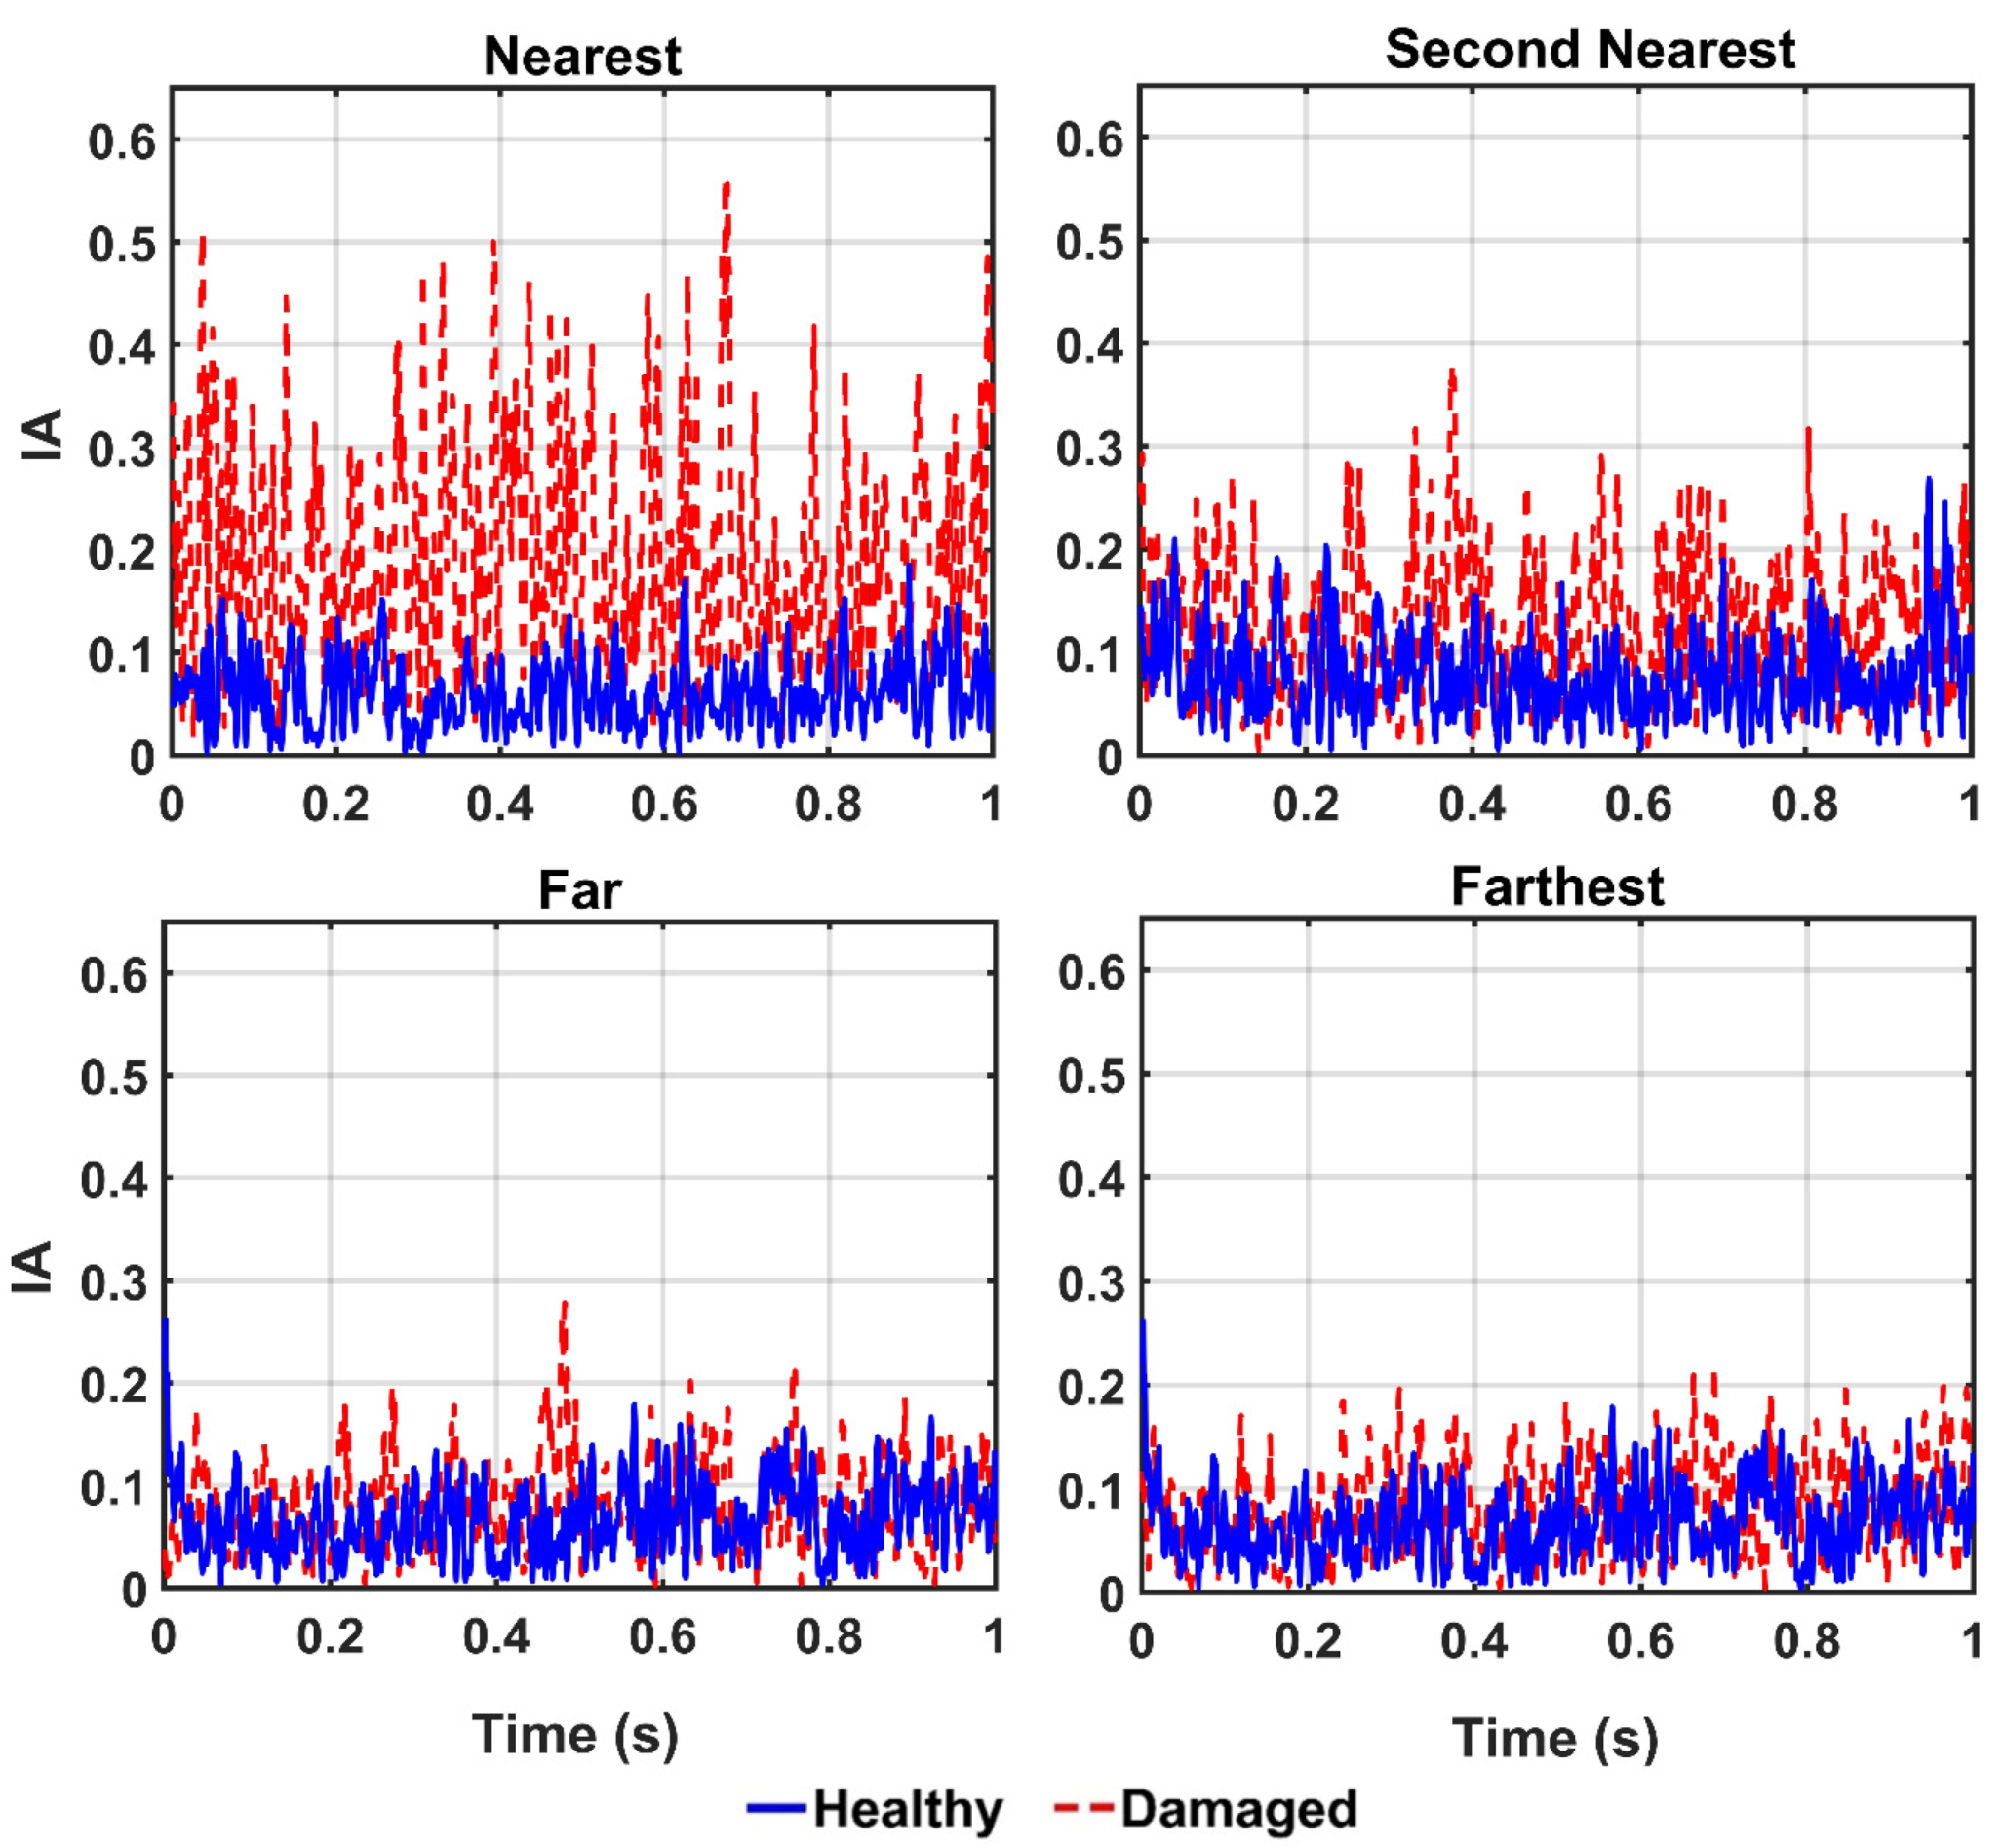
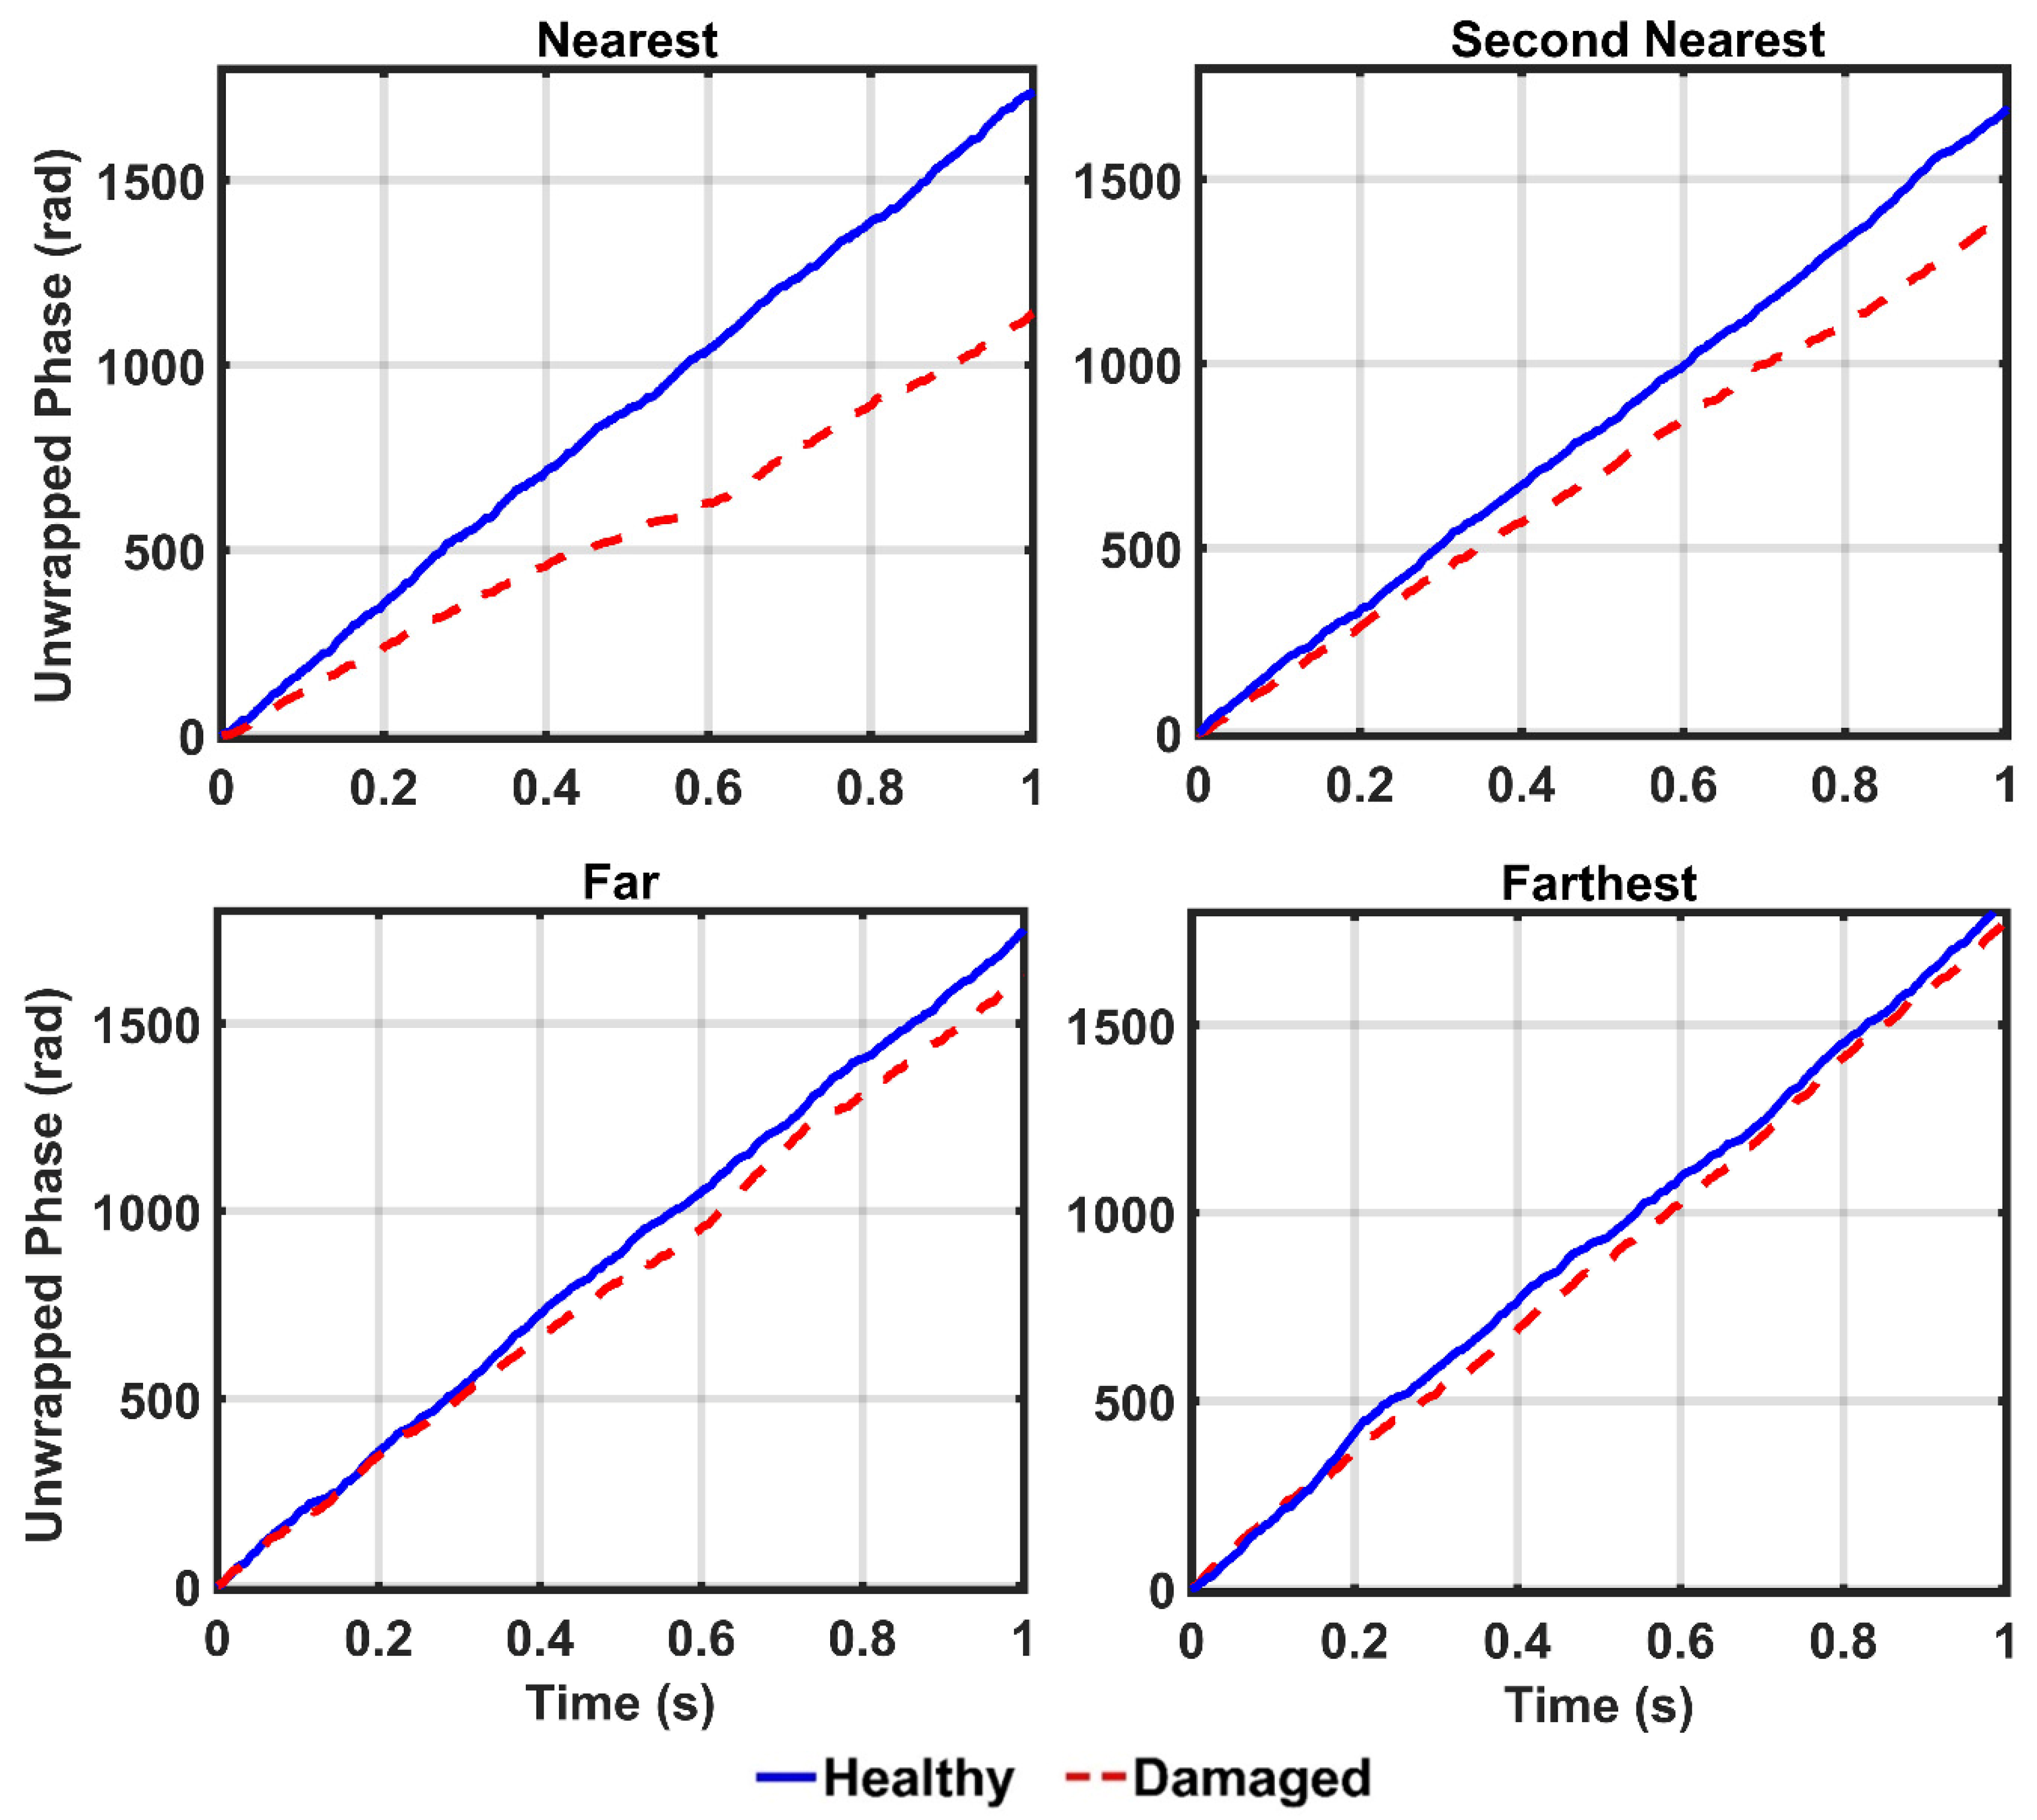
4.2. Detection of Damage Location
5. Summary and Conclusions
Author Contributions
Acknowledgments
Conflicts of Interest
References
- Zhang, F.L.; Yang, Y.P.; Xiong, H.B.; Yang, J.H.; Yu, Z. Structural health monitoring of a 250-M super-Tall building and operational modal analysis using the fast Bayesian FFT method. Struct. Control Health Monit. 2019, 26, e2383. [Google Scholar] [CrossRef]
- Ruocci, G.; Cumunel, G.; Le, T.; Argoul, P.; Point, N.; Dieng, L. Damage assessment of pre-Stressed structures: A SVD-Based approach to deal with time-Varying loading. Mech. Syst. Signal Process. 2014, 47, 50–65. [Google Scholar] [CrossRef] [Green Version]
- Cheraghi, N.; Zou, G.P.; Taheri, F. Piezoelectric-Based degradation assessment of a pipe using fourier and wavelet analyses. Comput. Aided Civ. Infrastruct. Eng. 2005, 20, 369–382. [Google Scholar] [CrossRef]
- Nagata, Y.; Iwasaki, S.; Hariyama, T.; Fujioka, T.; Obara, T.; Wakatake, T. Binaural localization based on weighted wiener gain improved by incremental source attenuation. IEEE Trans. Audio Speech Lang. Process. 2009, 17, 52–65. [Google Scholar] [CrossRef] [Green Version]
- Yesilyurt, I.; Gursoy, H. Estimation of elastic and modal parameters in composites using vibration analysis. Vibr. Control 2015, 21, 509–524. [Google Scholar] [CrossRef]
- Sun, L.; Li, C.; Li, J.; Zhang, C.; Ding, X. Strain transfer analysis of a clamped fiber Bragg grating sensor. Appl. Sci.-Basel 2017, 7, 188. [Google Scholar] [CrossRef] [Green Version]
- Sun, L.; Hao, H.; Zhang, B.; Ren, X.; Li, J. Strain transfer analysis of embedded fiber bragg grating strain sensor. J. Test. Eval. 2016, 44, 2312–2320. [Google Scholar] [CrossRef] [Green Version]
- Huang, N.E.; Shen, Z.; Long, S.R.; Wu, M.C.; Shih, H.H.; Zheng, Q.; Yen, N.C.; Tung, C.C.; Liu, H.H. The empirical mode decomposition and the Hilbert spectrum for nonlinear and nonstationary time series analysis. Proc. R. Soc. Lond. 1998, 454, 903–995. [Google Scholar] [CrossRef]
- Huang, N.E.; Long, S.R.; Shen, Z. The mechanism for frequency downshift in nonlinear wave evolution. Adv. Appl. Mech. 1996, 32, 59–111. [Google Scholar]
- Vincent, H.T.; Hu, S.L.J.; Hou, Z. Damage detection using empirical mode decomposition method and a comparison with wavelet analysis. In Proceedings of the Second International Workshop on Structural Health Monitoring, Stanford, CA, USA, 8–10 September 1999. [Google Scholar]
- Pines, D.; Salvino, L. Structural health monitoring using empirical mode decomposition and the Hilbert phase. Sound. Vib. 2006, 294, 97–124. [Google Scholar] [CrossRef]
- Yan, B.; Miyamoto, A. A comparative study of modal parameter identification based on Wavelet and Hilbert–Huang transforms. Comput. Aided Civ. Infrastruct. Eng. 2006, 21, 9–23. [Google Scholar] [CrossRef]
- Mohammadi Ghazi, R.; Büyüköztürk, O. Damage detection with small data set using energy-Based nonlinear features. Struct. Control Health Monit. 2016, 23, 333–348. [Google Scholar] [CrossRef] [Green Version]
- Xu, Y.L.; Chen, J. Structural damage detection using empirical modes decomposition: Experimental investigation. Eng. Mech. ASCE 2004, 130, 1279–1288. [Google Scholar] [CrossRef]
- Simon Carbajo, E.; Simon Carbajo, R.; Mc Goldrick, C.; Basu, B. ASDAH: An automated structural change detection algorithm based on the Hilbert–Huang transform. Mech. Syst. Signal Process. 2014, 47, 78–93. [Google Scholar] [CrossRef]
- Zhu, X.; Cao, M.; Ostachowicz, W.; Xu, W. Damage Identification in Bridges by Processing Dynamic Responses to Moving Loads: Features and Evaluation. Sensors 2019, 19, 463. [Google Scholar] [CrossRef] [Green Version]
- Quek, S.; Tua, P.; Wang, Q. Detecting anomalies in beams and plate based on the Hilbert–Huang transform of real signals. Smart Mater. Struct. 2003, 12, 447–460. [Google Scholar] [CrossRef]
- Liu, J.; Wang, X.; Yuan, S.; Li, G. On Hilbert–Huang transform approach for structural health monitoring. Intell. Mater. Syst. Struct. 2006, 17, 721–728. [Google Scholar] [CrossRef]
- Yang, J.N.; Lei, Y.; Linand, S.; Huang, N. Hilbert–Huang based approach for structural damage detection. J. Eng. Mech. ASCE 2004, 130, 85–95. [Google Scholar] [CrossRef]
- Kumari, P.; Vaish, A. Information-Theoretic measures on intrinsic mode function for the individual identification using EEG sensors. IEEE Sens. J. 2015, 15, 4950–4960. [Google Scholar] [CrossRef]
- Petrantonakis, P.C.; Hadjileontiadis, L.J. Emotion recognition from brain signals using hybrid adaptive filtering and higher order crossings analysis. IEEE Trans. Affect. Comput. 2010, 1, 81–97. [Google Scholar] [CrossRef]
- Gunturkun, U. Bivariate empirical mode decomposition for cognitive radar scene analysis. IEEE Signal Proc. Lett. 2015, 22, 603–607. [Google Scholar] [CrossRef]
- Sherr, Y.; Zhang, Y.; Wang, Z. Satellite fault diagnosis method based on predictive filter and empirical mode decomposition. J. Syst. Eng. Electron. 2011, 22, 83–87. [Google Scholar] [CrossRef]
- Khaldi, K.; Boudraa, A.O. Audio watermarking via EMD. IEEE Trans. Audio Speech 2013, 21, 675–680. [Google Scholar] [CrossRef] [Green Version]
- Nunes, J.C.; Bouaoune, Y.; Delechelle, E.; Niang, O.; Bunel, P. Image analysis by bidimensional empirical mode decomposition. Image Vis. Comput. 2003, 21, 1019–1026. [Google Scholar] [CrossRef]
- Chopin, N.; Jacob, P.E.; Papaspiliopoulos, O. SMC2: An efficient algorithm for sequential analysis of state-Space models. J. R. Stat. Soc. B 2013, 75, 397–426. [Google Scholar] [CrossRef] [Green Version]
- Drovandi, C.C.; McGree, J.; Pettitt, A.N. A sequential Monte Carlo algorithm to incorporate model uncertainty in Bayesian sequential design. J. Comput. Graph. Stat. 2014, 23, 3–24. [Google Scholar] [CrossRef] [Green Version]
- Martino, L.; Elvira, V.; Camps-Valls, G. Group importance sampling for particle filtering and MCMC. Digit. Signal Process. 2018, 82, 133–151. [Google Scholar] [CrossRef] [Green Version]
- Martino, L.; Elvira, V.; Camps-Valls, G. Distributed particle Metropolis-Hastings schemes. In Proceedings of the 2018 IEEE Statistical Signal Processing Workshop (SSP), Freiburg, Germany, 10–13 June 2018; pp. 553–557. [Google Scholar]
- Wu, Z.; Huang, N.E. A study of the characteristics of white noise using the empirical mode decomposition method. Proc. R. Soc. London A Math. Phys. Eng. Sci. 2004, 460, 1597–1611. [Google Scholar] [CrossRef]
- Schlotthauer, G.; Torres, M.E.; Rufiner, H.L.; Flandrin, P. EMD of Gaussian white noise: Effects of signal length and sifting number on the statistical properties of Intrinsic Mode Functions. Adv. Adapt. Data Anal. 2009, 1, 517–527. [Google Scholar] [CrossRef] [Green Version]
- Tseng, C.Y.; Lee, H.C. Entropic interpretation of empirical mode decomposition and its applications in signal processing. Adv. Adapt. Data Anal. 2010, 2, 429–449. [Google Scholar] [CrossRef]
- Sameni, R.; Shamsollahi, M.B.; Jutten, C.; Clifford, G.D. A nonlinear Bayesian filtering framework for ECG denoising. IEEE Trans. Bio Med. Eng. 2007, 54, 2172–2185. [Google Scholar] [CrossRef] [PubMed] [Green Version]
- Torres, M.E.; Colominas, M.A.; Schlotthauer, G.; Flandrin, P. A complete ensemble empirical mode decomposition with adaptive noise. In Proceedings of the IEEE International Conference on Acoustics, Speech and Signal Processing (ICASSP), Prague, Czech Republic, 22–27 May 2011; pp. 4144–4147. [Google Scholar]
- Adeli, H. Neural networks in civil engineering: 1989–2000. Comput. Aided Civ. Infrastruct. Eng. J. 2001, 16, 126–142. [Google Scholar] [CrossRef]
- Nazarko, P.; Ziemianski, L. Application of artificial neural networks in the damage identification of structural elements. Comput. Assist. Mech. Eng. Sci. 2011, 18, 175–189. [Google Scholar]
- Gordan, M.; Razak, H.A.; Ismail, Z.; Ghaedi, K. Recent Developments in Damage Identification of Structures Using Data Mining. Lat. Am. J. Solids Struct. 2017, 14, 2373–2401. [Google Scholar] [CrossRef]
- Adeli, H.; Jiang, X. Dynamic Fuzzy Wavelet Neural Network Model for Structural System Identification. J. Struct. Eng. 2006, 132, 102–111. [Google Scholar] [CrossRef]
- Qian, Y.; Mita, A. Acceleration-Based damage indicators for building structures using neural network emulators. Struct. Control Health Monit. J. 2008, 15, 901–920. [Google Scholar] [CrossRef]
- Masri, S.F.; Nakamura, M.; Chassiakos, A.G.; Caughey, T.K. Neural network approach to detection of changes in structural parameters. J. Eng. Mech. ASCE 1996, 122, 350–360. [Google Scholar] [CrossRef]
- Masri, S.F.; Smyth, A.W.; Chassiakos, A.G.; Caughey, T.K.; Hunter, N.F. Application of neural networks for detection of changes in nonlinear systems. J. Eng. Mech. ASCE 2000, 126, 666–676. [Google Scholar] [CrossRef]
- Dackermann, U.; Smith, W.A.; Randall, R.B. Damage identification based on response-Only measurements using cepstrum analysis and artificial neural networks. Struct. Health Monit. 2014, 13, 430–444. [Google Scholar] [CrossRef]
- Arangio, S.; Bontempi, F. Structural health monitoring of a cable-Stayed bridge with Bayesian neural networks. Struct. Infrastruct. Eng. 2015, 11, 575–587. [Google Scholar] [CrossRef]
- Zang, C.; Friswell, M.I.; Imregun, M. Structural damage detection using independent component analysis. Struct. Health Monit. 2004, 3, 69–83. [Google Scholar] [CrossRef]
- Yan, Y.J.; Cheng, L.; Wu, Z.Y.; Yam, L.H. Development in vibration based structural damage detection technique. Mech. Syst. Signal Process. 2007, 21, 2198–2211. [Google Scholar] [CrossRef]
- Garcia-Perez, A.; Amezquita-Sanchez, J.P.; Dominguez-Gonzalez, A.; Sedaghati, R.; Osornio-Rios, R.; Romero-Troncoso, R.J. Fused empirical mode decomposition and wavelets for locating combined damage in a truss-Type structure through vibration analysis. J. Zhejiang Univ. Sci. A 2013, 14, 615–630. [Google Scholar] [CrossRef]
- Xun, J.; Yan, S. A revised Hilbert–Huang transformation based on the neural networks and its application in vibration signal analysis of a deployable structure. Mech. Syst. Signal Process. 2008, 22, 1705–1723. [Google Scholar] [CrossRef]
- Vazirizade, S.M.; Bakhshi, A.; Bahar, O. Online nonlinear structural damage detection using Hilbert Huang transform and artificial neural networks. Sci. Iran. 2019, 26, 1266–1279. [Google Scholar] [CrossRef] [Green Version]
- Timmermann, A.; Granger, C. Efficient market hypothesis and forecasting. Int. J. Forecast. 2004, 20, 15–27. [Google Scholar] [CrossRef]
- Lai, K.K.; Yu, L.; Wang, S.; Huang, W. Hybridizing exponential smoothing and neural network for financial time series predication. In International Conference on Computational Science 2006; Springer: Berlin/Heidelberg, Germany, 2006. [Google Scholar]
- Liu, H.; Zhou, J.; Zheng, Y.; Jiang, W.; Zhang, Y. Fault diagnosis of rolling bearings with recurrent neural network-Based autoencoders. ISA Trans. 2018, 77, 167–178. [Google Scholar] [CrossRef]
- Gholipour, G.; Zhang, C.; Mousavi, A.A. Nonlinear numerical analysis and progressive damage assessment of a cable-Stayed bridge pier subjected to ship collision. Mar. Struct. 2020, 69, 102662. [Google Scholar] [CrossRef]
- Zhang, C. Control force characteristics of different control strategies for the wind-excited 76-story benchmark building structure. Adv. Struct. Eng. 2014, 17, 543–560. [Google Scholar] [CrossRef]
- Gao, Y.; Spencer, B.F., Jr. Experimental verification of a distributed computing strategy for structural health monitoring. Smart Struct. Syst. 2007, 3, 455–474. [Google Scholar] [CrossRef]


| IMF Feature | Damage 20% | Damage 50% | Damage 80% | Damage 100% |
|---|---|---|---|---|
| DI (%) | DI (%) | DI (%) | DI (%) | |
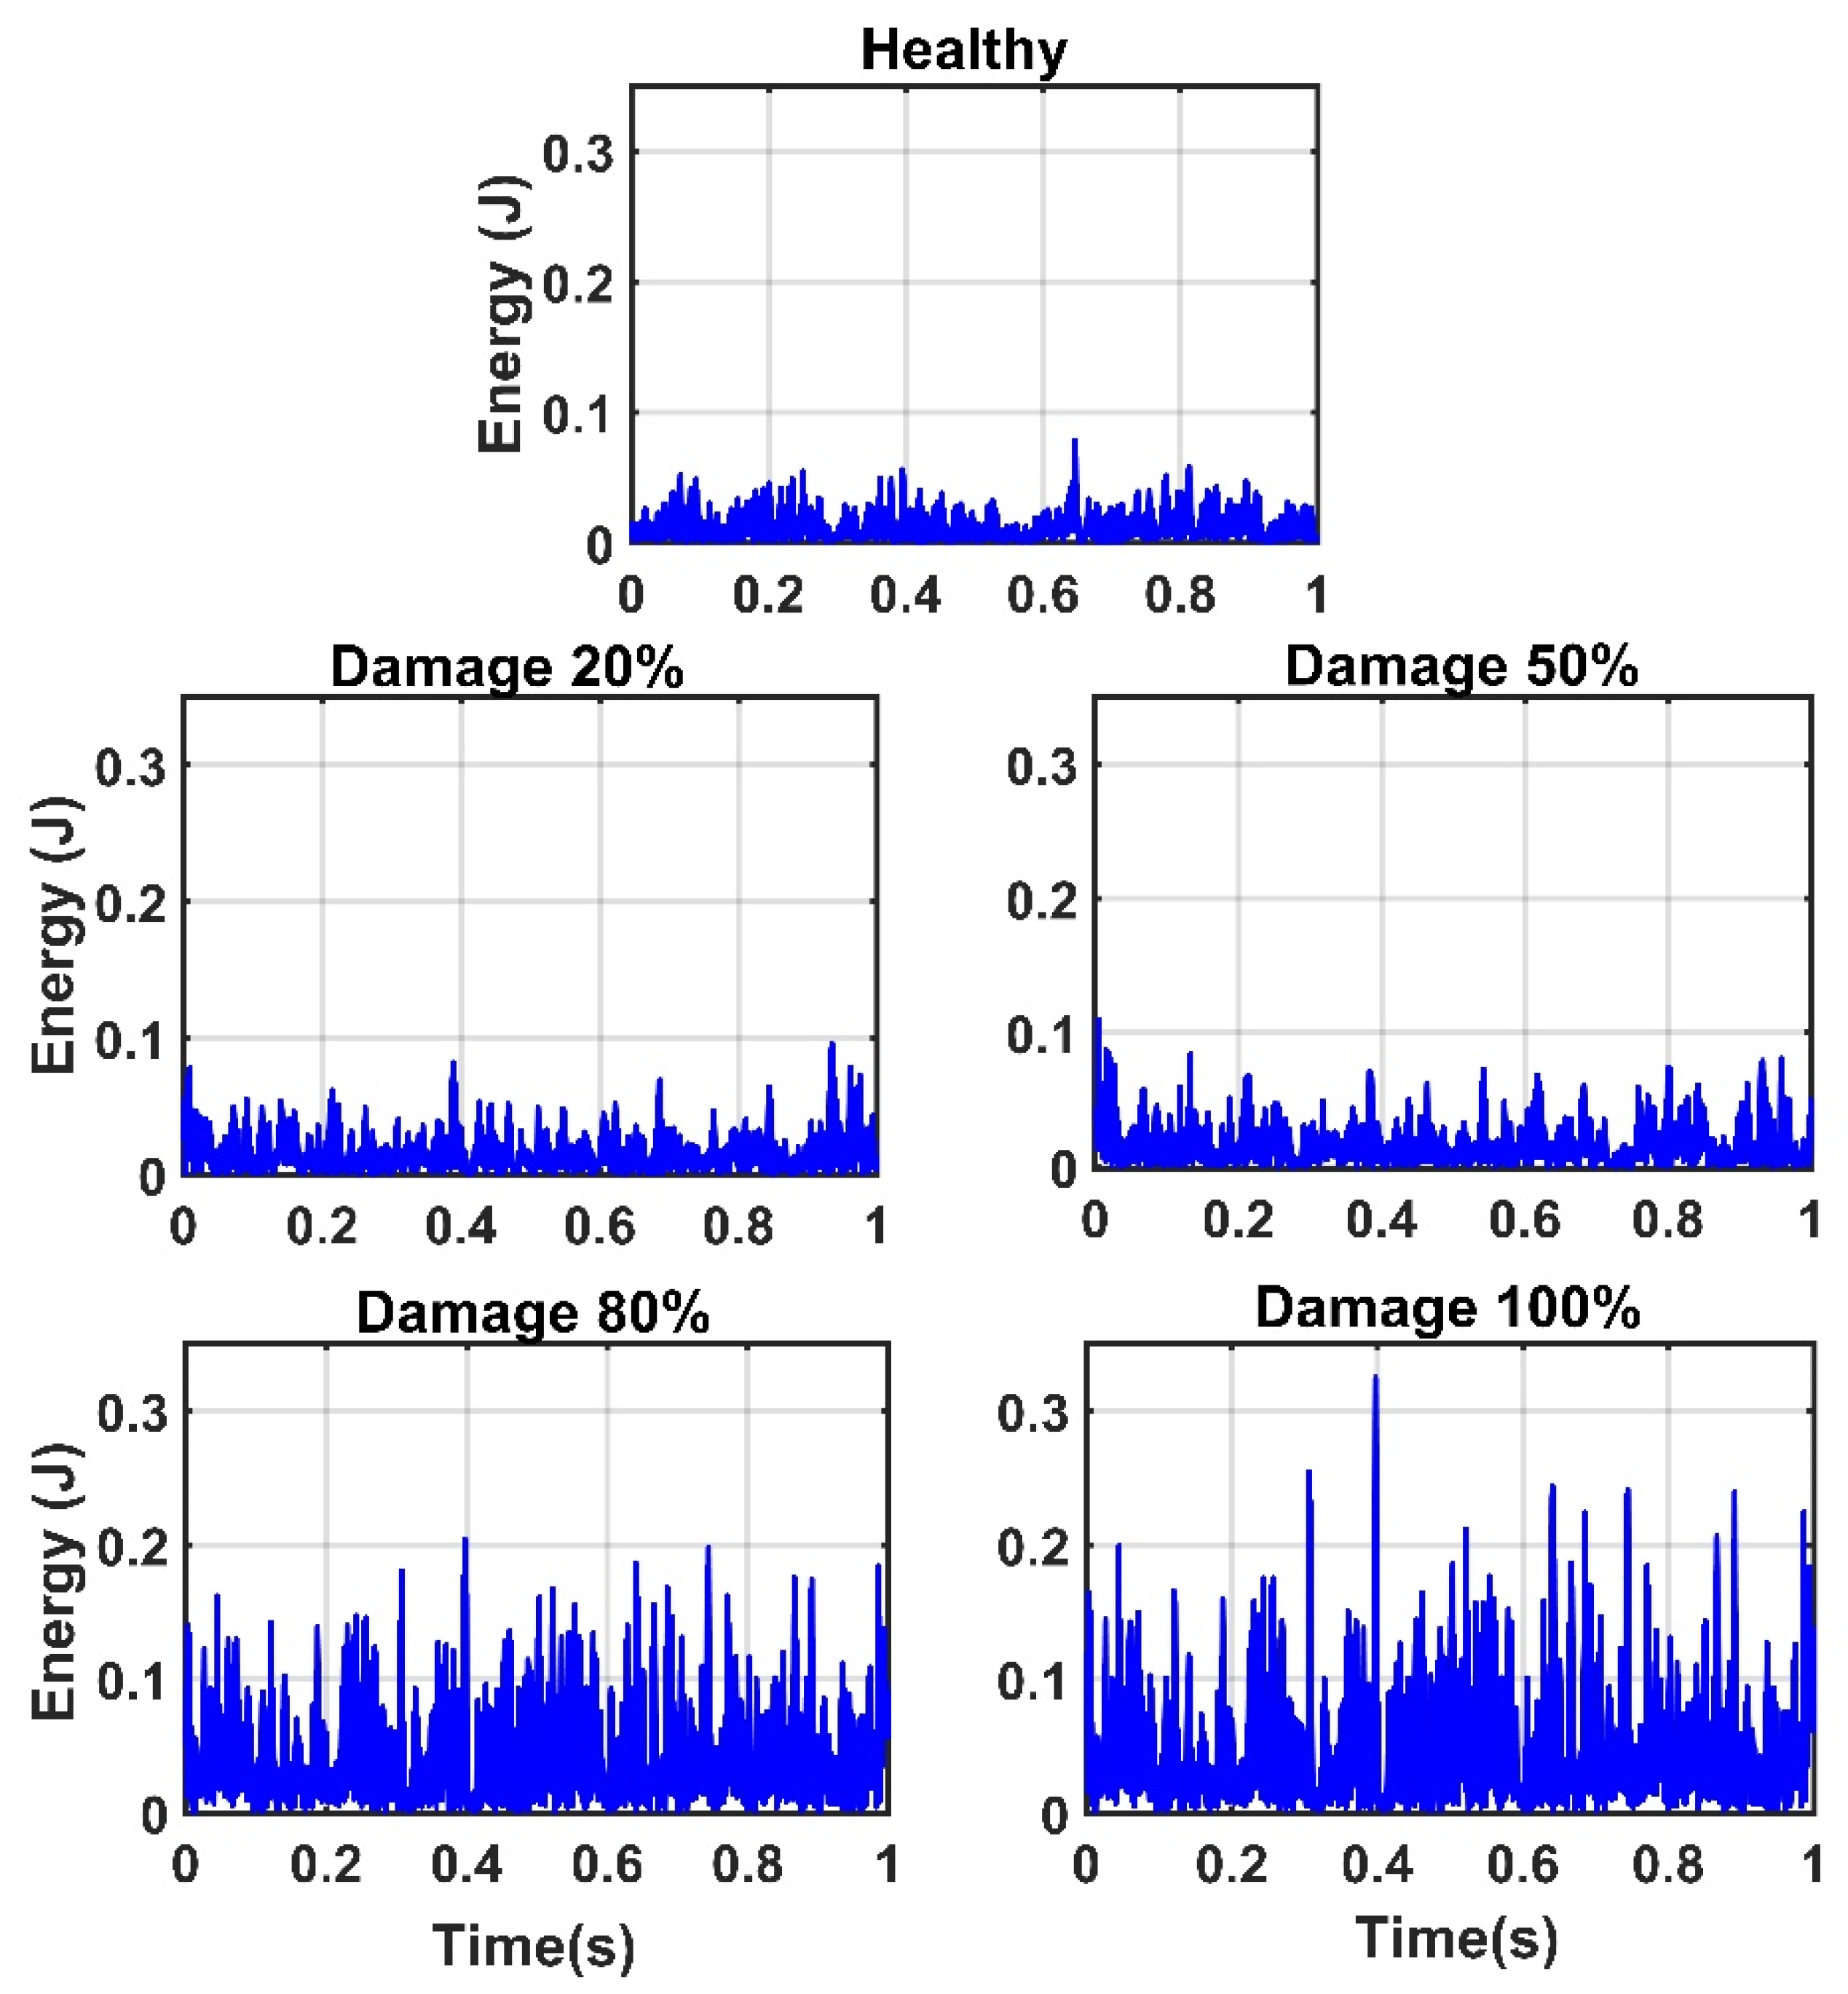
| Energy | 23.43 | 32.72 | 86.47 | 94.24 |
| IA | 21.46 | 25.88 | 57.39 | 62.04 |
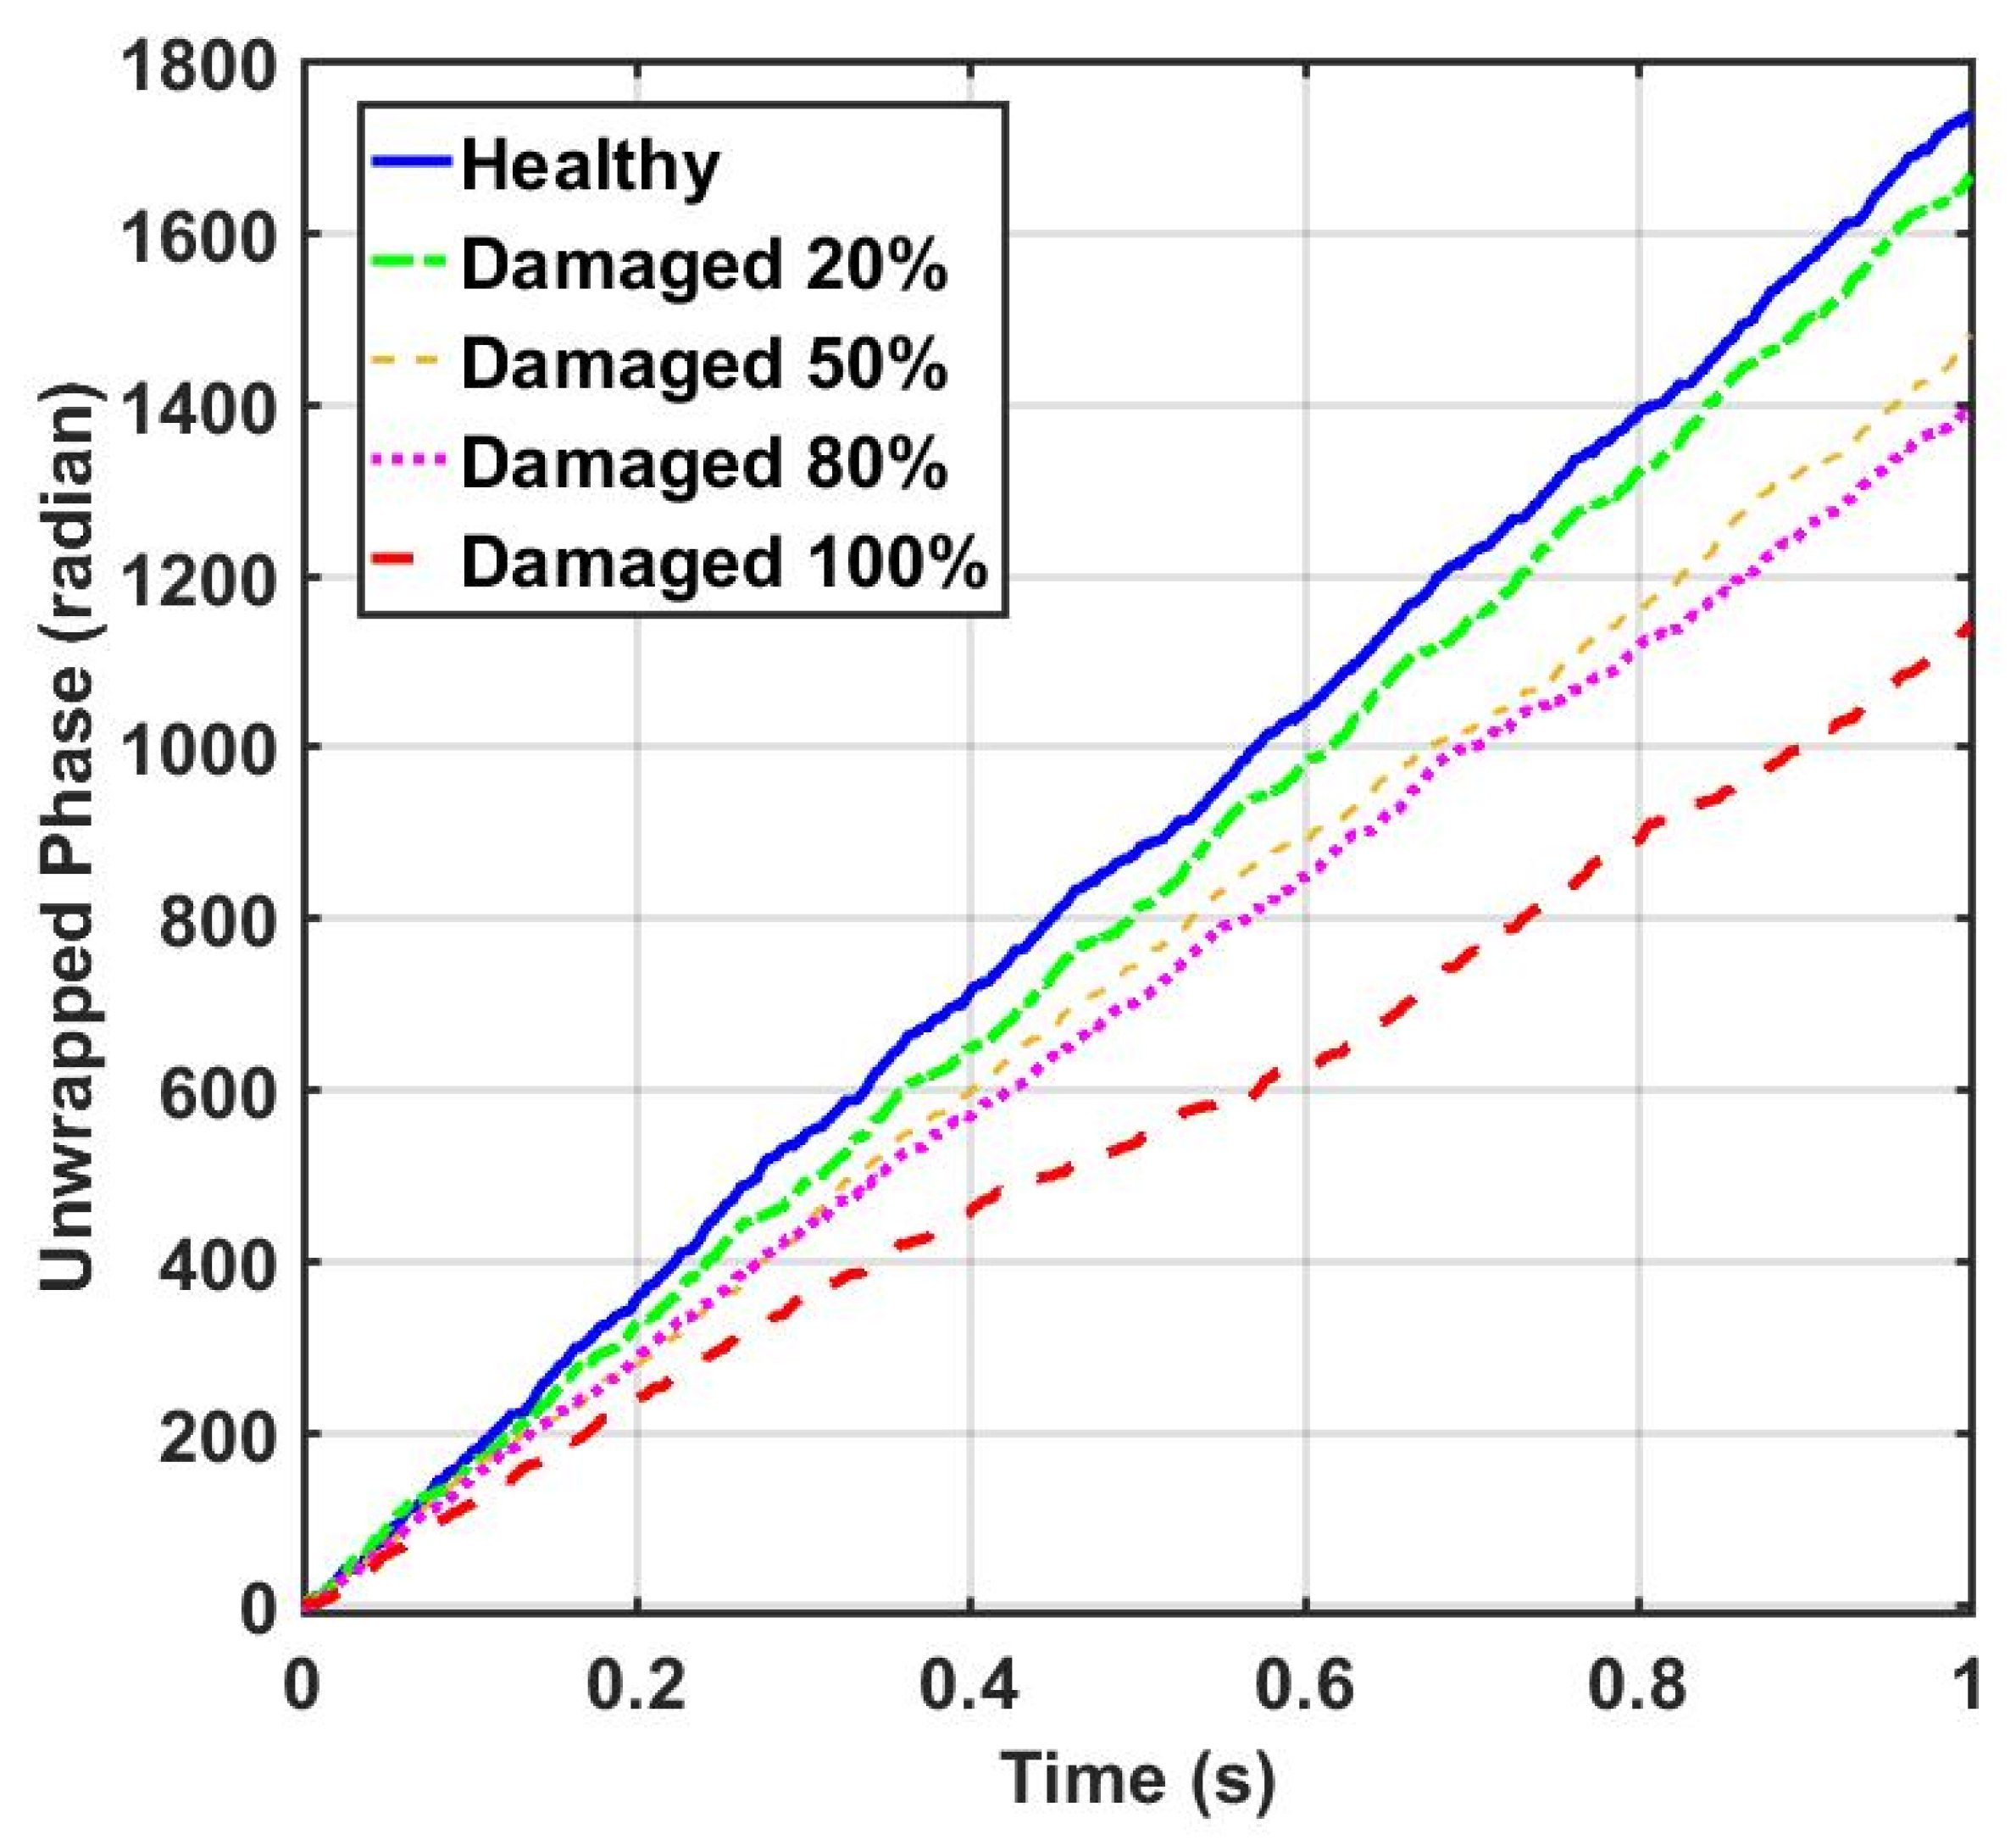
| Unwrapped phase | 6.52 | 17.13 | 20.11 | 41.80 |
| IMF Feature | Nearest | Second Nearest | Far | Farthest |
|---|---|---|---|---|
| DI (%) | DI (%) | DI (%) | DI (%) | |
| Energy | 94.24 | 35.84 | 24.92 | 17.34 |
| IA | 62.04 | 51.36 | 31.35 | 16.45 |
| Unwrapped Phase | 41.80 | 18.90 | 07.55 | 05.10 |
© 2020 by the authors. Licensee MDPI, Basel, Switzerland. This article is an open access article distributed under the terms and conditions of the Creative Commons Attribution (CC BY) license (http://creativecommons.org/licenses/by/4.0/).
Share and Cite
Mousavi, A.A.; Zhang, C.; Masri, S.F.; Gholipour, G. Structural Damage Localization and Quantification Based on a CEEMDAN Hilbert Transform Neural Network Approach: A Model Steel Truss Bridge Case Study. Sensors 2020, 20, 1271. https://doi.org/10.3390/s20051271
Mousavi AA, Zhang C, Masri SF, Gholipour G. Structural Damage Localization and Quantification Based on a CEEMDAN Hilbert Transform Neural Network Approach: A Model Steel Truss Bridge Case Study. Sensors. 2020; 20(5):1271. https://doi.org/10.3390/s20051271
Chicago/Turabian StyleMousavi, Asma Alsadat, Chunwei Zhang, Sami F. Masri, and Gholamreza Gholipour. 2020. "Structural Damage Localization and Quantification Based on a CEEMDAN Hilbert Transform Neural Network Approach: A Model Steel Truss Bridge Case Study" Sensors 20, no. 5: 1271. https://doi.org/10.3390/s20051271
APA StyleMousavi, A. A., Zhang, C., Masri, S. F., & Gholipour, G. (2020). Structural Damage Localization and Quantification Based on a CEEMDAN Hilbert Transform Neural Network Approach: A Model Steel Truss Bridge Case Study. Sensors, 20(5), 1271. https://doi.org/10.3390/s20051271