Indoor Trajectory Reconstruction of Walking, Jogging, and Running Activities Based on a Foot-Mounted Inertial Pedestrian Dead-Reckoning System

 , , ,
, , ,  and
and 
Abstract
1. Introduction
2. Datasets
2.1. Unicauca Dataset
2.2. FAU Dataset
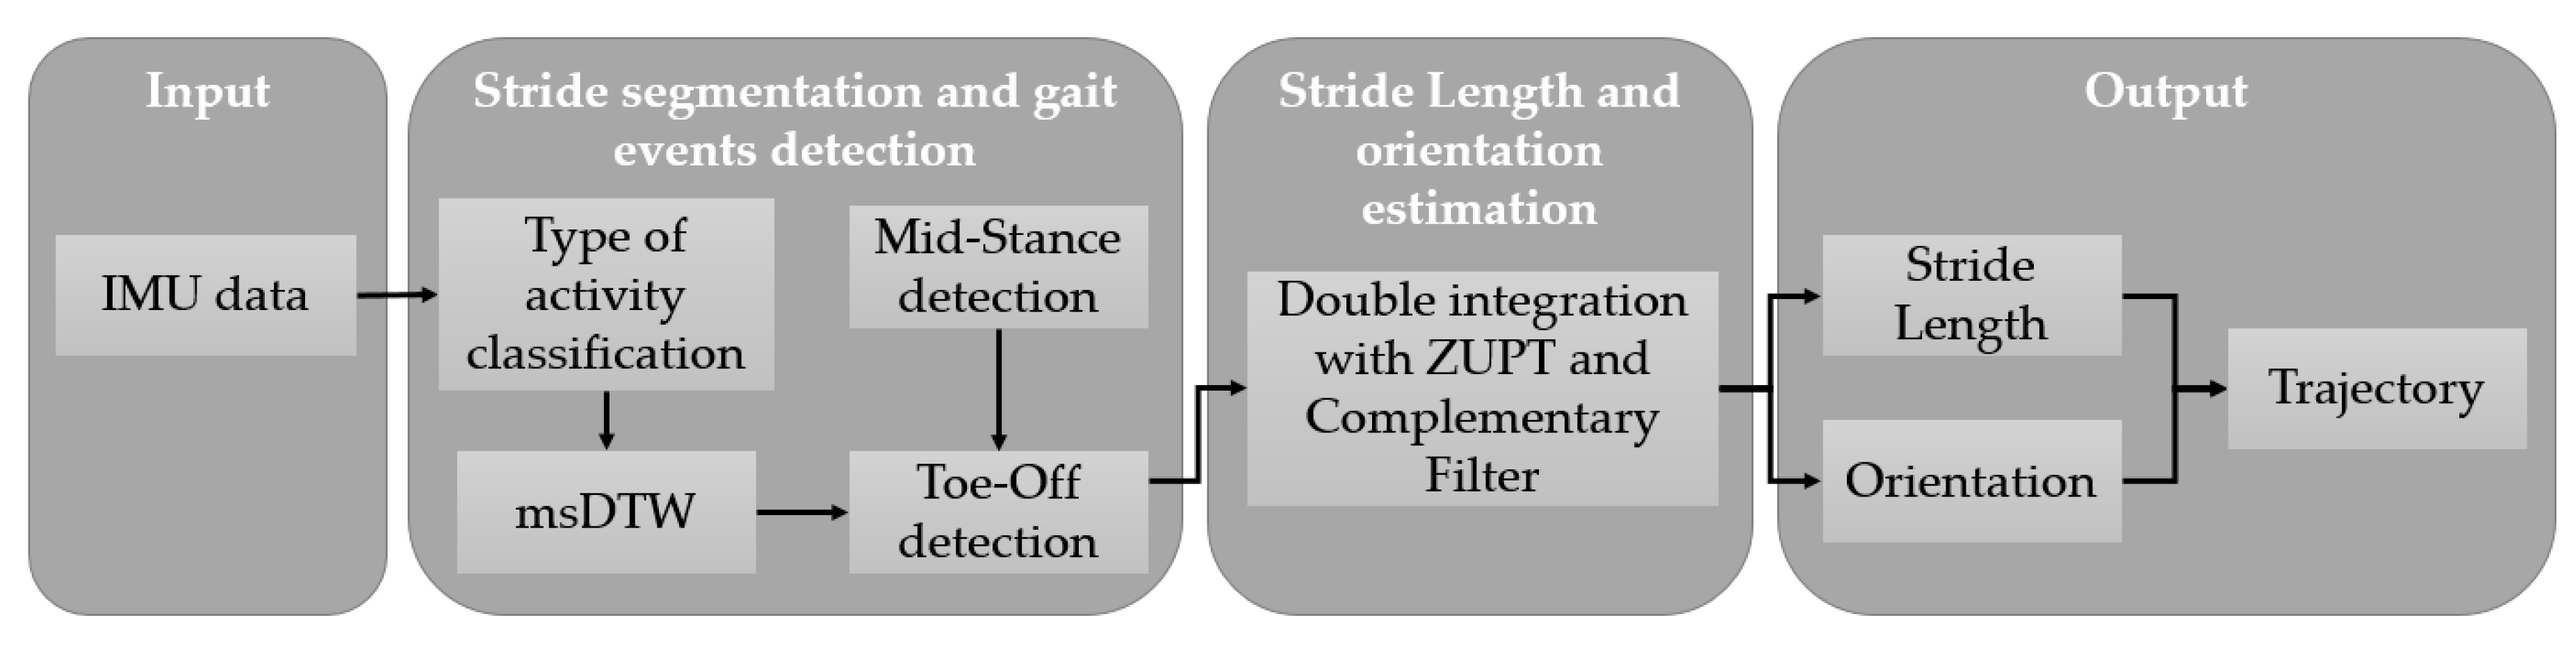
3. Methods
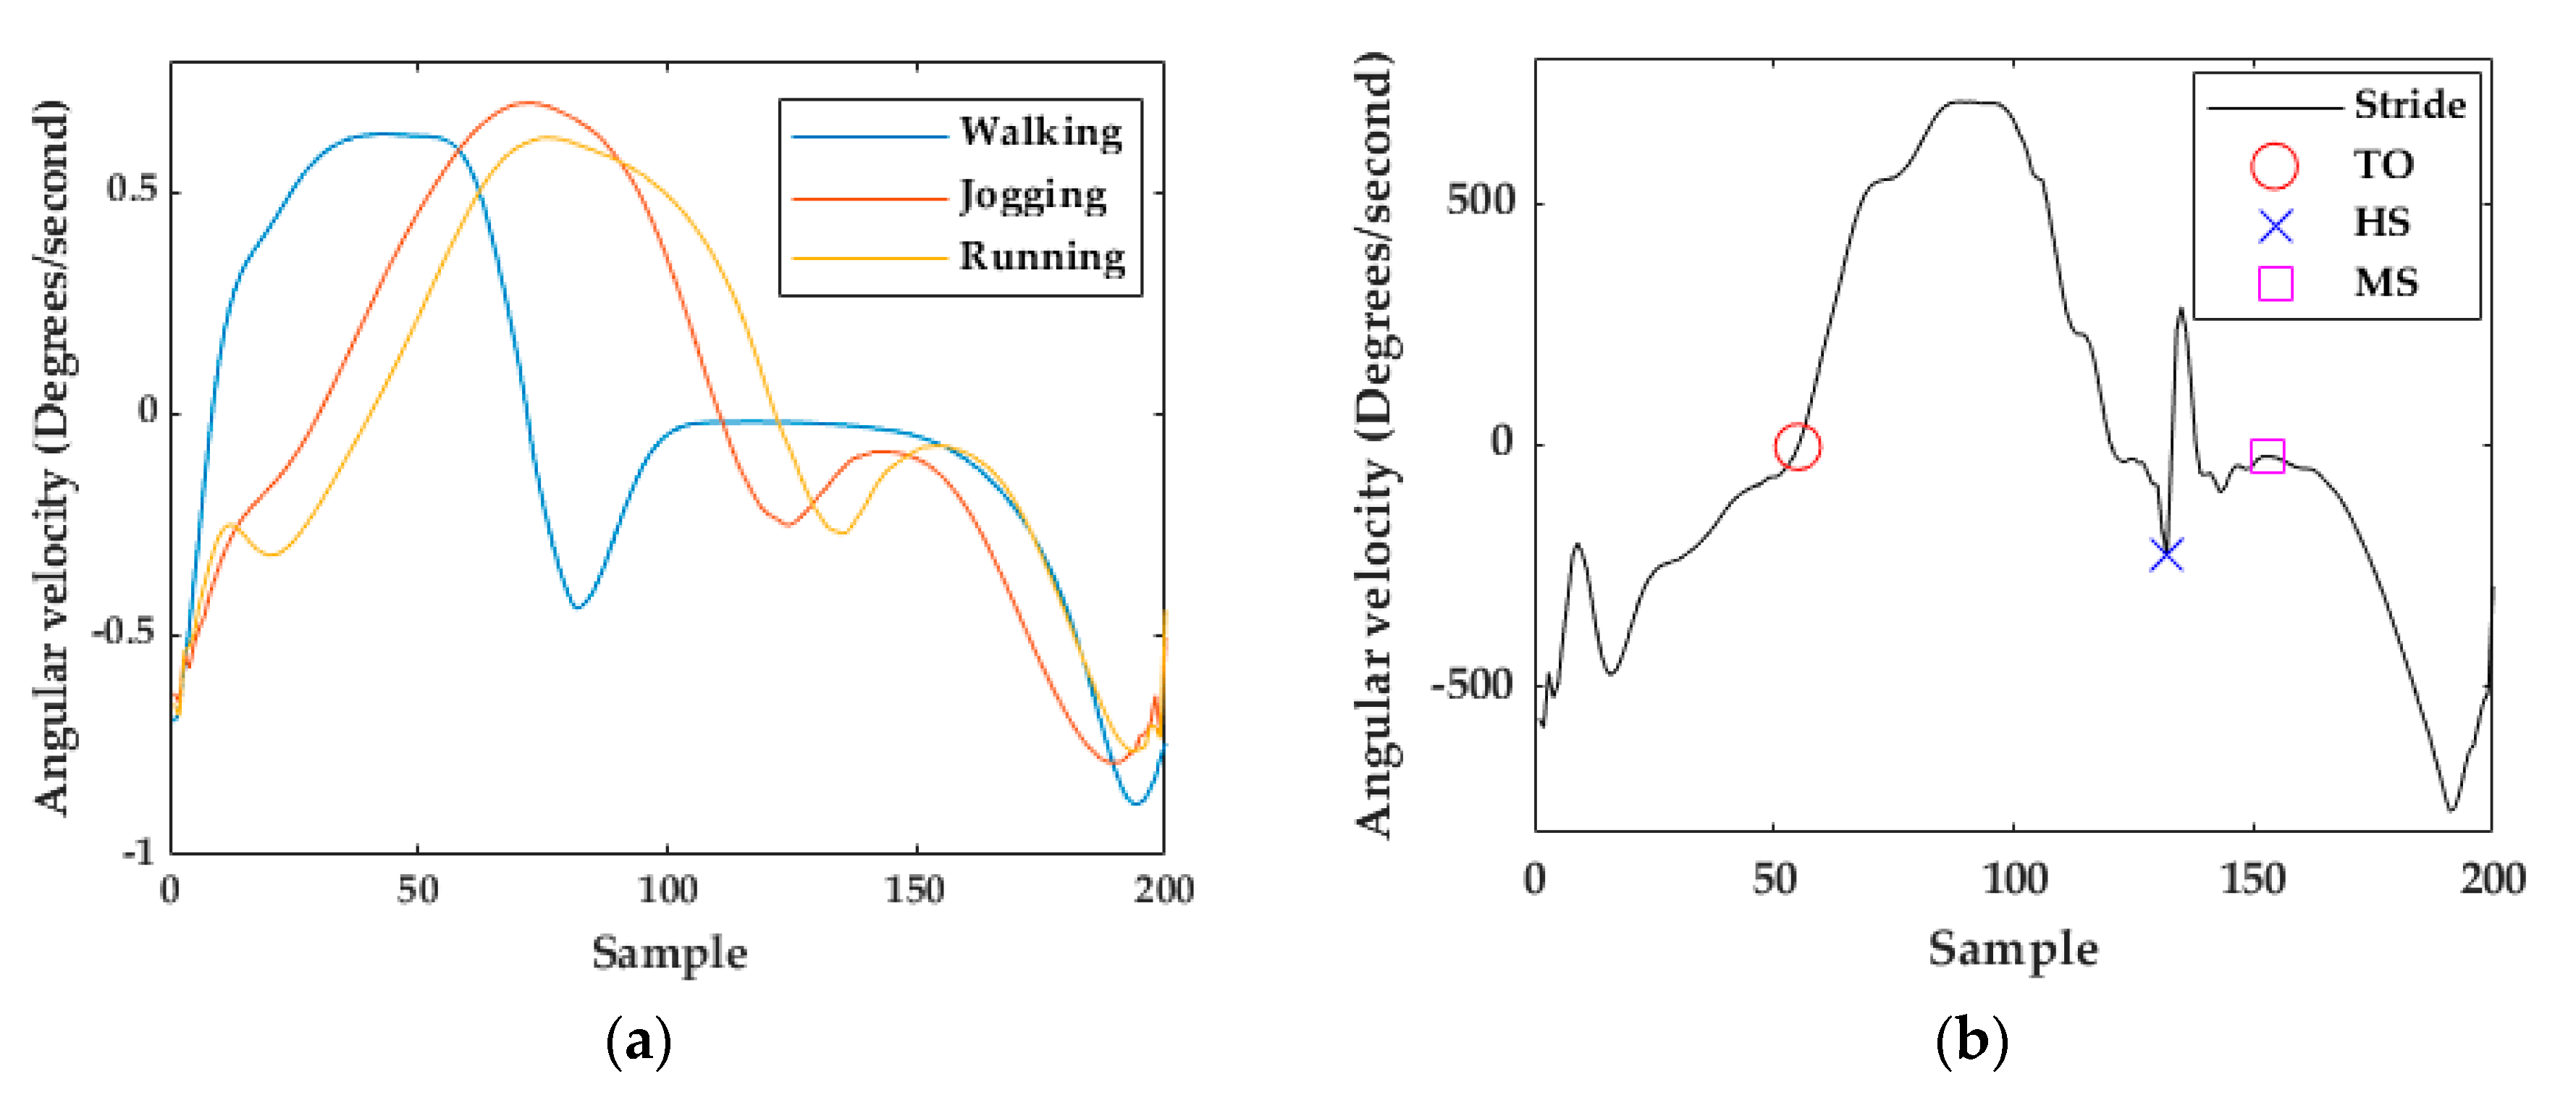
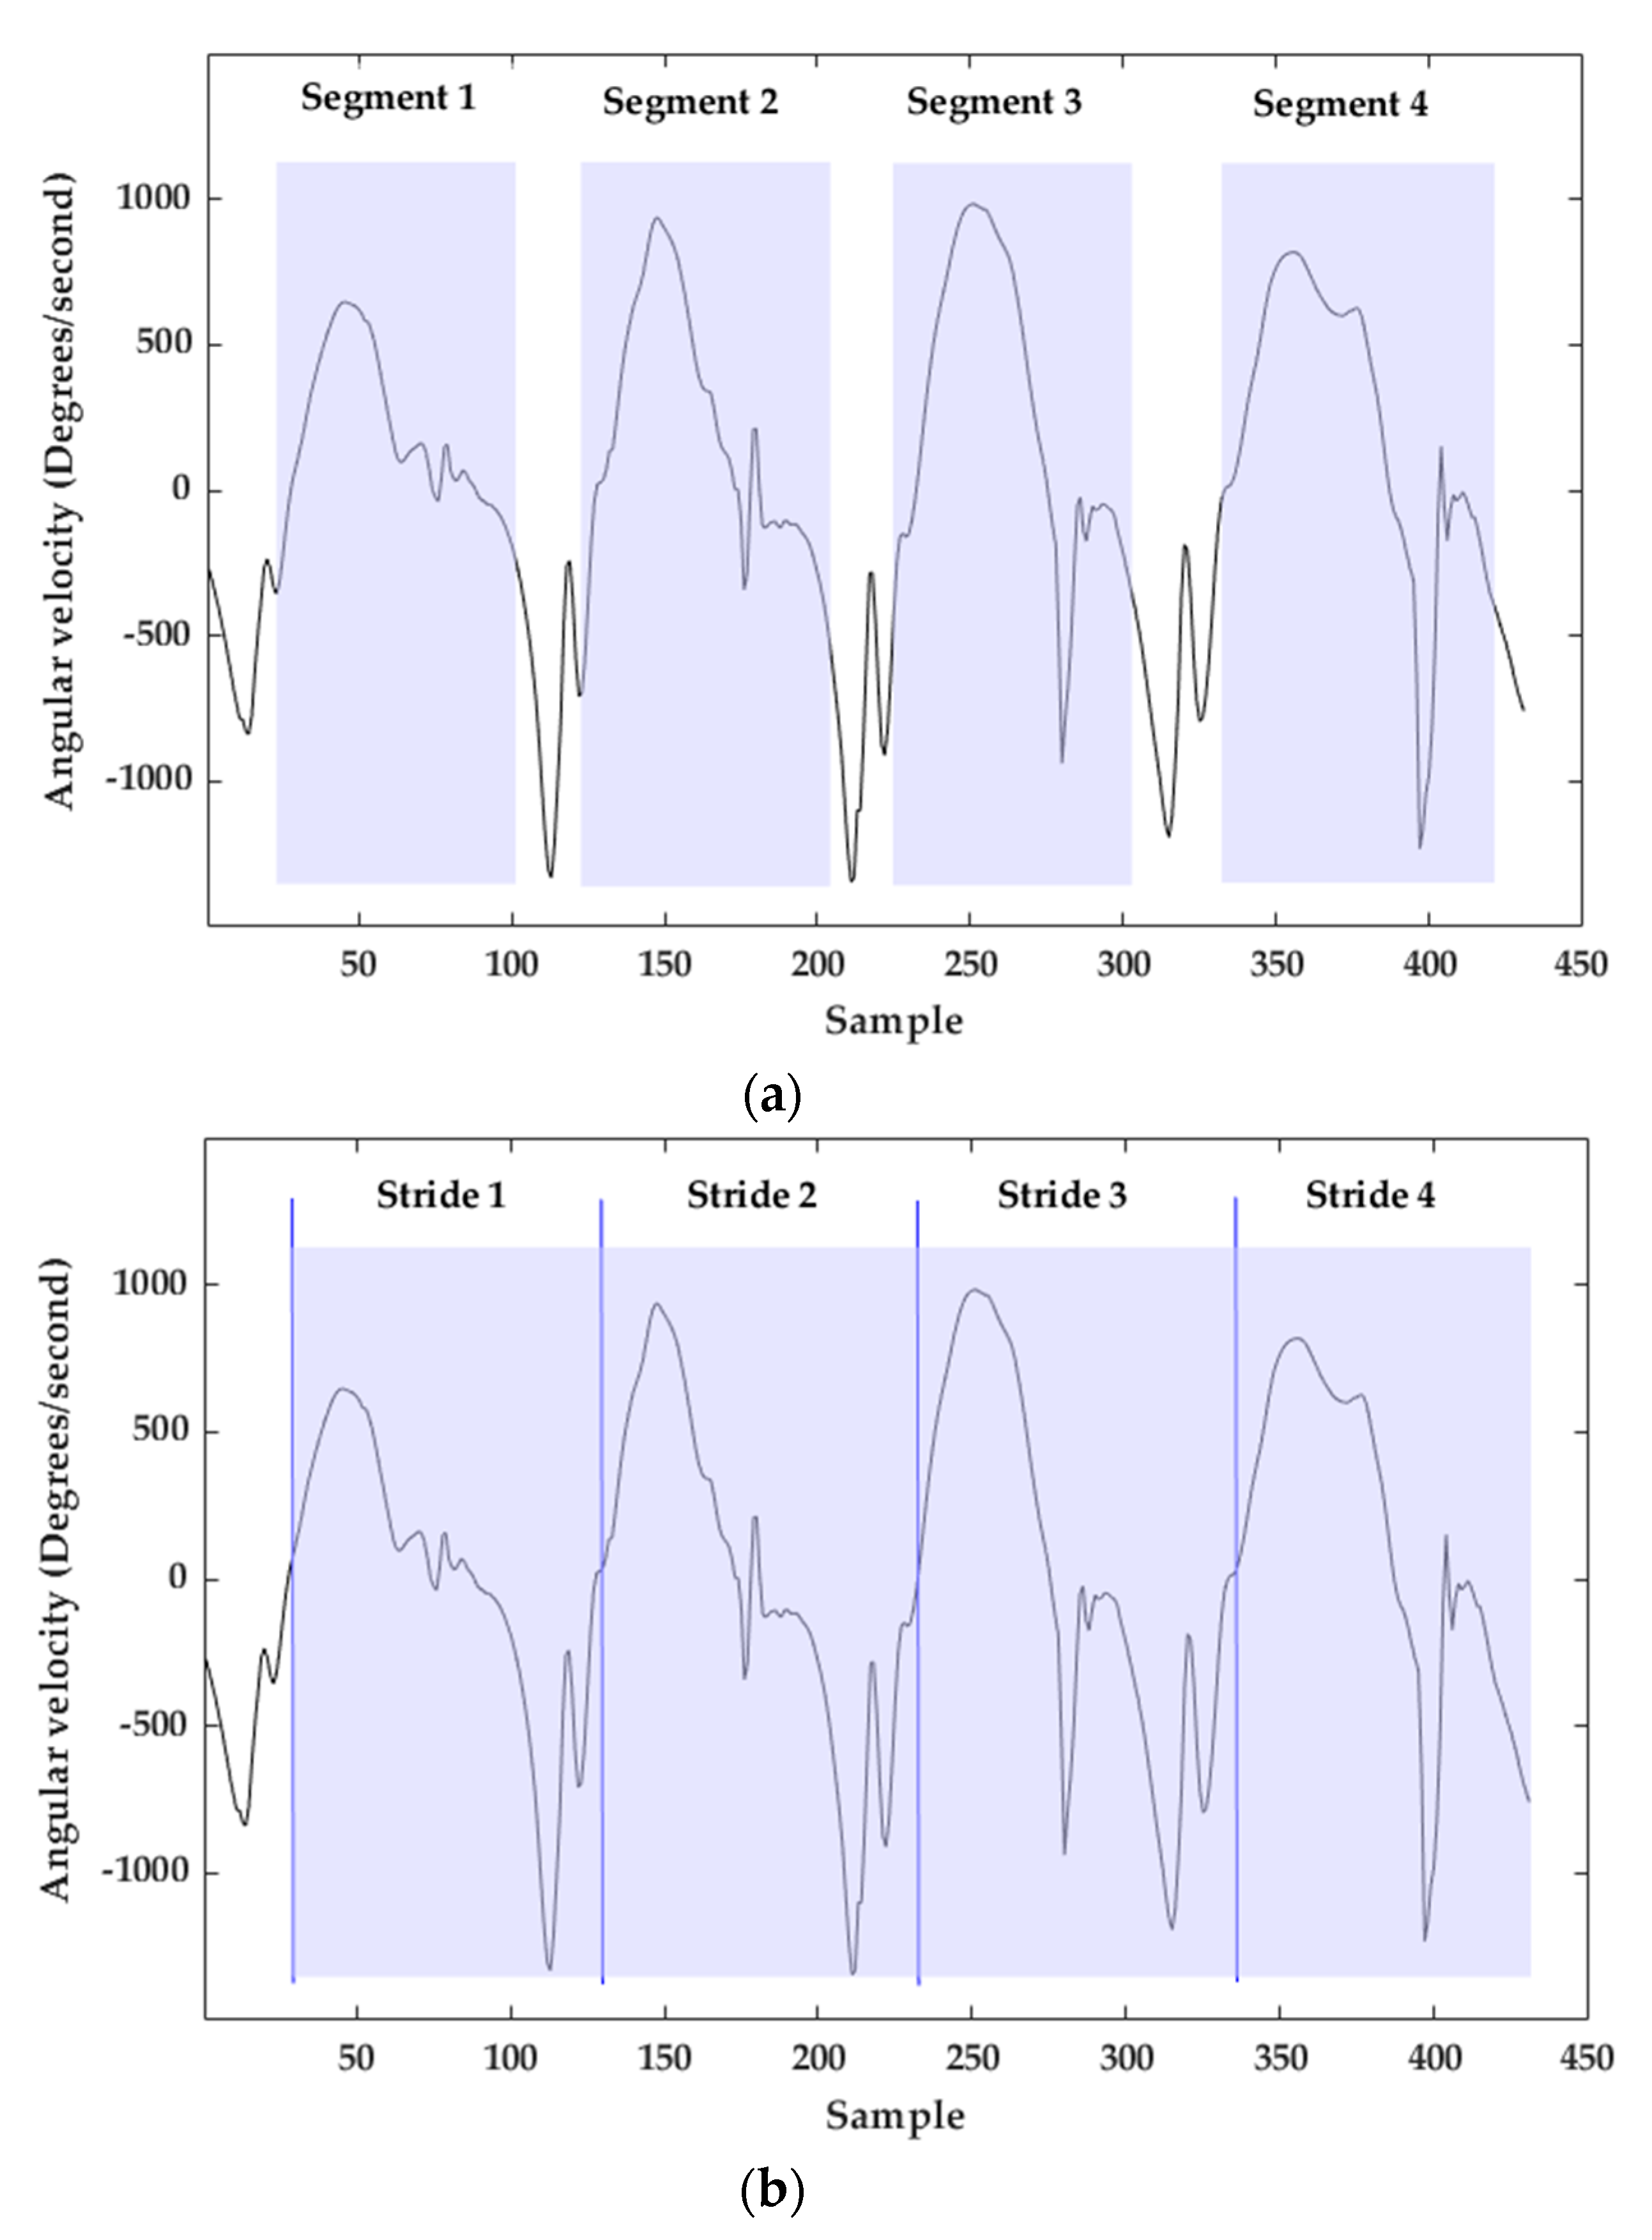
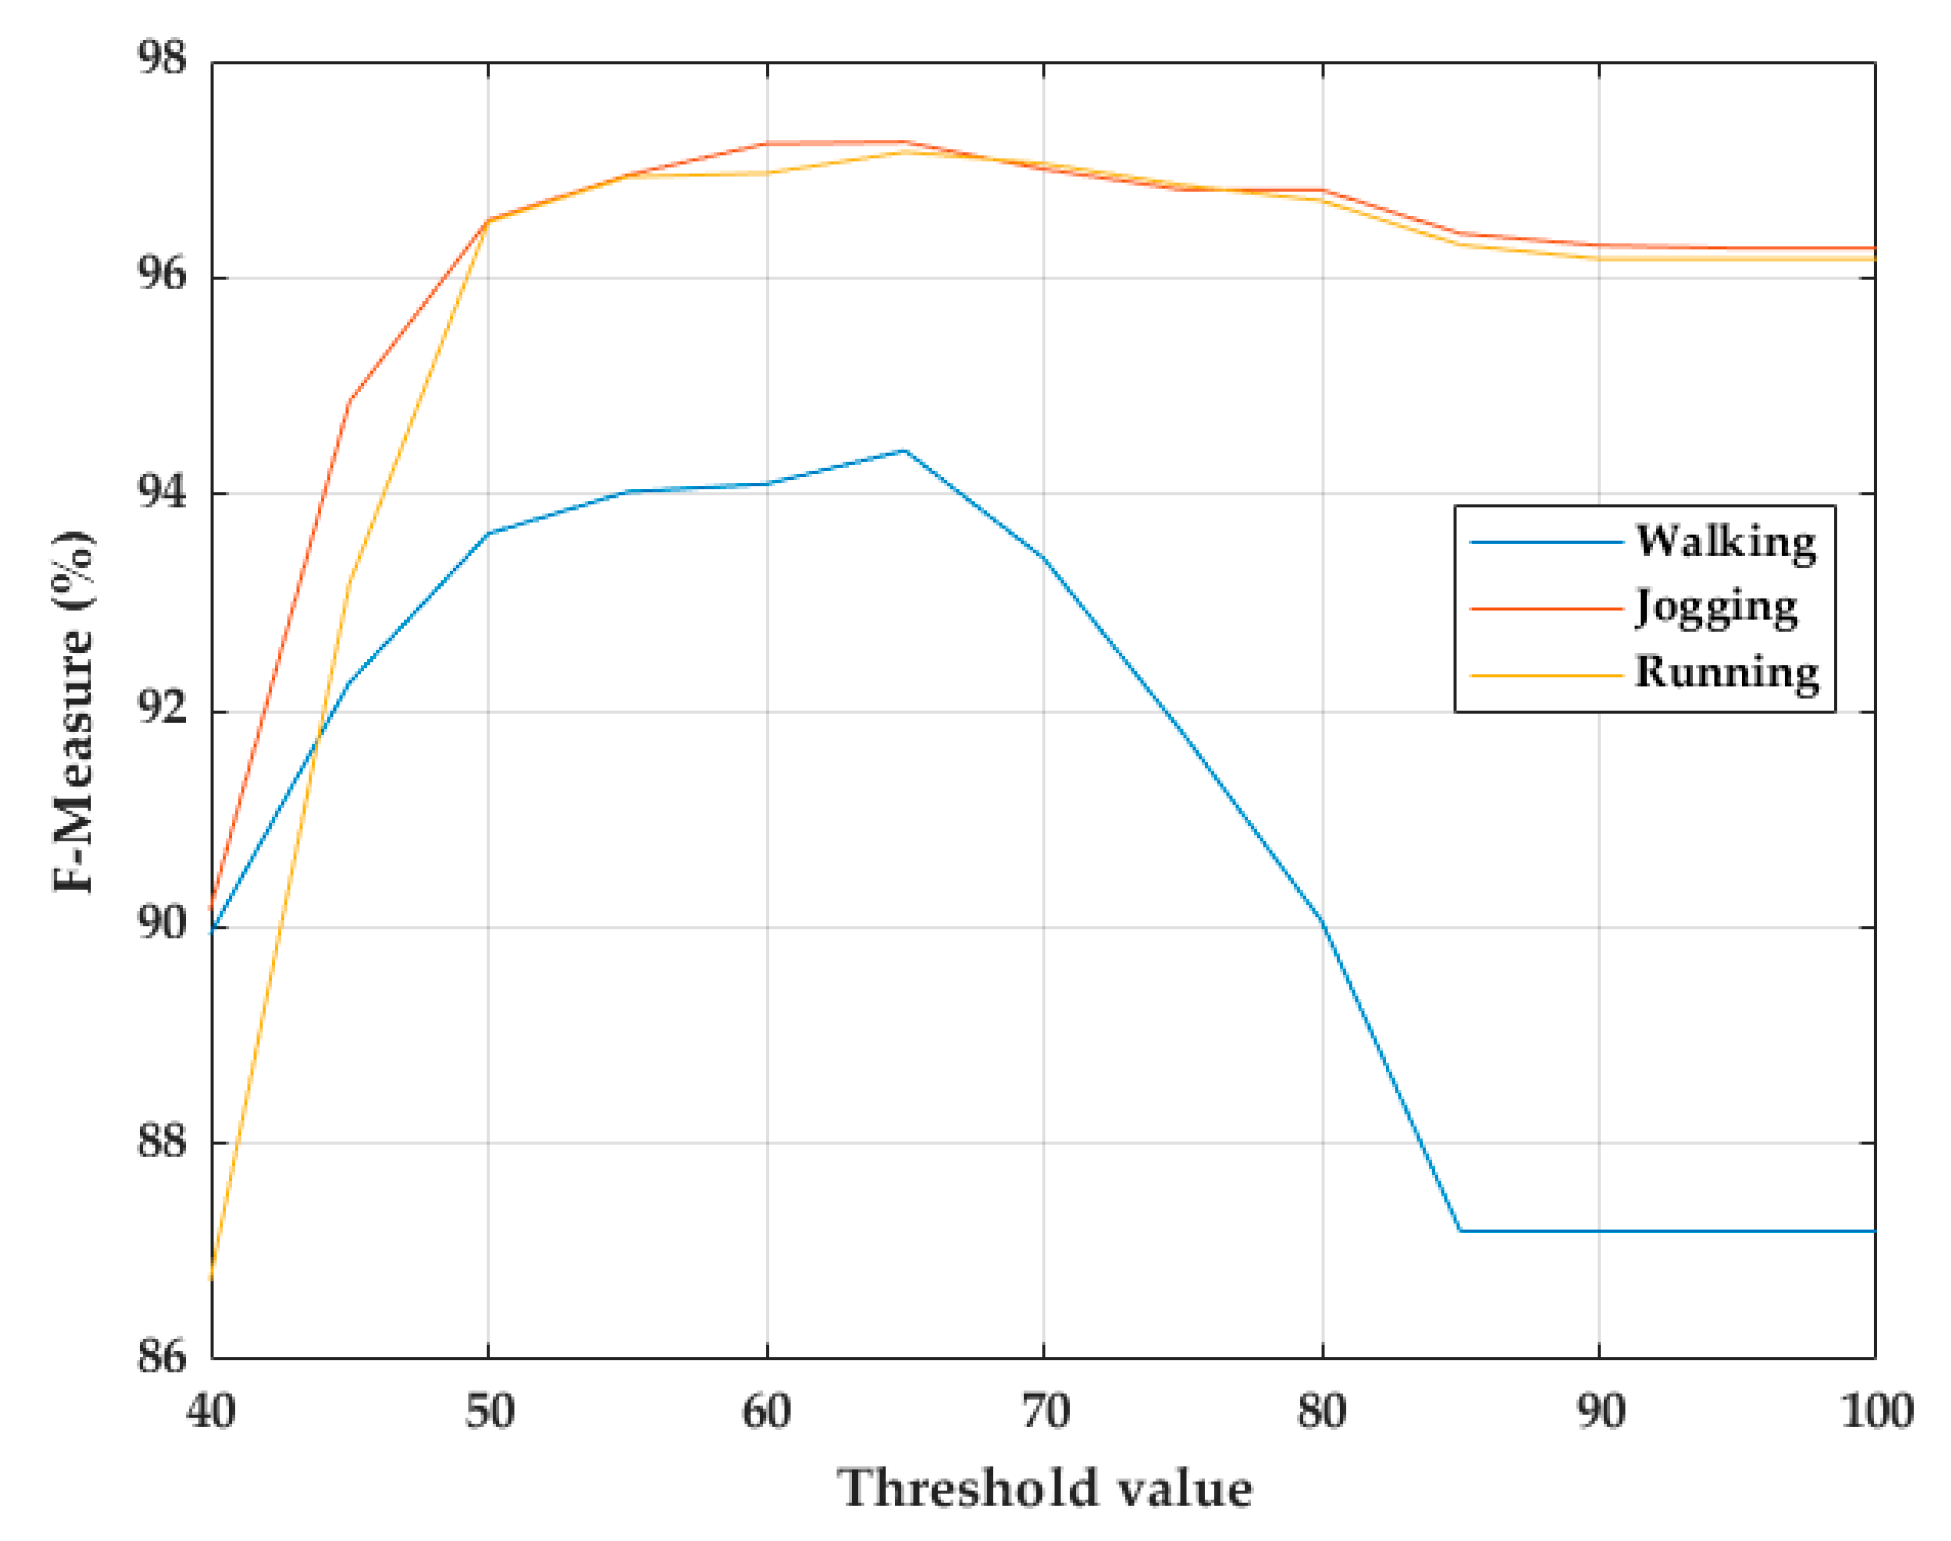
3.1. Stride Segmentation
3.1.1. Template Generation
3.1.2. Classification of Walking, Jogging, and Running Activities
3.1.3. Multi-Subsequence Dynamic Time Warping Implementation
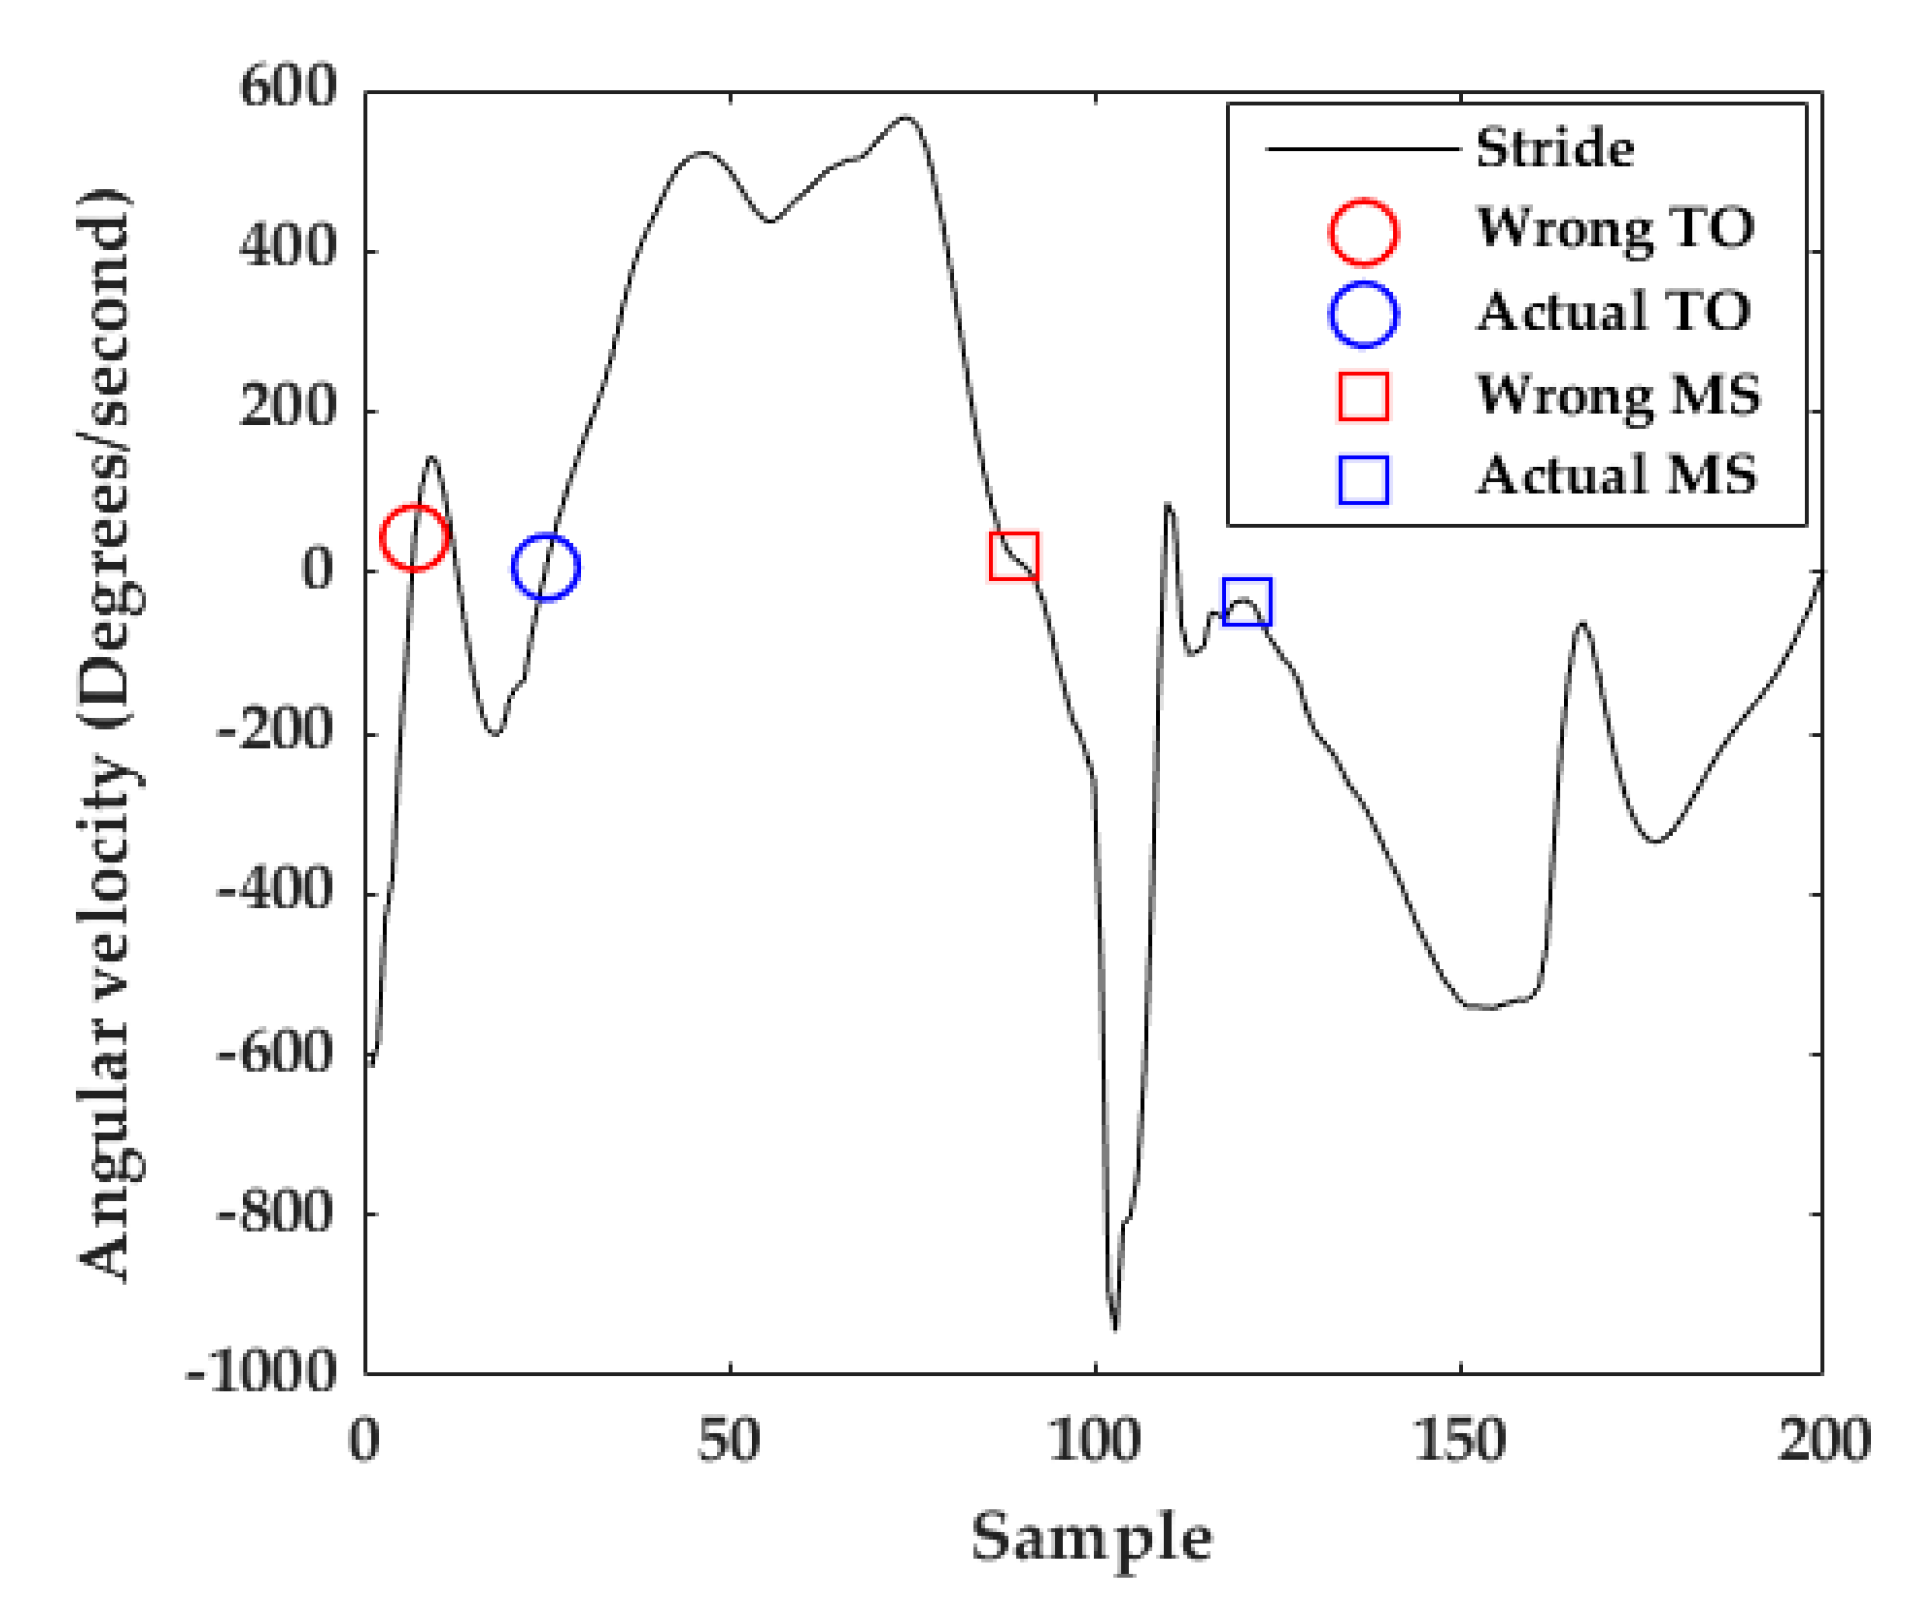
3.2. Toe-Off and Mid-Stance Detection
3.2.1. To Detection
| Algorithm 1: Toe-off (TO) detection algorithm. |
| 1: xMP ← getMaximumPeak(stride) 2: xZC ← getZeroCrossings(stride(1 : xMP)) 3: TO ← getNearestZCtoMP(xZC, xMP) |
3.2.2. Mid-Stance Detection
| Algorithm 2: Mid-Stance (MS) detection algorithm. |
| 1: windowSize ← 20 2: overlap ← 10 3: stride ← interpolateStrideTo200Samples(stride) 4: xMP ← getMaximumPeak(stride) 5: stride ← stride(xMP : 160) 6: xHS ← getMinimumPeak(stride) 7: stride ← stride(xHS : end) 8: MS getMinimumEnergy(stride, windowSize, overlap) |
3.2.3. Stride Length and Orientation Estimation
4. Results
4.1. Unicauca Dataset
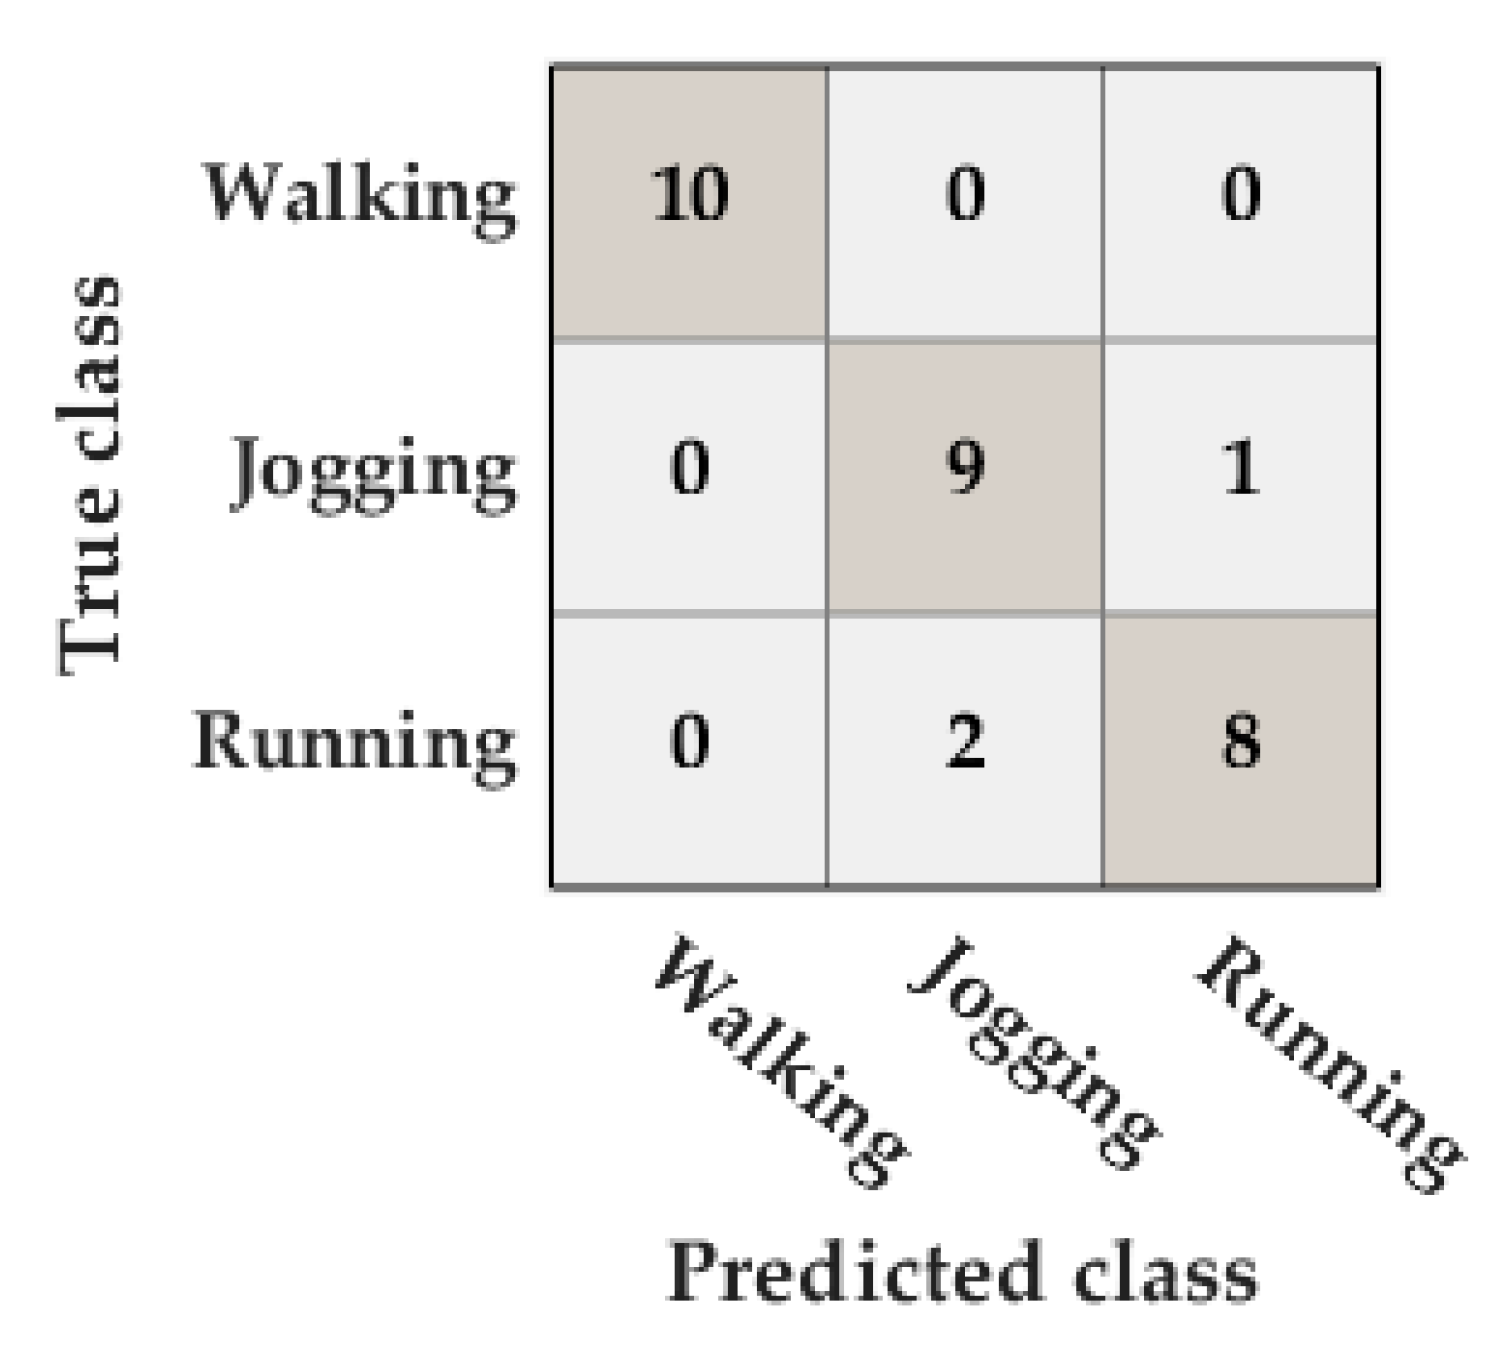
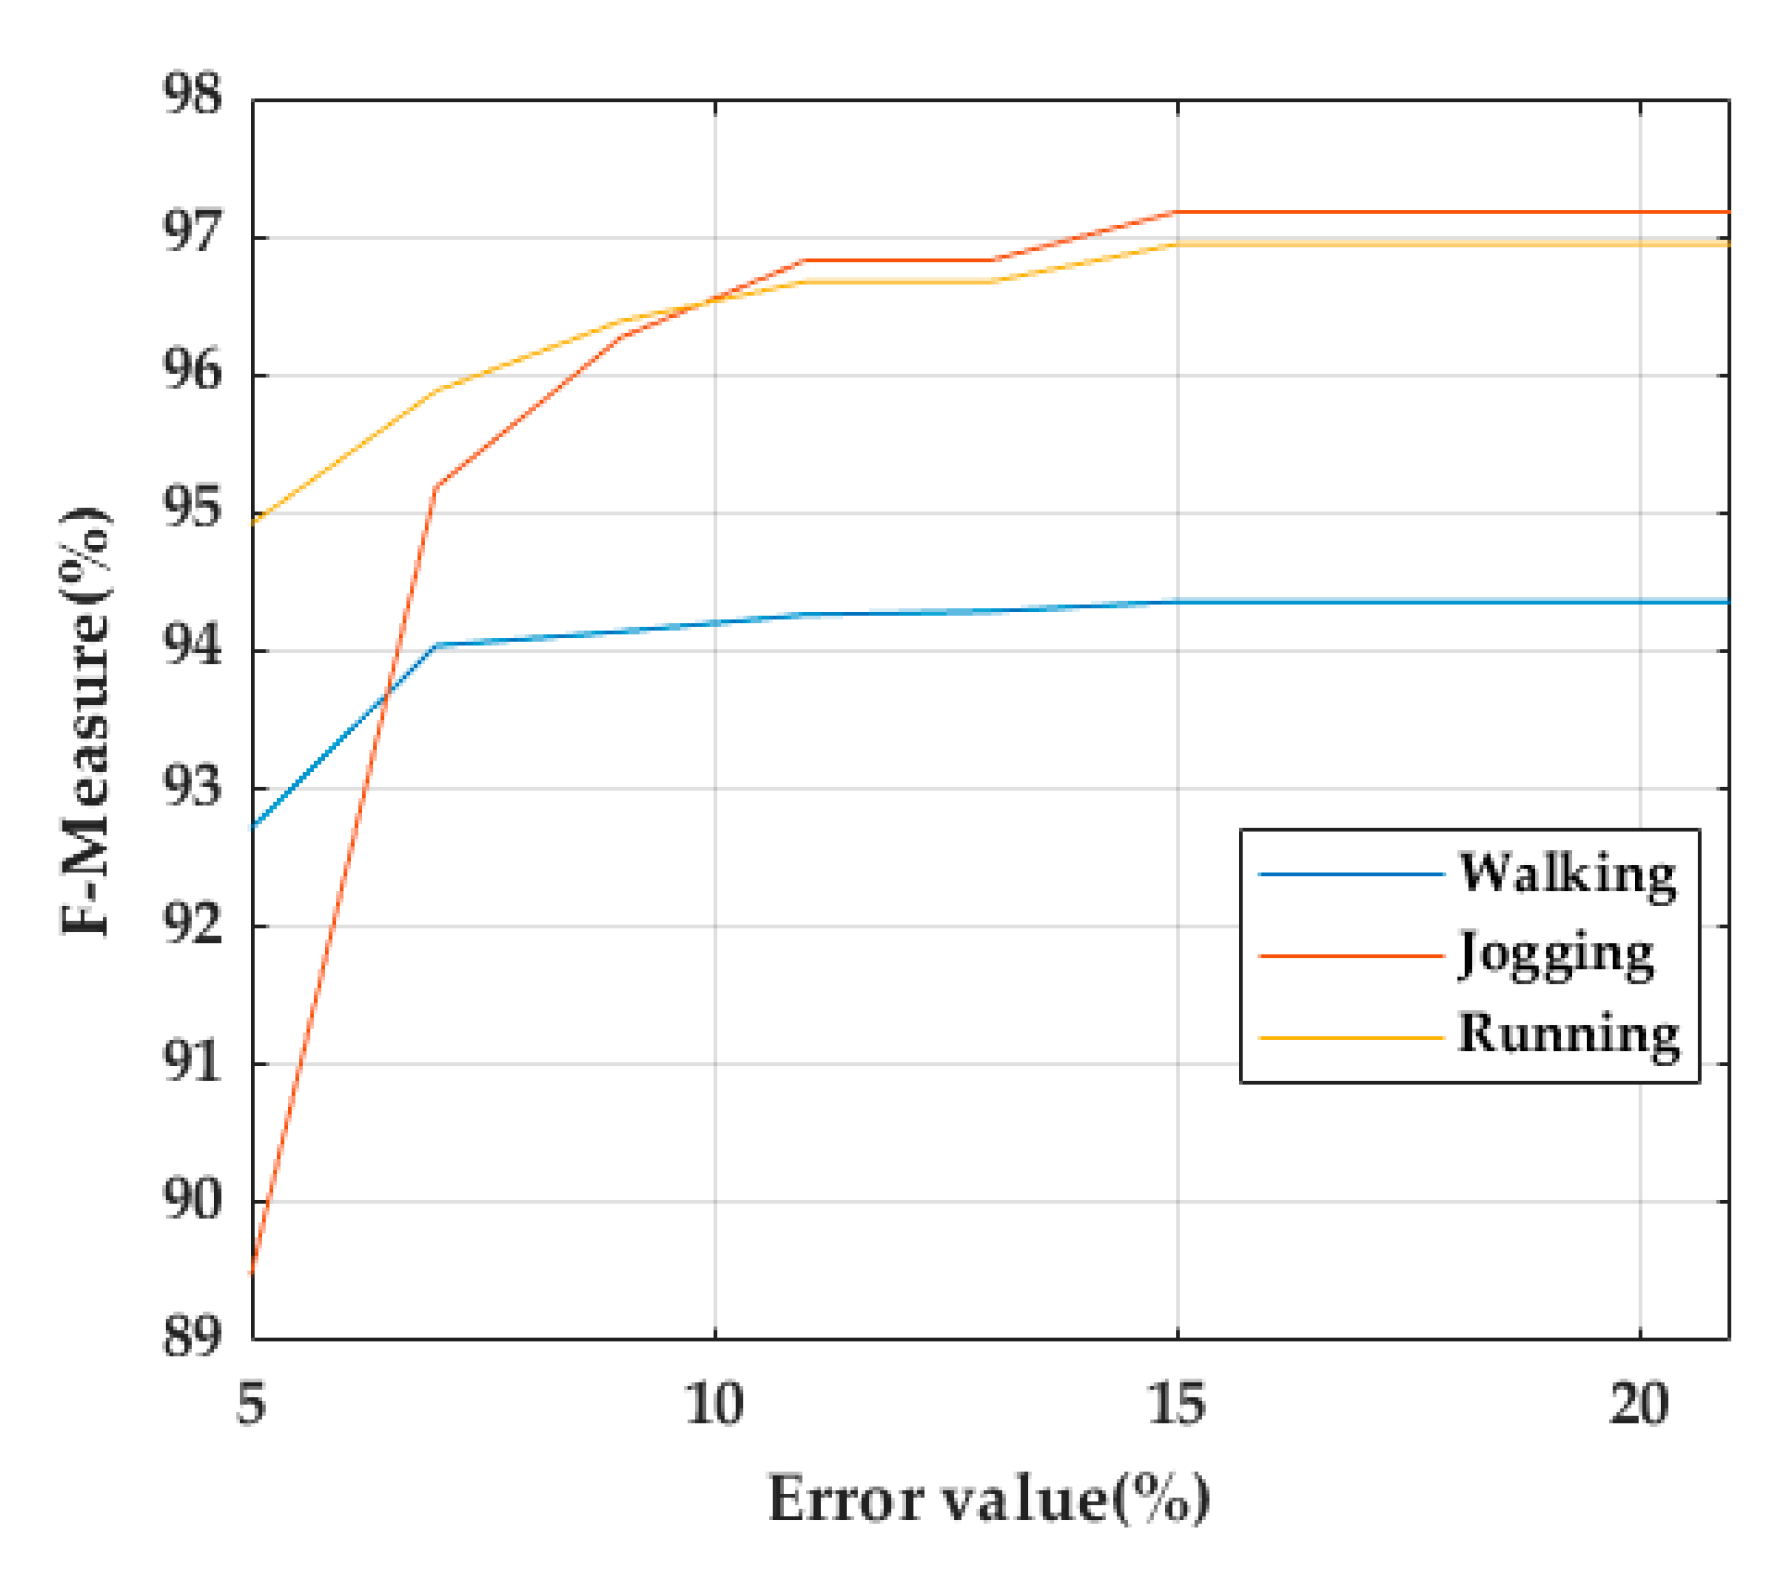
4.1.1. Classification of the Type of Activity
4.1.2. Toe-Off and Mid-Stance Detection
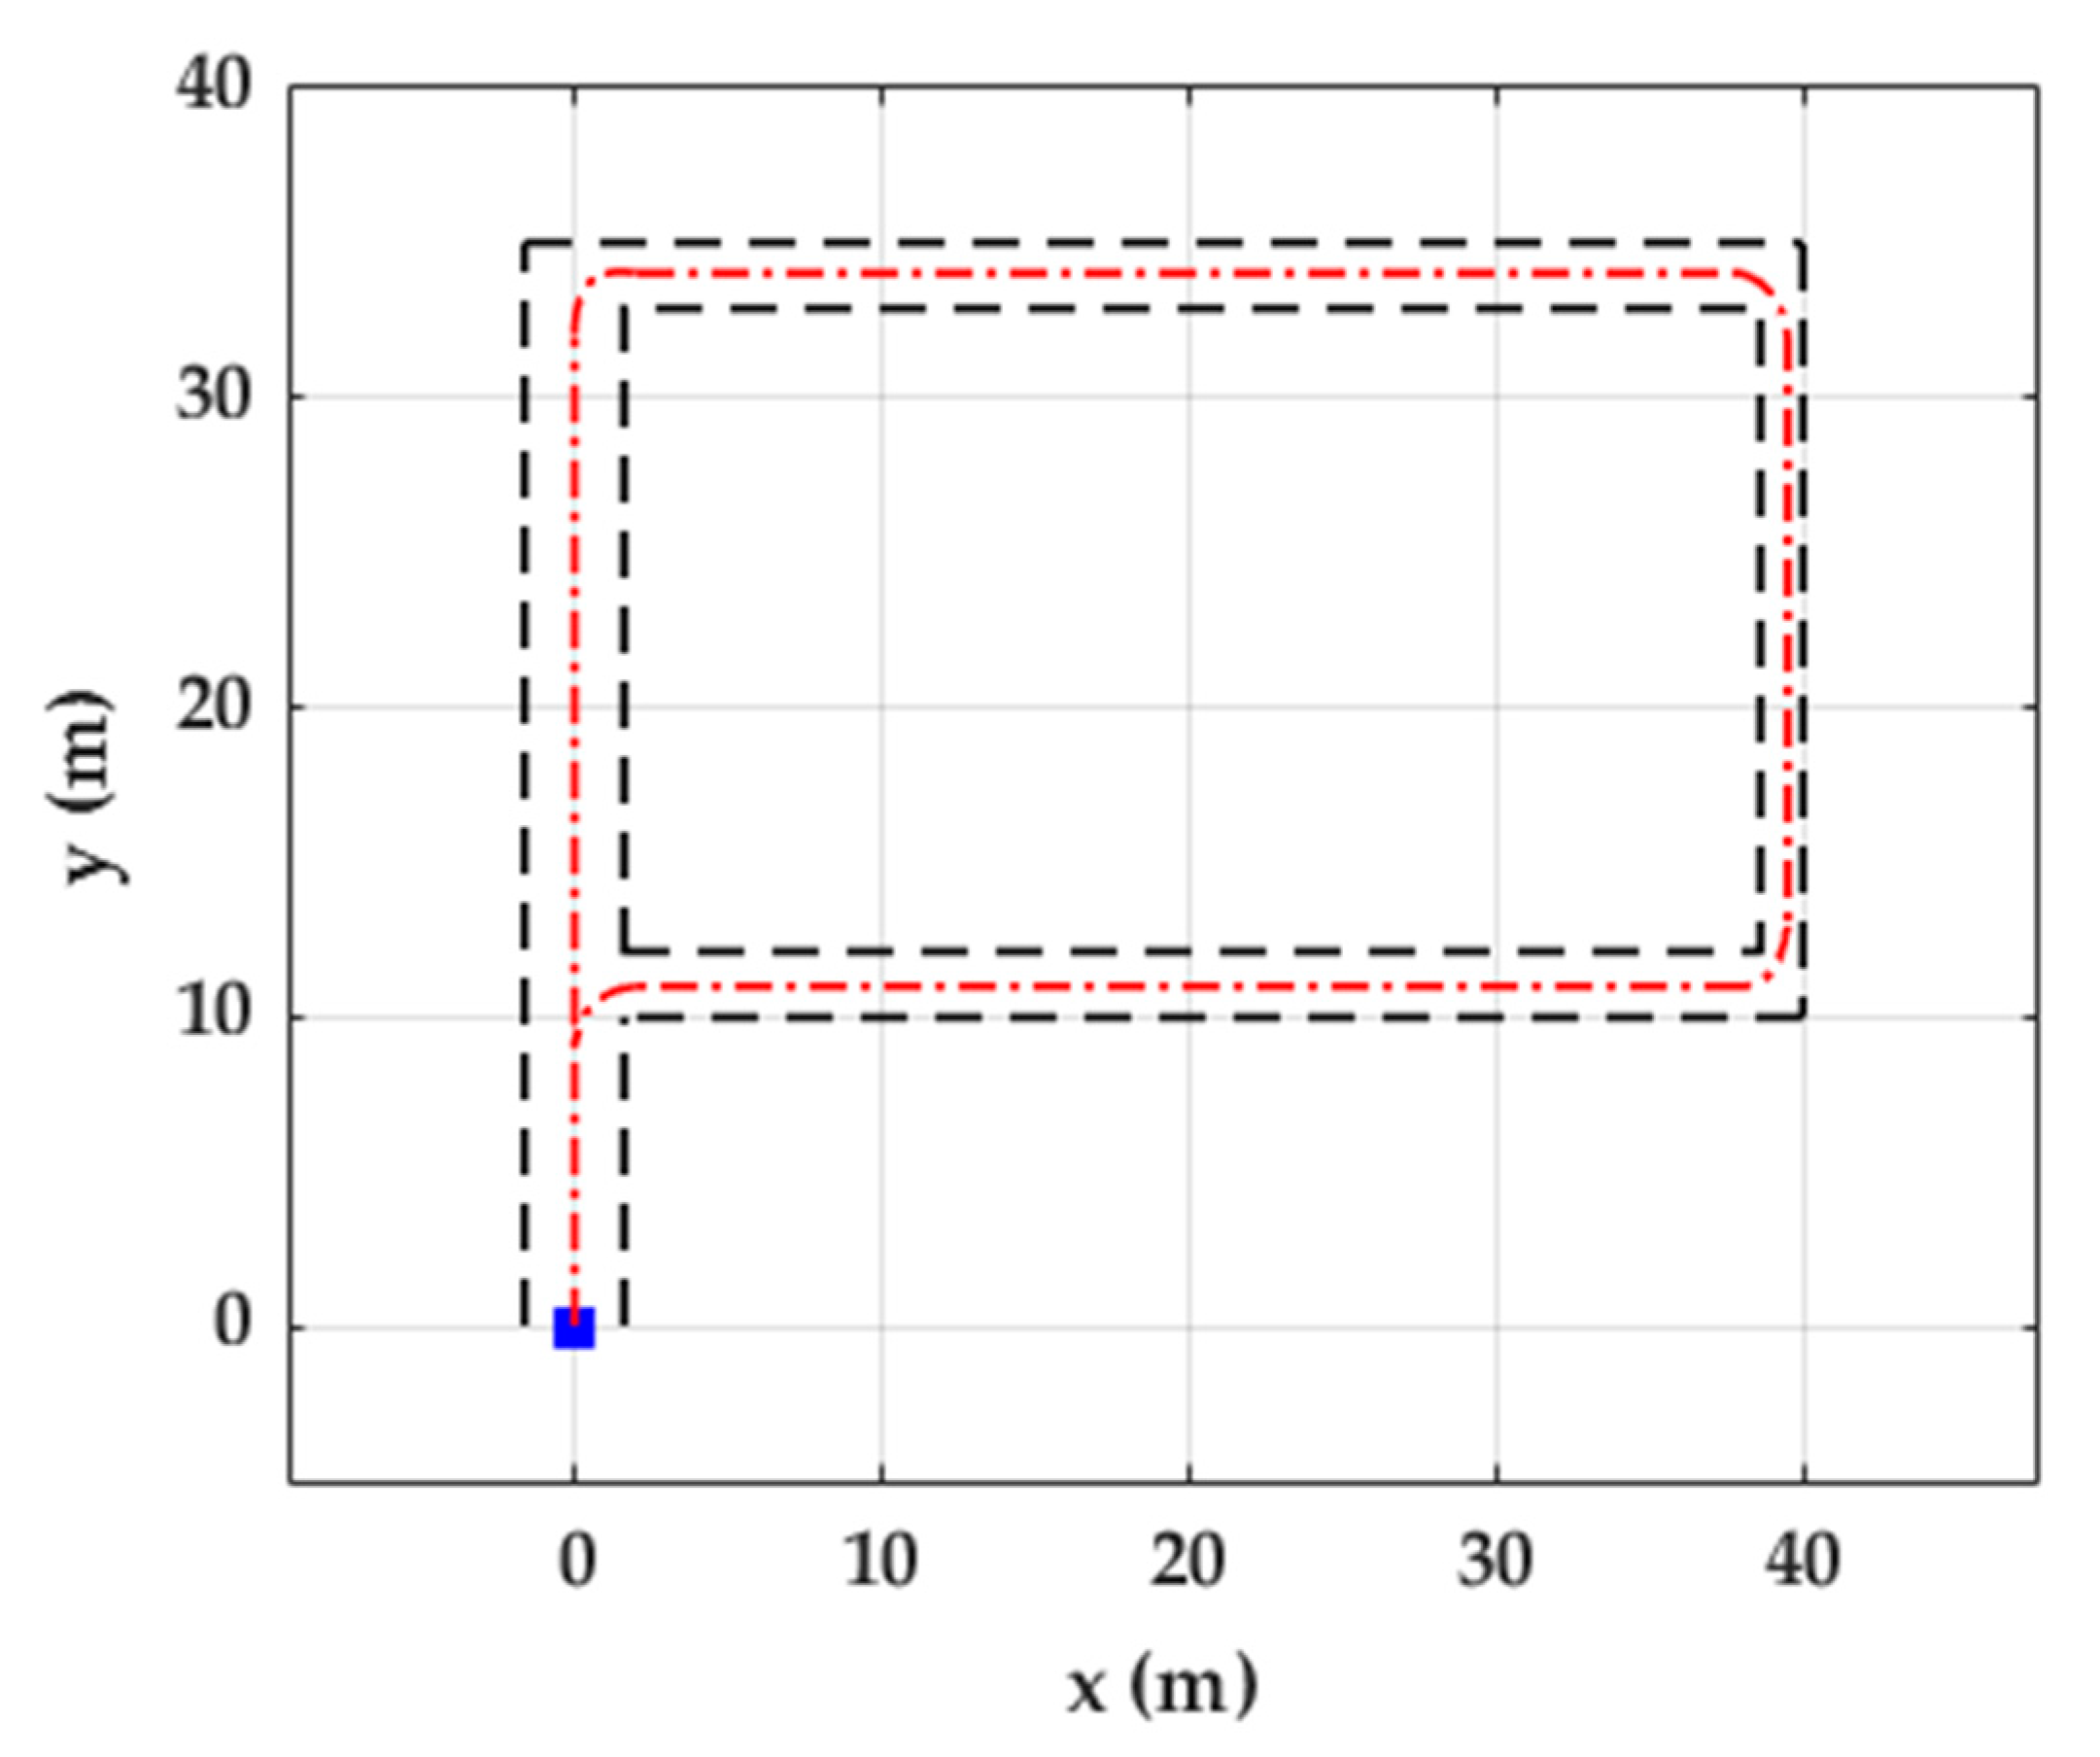
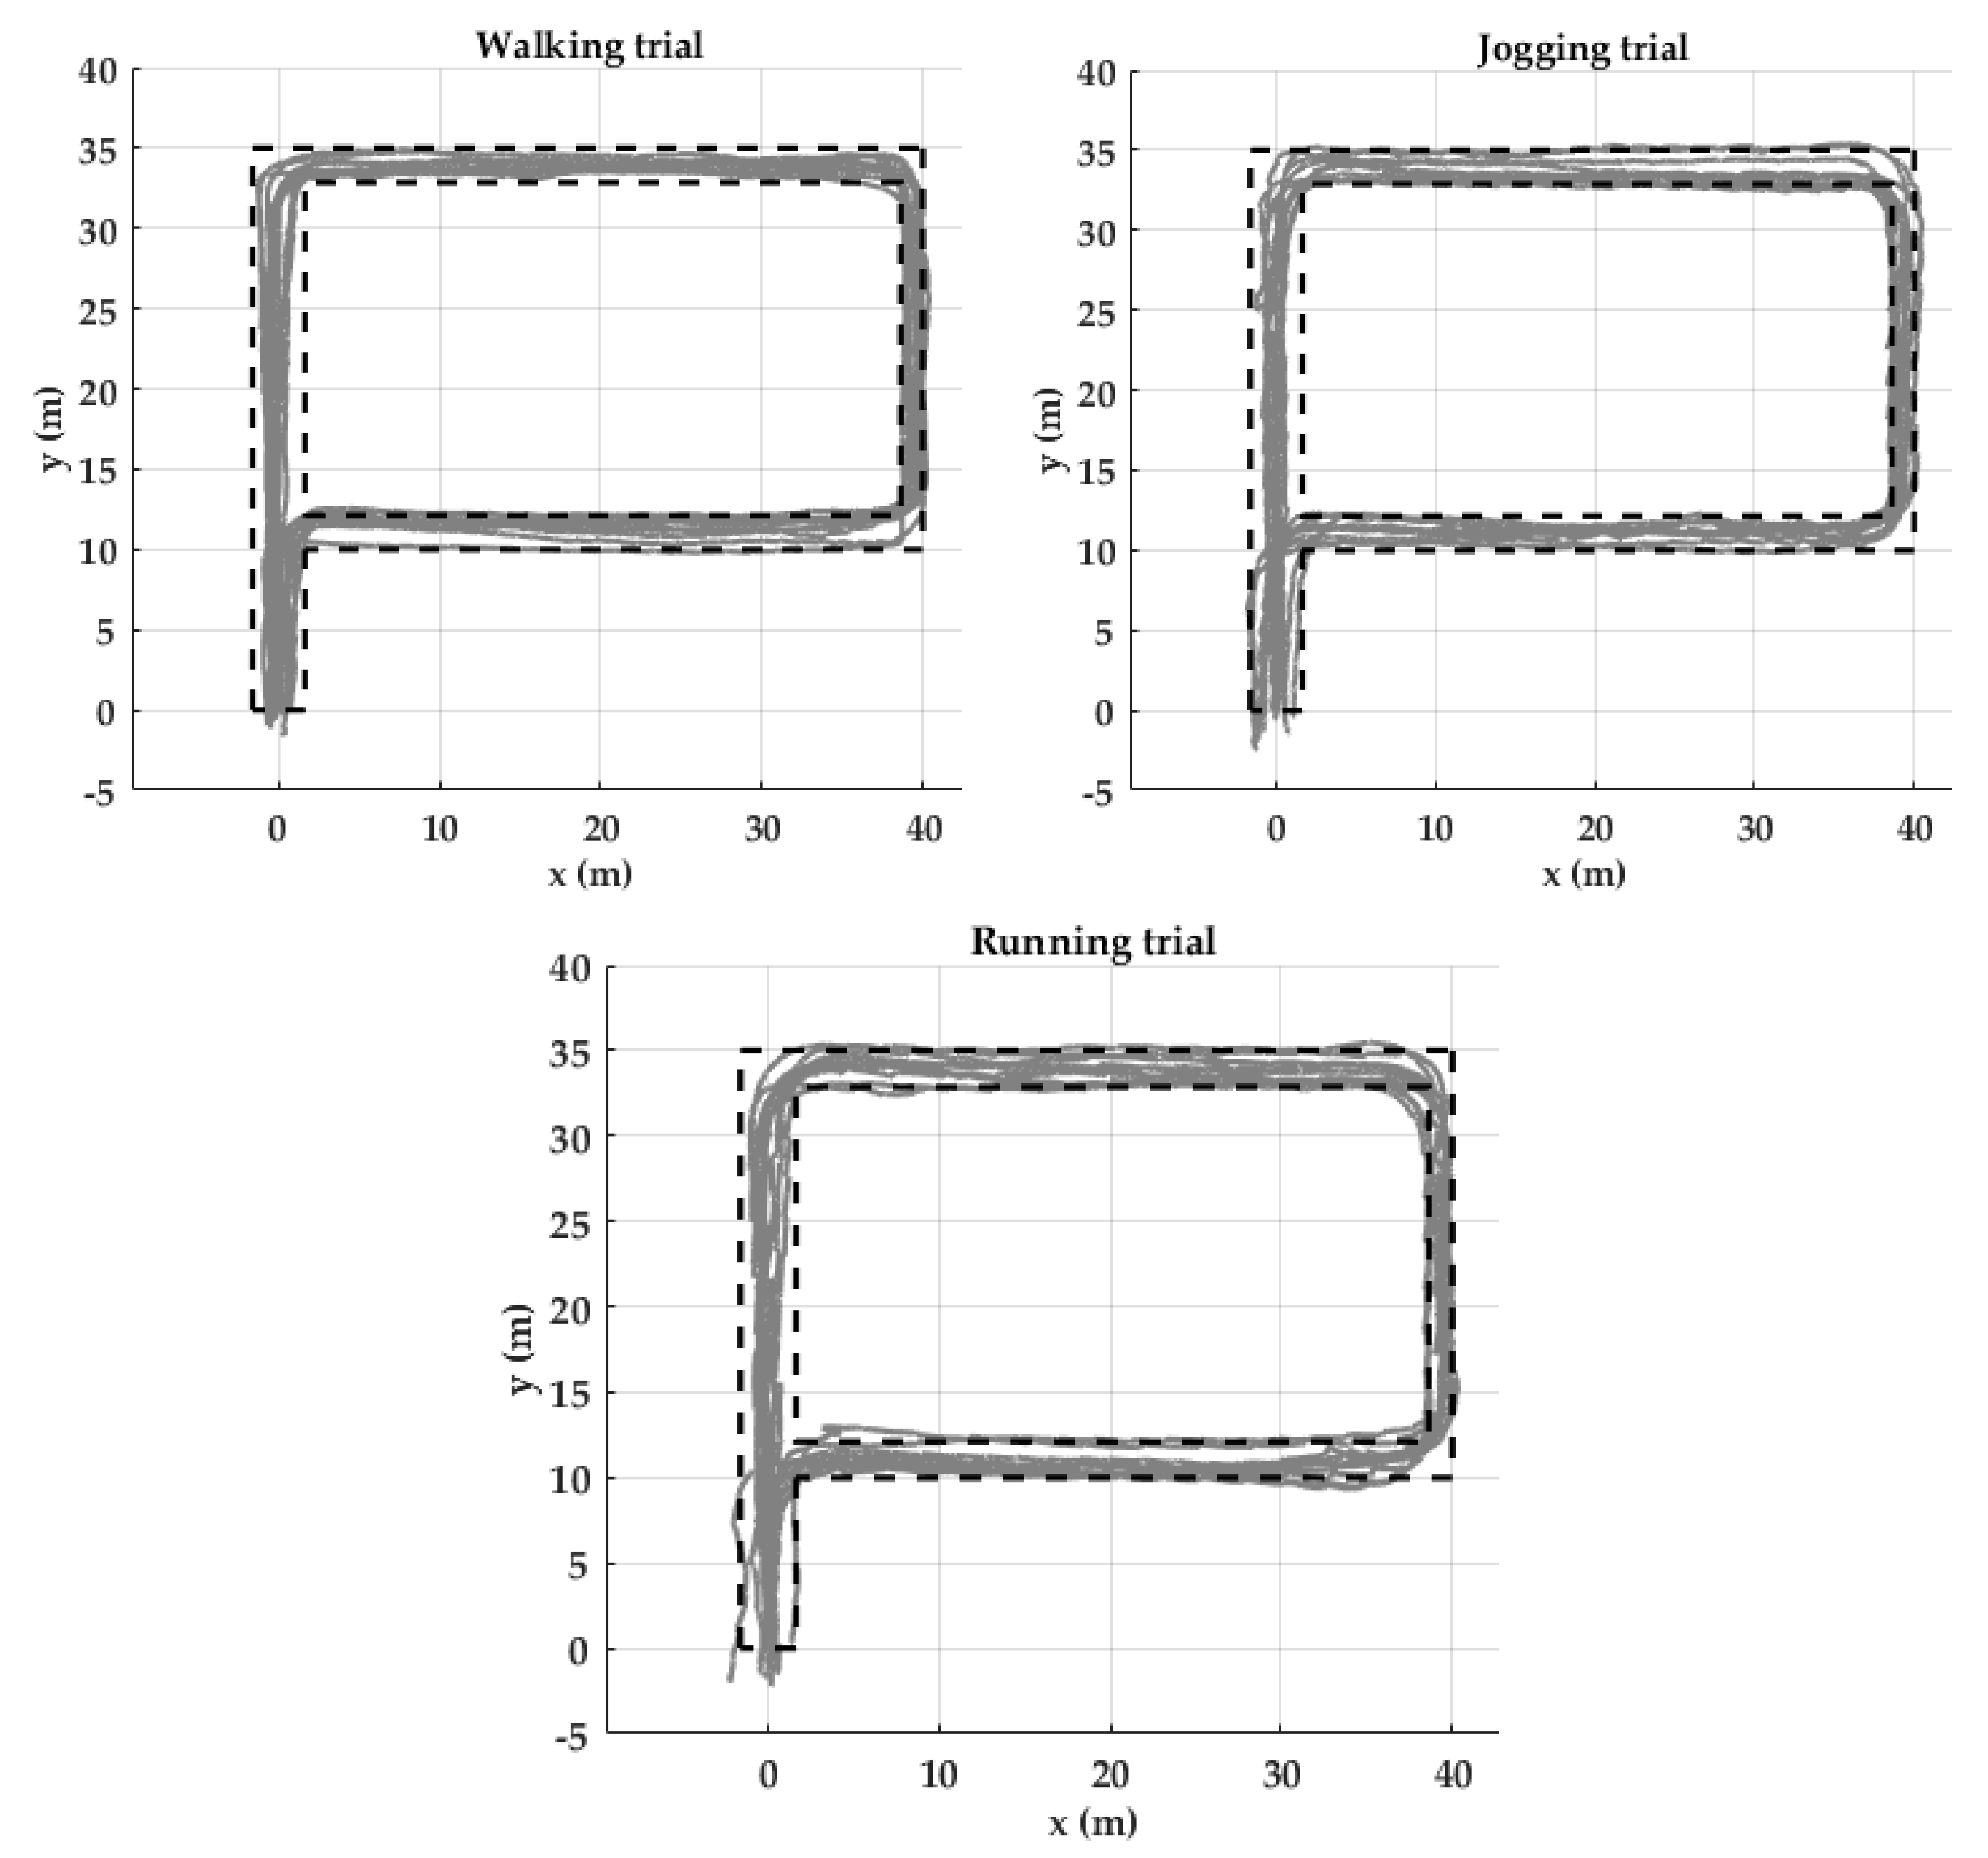
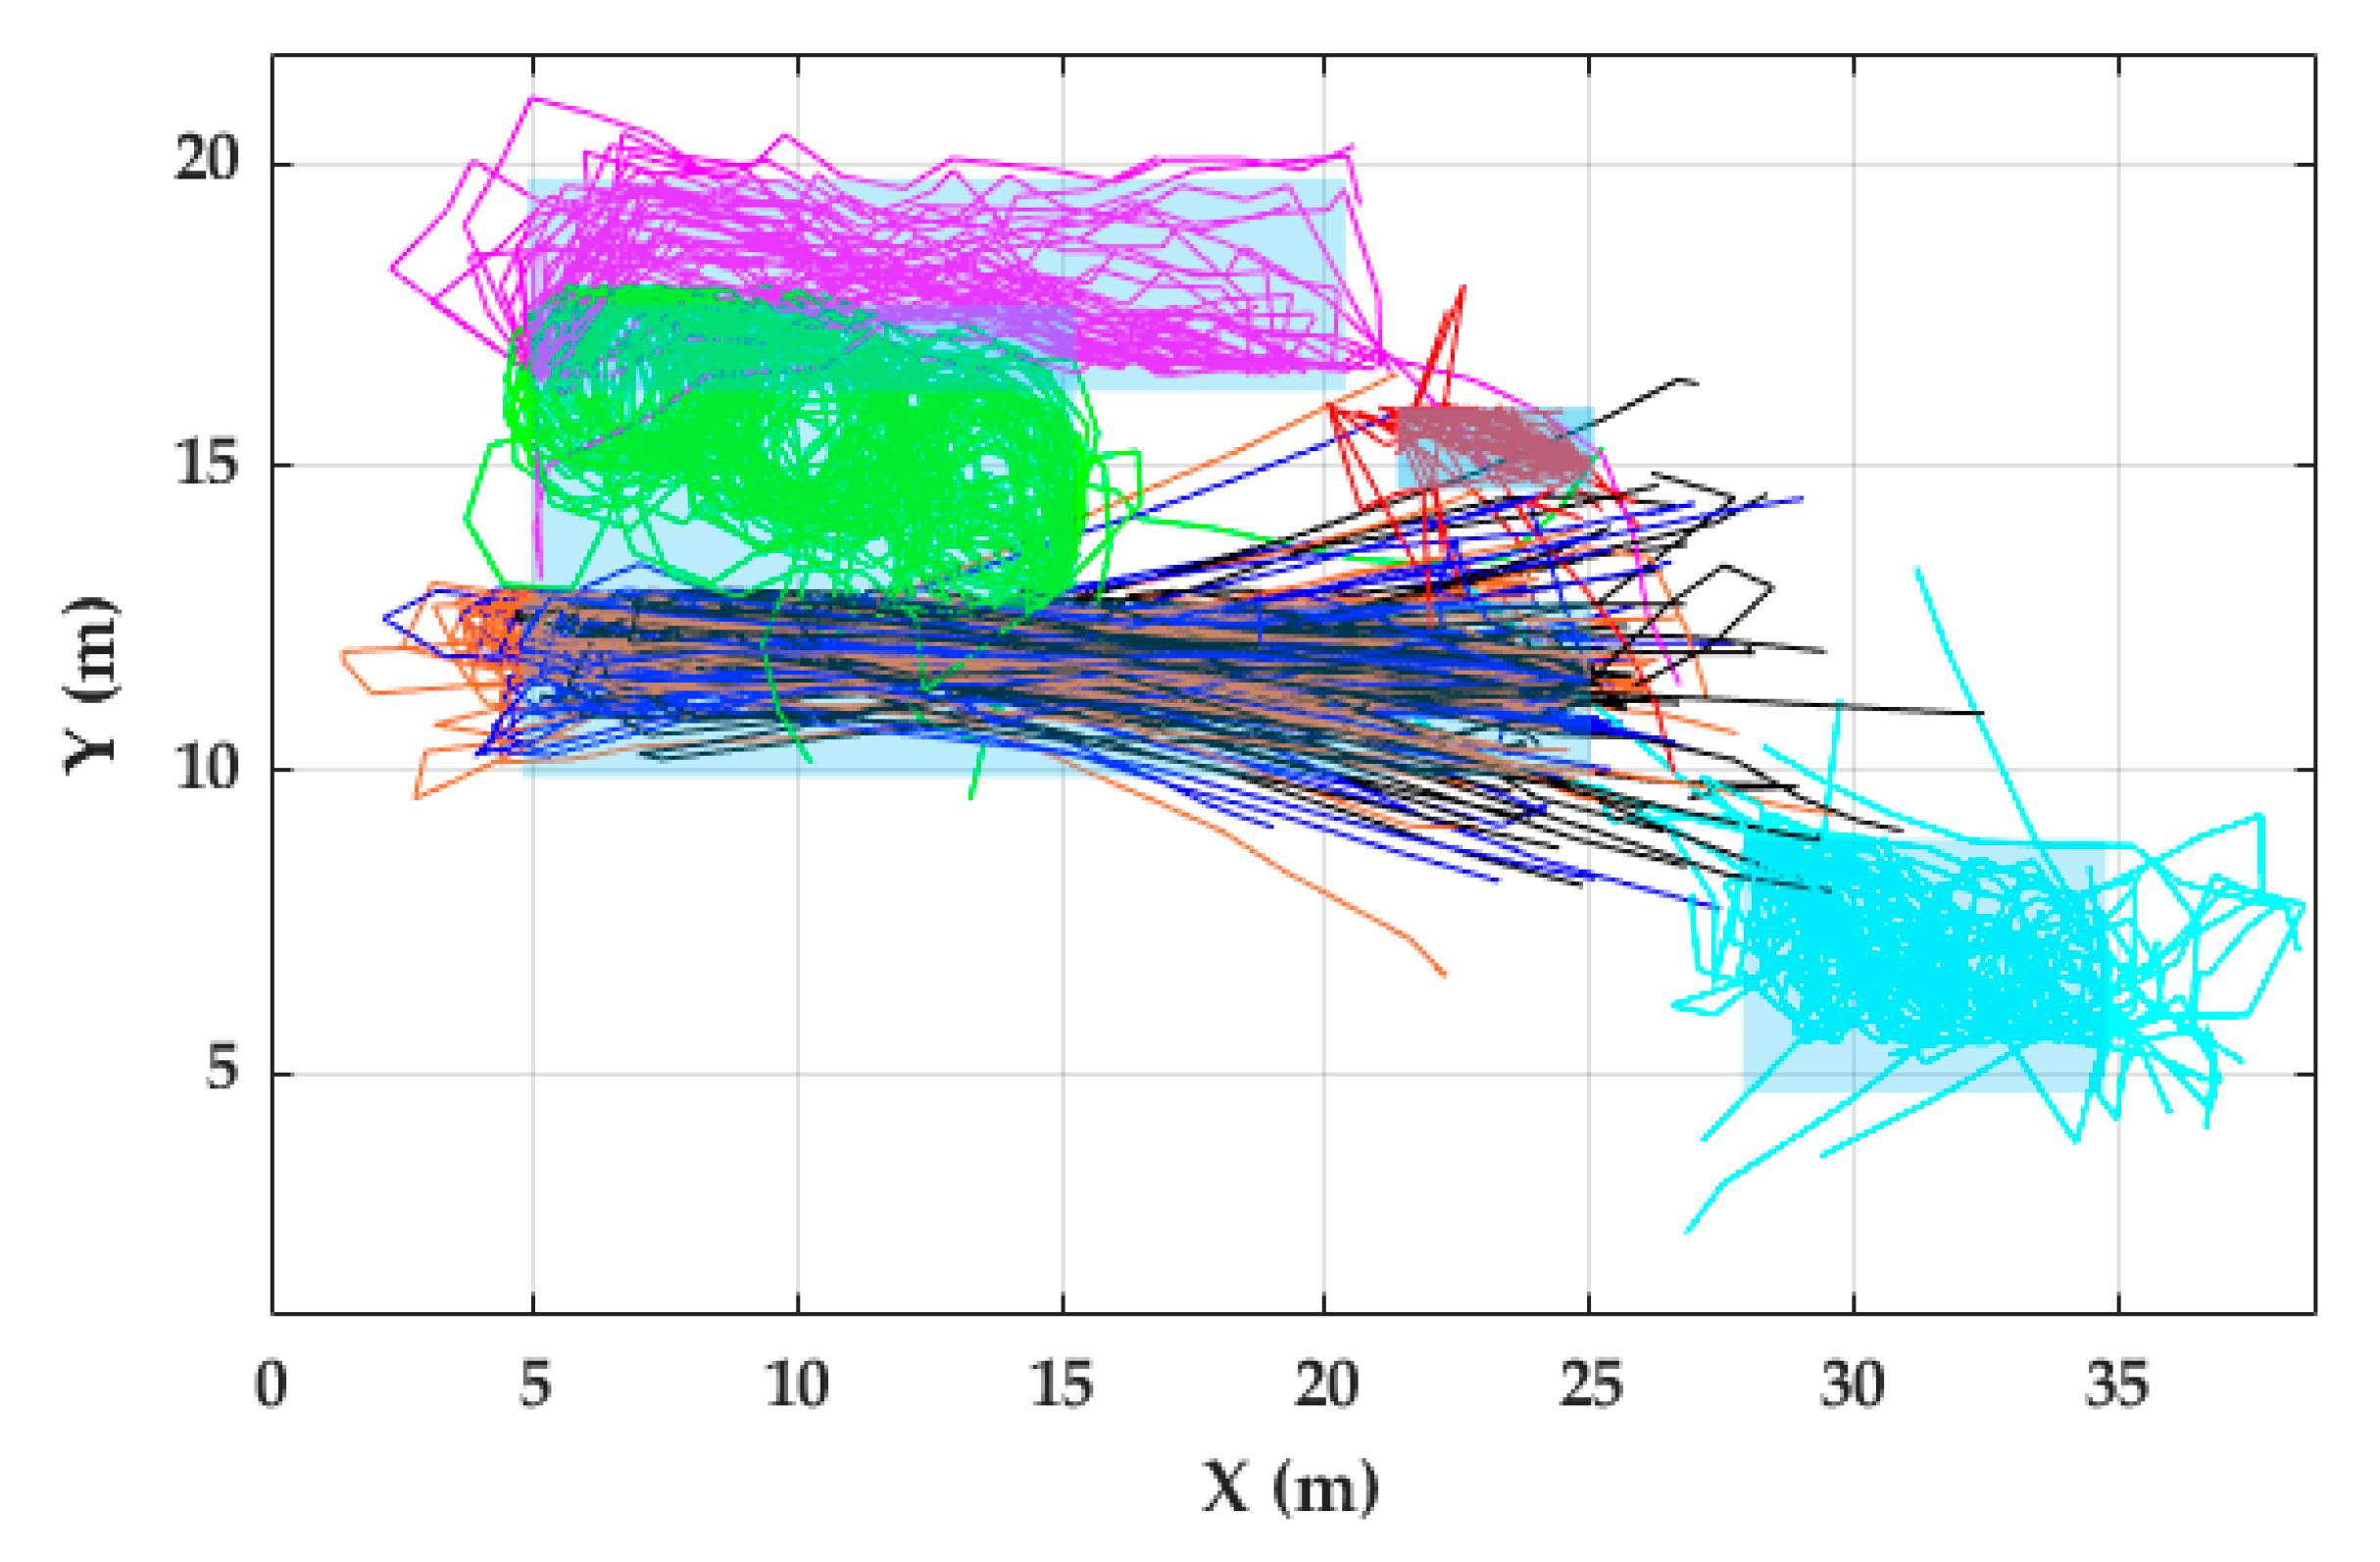
4.1.3. Trajectory Reconstruction
4.2. FAU Dataset
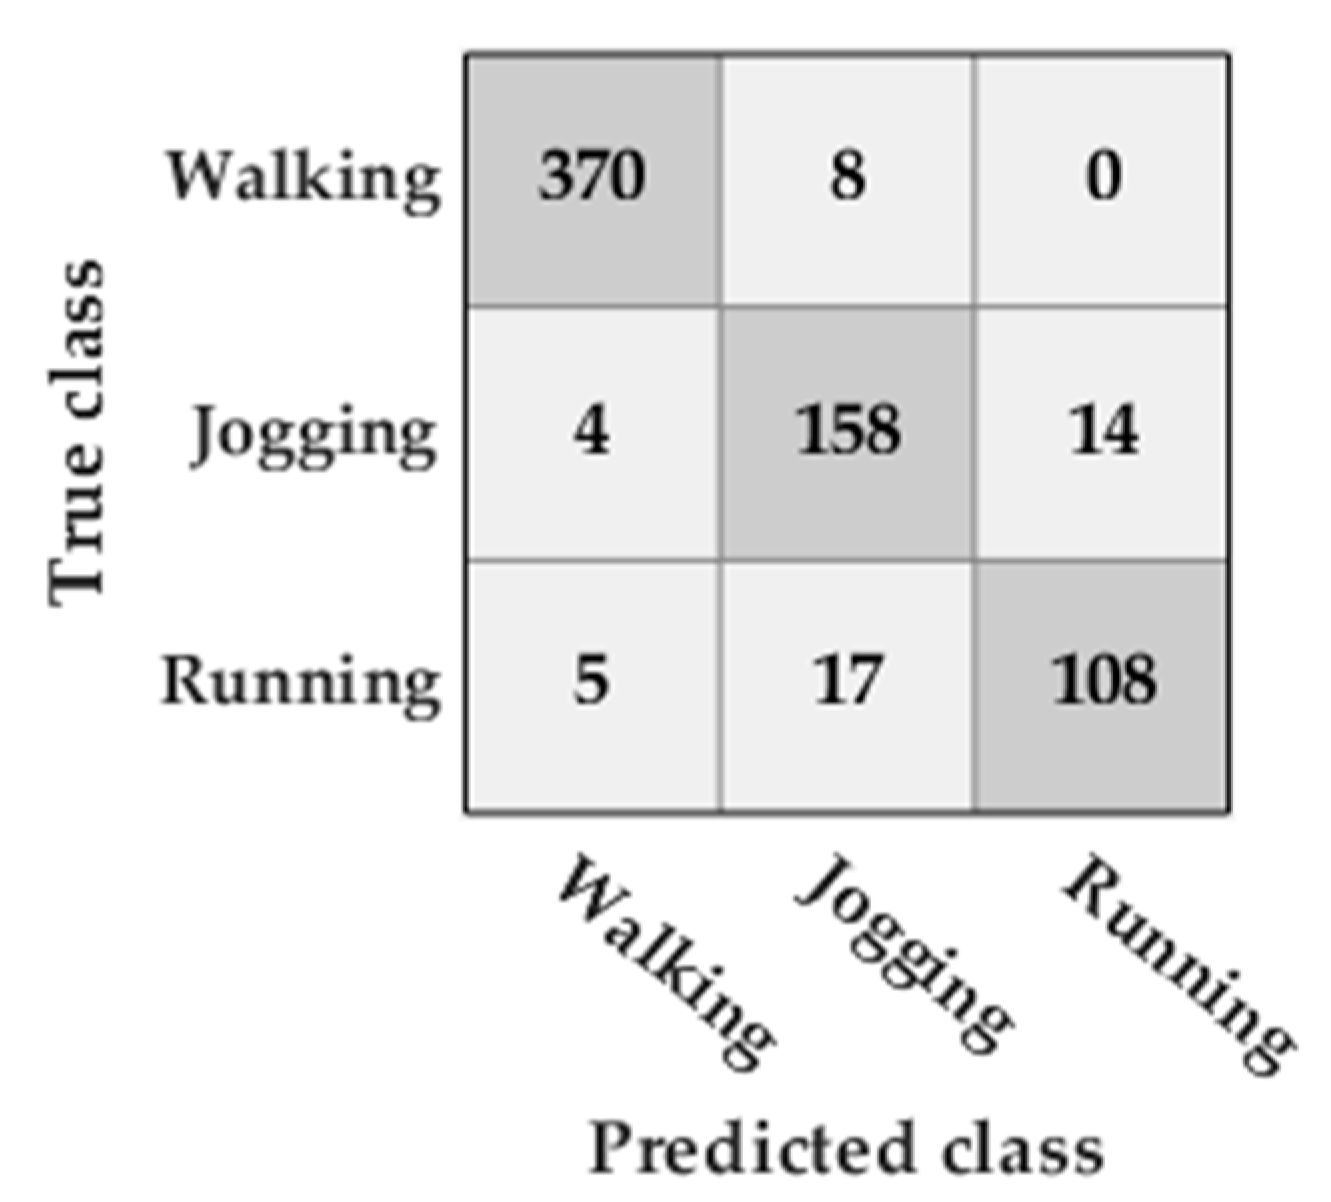
4.2.1. Classification of the Type of Activity
4.2.2. Toe-Off Detection
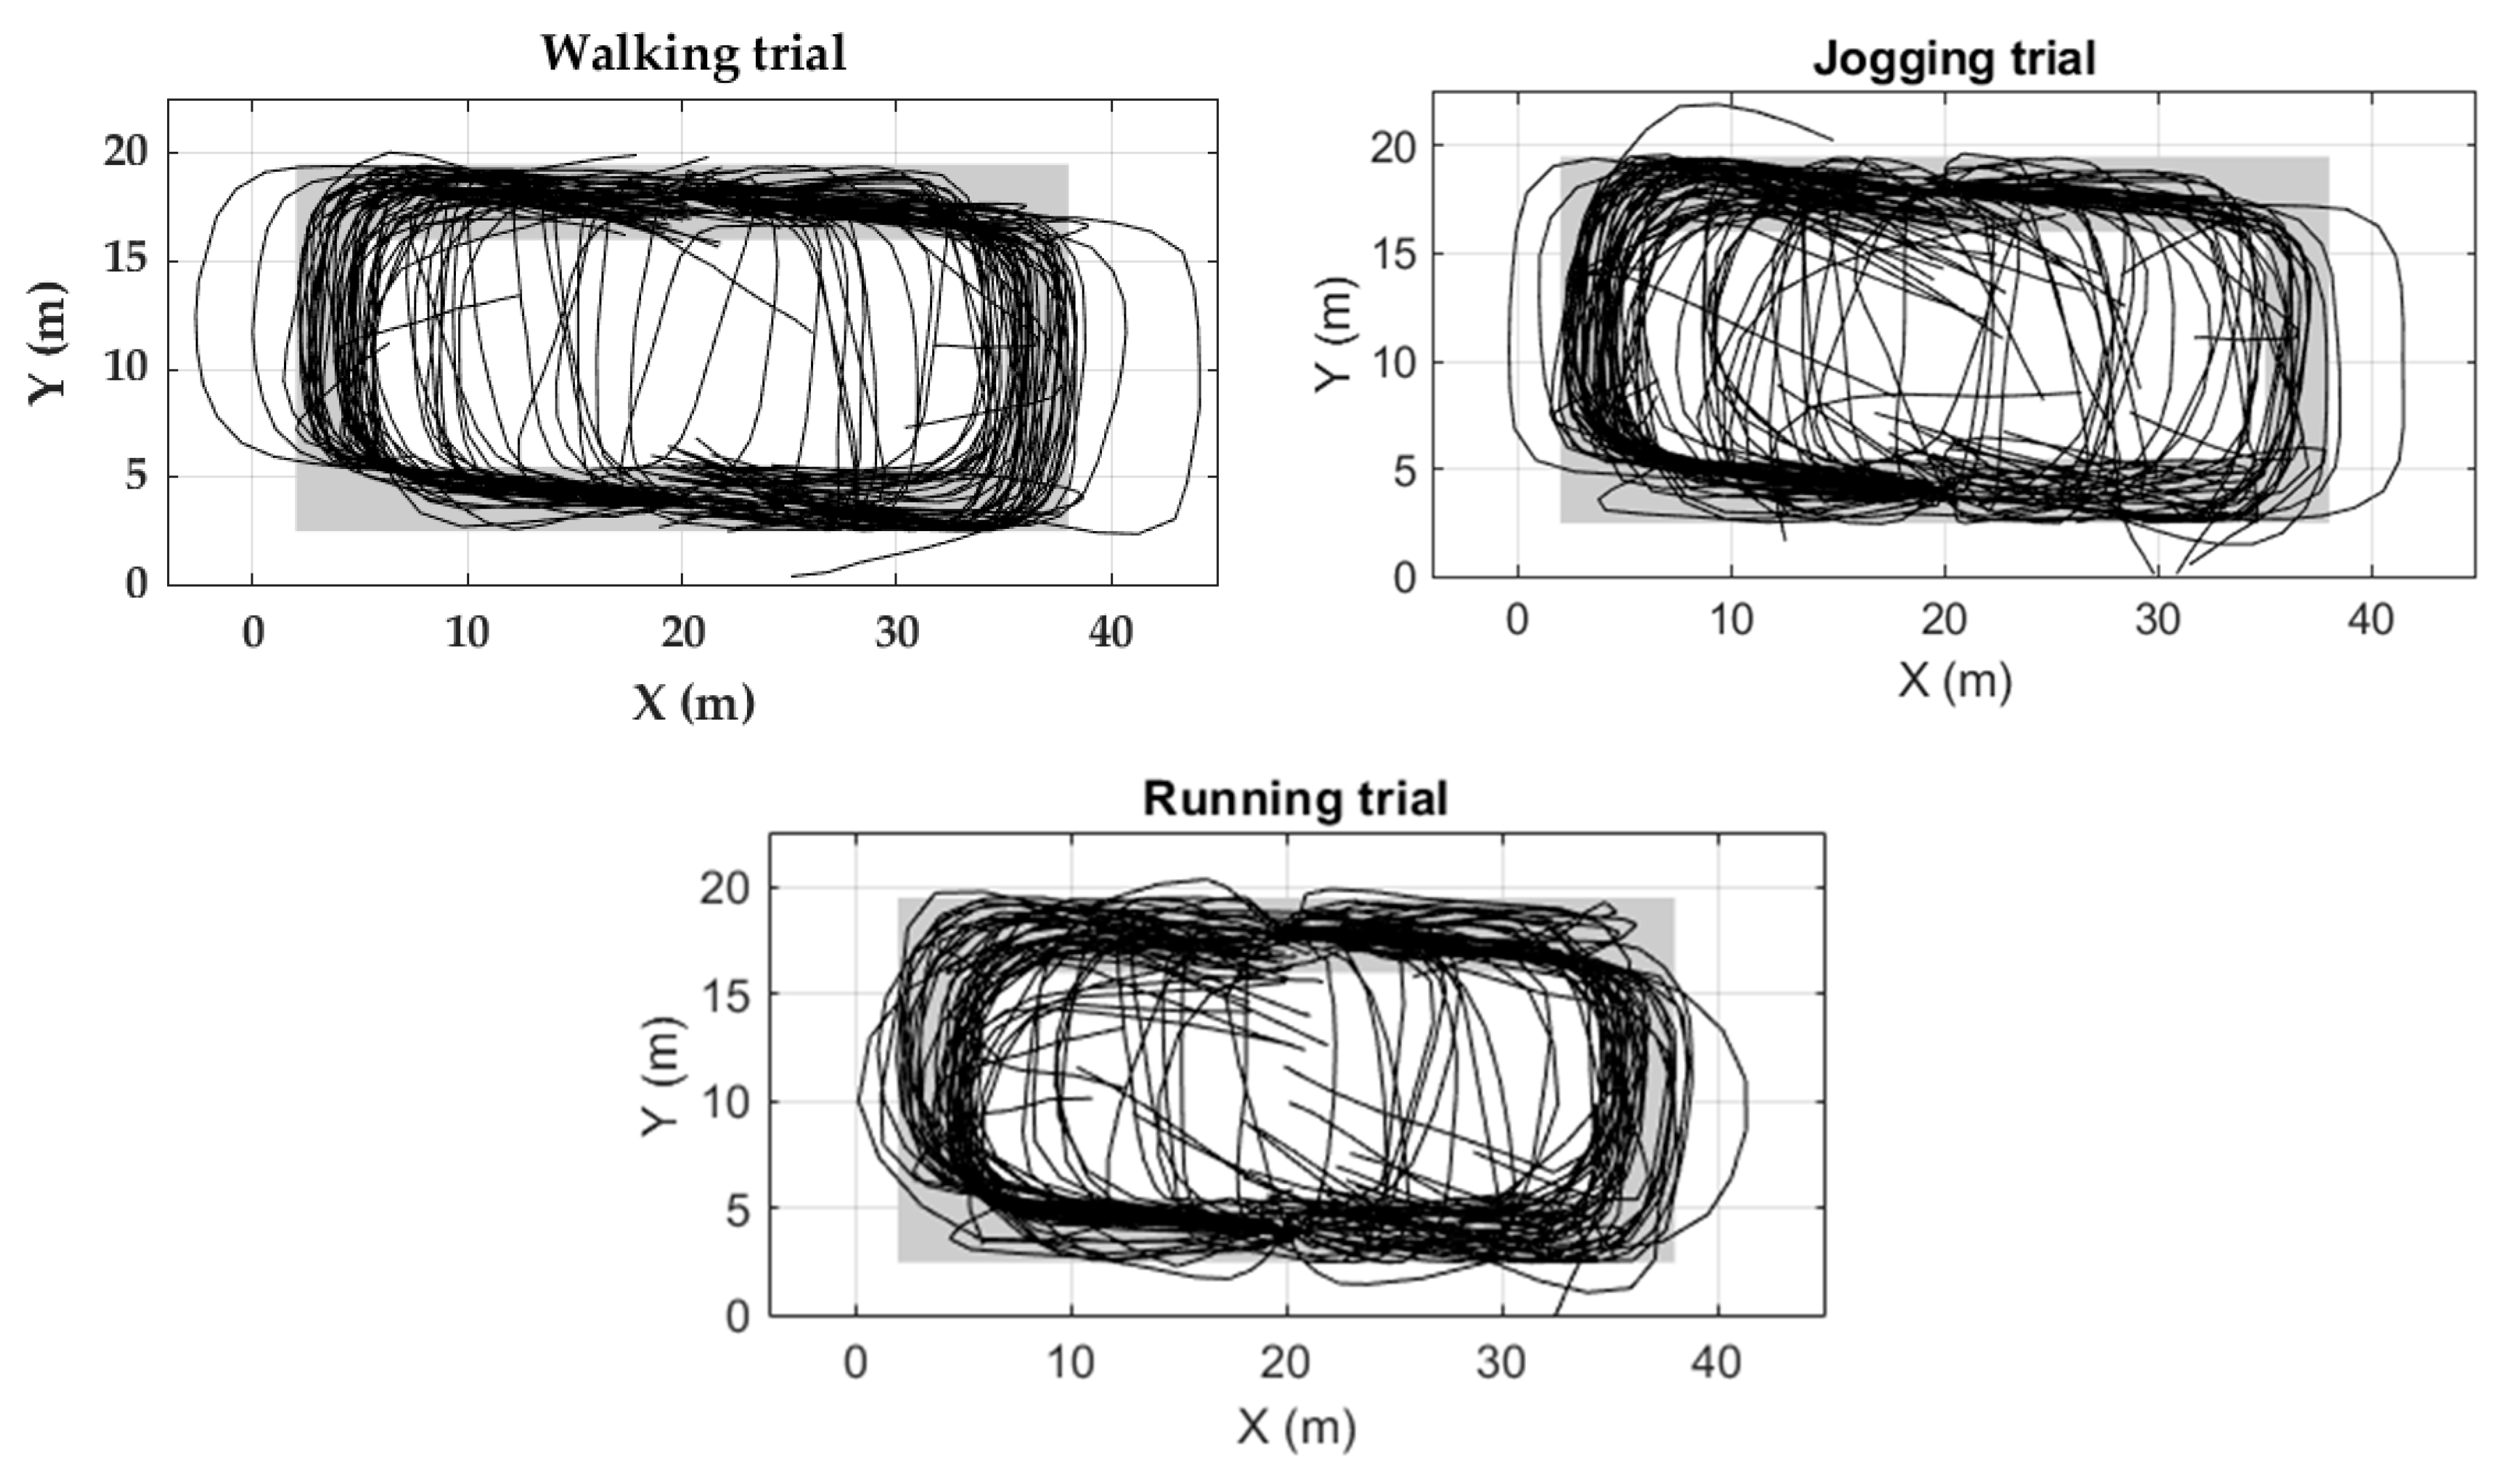
4.2.3. Body Trajectory Reconstruction
5. Discussion
5.1. Classification of the Type of Activity
5.2. TO and MS Detection
5.3. Trajectory Reconstruction
6. Conclusions
Author Contributions
Funding
Acknowledgments
Conflicts of Interest
Appendix A. Complementary Filter
References
- Zheng, L.; Zhou, W.; Tang, W.; Zheng, X.; Peng, A.; Zheng, H. A 3D indoor positioning system based on low-cost MEMS sensors. Simul. Model. Pract. Theory 2016, 65, 45–56. [Google Scholar] [CrossRef]
- Susanti, R.M.; Adhinugraha, K.M.; Alamri, S.; Barolli, L.; Taniar, D. Indoor Trajectory Reconstruction Using Mobile Devices. In Proceedings of the IEEE 32nd International Conference on Advanced Information Networking and Applications (AINA), Krakow, Poland, 16–18 May 2018. [Google Scholar]
- Alarifi, A.; Al-Salman, A.; Alsaleh, M.; Alnafessah, A.; Al-Hadhrami, S.; Al-Ammar, M.A.; Al-Khalifa, H.S. Ultra Wideband Indoor Positioning Technologies: Analysis and Recent Advances. Sensors 2016, 16, 707. [Google Scholar] [CrossRef] [PubMed]
- Leong, C.Y.; Perumal, T.; Peng, K.W.; Yaakob, R. Enabling Indoor Localization with Internet of Things (IoT). In Proceedings of the IEEE 7th Global Conference on Consumer Electronics (GCCE), Nara, Japan, 9–12 October 2018; pp. 571–573. [Google Scholar]
- Correa, A.; Barcelo, M.; Morell, A.; Vicario, J.L. A Review of Pedestrian Indoor Positioning Systems for Mass Market Applications. Sensors 2017, 17, 1927. [Google Scholar] [CrossRef] [PubMed]
- Farid, Z.; Nordin, R.; Ismail, M. Recent Advances in Wireless Indoor Localization Techniques and System. J. Comput. Netw. Commun. 2013, 2013, 185138. [Google Scholar] [CrossRef]
- Mainetti, L.; Patrono, L.; Sergi, I. A survey on indoor positioning systems. In Proceedings of the 22nd International Conference on Software, Telecommunications and Computer Networks (SoftCOM), Split, Croatia, 17–19 September 2014; pp. 111–120. [Google Scholar]
- Muhammad, M.N.; Salcic, Z.; Wang, K.I.-K. Indoor Pedestrian Tracking Using Consumer-Grade Inertial Sensors with PZTD Heading Correction. IEEE Sens. J. 2018, 18, 5164–5172. [Google Scholar] [CrossRef]
- Harle, R. A Survey of Indoor Inertial Positioning Systems for Pedestrians. IEEE Commun. Surv. Tutor. 2013, 15, 1281–1293. [Google Scholar] [CrossRef]
- Wu, Y.; Zhu, H.B.; Du, Q.X.; Tang, S.M. A Survey of the Research Status of Pedestrian Dead Reckoning Systems Based on Inertial Sensors. Int. J. Autom. Comput. 2019, 16, 65–83. [Google Scholar] [CrossRef]
- Fischer, C.; Sukumar, P.T.; Hazas, M. Tutorial: Implementing a pedestrian tracker using inertial sensors. IEEE Pervasive Comput. 2012, 12, 17–27. [Google Scholar] [CrossRef]
- Li, Y.; Wang, J.J. A robust pedestrian navigation algorithm with low cost IMU. In Proceedings of the International Conference on Indoor Positioning and Indoor Navigation (IPIN), Sydney, Australia, 13–15 November 2012; pp. 1–7. [Google Scholar]
- Li, Y.; Wang, J.J. A Pedestrian Navigation System Based on Low Cost IMU. J. Navig. 2014, 67, 929–949. [Google Scholar] [CrossRef]
- Ren, M.; Pan, K.; Liu, Y.; Guo, H.; Zhang, X.; Wang, P. A Novel Pedestrian Navigation Algorithm for a Foot-Mounted Inertial-Sensor-Based System. Sensors 2016, 16, 139. [Google Scholar] [CrossRef] [PubMed]
- Wagstaff, B.; Peretroukhin, V.; Kelly, J. Improving foot-mounted inertial navigation through real-time motion classification. In Proceedings of the International Conference on Indoor Positioning and Indoor Navigation (IPIN), Sapporo, Japan, 18–21 September 2017; pp. 1–8. [Google Scholar]
- Wagstaff, B.; Kelly, J. LSTM-Based Zero-Velocity Detection for Robust Inertial Navigation. In Proceedings of the International Conference on Indoor Positioning and Indoor Navigation (IPIN), Nantes, France, 24–27 September 2018; pp. 1–8. [Google Scholar]
- Mannini, A.; Sabatini, A.M. Machine Learning Methods for Classifying Human Physical Activity from On-Body Accelerometers. Sensors 2010, 10, 1154–1175. [Google Scholar] [CrossRef] [PubMed]
- Hannink, J.; Kautz, T.; Pasluosta, C.F.; Gasmann, K.G.; Klucken, J.; Eskofier, B.M. Sensor-Based Gait Parameter Extraction with Deep Convolutional Neural Networks. IEEE J. Biomed. Health Inform. 2016, 21, 85–93. [Google Scholar] [CrossRef] [PubMed]
- Ghassemi, N.H.; Hannink, J.; Martindale, C.F.; Gaßner, H.; Muller, M.; Klucken, J.; Eskofier, B.M. Segmentation of Gait Sequences in Sensor-Based Movement Analysis: A Comparison of Methods in Parkinson’s Disease. Sensors 2018, 18, 145. [Google Scholar] [CrossRef] [PubMed]
- Mannini, A.; Sabatini, A.M. Gait phase detection and discrimination between walking–jogging activities using hidden Markov models applied to foot motion data from a gyroscope. Gait Posture 2012, 36, 657–661. [Google Scholar] [CrossRef] [PubMed]
- Stetter, B.J.; Ringhof, S.; Krafft, F.C.; Sell, S.; Stein, T. Estimation of Knee Joint Forces in Sport Movements Using Wearable Sensors and Machine Learning. Sensors 2019, 19, 3690. [Google Scholar] [CrossRef] [PubMed]
- Wouda, F.J.; Giuberti, M.; Bellusci, G.; Maartens, E.; Reenalda, J.; Van Beijnum, B.-J.F.; Veltink, P.H. Estimation of Vertical Ground Reaction Forces and Sagittal Knee Kinematics During Running Using Three Inertial Sensors. Front. Physiol. 2018, 9, 218. [Google Scholar] [CrossRef] [PubMed]
- Barth, J.; Oberndorfer, C.; Kugler, P.; Schuldhaus, D.; Winkler, J.; Klucken, J.; Eskofier, B.; Barth, J. Subsequence dynamic time warping as a method for robust step segmentation using gyroscope signals of daily life activities. In Proceedings of the 35th Annual International Conference of the IEEE Engineering in Medicine and Biology Society (EMBC), Osaka, Japan, 3–7 July 2013; Volume 2013, pp. 6744–6747. [Google Scholar]
- Martindale, C.F.; Sprager, S.; Eskofier, B.M. Hidden Markov Model-Based Smart Annotation for Benchmark Cyclic Activity Recognition Database Using Wearables. Sensors 2019, 19, 1820. [Google Scholar] [CrossRef] [PubMed]
- Martindale, C.F.; Roth, N.; Hannink, J.; Sprager, S.; Eskofier, B.M. Smart Annotation Tool for Multi-sensor Gait-based Daily Activity Data. In Proceedings of the IEEE International Conference on Pervasive Computing and Communications Workshops (PerCom Workshops), Athens, Greece, 19–23 March 2018; Institute of Electrical and Electronics Engineers (IEEE): Piscataway, NJ, USA, 2018; pp. 549–554. [Google Scholar]
- Hannink, J.; Ollenschläger, M.; Kluge, F.; Roth, N.; Klucken, J.; Eskofier, B.M. Benchmarking Foot Trajectory Estimation Methods for Mobile Gait Analysis. Sensors 2017, 17, 1940. [Google Scholar] [CrossRef] [PubMed]
- Zrenner, M.; Gradl, S.; Jensen, U.; Ullrich, M.; Eskofier, B.M. Comparison of Different Algorithms for Calculating Velocity and Stride Length in Running Using Inertial Measurement Units. Sensors 2018, 18, 4194. [Google Scholar] [CrossRef] [PubMed]
- Barth, J.; Oberndorfer, C.; Pasluosta, C.; Schülein, S.; Gassner, H.; Reinfelder, S.; Kugler, P.; Schuldhaus, D.; Winkler, J.; Klucken, J.; et al. Stride Segmentation during Free Walk Movements Using Multi-Dimensional Subsequence Dynamic Time Warping on Inertial Sensor Data. Sensors 2015, 15, 6419–6440. [Google Scholar] [CrossRef] [PubMed]
- Leutheuser, H.; Doelfel, S.; Schuldhaus, D.; Reinfelder, S.; Eskofier, B.M. Performance Comparison of Two Step Segmentation Algorithms Using Different Step Activities. In Proceedings of the 11th International Conference on Wearable and Implantable Body Sensor Networks, Zurich, Switzerland, 16–19 June 2014; pp. 143–148. [Google Scholar]
- Skog, I.; Nilsson, J.-O.; Händel, P. Evaluation of zero-velocity detectors for foot-mounted inertial navigation systems. In Proceedings of the International Conference on Indoor Positioning and Indoor Navigation, Zurich, Switzerland, 15–17 September 2010; pp. 1–6. [Google Scholar]
- Hannink, J. Mobile Gait Analysis: From Prototype towards Clinical Grade Wearable; FAU University Press: Erlangen, Germany, 2019. [Google Scholar]


| Activity | Description | Start/End Position | Approximated Distance (m) |
|---|---|---|---|
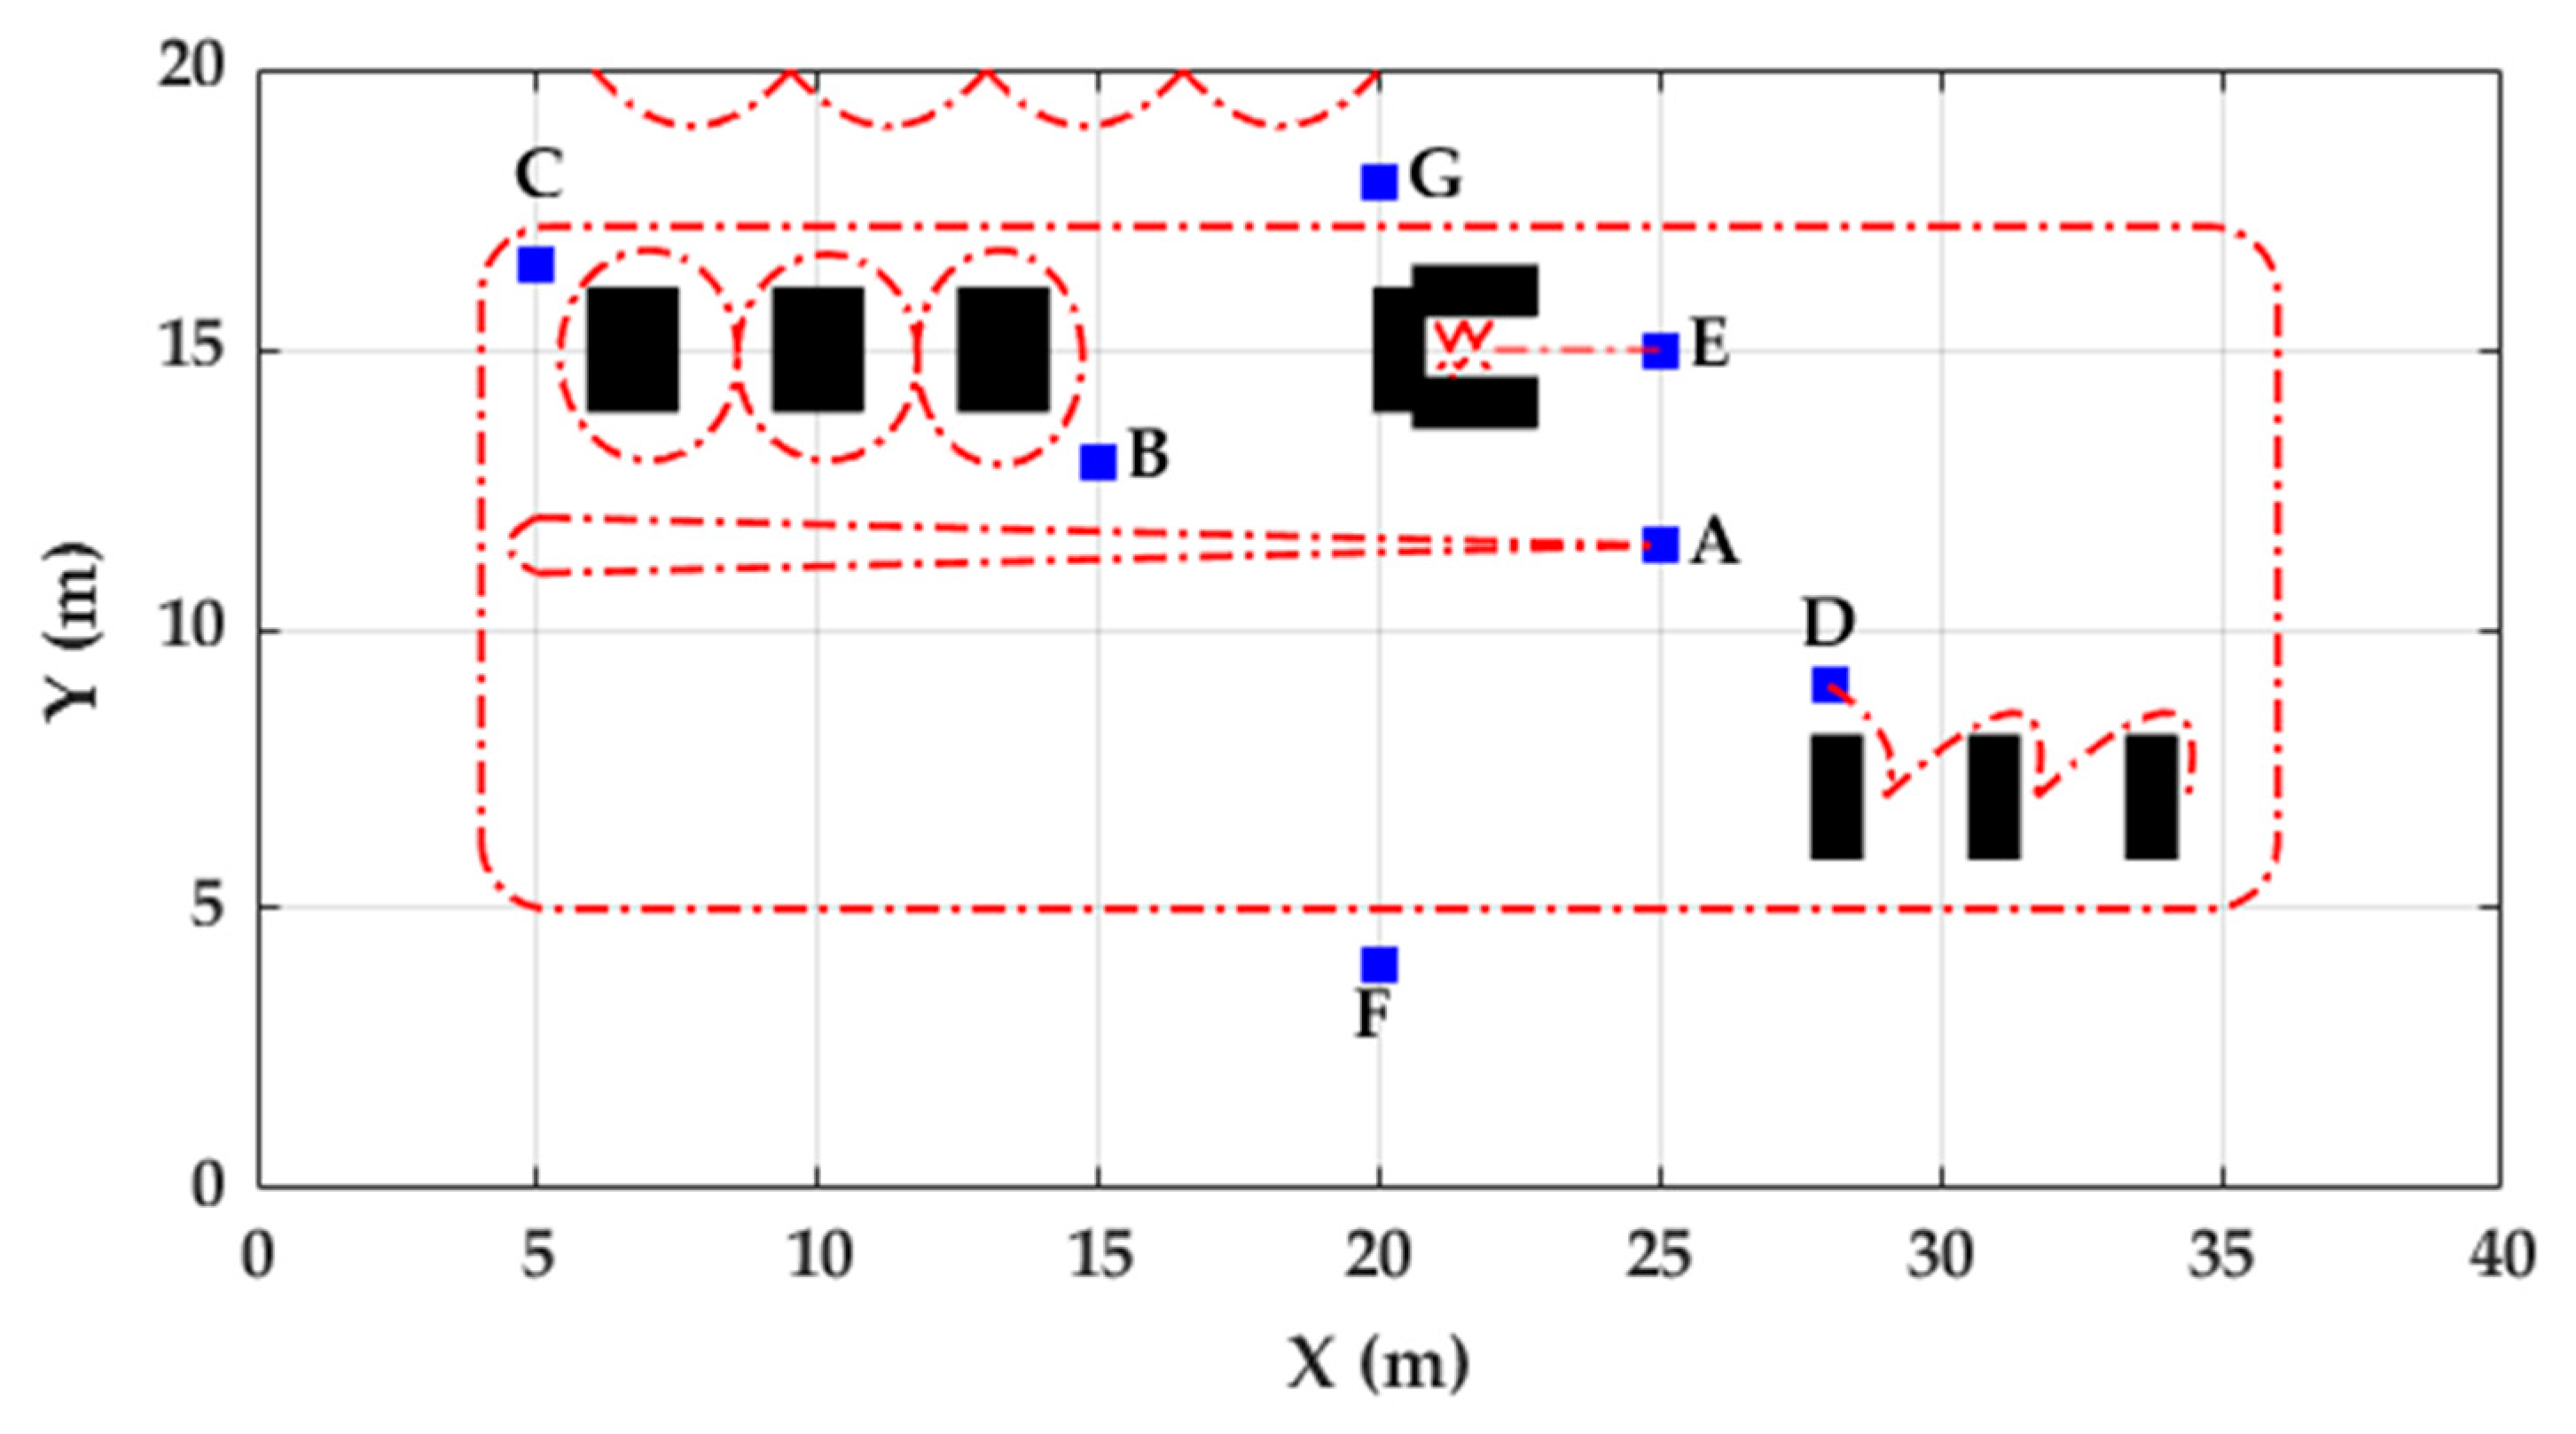
| W-Slalom | Walk slalom through 3 tables | B→B | 31 |
| W-Posters | Sign name on 5 posters on the wall | C→G | 21 |
| W-Tables | Perform task at 3 different tables while sitting | D→D | 20 |
| W-Cards | Perform task on a table while standing | E→E | 6 |
| W, J, R-20 | Walk, jog, run 2 times 20 m | A→A | 40 |
| W, J, R-Circuit | Walk, jog and run half a circuit each | F, G→G,F | 43 |
| Toe-Off | Mid-Stance | |||||||||
|---|---|---|---|---|---|---|---|---|---|---|
| Activity | TO GT | TP | FP | FN | F-Score (%) | MS GT | TP | FP | FN | F-Score (%) |
| Walking | 105.5 | 105.4 | 0.1 | 0.1 | 99.9 | 104.5 | 104.4 | 0.1 | 0.1 | 99.9 |
| Jogging | 75.4 | 39.4 | 37.1 | 36.2 | 51.5 | 74.4 | 41.2 | 34.2 | 33.3 | 54.9 |
| Running | 59.6 | 21.7 | 37.5 | 37.1 | 36.4 | 58.6 | 25.8 | 31.5 | 30.7 | 45.3 |
| Toe-Off | Mid-Stance | |||||||||
|---|---|---|---|---|---|---|---|---|---|---|
| Activity | TO GT | TP | FP | FN | F-Score (%) | MS GT | TP | FP | FN | F-Score (%) |
| Walking | 105.5 | 105.5 | 0 | 0 | 100 | 104.5 | 104.5 | 0 | 0 | 100 |
| Jogging | 75.4 | 75.2 | 0.1 | 0.2 | 99.8 | 74.4 | 74.4 | 0 | 0 | 100 |
| Running | 59.6 | 59.3 | 0.3 | 0.2 | 99.7 | 58.6 | 58.5 | 0.1 | 0.1 | 99.8 |
| Activity | SOT | RPE | ||||||
|---|---|---|---|---|---|---|---|---|
| [31] | New A | [31] | New A | |||||
| # | % | # | % | meters | % | meters | % | |
| Walking | 1.7 | 1.6 | 1.7 | 1.6 | 0.8 | 0.5 | 0.8 | 0.5 |
| Jogging | 6.6 | 8.6 | 2.9 | 3.8 | 2.2 | 1.4 | 1.4 | 0.9 |
| Running | 5.3 | 9.2 | 3.3 | 5.7 | 2.6 | 1.6 | 1.4 | 0.9 |
| Activity | TO | TP | FP | FN | F-Score (%) | ||||
|---|---|---|---|---|---|---|---|---|---|
| [31] | New A. | [31] | New A. | [31] | New A. | [31] | New A. | ||
| W-Slalom | 21.5 | 21.2 | 21.2 | 0.8 | 0.8 | 0.4 | 0.3 | 97 | 97 |
| W-Posters | 13.0 | 10.6 | 10.6 | 3.6 | 3.5 | 2.3 | 2.3 | 77 | 78 |
| W-Tables | 11.9 | 9.5 | 9.5 | 3.7 | 3.7 | 2.4 | 2.4 | 75 | 75 |
| W-Cards | 4.33 | 3.7 | 3.7 | 1.6 | 1.6 | 2.4 | 0.6 | 71 | 71 |
| W-20 | 28.4 | 28.2 | 28.2 | 1.3 | 1.0 | 0.4 | 0.2 | 99 | 98 |
| J-20 | 22.3 | 13.7 | 21.6 | 9.7 | 1.1 | 8.6 | 0.7 | 56 | 96 |
| R-20 | 18.4 | 8.1 | 17.0 | 12.3 | 2.1 | 10.6 | 1.3 | 48 | 90 |
| W-Circuit | 28.2 | 27.6 | 27.7 | 0.7 | 0.7 | 0.4 | 0.3 | 98 | 98 |
| J-Circuit | 21.9 | 11.8 | 21.3 | 10.8 | 0.7 | 10 | 0.5 | 49 | 97 |
| R-Circuit | 17.7 | 7.6 | 17.3 | 10.7 | 0.8 | 10.2 | 0.4 | 40 | 96 |
| Activity | Activity distance | SOT | RPE | ||||||
|---|---|---|---|---|---|---|---|---|---|
| [31] | New A. | [31] | New A. | ||||||
| meters | # | % | # | % | meters | % | meters | % | |
| W-Slalom | 31 | 1.1 | 5.2 | 1.1 | 5.2 | 1.7 | 5.5 | 1.7 | 5.5 |
| W-Posters | 21 | 1.0 | 8.0 | 1.0 | 8.0 | 1.9 | 9.0 | 1.8 | 8.8 |
| W-Tables | 20 | 3.1 | 25.9 | 3.1 | 25.9 | 2.8 | 14.1 | 2.8 | 14.1 |
| W-Cards | 6 | 1.3 | 30.5 | 1.3 | 30.5 | 1.6 | 27.4 | 1.6 | 27.4 |
| W-20 | 40 | 3.7 | 13.1 | 3.7 | 13.1 | 1.7 | 4.2 | 1.7 | 4.2 |
| J-20 | 40 | 7.5 | 34.2 | 3.9 | 17.9 | 5.5 | 14.2 | 2.0 | 5.1 |
| R-20 | 40 | 4.1 | 22.5 | 3.1 | 17.0 | 5.2 | 13.9 | 2.5 | 6.0 |
| W-Circuit | 43 | 4.1 | 14.4 | 4.1 | 14.4 | 2.9 | 6.7 | 3.0 | 6.7 |
| J-Circuit | 43 | 6.4 | 30.2 | 4.5 | 20.4 | 14.5 | 33.7 | 3.6 | 8.8 |
| R-Circuit | 43 | 5.1 | 29.9 | 3.9 | 22.4 | 16.2 | 37.7 | 3.7 | 8.7 |
© 2020 by the authors. Licensee MDPI, Basel, Switzerland. This article is an open access article distributed under the terms and conditions of the Creative Commons Attribution (CC BY) license (http://creativecommons.org/licenses/by/4.0/).
Share and Cite
Ceron, J.D.; Martindale, C.F.; López, D.M.; Kluge, F.; Eskofier, B.M. Indoor Trajectory Reconstruction of Walking, Jogging, and Running Activities Based on a Foot-Mounted Inertial Pedestrian Dead-Reckoning System. Sensors 2020, 20, 651. https://doi.org/10.3390/s20030651
Ceron JD, Martindale CF, López DM, Kluge F, Eskofier BM. Indoor Trajectory Reconstruction of Walking, Jogging, and Running Activities Based on a Foot-Mounted Inertial Pedestrian Dead-Reckoning System. Sensors. 2020; 20(3):651. https://doi.org/10.3390/s20030651
Chicago/Turabian StyleCeron, Jesus D., Christine F. Martindale, Diego M. López, Felix Kluge, and Bjoern M. Eskofier. 2020. "Indoor Trajectory Reconstruction of Walking, Jogging, and Running Activities Based on a Foot-Mounted Inertial Pedestrian Dead-Reckoning System" Sensors 20, no. 3: 651. https://doi.org/10.3390/s20030651
APA StyleCeron, J. D., Martindale, C. F., López, D. M., Kluge, F., & Eskofier, B. M. (2020). Indoor Trajectory Reconstruction of Walking, Jogging, and Running Activities Based on a Foot-Mounted Inertial Pedestrian Dead-Reckoning System. Sensors, 20(3), 651. https://doi.org/10.3390/s20030651