Article

In-Plane and Out-of-Plane MEMS Piezoresistive Cantilever Sensors for Nanoparticle Mass Detection

1
Institute of Semiconductor Technology (IHT) and Laboratory of Emerging Nanometrology (LENA), Technische Universität Braunschweig, 38106 Braunschweig, Germany
2
Research Center for Physics, Indonesian Institute of Sciences (LIPI), Tangerang Selatan 15314, Indonesia
3
Department of Metrology, Kenya Bureau of Standards (KEBS), Nairobi 00200, Kenya
4
Fraunhofer Wilhelm-Klauditz-Institut (WKI), 38108 Braunschweig, Germany
5
SCL-Sensor.Tech. Fabrication GmbH, 1220 Vienna, Austria
6
GETec Microscopy GmbH, 1220 Vienna, Austria
*
Author to whom correspondence should be addressed.
Sensors 2020, 20(3), 618; https://doi.org/10.3390/s20030618
Submission received: 14 December 2019 / Revised: 10 January 2020 / Accepted: 16 January 2020 / Published: 22 January 2020
(This article belongs to the Special Issue Sensors for Particulate Matter and Air Pollution)

Abstract

:
In this study, we investigate the performance of two piezoresistive micro-electro-mechanical system (MEMS)-based silicon cantilever sensors for measuring target analytes (i.e., ultrafine particulate matters). We use two different types of cantilevers with geometric dimensions of 1000 × 170 × 19.5 µm3 and 300 × 100 × 4 µm3, which refer to the 1st and 2nd types of cantilevers, respectively. For the first case, the cantilever is configured to detect the fundamental in-plane bending mode and is actuated using a resistive heater. Similarly, the second type of cantilever sensor is actuated using a meandering resistive heater (bimorph) and is designed for out-of-plane operation. We have successfully employed these two cantilevers to measure and monitor the changes of mass concentration of carbon nanoparticles in air, provided by atomizing suspensions of these nanoparticles into a sealed chamber, ranging from 0 to several tens of µg/m3 and oversize distributions from ~10 nm to ~350 nm. Here, we deploy both types of cantilever sensors and operate them simultaneously with a standard laboratory system (Fast Mobility Particle Sizer, FMPS, TSI 3091) as a reference.

Graphical Abstract

1. Introduction

Pollutants in the air are often invisible and come from many different sources. Sulfur dioxide (SO2), for instance, is emitted from coal-burning activity in power plants and greatly contributes to the increase of particulate matter (PM), i.e., PM2.5 and PM10. In addition, the incomplete combustions of fossil fuels, biofuels, biomass, and black carbon (BC) [1,2] cause the appearance of fine (FPs) or ultrafine particles (UFPs). Since these particles are suspended in the air as aerosols, they may cause serious health problems. For instance, the UFP, whose diameter is less than 100 nm, can be easily deposited in a respiratory tract and consequently enter deep into the lungs, and thereby adversely affect the central nervous and cardiovascular systems [3,4,5]. It leads to health problems, e.g., lung diseases, heart diseases, decreased lung function, aggravated asthma, and irregular heartbeat [6]. Increased global trends on airborne diseases have necessitated the establishment of air quality standards to mitigate the effects. Therefore, the development of robust devices for continuous monitoring and sensing of airborne particulates is required for ensuring environmental control, quality, and health.
Various particulate sensing systems have been developed in recent years. One such method involves counting particles by measuring the current of a charged particle (connected via a sensitive current meter) [7,8,9]. Furthermore, dynamic light scattering has also been established as a technique for measuring the average particle size and size distribution in a suspension [10,11]. However, on the one hand, the particle charge-based measurement usually needs many electrodes for sensing extended particle-size distributions, and the corresponding instruments are large in size. On the other hand, particle counting based on light scattering method leads to a lower limit of detectable particle size (~0.3 µm) [12]. Another approach is based on gravimetric measurements, in which resonant mass sensors are normally employed as the key monitoring elements that primarily rely on the principle of resonance-frequency shift, e.g., quartz crystal microbalance (QCM) [13,14] and cantilevers [15,16,17]. Gravimetric-based cantilever sensors have high potential and capability to detect small amounts of mass and are widely used in gas sensing [18], fluid density [19], and fluid viscosity measurements [20], etc. Moreover, they have also been employed in contact resonance mode to measure the thickness and rheological properties of thin films [21,22].
In this study, we operate in-house developed cantilever and commercial-based atomic force microscopy (AFM) micro-cantilever sensors for real-time monitoring of carbon nanoparticle mass concentrations. To excite these cantilever beams, both sensors employed an electrothermal actuation mechanism. In this case, power dissipation in a diffused resistor or in a metal strip causes a temperature increase, thereby resulting in the material expansion, which ultimately initiates mechanical actuation [23]. To actuate the in-house fabricated cantilever beam in an in-plane direction, a heating component was placed at the clamped end of the cantilever near the sensing component. It should be noted that the small distance between the heating resistor and sensing component; however, introduces a thermal parasitic coupling (i.e., from the actuating part to the sensing part). To demodulate “the contaminated” signal output and eliminate the parasitic effect, we, therefore, added an optimization process. On the other hand, the AFM micro-cantilever was actuated in an out-of-plane direction. This was realized by placing an imprinted conductor on the free end of the cantilever beam, while the sensing component was positioned at the fixed end. In this condition, there is a sufficiently large distance between the actuating and sensing parts, which results in an optimum resonance response with a negligible direct thermal-parasitic effect. In our study, we have also evaluated the performance of these two sensors in the framework of their quality factor and resolution for nanoparticle mass-concentration sensing. In addition, a standard laboratory system (Fast Mobility Particle Sizer, FMPS, TSI 3091) was used as a reference to measure the concentration of carbon nanoparticles in a sealed chamber.

2. Materials and Methods

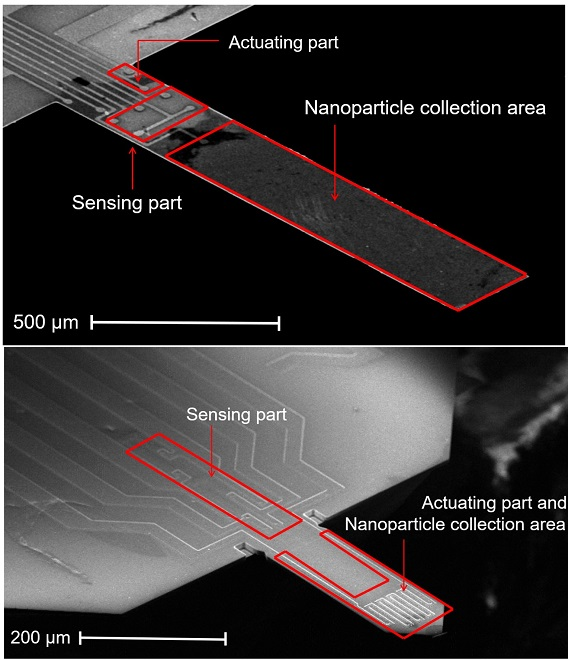
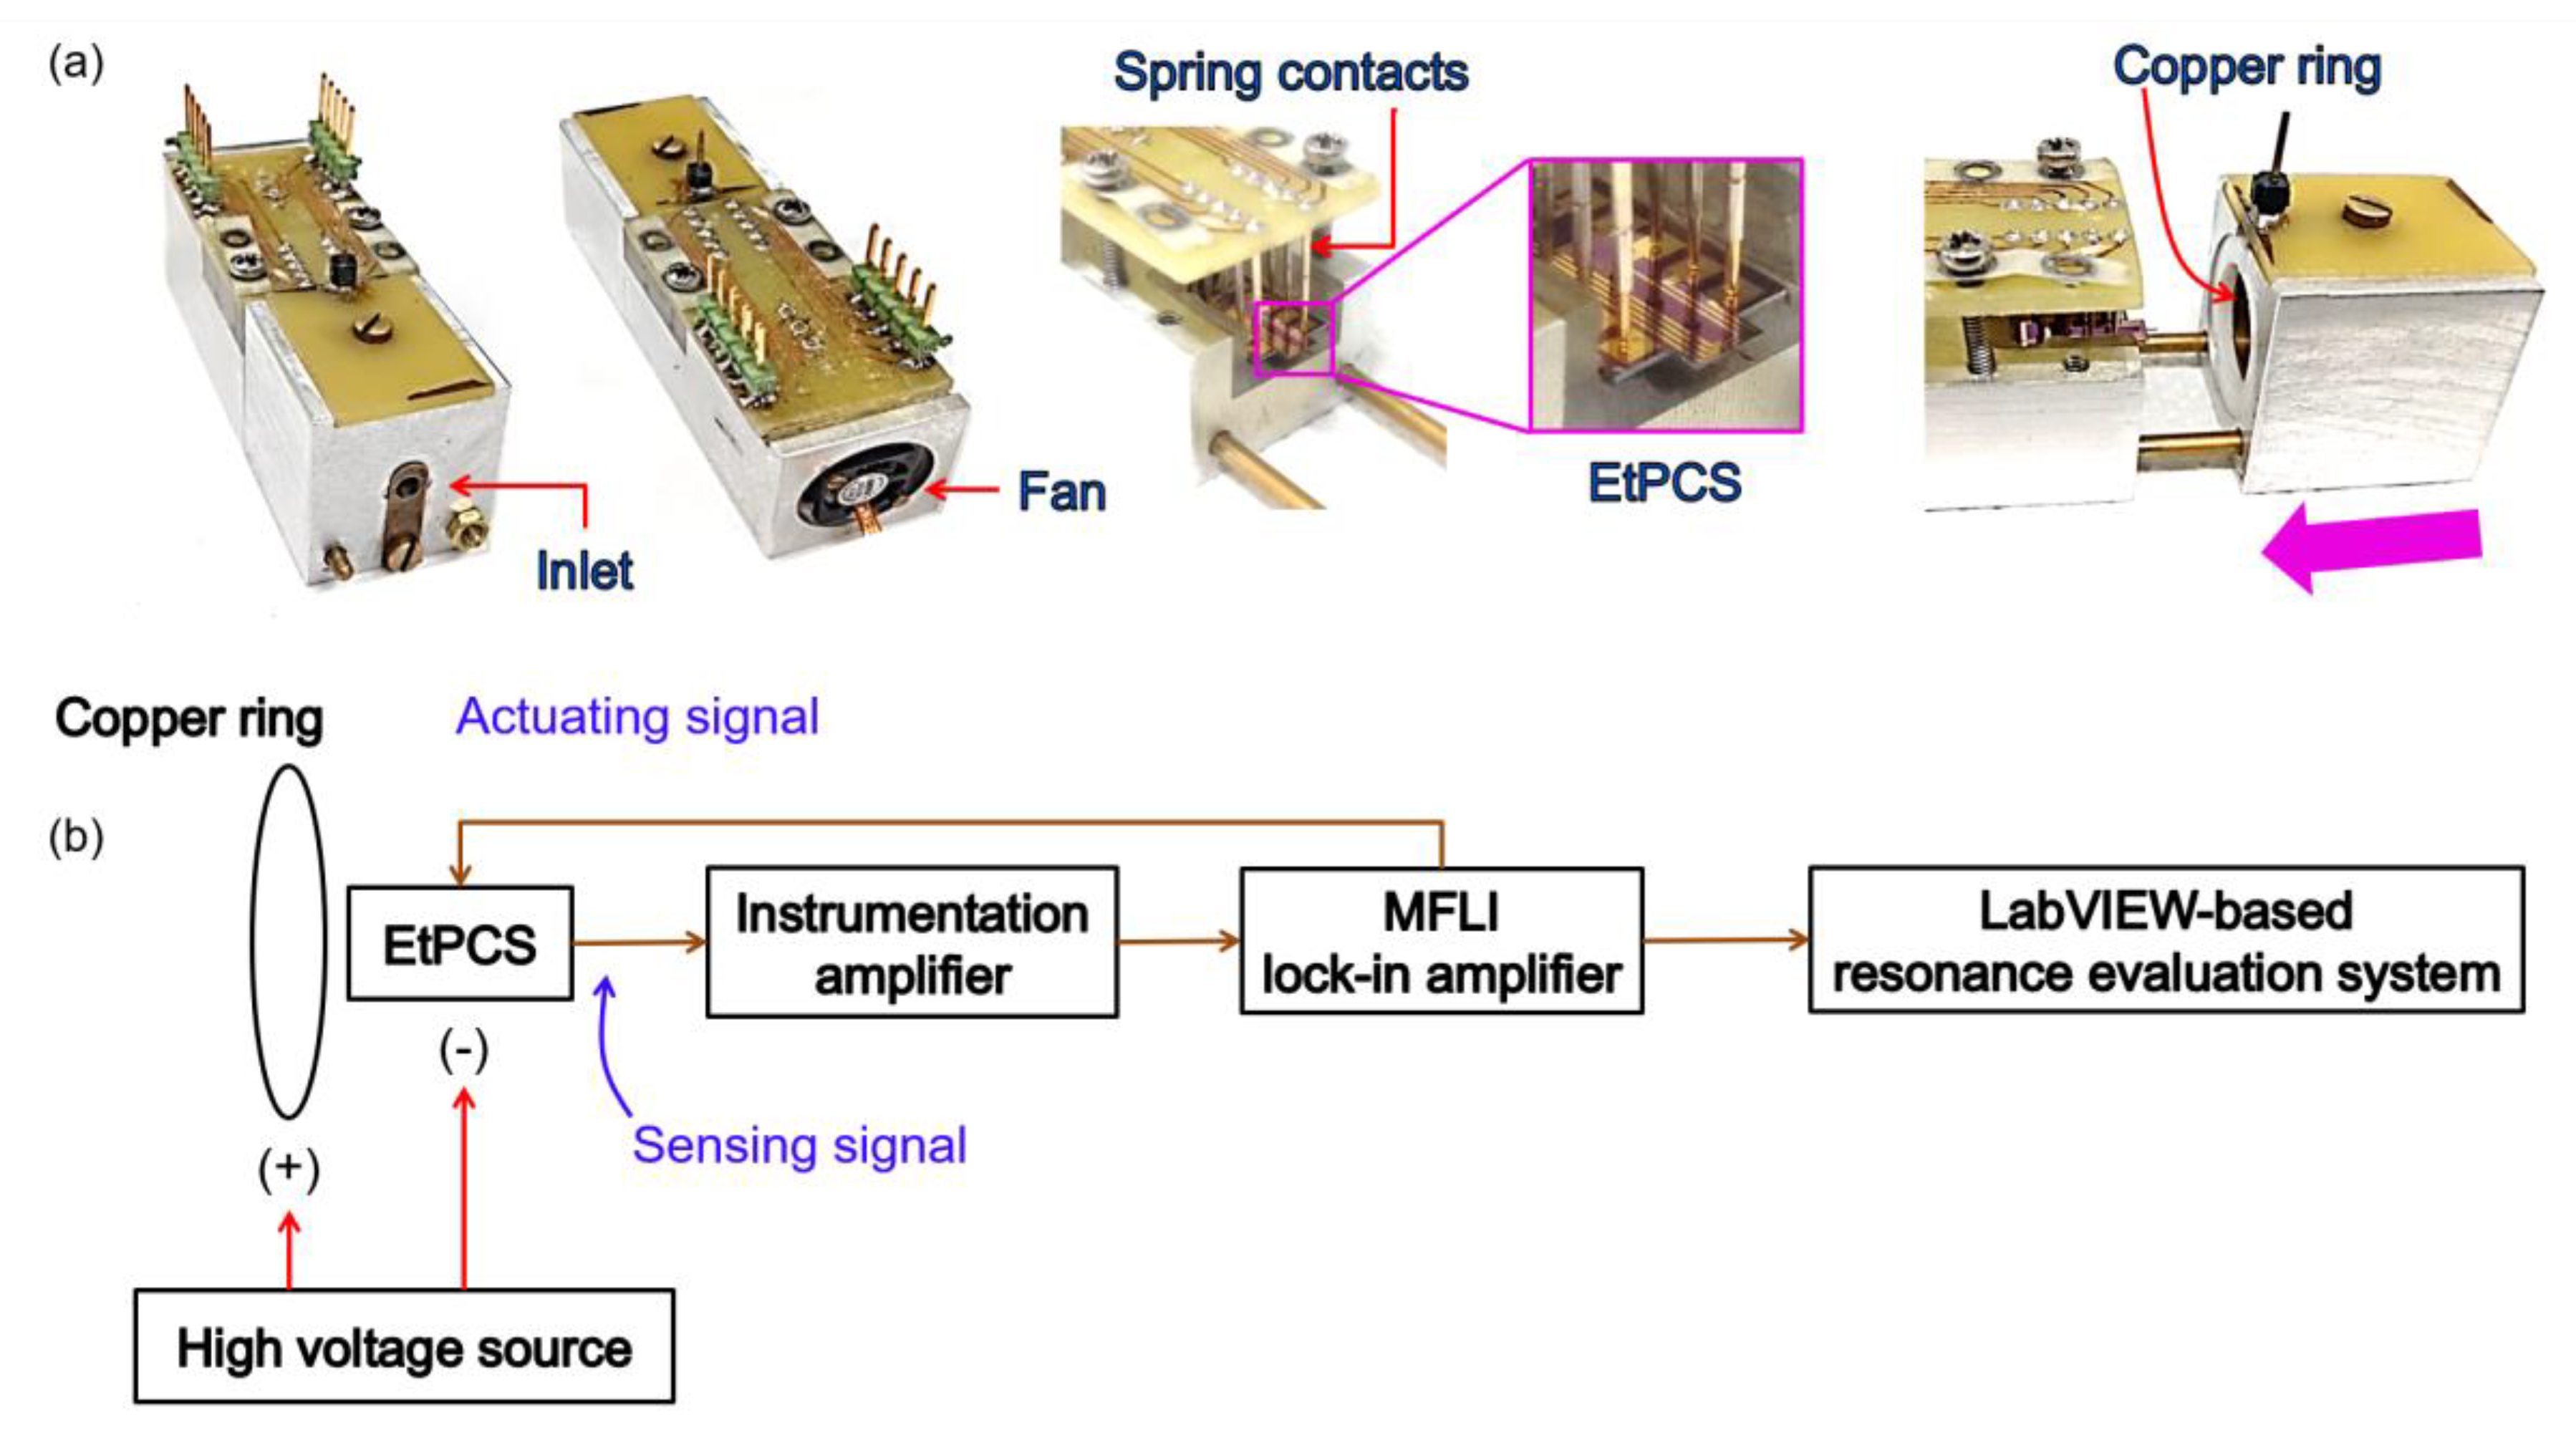
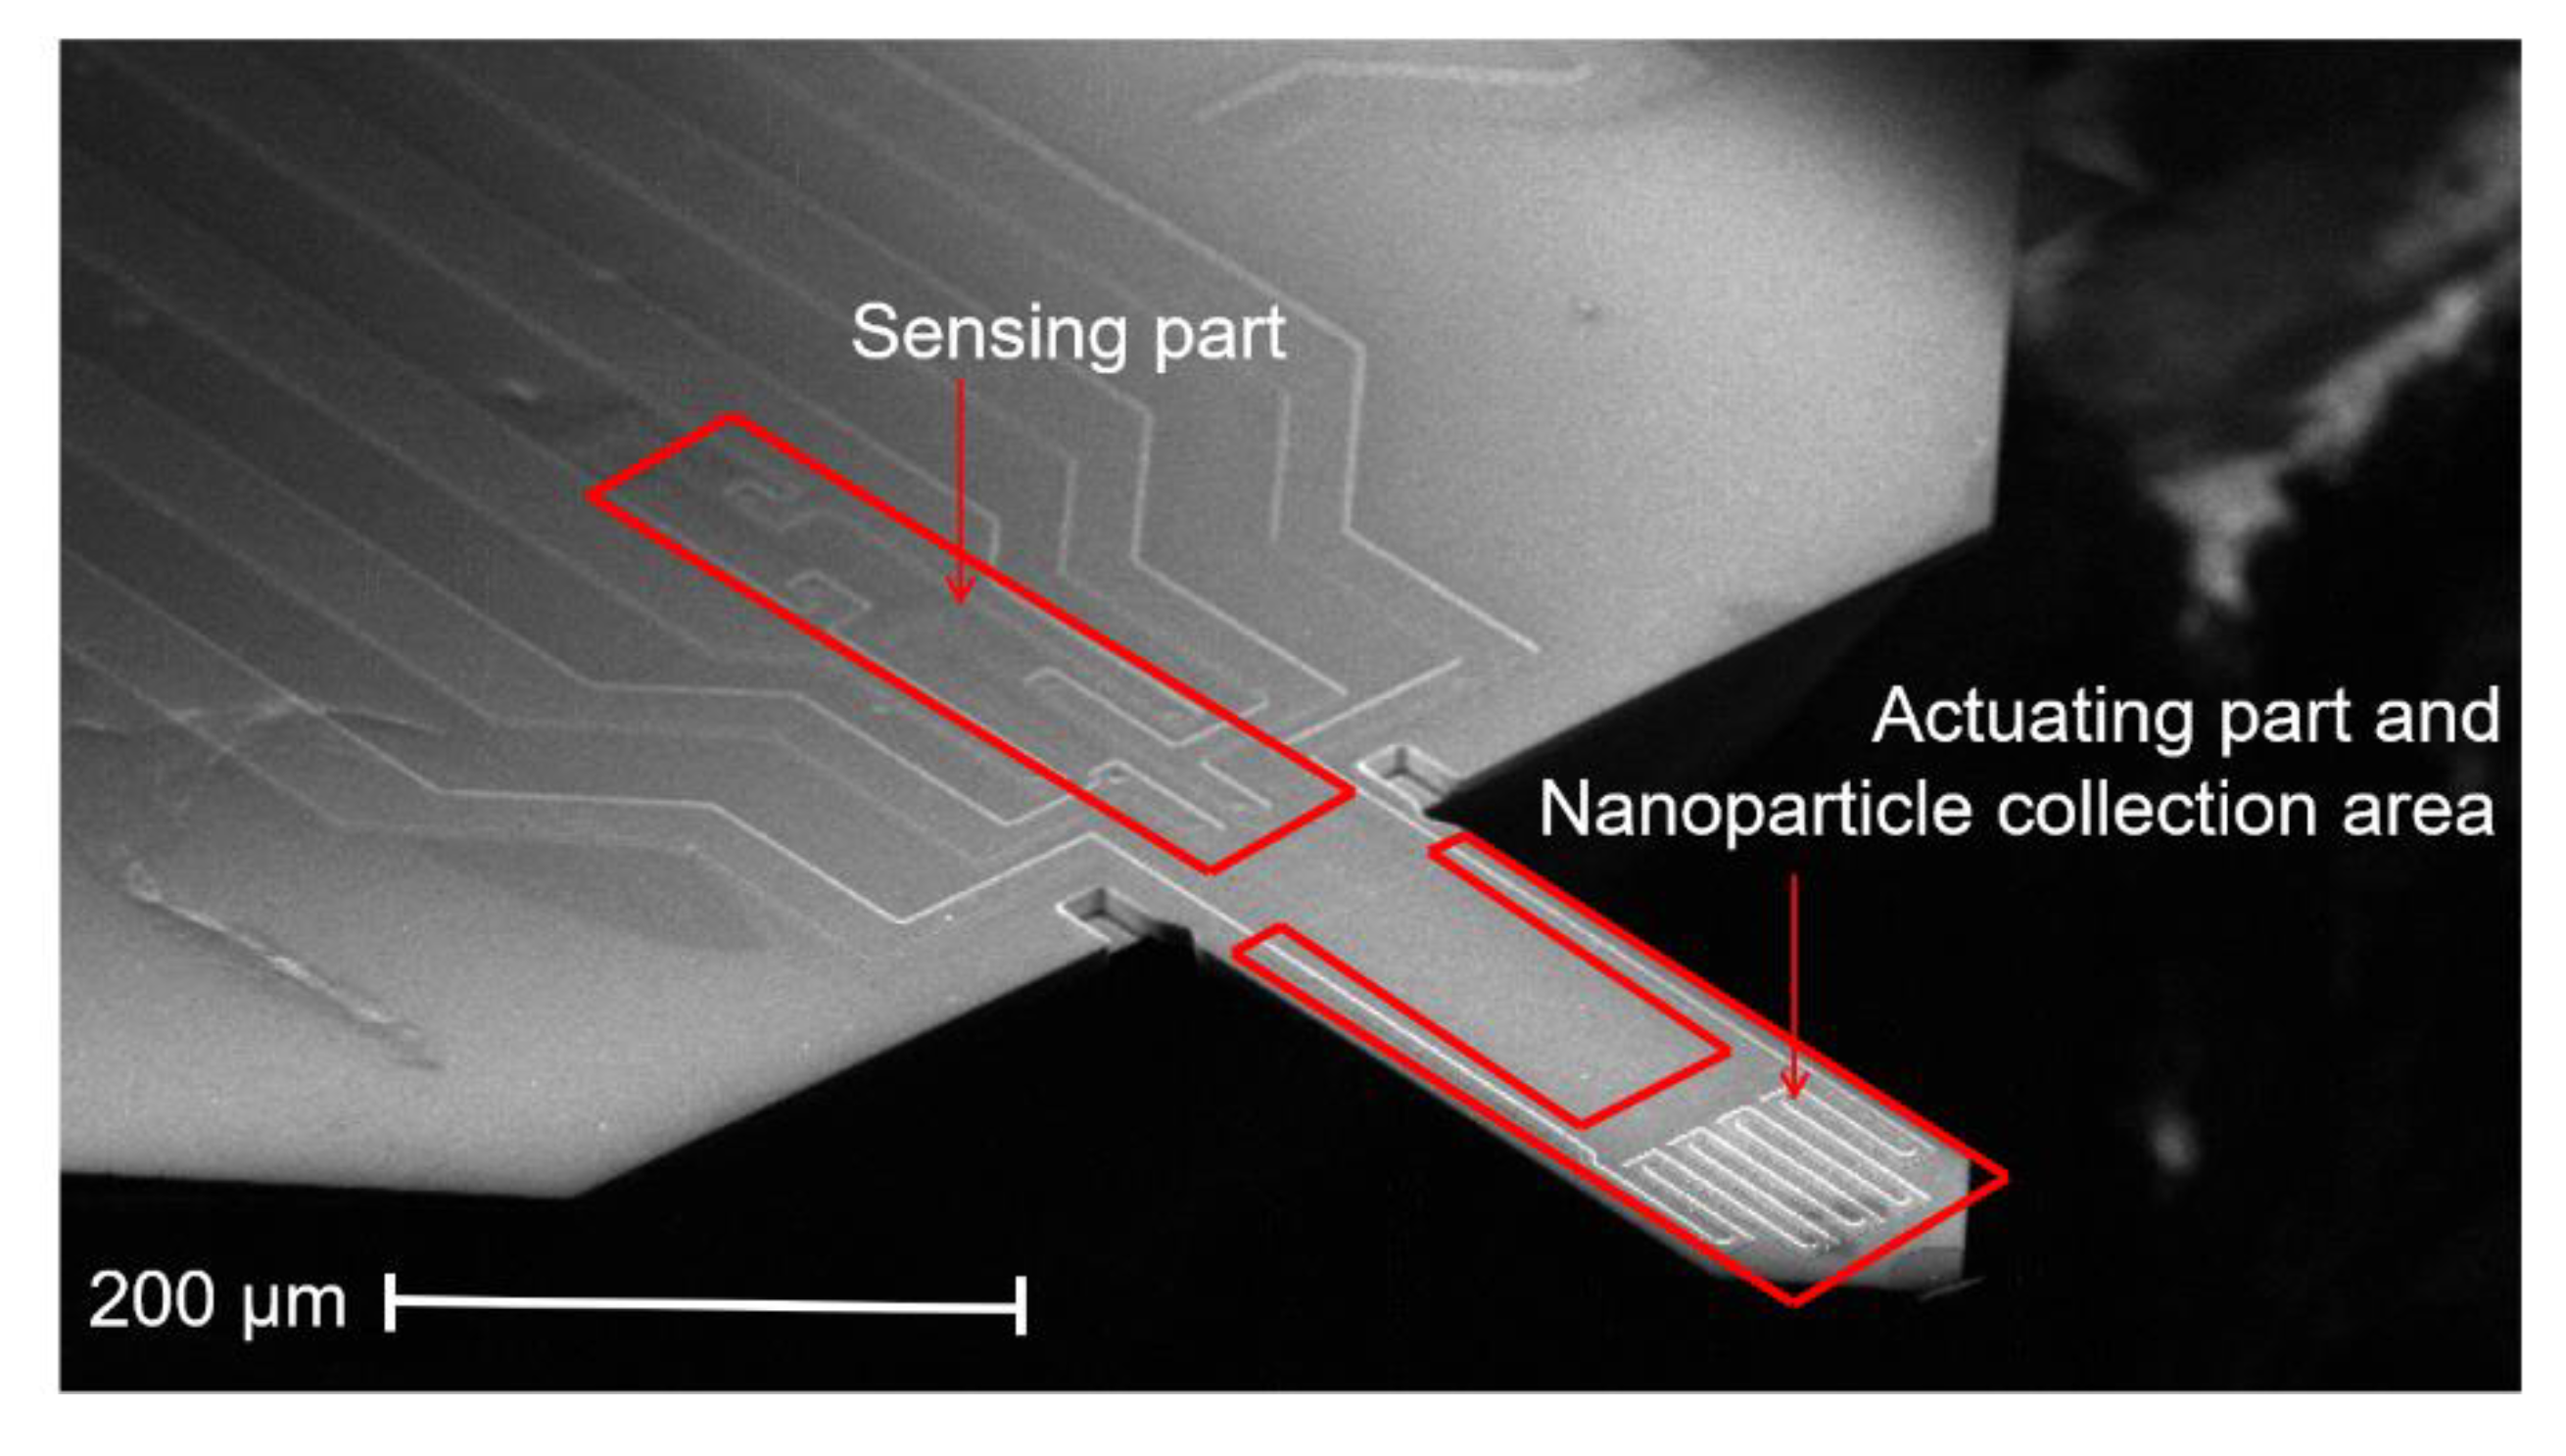
2.1. ElectroThermal Piezoresistive Cantilever Sensor (EtPCS)

An electrothermal piezoresistive cantilever sensor (EtPCS) is designed for in-plane resonant-mode detection. This EtPCS sensor consists of a heating resistor (HR) and four piezoresistors configured in a Wheatstone bridge (WB), which are intended for mechanical actuation and electrical sensing, respectively [12,19,20]. The HR has a resistance of ~992 Ω, while the four resistors of the WB have resistances of ~803 Ω, ~794 Ω, ~860 Ω, and ~847 Ω. The lateral size of each of these piezoresistors is approximately 60 × 10 µm2. As shown in Figure 1, the HR is located at the clamped end of the cantilever for efficient actuation in an in-plane bending mode. On the other hand, the WB is also closely located to the HR to facilitate the high-amplitude response of the cantilever due to the high in-plane strain sensitivity of the WB [24]. The length and width of the rectangular cantilever are 1000 µm and 170 µm, respectively, and its thickness is ~19.5 µm, which translates to a mass m0 of the cantilever of ~7.7 µg. The cantilever’s length-to-width ratio is about 6 and has been examined [25] to yield a high quality factor (Q factor) for dynamic operation. These sensors were designed and exclusively fabricated (in the Institute of Semiconductor Technology (IHT)-TU Braunschweig, Germany) using n-type silicon-based material by employing bulk micromachining technologies as described in [26,27]. The electrothermal cantilevers offer higher integration levels compared to those counterparts using external piezoelectric actuators for airborne carbon nanoparticle detections, as the sensors can be self-excited and self-readout [28]. The main sensor fabrication processes included thermal oxidation, photolithography, dopant diffusion (phosphorus and boron), etching processes (i.e., HF dip and cryogenic etching of silicon, using inductively coupled plasma-reactive ion etching (ICP-RIE) with SF6/O2 as process gas mixture), contact-holes formation, and metallization of electrical contacts (Cr/Au = 30/300 nm) followed by a lift-off process.
To evaluate the resonance frequency of the EtPCS, we utilized a lock-in amplifier (type MFLI from Zurich Instrument) as the main hardware system, as illustrated in Figure 2b. The electrical signal generated by the WB is amplified using an external instrumentation amplifier (Analog Devices, AD8421) and is fed afterward into the MFLI. The MFLI instrument provides an application programming interface (API) that allows users to communicate with the hardware through their own software. In this case, we employ our own LabVIEW-based software for evaluating the resonance state of the EtPCS. For nanoparticle collection field, a p-type area (~170 × 740 µm2) was created on the free-remaining region of the cantilever beam with its boundary close to the WB (as depicted in Figure 1). It was subsequently connected to a negative high direct current voltage, i.e., −115 V. Furthermore, a copper ring (Figure 2a) was connected to +115 V and placed around the cantilever. Consequently, positively charged (and uncharged) nanoparticles would be attracted (and polarized/attracted) to the selected cantilever surfaces by electrophoresis and dielectrophoretic mechanisms, respectively [27,29,30]. This nanoparticle sampling method has been proven to be effective not only for larger silicon microcantilevers but also for smaller nanoscale silicon pillars [17,31,32].
Due to the existence of direct-thermal parasitic coupling effects on the sensing part resulting in an asymmetric amplitude shape and a reverse phase response (Fano resonance) [30], a reference-signal subtraction method is embedded in our LabVIEW system. This method has successfully been demonstrated to remove the parasitic effect on the EtPCS output signal and construct an optimized frequency response [24,33,34]. In this work, we created a LabVIEW-based system to accomplish a numeral reference parameter for a differential calculation to give an optimized frequency response. In Figure 3a, it is demonstrated that unoptimized frequency response is observed when the reference parameters were set to zero. By addressing the reference amplitude to 0.43 V and using 63.9° for the phase, we could realize an optimized frequency response, i.e., a symmetrical amplitude shape and monotonical phase response (Figure 3b). The reference amplitude was estimated at the mid-point of the maximum and minimum values of the asymmetric amplitude, while the reference phase was determined at a point very close to the phase baseline of the phase response. This numeral reference was then implemented in a phase-locked loop (PLL) system (LabVIEW-based) to keep the optimized state for phase locking and easily facilitate resonance-frequency tracking in real-time (Figure 4).

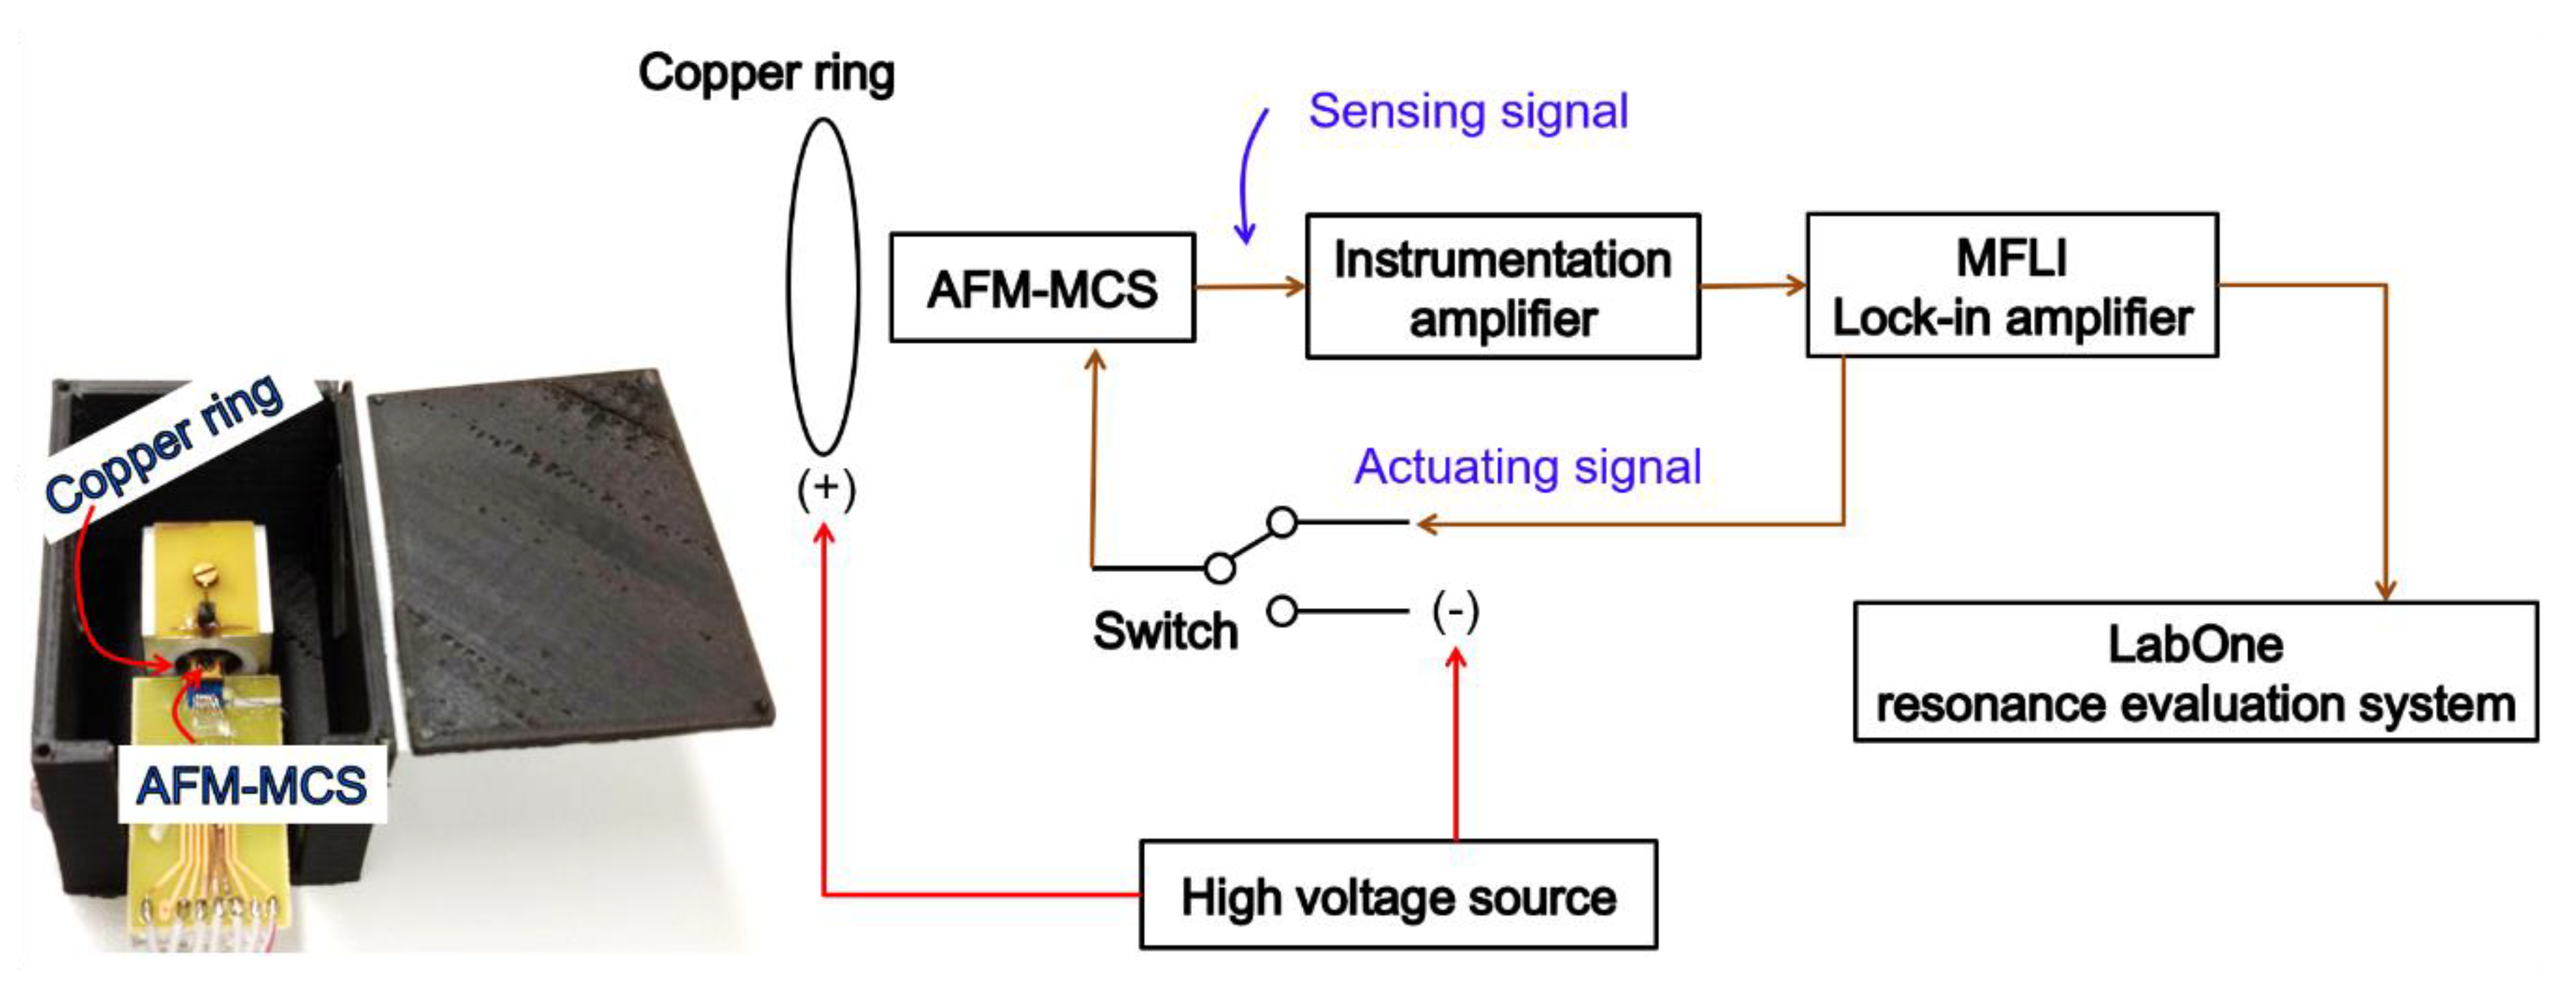
2.2. Atomic Force Microscopy Micro-Cantilever Sensor (AFM-MCS)

A tip-less atomic force microscopy micro-cantilever (AFM-MCS, PRSA-L300-F80-TL-PCB) beam, fabricated by SCL-Sensor. Tech. Fabrication GmbH comes with an Al meander resistor and an integrated piezoresistive Wheatstone bridge (Figure 5) [35]. The Al meander resistor, whose resistance amounts to ~37 Ω, is embedded between insulating layers and works as a thermal bimorph actuator to trigger an out-of-plane bending mode. Moreover, four integrated p-type resistors in the sensing part (with a resistance of ~999 Ω, ~967 Ω, ~1025 Ω, and ~971 Ω) are configured in a half Wheatstone bridge of two longitudinally strained piezoresistors on the cantilever close to its clamping and two unstrained resistors on the bulk area. The length and width of this cantilever are 300 ± 5 µm and 110 ± 3 µm, respectively. Its thickness is ~4 µm, and the mass m0 of the cantilever amounts, thus to ~0.31 µg, i.e., a factor of ~20 less than the EtPCS.
By using the MFLI instrument, we measured the resonance frequency using the default LabOne software of the MFLI, as illustrated in Figure 6. Compared with the EtPCS setup, where the parts for actuating the cantilever into resonance and for particle collection are located in separate areas of the cantilever (cf. Figure 1), the actuating part of the atomic force microscopy micro-cantilever sensor (AFM-MCS) also serves as nanoparticle collection area. Consequently, cantilever-actuation and particle–collection steps were executed successively by using a manual switch. The time duration of both steps, i.e., measurement and particle collection were 80 s and ~1 min, respectively. During the measuring step, resonance frequency was captured in one frequency sweep and not tracked in real-time using a phase-locked loop (PLL). During particle collection, the meander resistor was connected to a negative high voltage of direct current (DC), i.e., −115 V, while a copper ring placed around the cantilever was connected to +115 V of DC.
We excited the actuating part of the AFM-MCS with AC and DC voltage amplitudes of 200 mV and 1 V, respectively (corresponding to an input power of P = 27.3 mW). Figure 7 depicts the amplitude and phase responses of the AFM-MCS upon applying a frequency sweep in the range of 89.1 kHz–89.6 kHz. It shows a maximum amplitude considered as the resonance state at ~89.38 kHz. The corresponding resonance phase is ~72°. Unlike the EtPCS, the frequency response of the AFM-MCS cantilever (Figure 7) shows a symmetrical amplitude shape and monotonical phase response without any additional optimization. For this type of thermal bimorph actuation, the sensing part with piezoresistors is located away from the actuating part, i.e., the meander-shape resistor. Hence, the AFM-MCS shows much less direct-thermal parasitic crosstalk effects. Nevertheless, AFM-MCS cantilever has a smaller amplitude (~19 mV) and a lower Q factor of 189 (which is determined by gradient phase fitting [36]) compared to the EtPCS, whose amplitude and quality factor (Q) amount to ~0.43 V and ~2000, respectively.

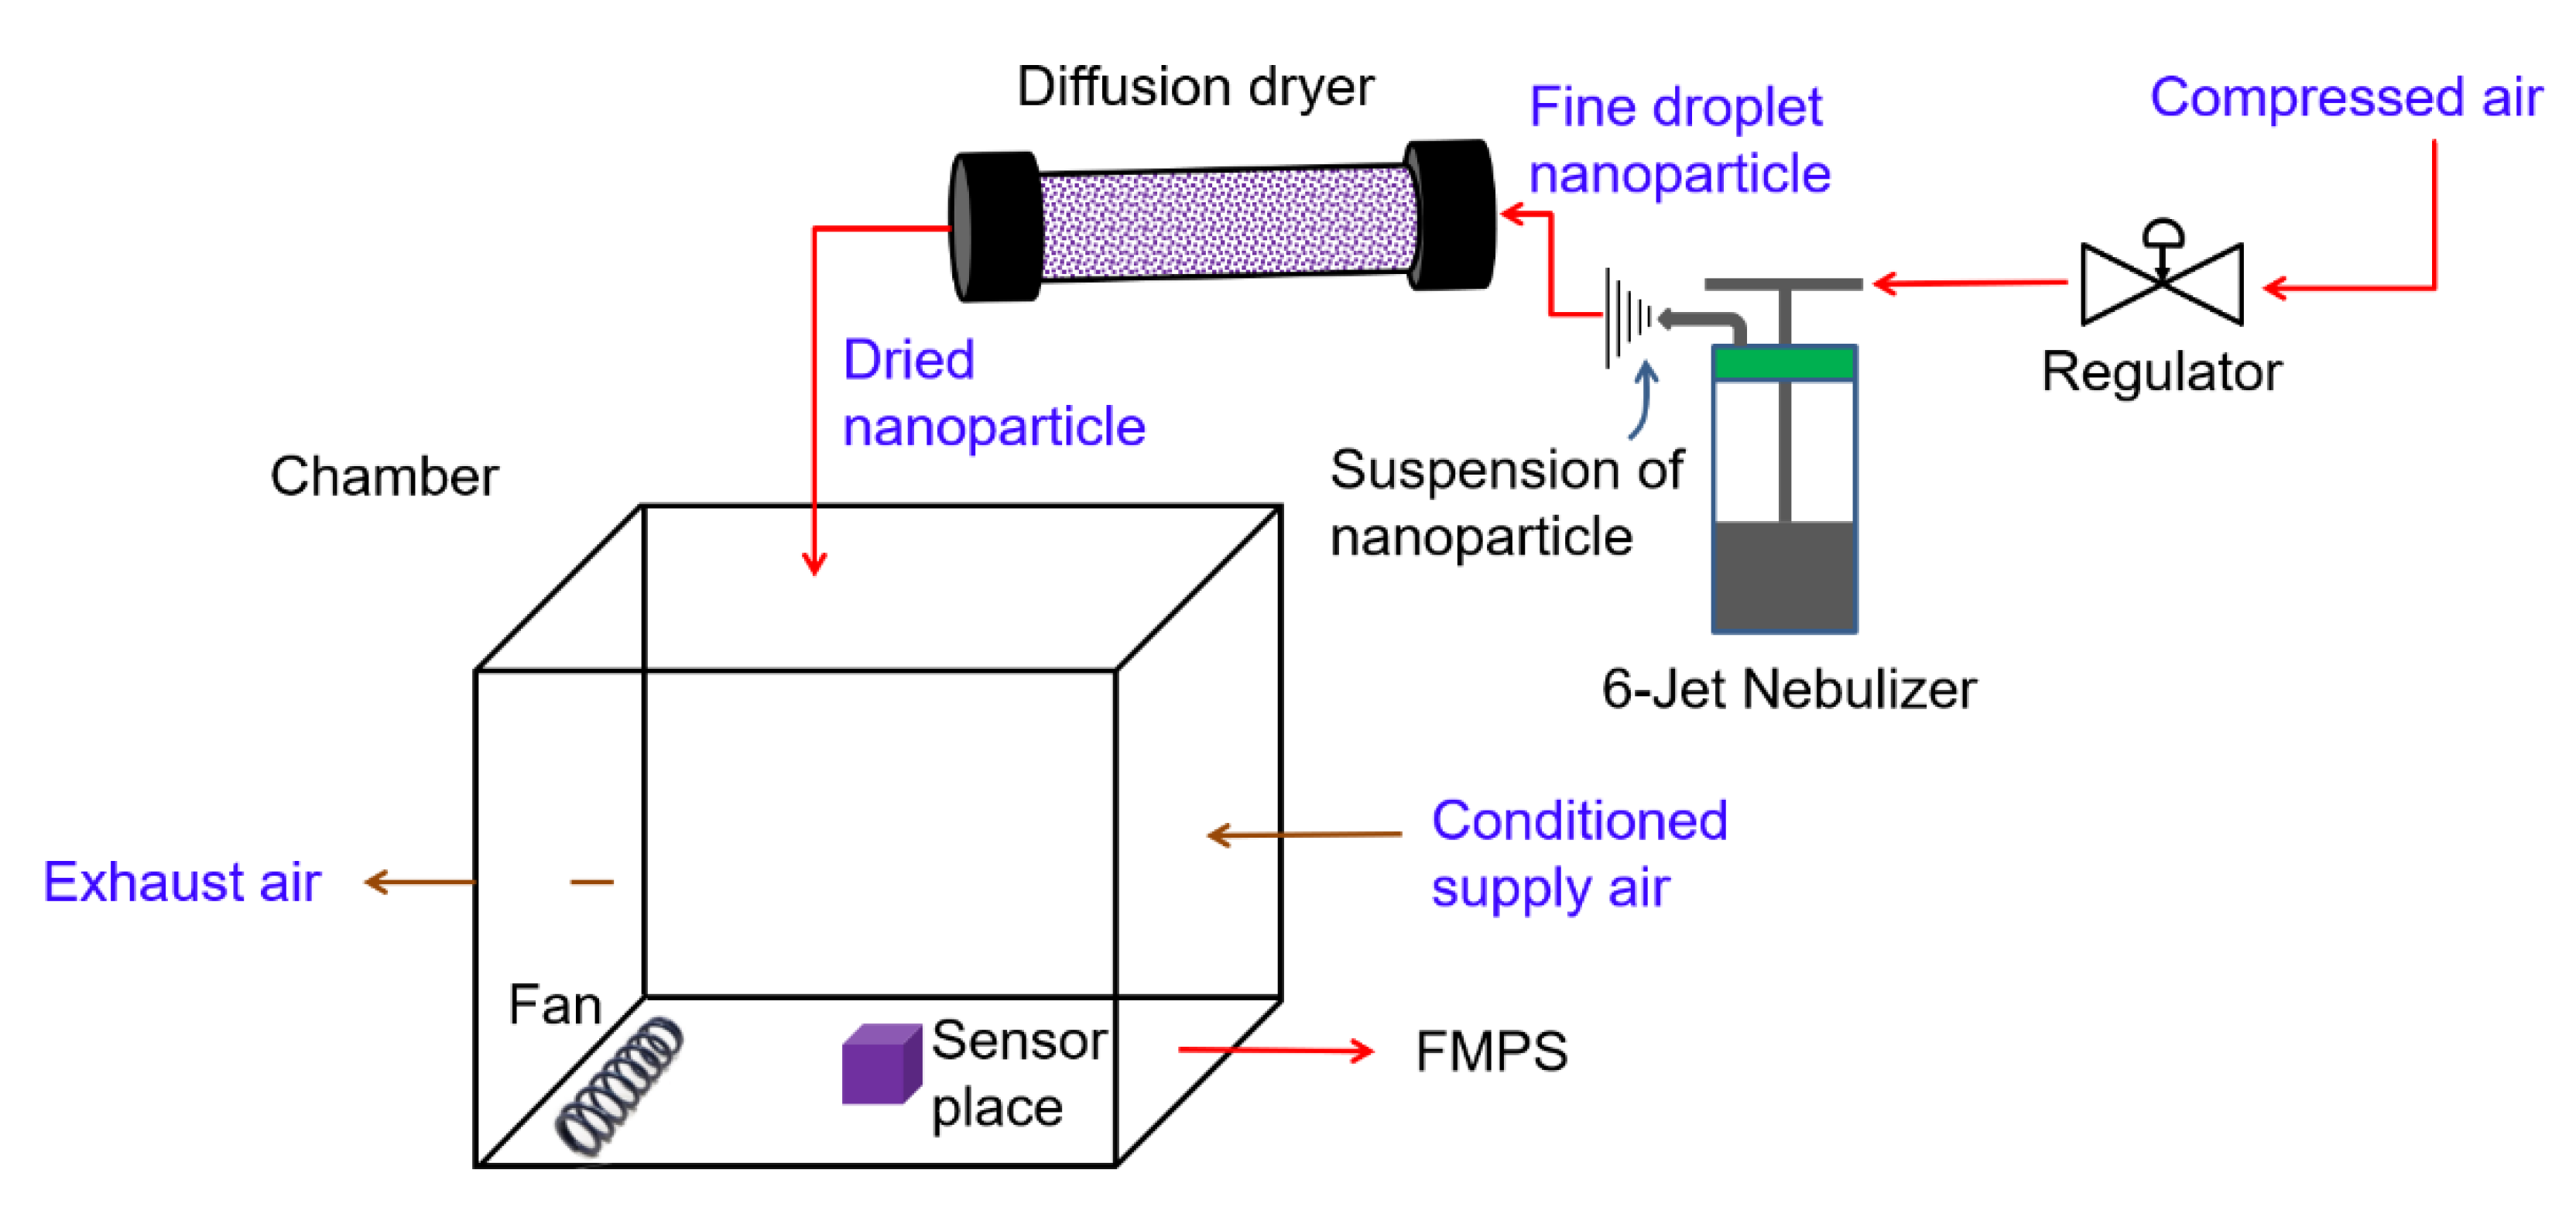
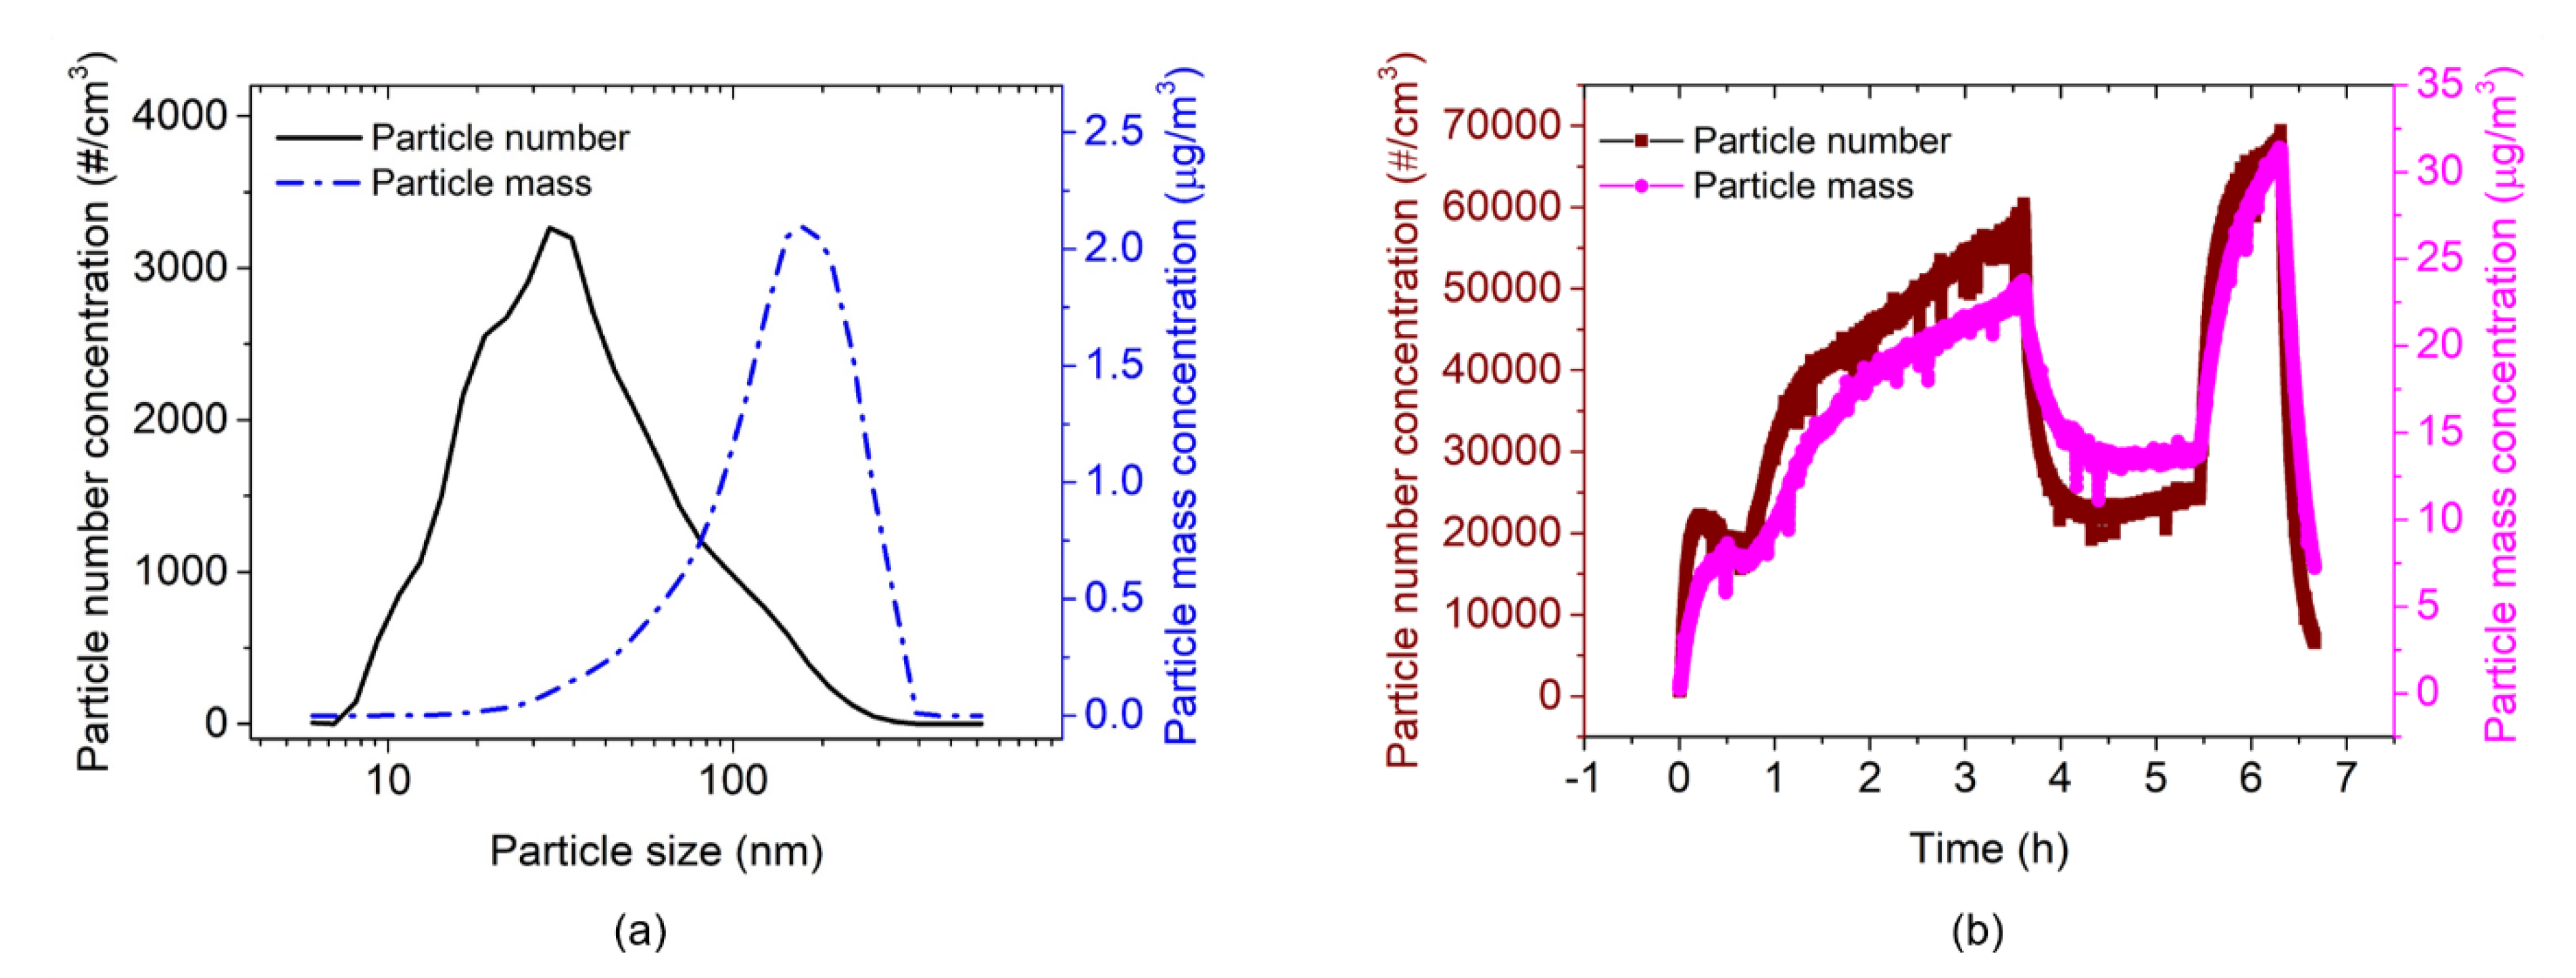
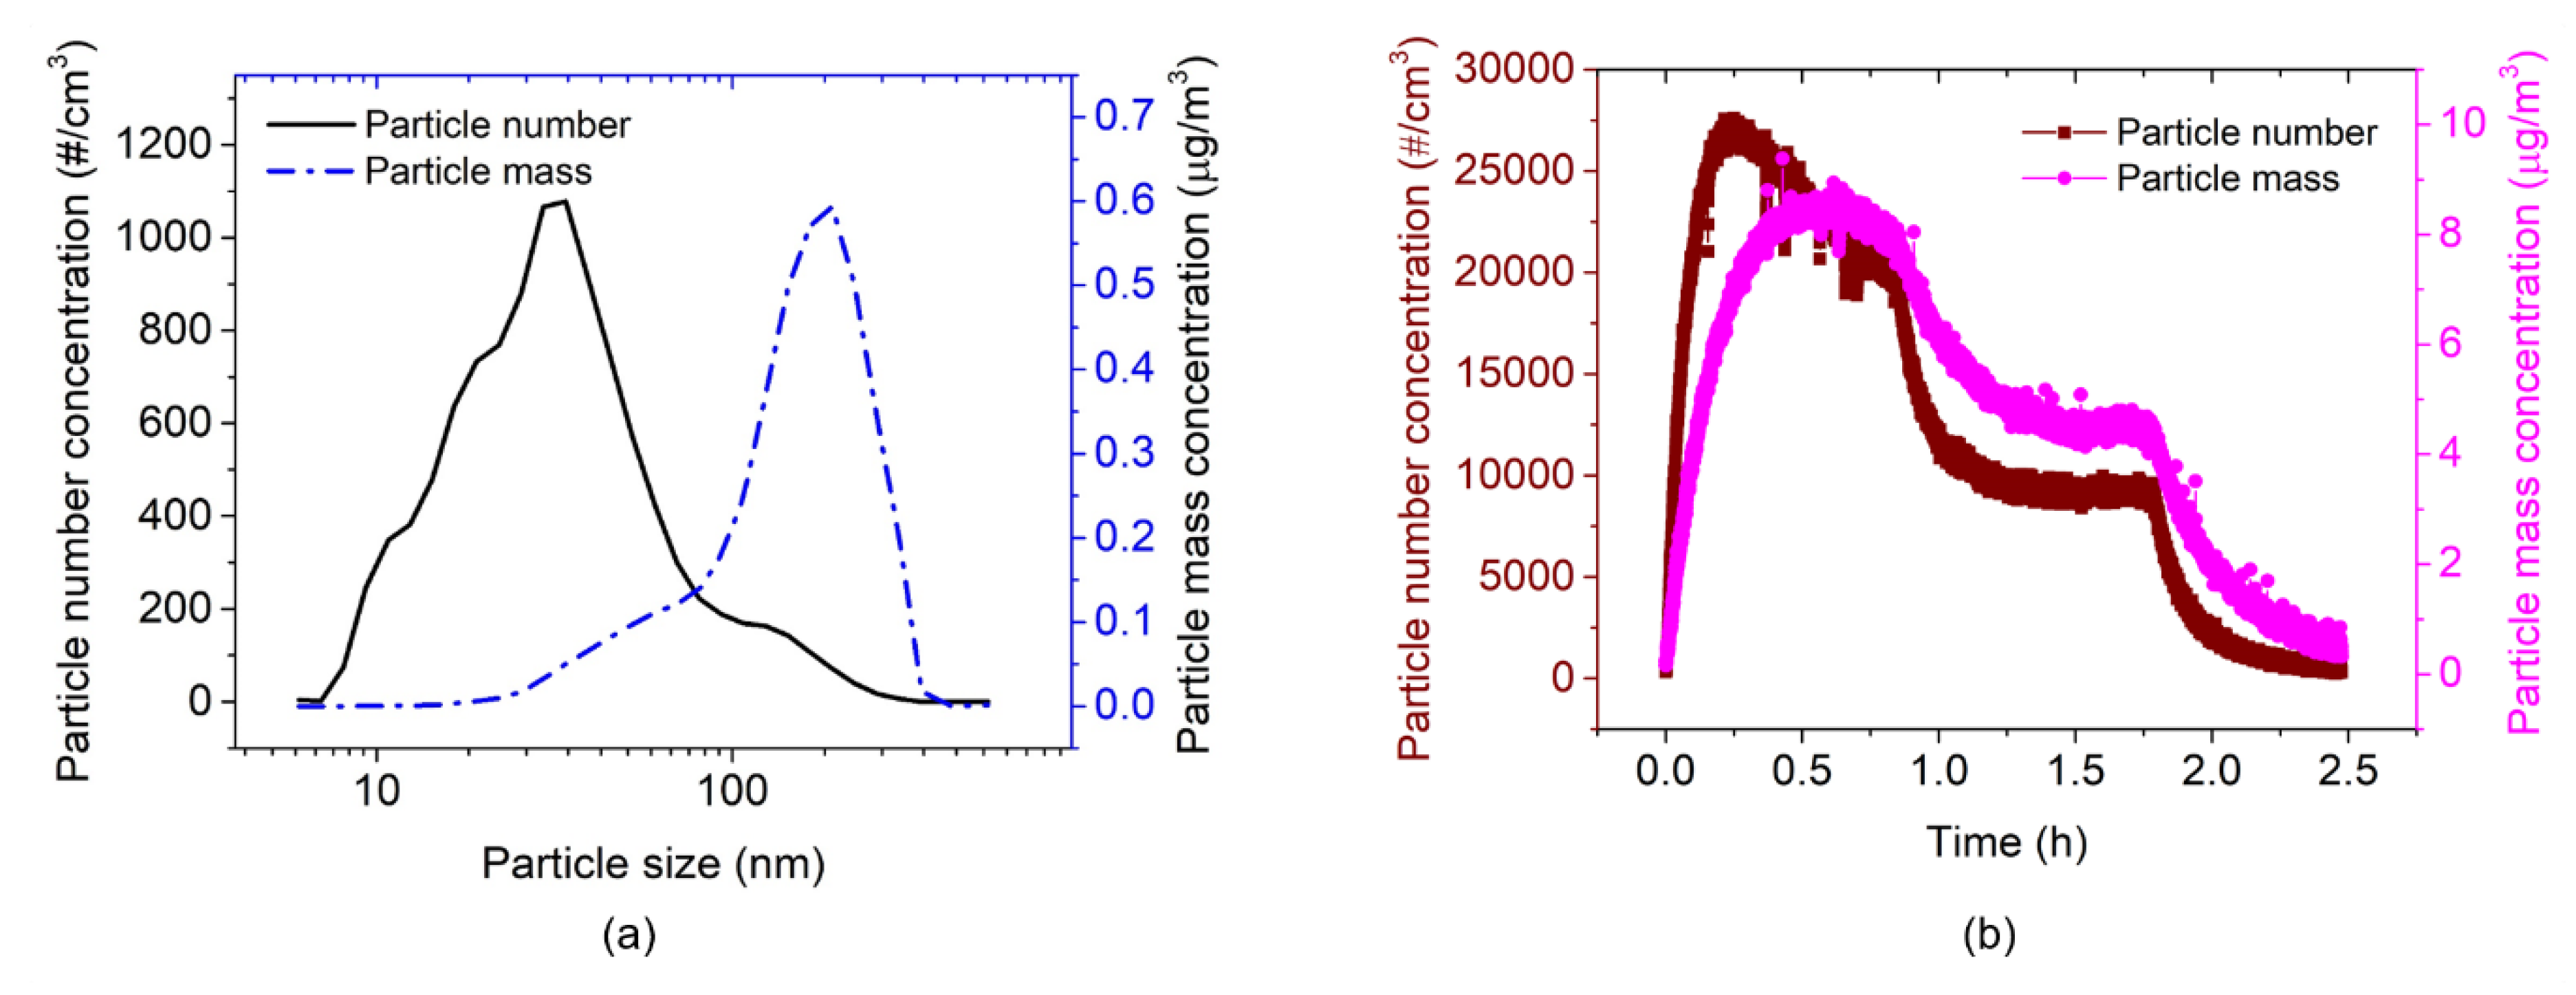
2.3. Nanoparticles Generation

An assessment of particle exposure using carbon-based nanoparticles was performed in a 1 m3 test chamber made of glass. The test chamber was operated under dynamic conditions, i.e., at a continuous air-flow rate of 10 L/min, a temperature of ~23 °C and relative humidity of ~40–50%. The generation of nanoparticles was started by nebulizing carbon nanopowder (<50 nm, Sigma-Aldrich, Taufkirchen, Germany). Initially, this powder was dispersed in a solution of water and isobutanol using an ultrasonic bath. As illustrated in Figure 8, compressed air (controlled by a regulator) is used to alter the input air pressure that enters a 6-Jet Nebulizer (BGI Inc., Butler, NJ, USA). Inside the nebulizer, the incoming compressed air emits bubbles in the nanoparticle solution and further results in a fine-droplet jet. Furthermore, the droplets (sprayed from the nebulizer) were transferred directly through a diffusion dryer (TSI Inc., Model 3062, Shoreview, MN, USA) to be dried. The diffusion dryer contained a trap for collecting large drops of water and removed excess moisture using desiccants (e.g., silica gel) by diffusion. At the outlet of the dryer, dried nanoparticles were obtained, which were then flown into the sealed glass chamber. Moreover, a ventilation fan was used to circulate the generated nanoparticles inside the chamber [27,28].

3. Result and Discussion

To evaluate the performance of the cantilever sensors for nanoparticle mass-concentration monitoring, carbon nanoparticle sampling and detection were conducted under an environment, as shown in the previous section. The nanoparticles generated in a sealed chamber were continuously measured by a standard laboratory particles-measurement system (i.e., Fast Mobility Particle Sizer (FMPS), TSI 3091) to determine the total particle number concentration and its size distribution within 5.6 nm to 560 nm divided into 32 size bins. In addition, we determined mass concentrations of the airborne particles from the number concentrations assuming a constant particle density of ρ = 2.26 g/cm3 and spherical particle shape according to ρ × π/6 × diameter3.
A resonant cantilever, as a gravimetric-based sensor, represents a mass-concentration detector. As shown in Equation (1), a calibration factor (CF) in units of µg × min/(m3 × Hz) is needed to convert the measured resonance-frequency shift rate (ΔfR/tCT) into a mass-concentration regime, which is done against the FMPS as a standard reference instrument [27,30]:
C m = C F × Δ f R t CT
where Cm and tCT are nanoparticle-mass concentration measured by the cantilever sensor and particle- collecting time (sampling time), respectively. A limit of detection (LOD) of the sensor can be formulated using this CF as follows:
L O D = 3 × σ × C F t CT
where σ is the frequency-noise floor determined over tCT.

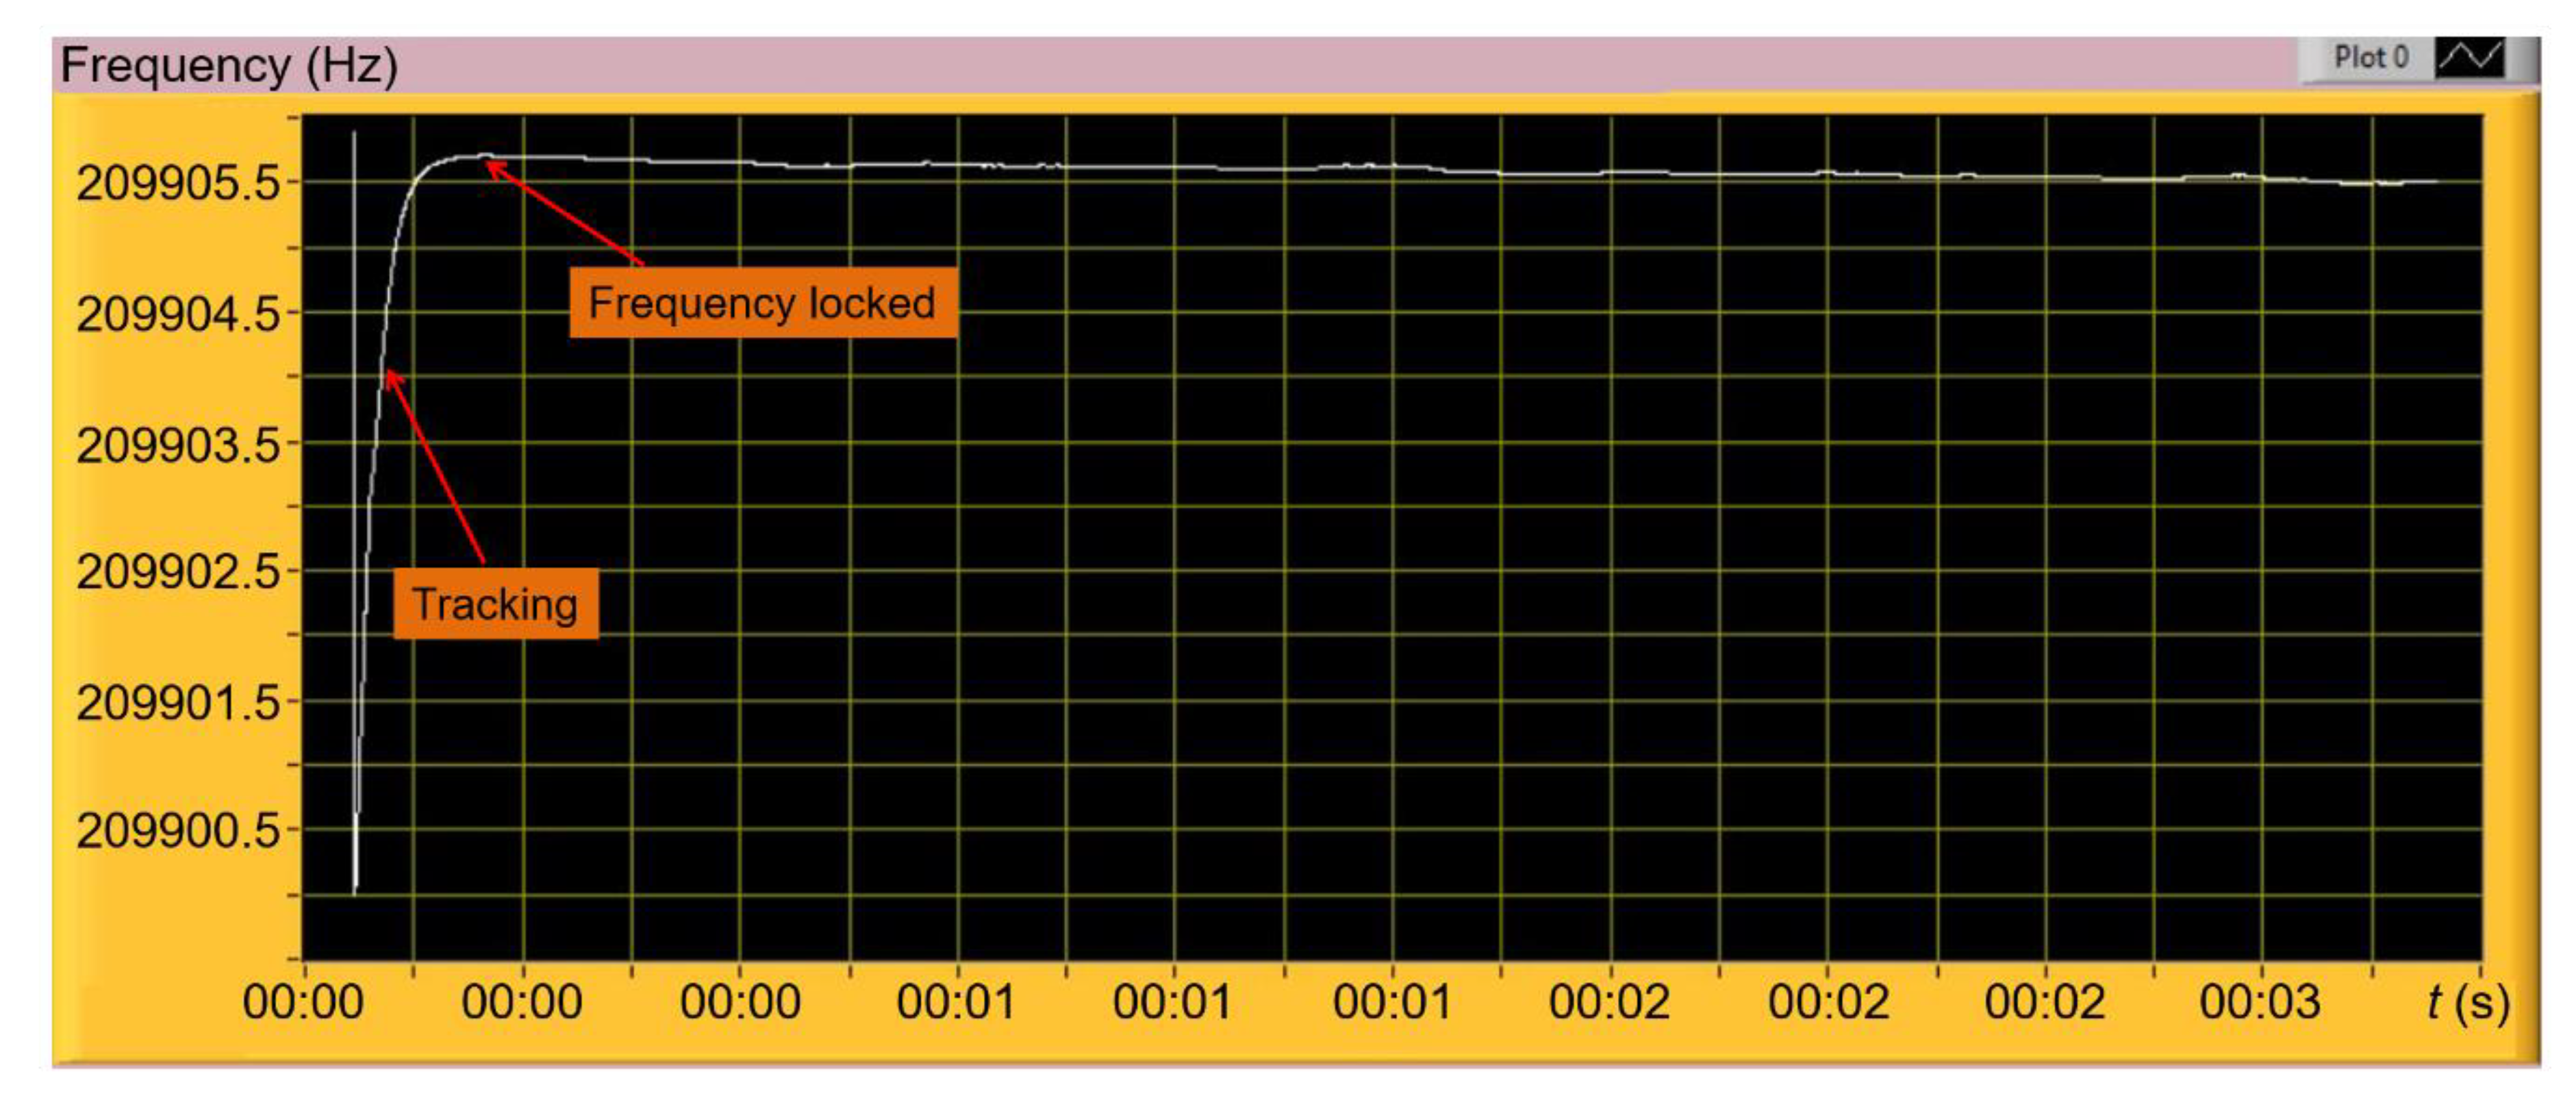
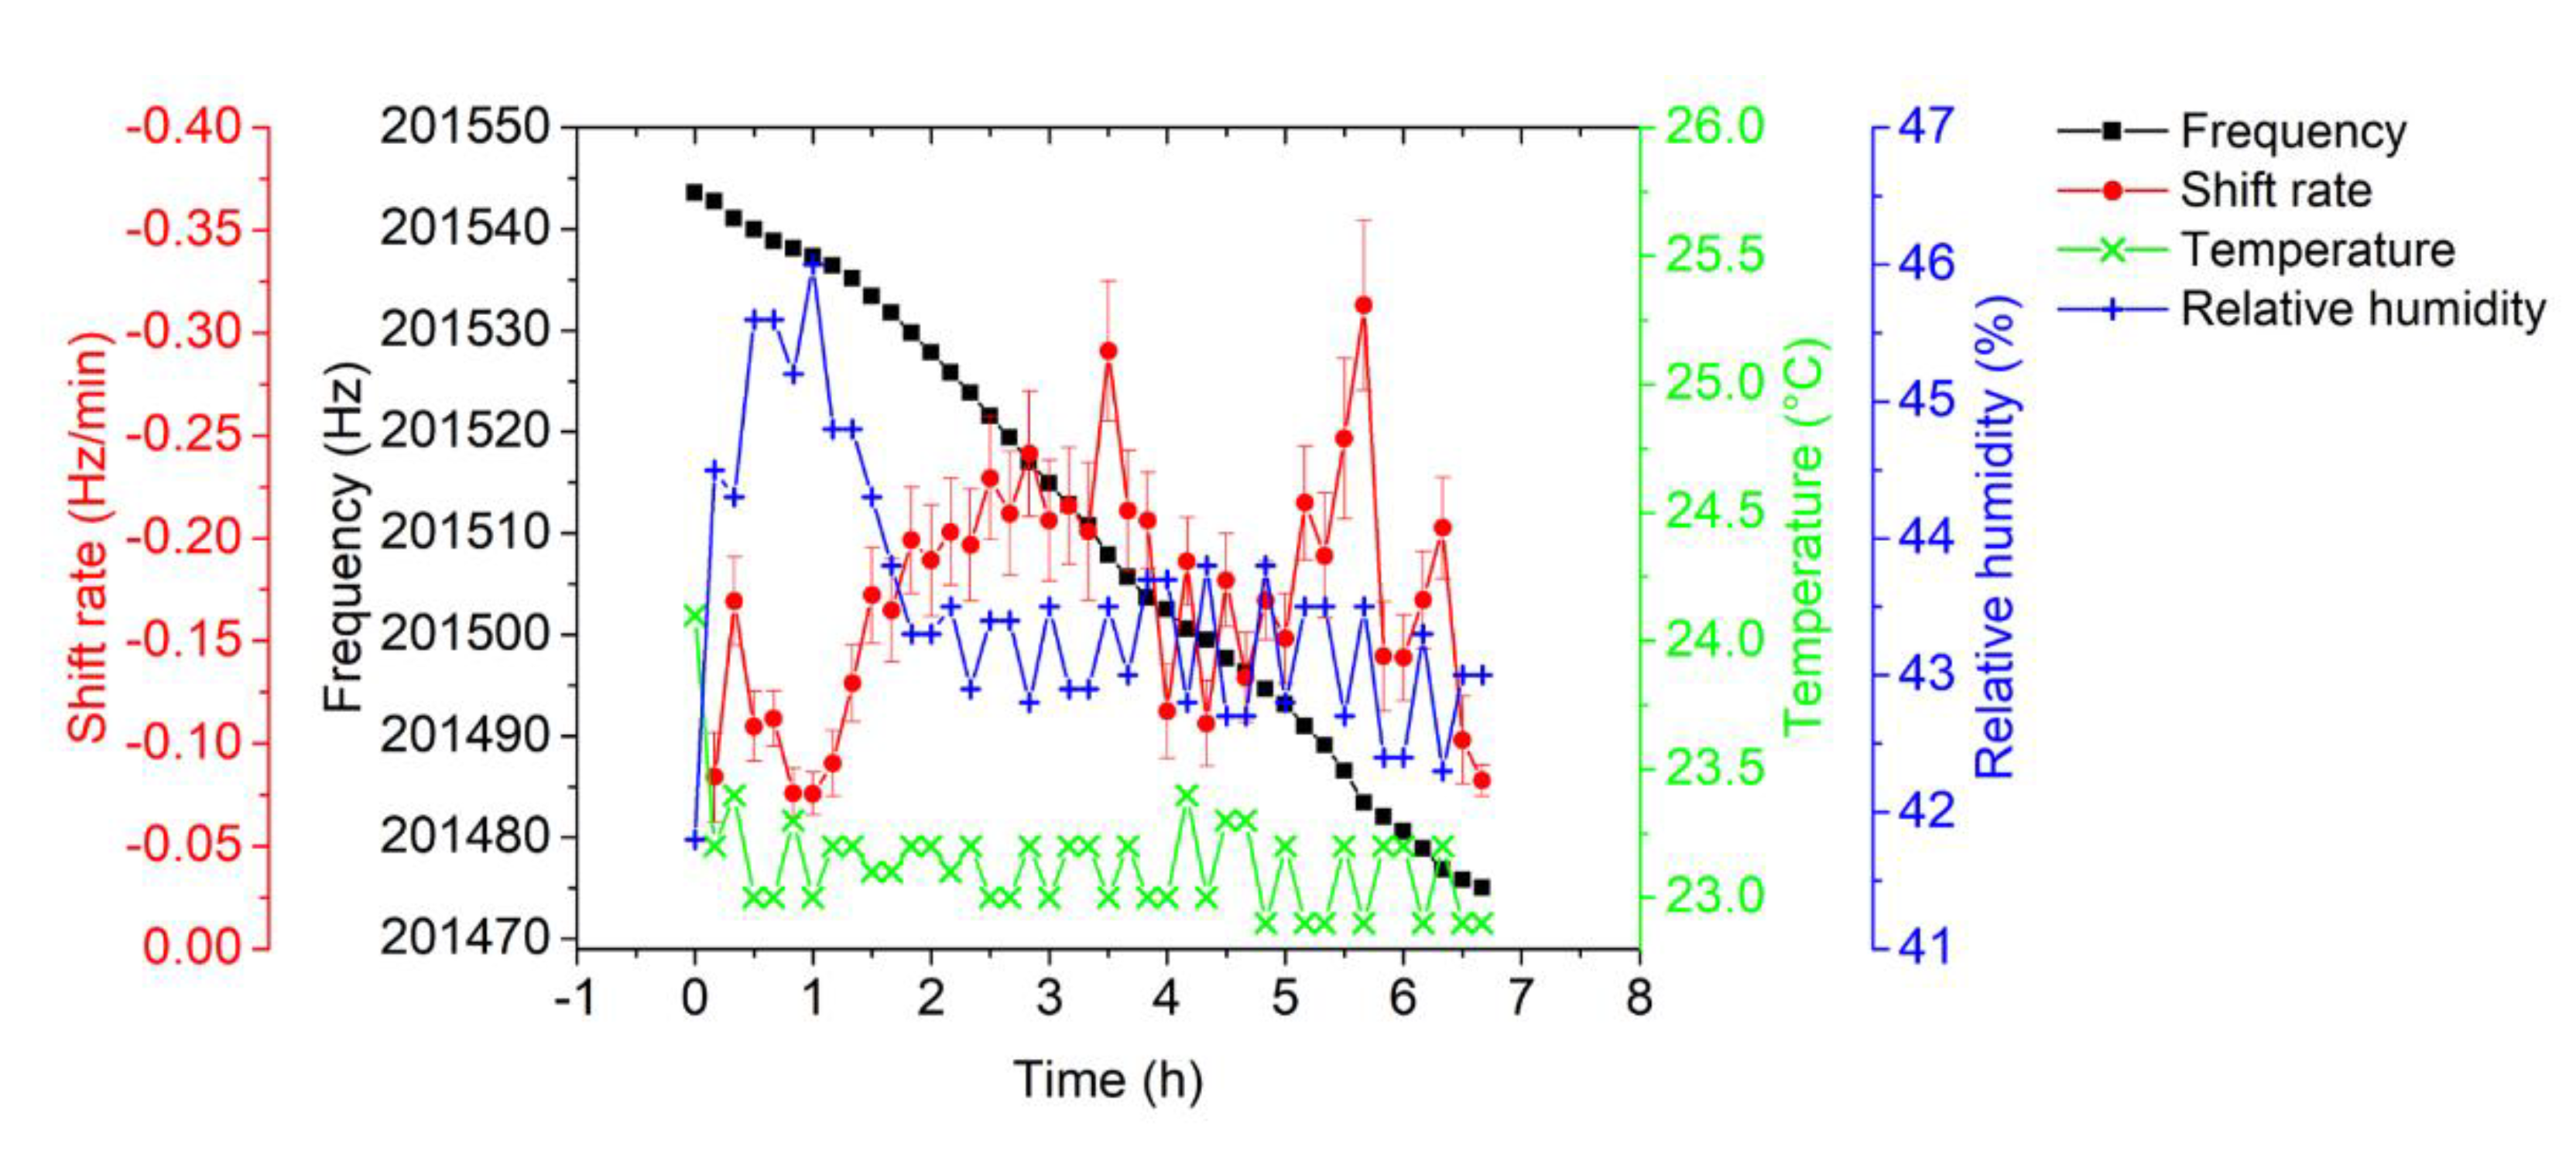
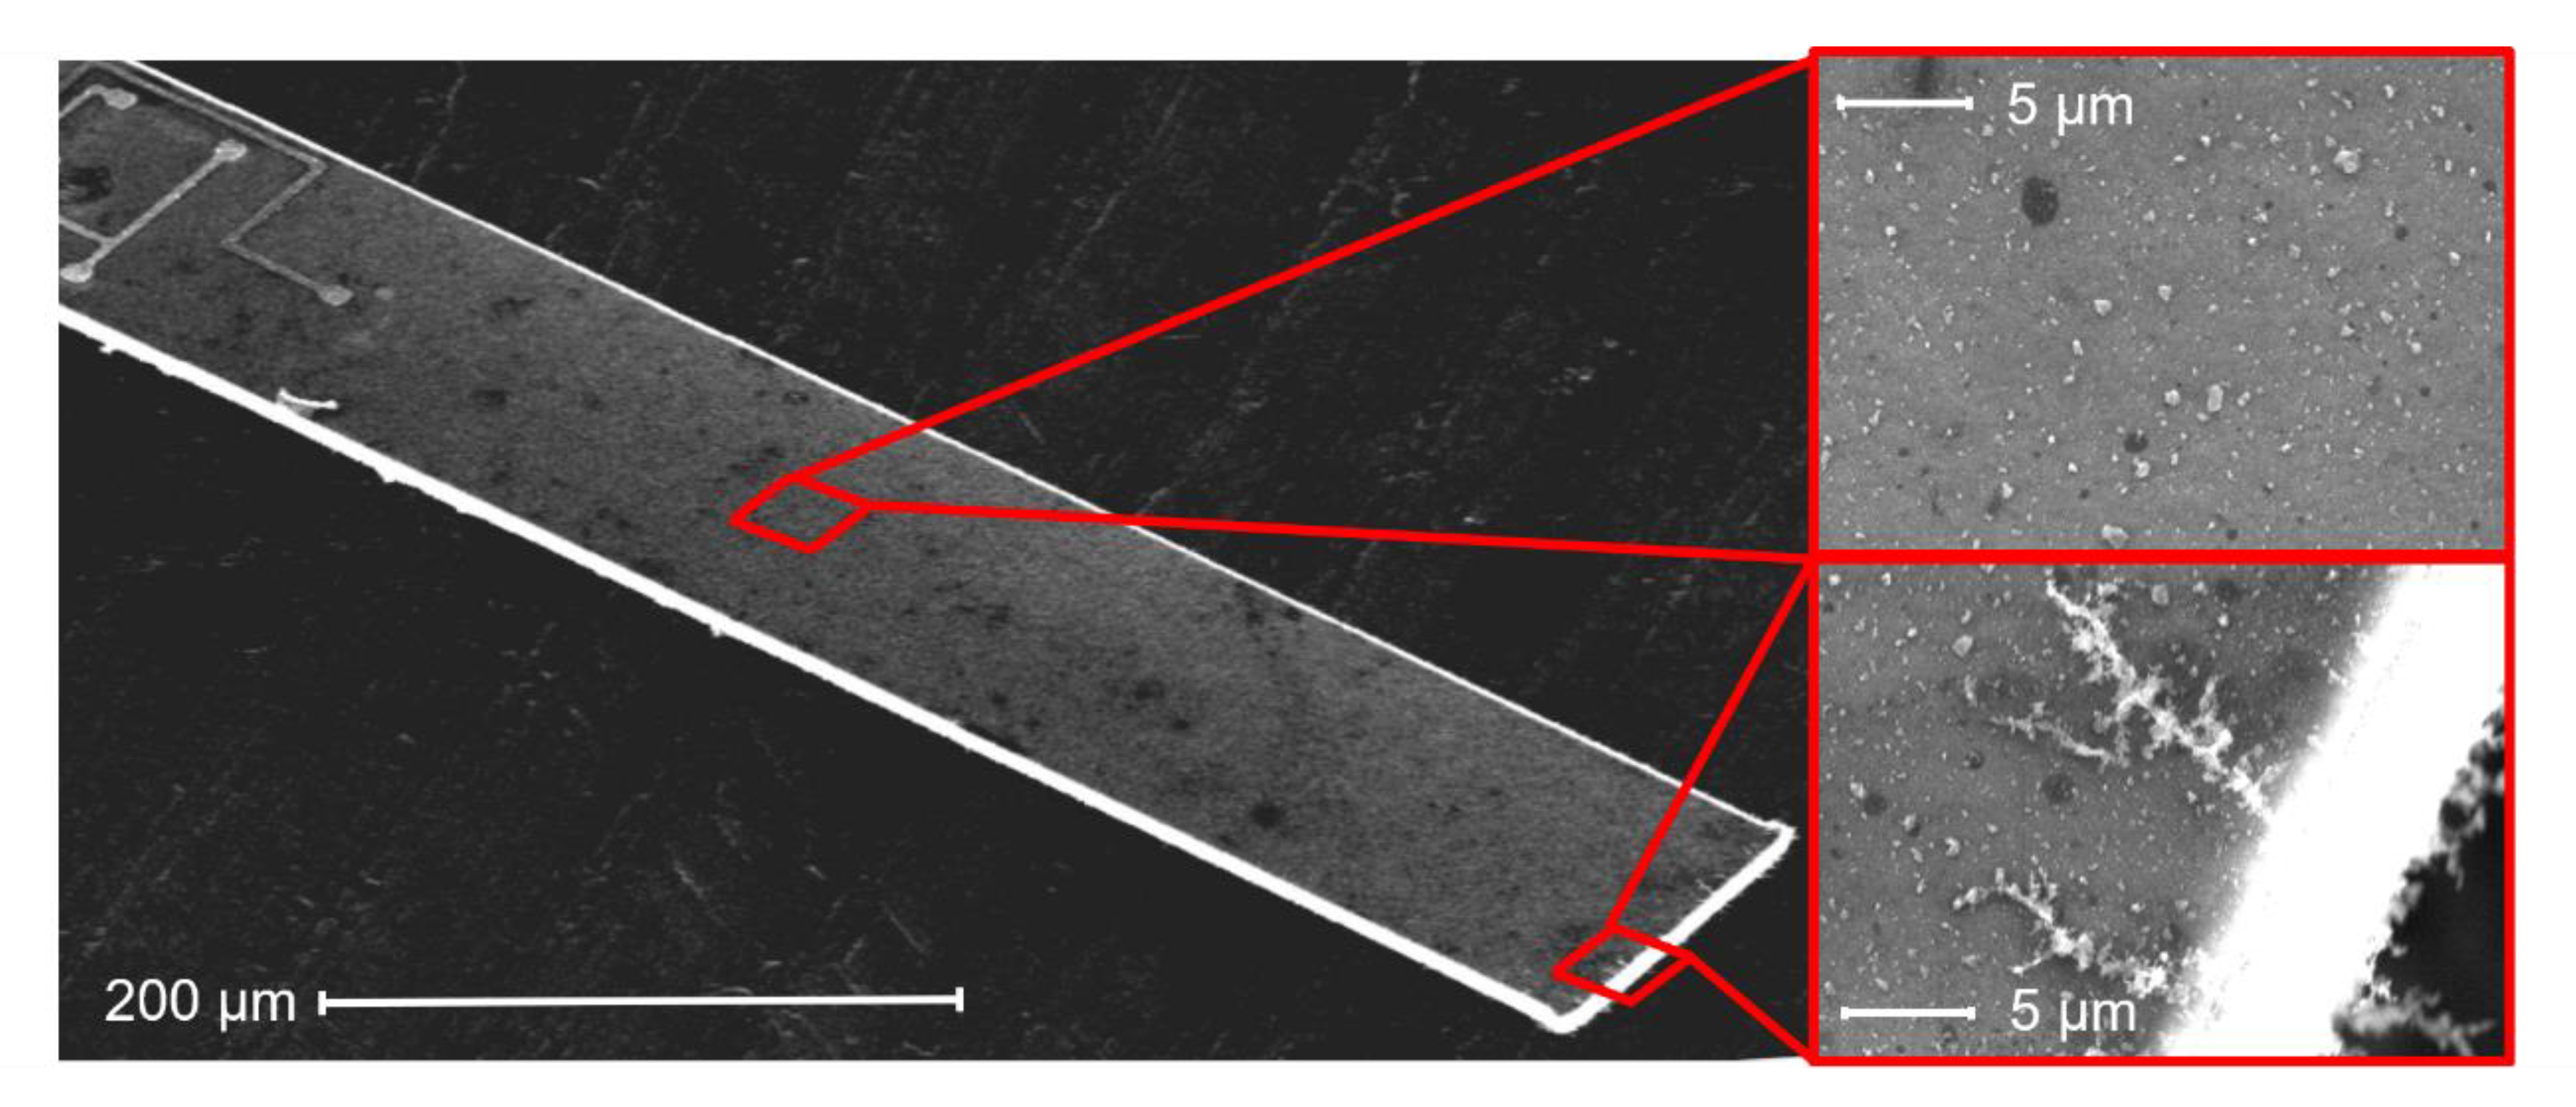
3.1. EtPCS Cantilever Performance

The EtPCS was operated under a fixed air-flow rate. A constant flow of particle-laden air of 680 cm3/min [29] generated by a battery-powered small DC fan was conducted through the small inlet of the sampler. Typical particle size distributions of number and mass concentrations were measured by the FMPS, as shown in Figure 9a, revealing average particle sizes of ~30 nm and ~165 nm, respectively. Corresponding concentrations of particles were measured for ~6.7 h, as delineated in Figure 9b, showing particle number concentrations in the range of approximately 20,000–66,000 #/cm3. These particle number concentrations are correlated with mass concentrations in the range of about 7–31 µg/m3, which were calculated by:
C m _ FMPS ( in   µ g m 3 ) = π 6 ρ ( in   kg m 3 ) × 10 12 × i = 1 32 d i 3 ( in   nm 3 ) × C n _ FMPS , i ( in   # cm 3 )
where Cm_FMPS and ρ denote the total particle mass concentration (measured by FMPS) and particle density, respectively, while di and Cn_FMPS,i are the particle diameter and particle number concentration in the i-th size bin, respectively.
Simultaneously, the EtPCS was operated with its resonance frequency locked at −25° and tracked using the LabVIEW-based PLL in real-time at a rate of about 837.1 Sa/s. The resonance frequency decrement due to particle collection and its frequency-shift rate determined over a 10-min sampling time is delineated in Figure 10. In contrary to our previous design [27,30], we did not operate the EtPCS under cyclic switching between separated particle-sampling and frequency-tracking modes but measured frequency shift under continuously maintained particle collection, i.e., at applied high voltage. In addition, fluctuation of temperature and humidity in the chamber were maintained at nearly constant values fluctuating by less than ~0.2 °C and ~0.6%, respectively.
Figure 11a depicts nanoparticle mass concentrations as measured by the EtPCS cantilever in comparison with the FMPS reference. For calculating the mass concentrations from the frequency- shift rate, Equation (1) was used with CF = 96 µg×min/(m3 × Hz). Within the sampling time of 10 min, an average deviation of 24.9 ± 5.3% relative to the ‘true values’ measured by FMPS was observed at an average uncertainty of 2.3 ± 0.1 µg/m3. A much smaller deviation (7.2 ± 1.9%) was achieved in a period of 1 h–3.3 h. Large error contributions were found for the measured values within the first 40 min and at the last 2.7 h. This may have been caused by fluctuations of ambient conditions (T, rH, particle size distribution) around the cantilever [37,38]. In the previous work [24], we found a resonance frequency decrease of a bare EtPCS of up to ~11 Hz upon an increase of both temperature (~2 K) and rH (~14%). From Figure 10, we can derive shifts of humidity (~4%) and temperature (~−1 K) within the first 0.5 h, which may have contributed to the observed peak in resonance frequency shift (~−1.7 Hz) and mass concentration (~16 µg/m3, Figure 11a). Furthermore, we have to discuss the considerably increased deviations in the second half of the exposure-measurement period. Here, the battery that powers the fan was fortuitously drained, and thus, the forced airflow towards the cantilever was stopped after running for 3.5 h. Supposedly, this effect resulted in a smaller total volume of sample air, which was laden with particles fluctuating in size according to the distribution shown in Figure 9a. This can be expected to lead to an increased uncertainty of the adsorbed mass on the cantilever [37]. On the other hand, surface stress on the cantilever beam due to a fluid drag force was released, omitting its effect on resonance frequency [39]. A further source of error could be the loss of large line-shape agglomerates, which preferentially form at the edges of the cantilever. Because of their larger inertia (vs. single particles), they may be prone to detach during resonance oscillation of the cantilever. This would explain the sudden decrease in the mass concentration measured with the EtPCS after ~5.5 h.
Figure 12 shows a scanning electron microscope (SEM) image of an enlarged section of the cantilever surface, in which we find a distribution of deposited nanoparticles with different sizes and patterns. Furthermore, some big particle agglomerations were found mostly on the edge of the cantilever. A larger concentration of aerosolized particles in overall could increase the particle-agglomeration potential. With a greater concentration of particles in the aerosol, the propensity for particle-to-particle attraction and agglomeration is increased when compared to lower concentrations [40].
To estimate the limit of detection (LOD) of the EtPCS sensor, we operated the sensor under constant temperature (T = 22.3 ± 0.4 °C) and relative humidity (rH = 23 ± 1%) as depicted in Figure 11b and measured σ = 0.05 ± 0.009 Hz (baseline frequency noise averaged over the tCT = 10 min). An LOD of 1.4 ± 0.3 µg/m3 was calculated using Equation (2) and CF = 96 µg × min/(m3 × Hz). By employing the MFLI instrument and our optimized PLL system, we have evidently suppressed the baseline frequency noise dramatically and improved the LOD, compared to previous work (~16 µg/m3) [27]. Nevertheless, working with a reduced high voltage for particle collection, i.e., from −500 V to −115 V, may have decreased the particle-collection efficiency corresponding to a much lower average frequency shift rate of 0.17 ± 0.02 Hz/min in the present study with respect to the previously measured 2.3 Hz/min at similar mass concentrations [27].

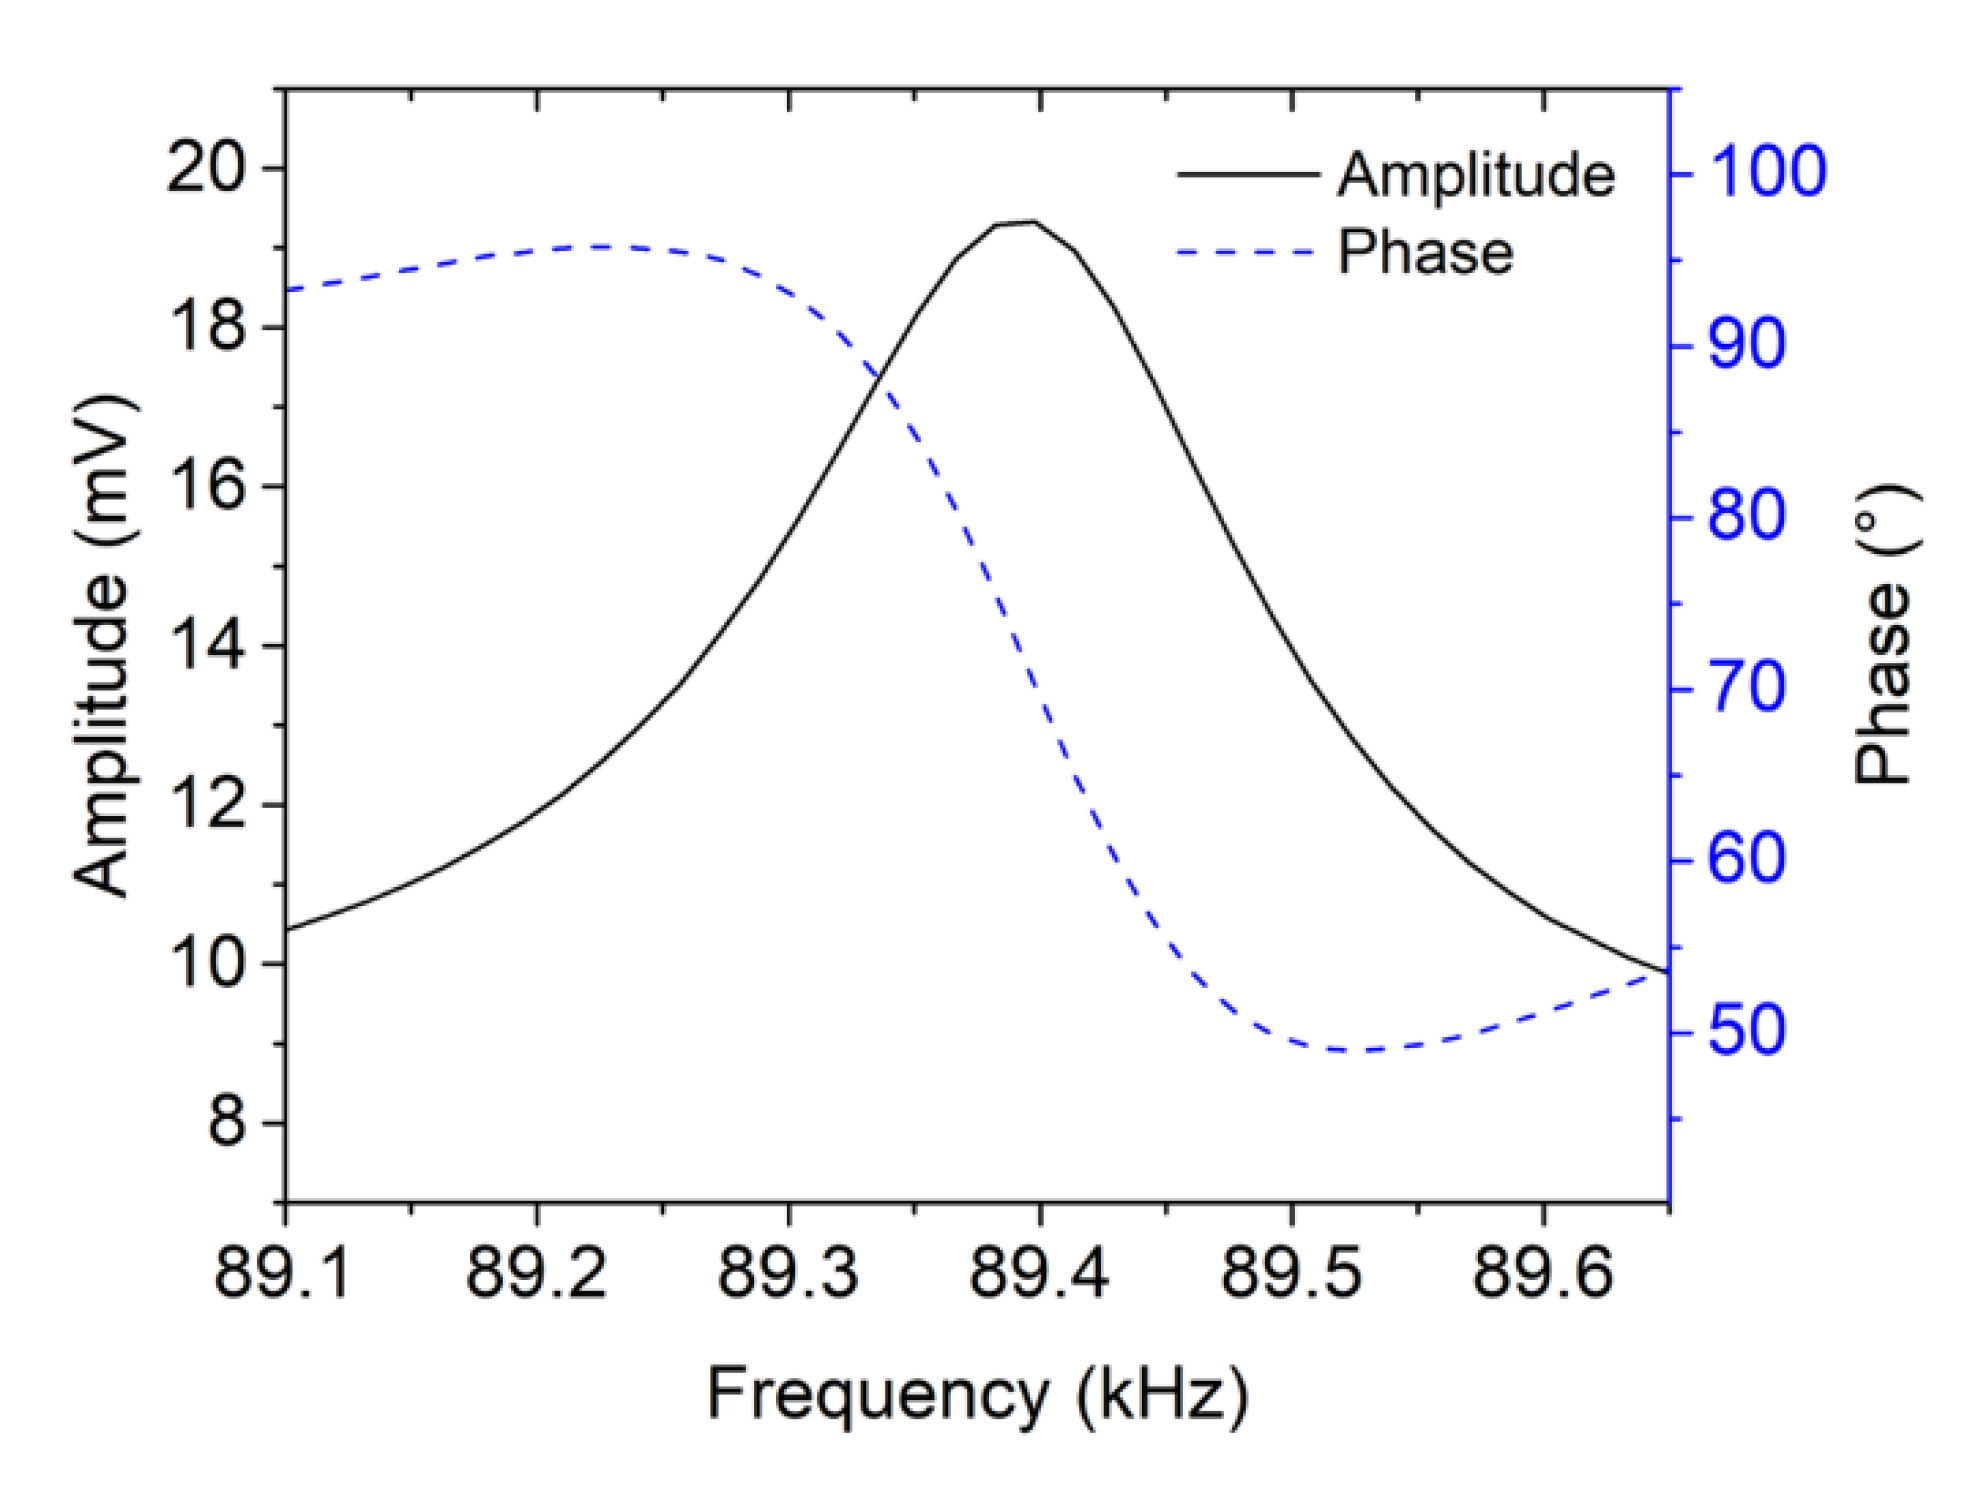
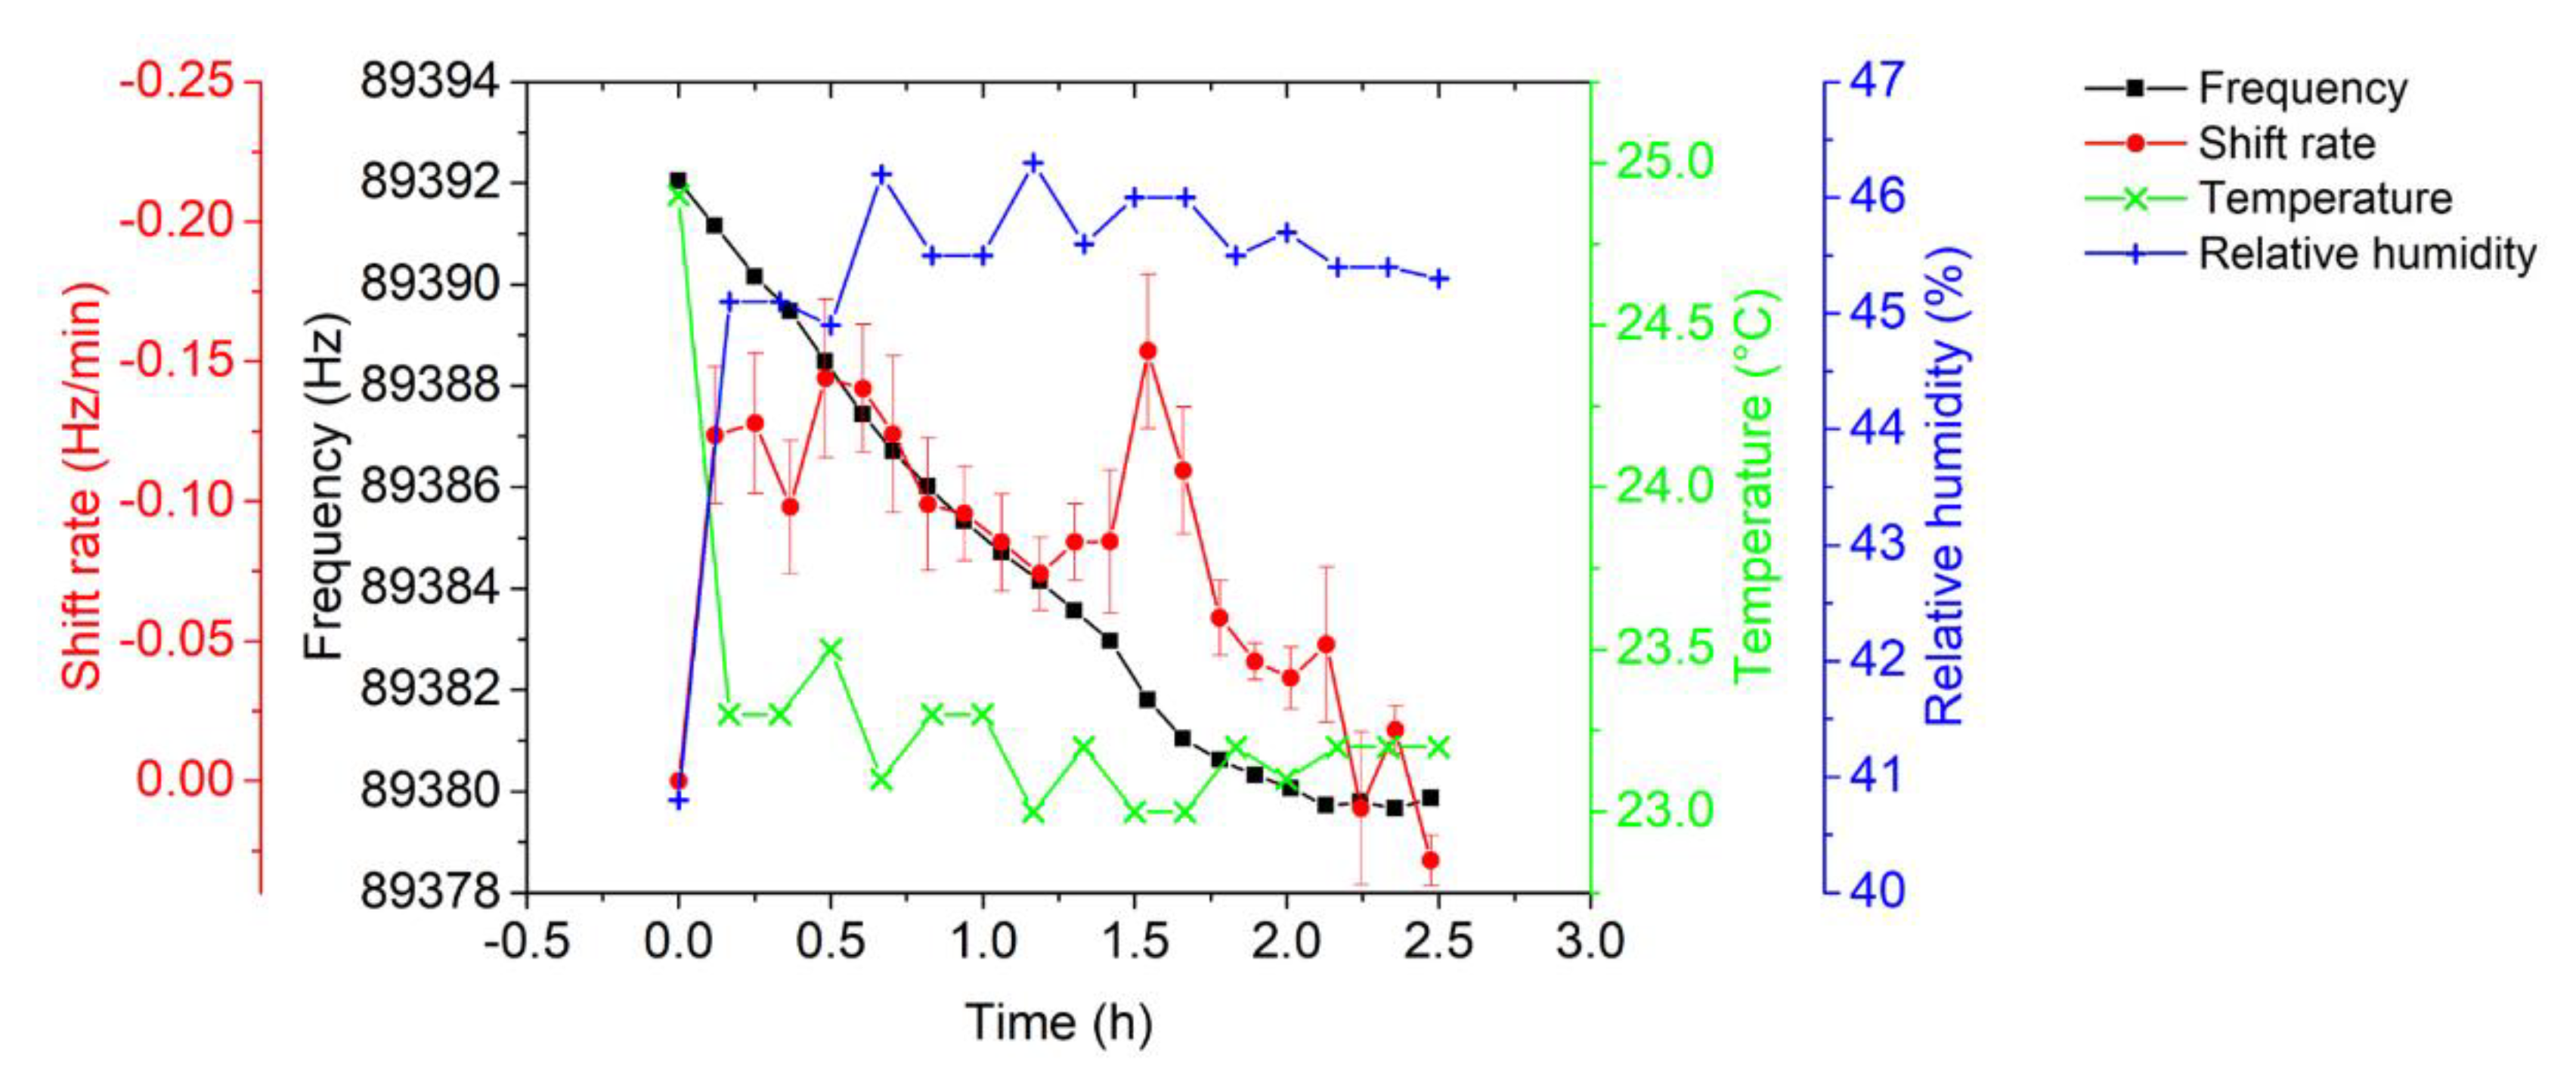
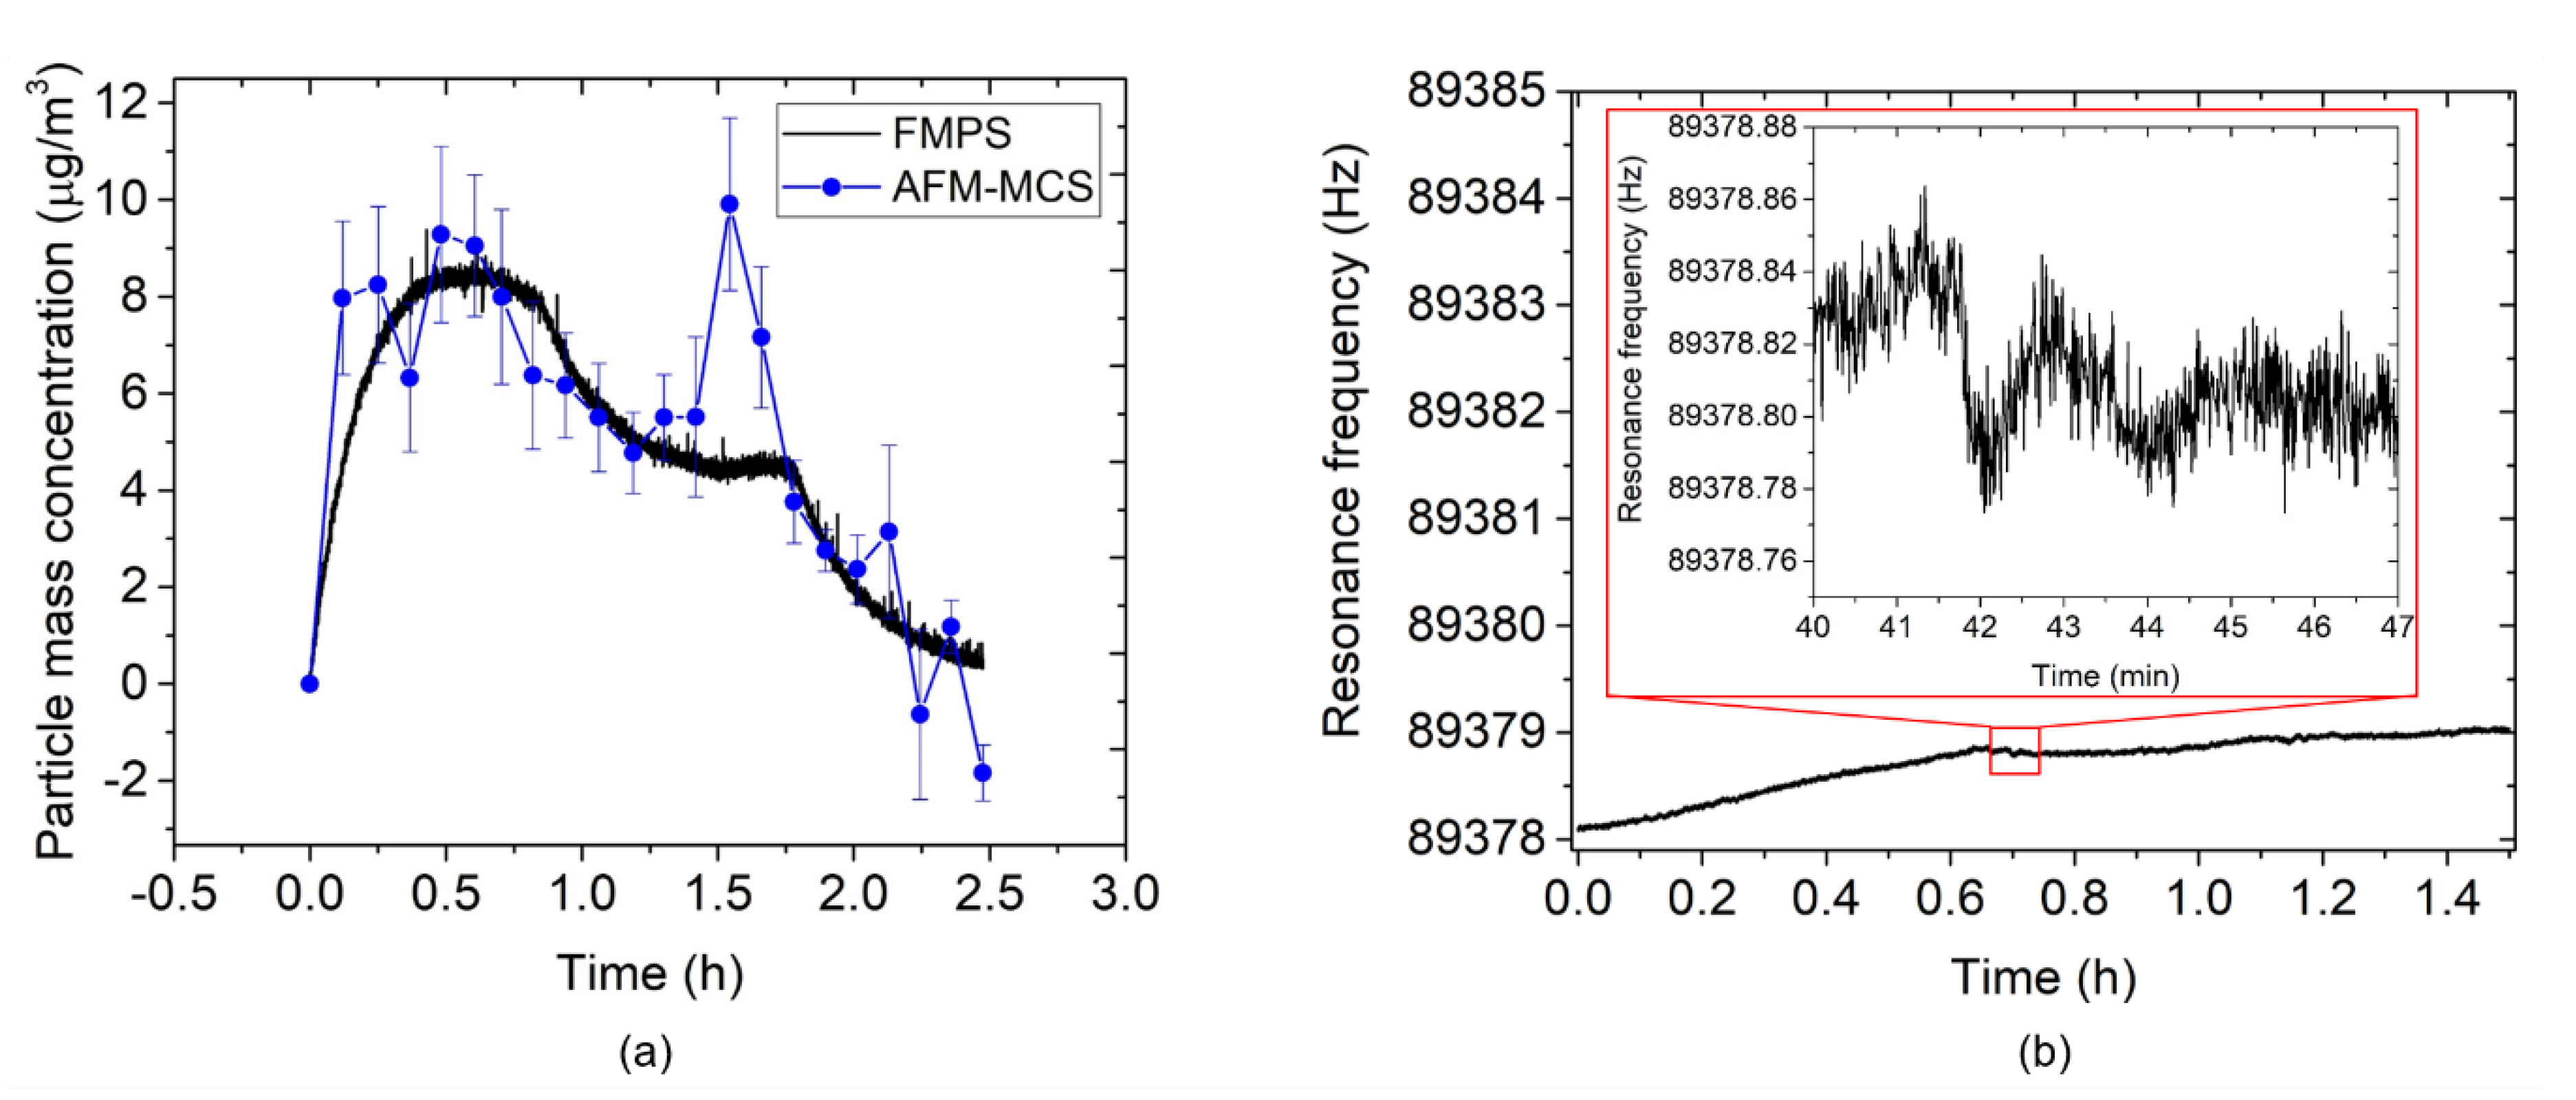
3.2. AFM-MCS Cantilever Performance

The AFM-MCS was operated without extra airflow around the cantilever during particle sampling. Here, the movement of carbon nanoparticles towards the cantilever can only be expected to be courtesy of the ventilation fan inside the chamber. An FMPS measurement of nanoparticle exposure (for ~2.5 h) is shown in Figure 13. The typical size distributions of particle number and mass concentrations (shown in Figure 13a) reveal average particle sizes of ~34 nm and ~191 nm, respectively, which are similar to the measurement run with the EtPCS (cf. Figure 9a). Total number (~27,000 #/cm3 at the peak) and corresponding mass concentrations (Equation (3), ~8.6 µg/m3 at the peak) are delineated in Figure 13b.
By interpolating the amplitude and phase responses, the resonance frequency was determined at a phase of 72°, which corresponds to the maximum amplitude (~19 mV). The approximated resonance-frequency decrement due to particle collecting measured by the AFM-MCS and the corresponding frequency-shift rate over tCT = 7.07 ± 0.39 min are plotted in Figure 14 with an average shift rate of 0.08 ± 0.04 Hz/min. Simultaneously, fluctuations of temperature and relative humidity are slightly on the same level as in the previous EtCPS measurements, i.e., ±0.2 °C and ±0.6%, respectively.
The calculated mass concentration values by the AFM-MCS in comparison with the FMPS is depicted in Figure 15a. In this case, Equation (1) is used with CF = 64.5 µg × min/(m3 × Hz). The average uncertainty amounts to 1.3 ± 0.5 µg/m3, and the deviation from the FMPS measurement was 28.7 ± 9.4%. Here, the fluctuation of particle-size distribution sampled on the cantilever due to the small size of the collection area is most likely the main factor to this measurement error (e.g., for the two outliers at ~1.5 h). In addition, the absence of forced airflow towards the AFM-MCS cantilever will have affected the total amount of sampled particles. The SEM images depicted in Figure 16 show that particles of different sizes and shapes were sparingly spread around the meander resistor. However, it is difficult to find particles on the resistor owing to the high roughness on the surface of its covering layer (aluminum oxide). Furthermore, compared to the EtPCS sensor, large agglomerates were not found on the AFM-MCS cantilever, possibly due to the lower carbon particle concentration selected in this experiment.
Furthermore, a baseline frequency noise of the AFM-MCS of σ = 0.027 ± 0.004 Hz was measured by track its resonance within a tCT ≈ 7 min (inset Figure 15b), which subsequently yields an LOD of 0.7 ± 0.1 µg/m3 using Equation (2) and CF = 64.5 µg × min/(m3 × Hz). If we compare the LOD of the EtPCS to that of the AFM-MCS, the latter has a considerably smaller frequency-noise floor that effectively results in a lower LOD value. Furthermore, although particle collection on AFM-MCS was performed without extra airflow, a very good average particle collection rate (0.08 ± 0.05 Hz/min) was achieved on a much smaller particle-collection area and at a lower particle concentration. It indicates that AFM-MCS has nearly the same resolution for piezoresistive cantilever sensor of even lower mass (~5 ng) [37]. Nevertheless, the cantilever size downscaling, as in the case of the AFM-MCS sensor, presents difficulties in handling and regeneration by cleaning from deposited particles. Moreover, it also leads to a smaller surface area for particle sampling, and hence, a much lower probability of sampling target particles on the sensor surface.
In Table 1, we show and compare various important, relevant parameters (i.e., particle sampling, air-flow rate, resonance frequency, sensitivity, particle sampling rate, collecting time, and LOD) in this work to other types of piezoresistive resonators, i.e., dual-plate thermal-piezoresistive resonator (DP-TPR) and thermal-piezoresistive oscillator (TPO). From this comparison, it is evident that EtPCS (f0 ~ 200 kHz) and AFM-MCS (f0 ~ 89 kHz) devices have lower sensitivities. Nevertheless, using such simple cantilever structures, we have demonstrated and achieved a fairly competitive resolution value (LOD) with only 7–10 min of particle collection time in the electrophoresis setup. Compared to the inertial impaction technique, the electrophoretic method could work in low particle velocity, and no large vacuum pump is required. However, to enhance the efficiency in the particle sampling rate of the EtPCS, the voltage difference between the copper ring and the EtPCS cantilever beam is necessary to be increased. While the smaller distance between the AFM-MCS cantilever beam and the metal electrode is a more crucial issue, its therefore necessary to improve the electrophoresis setup. In addition, the presence of consistent airflow (which acts as a particle deliverer) is also essential in nanoparticle mass detection.

4. Conclusions

Measurement of airborne-nanoparticle mass concentrations using two kinds of piezoresistive microcantilever sensors (electrothermal piezoresistive cantilever sensor (EtPCS) and tip-less atomic force microscopy micro-cantilever sensor (AFM-MCS)) has been presented. By operating in an in-plane mode, the EtPCS cantilever resonates with a higher Q factor (~2000) compared to the AFM-MCS cantilever (Q ~189), which operates in out-of-plane mode. Furthermore, in regard to the nanoparticle measurement, in principle, both sensors showed a good agreement with the FMPS reference measurement under defined concentrations of carbon nanoparticles. Particles were collected by electro-/dielectrophoresis on the cantilevers’ surfaces, as evidently observed by SEM inspection. Average deviations of 24.9 ± 0.3% and 28.7 ± 0.4% from the reference mass concentrations (fast mobility particle sizer—FMPS) were achieved for the EtPCS and the AFM-MCS, respectively. Moreover, average uncertainties of ~2.3% and ~1.3% were realized using the EtPCS and the AFM-MCS, respectively. The limits of detection (LOD) of ~1.4 µg/m3 were determined using the EtPCS and ~0.7 µg/m3 with the AFM-MCS cantilever. Measurement error with respect to FMPS of the AFM-MCS was considered to be mostly caused by fluctuations of the particles-size distribution in the air around the collection area, which has much smaller size than in case of the EtCPS. Furthermore, fluctuations of particle-size distribution may have caused the increased measurement error with the EtPCS when a forced flow of particle-laden air towards the cantilever was not active. Therefore, both airflow and particle-sampling high voltage (HV) are the most important factors for further improvement of miniaturized gravimetric nanoparticle sensors.

Author Contributions

Conceptualization and methodology—A.S.; cantilever sensors fabrication and characterization—A.S., W.O.N., J.X., H.S.W., A.D., E.J.F., and C.H.S.; measurement—A.S., I.K.; analysis and validation, A.S., M.B., W.O.N., and E.P.; electronic and programming support—A.S., M.F., resources—E.P.; data curation, A.S. and E.P.; writing—original draft preparation—A.S.; writing—review and editing—A.S., M.B., W.O.N., J.X., M.F., I.K., E.U., A.D., E.J.F., C.H.S., H.S.W., and E.P.; supervision—H.S.W. and E.P.; project administration—E.P.; funding acquisition—E.P. All authors have read and agreed to the published version of the manuscript.

Funding

This project has received funding from the EMPIR program co-financed by the Participating States and from the European Union’s Horizon 2020 research and innovation program under No. 17IND05 MicroProbes.

Acknowledgments

A.S. would like to thank the Ministry of Research, Technology and Higher Education of the Republic of Indonesia (RISTEKDIKTI) for the PhD scholarship of RISET-Pro under No. 343/RISET-Pro/FGS/VIII/2016, which is revised by No. 37/RISET-Pro/FGS/III/2019 (World Bank Loan No. 8245-ID) and Indonesian-German Center for Nano and Quantum Technologies (IG-Nano) for the support. W.O.N and J.X acknowledge doctoral scholarships from the German Federal Ministry for Economic Cooperation and Development (BMZ) within the Braunschweig International Graduate School of Metrology (B-IGSM) and the China Scholarship Council (CSC) under the Grant CSC No. 201506300019, respectively. M.B. and H.S.W. are grateful for support from the ‘Niedersächsisches. Vorab’, Germany, through the ‘Quantum- and Nanometrology (QUANOMET)’ initiative within the project of ‘NP 2-2′ and ‘LENA-OptoSense’, respectively. The technical support is given by Angelika Schmidt, Juliane Breitfelder, Aileen Michalski, Andreas Heidemann, and Karl-Heinz Lachmund is also gratefully acknowledged. We are also grateful to Danqing Shen, Nicolai Markiewicz, and Agus Budi Dharmawan for their assistance on nanoparticle measurement, SEM imaging, and 3D-printing, respectively, as well as many fruitful discussions.

Conflicts of Interest

The authors declare no conflict of interest.

References

  1. Qi, L.; Wang, S. Fossil fuel combustion and biomass burning sources of global black carbon from GEOS-Chem simulation and carbon isotope measurements. Atmos. Chem. Phys. 2019, 19, 11545–11557. [Google Scholar] [CrossRef] [Green Version]
  2. Niranjan, R.; Thakur, A.K. The Toxicological Mechanisms of Environmental Soot (Black Carbon) and Carbon Black: Focus on Oxidative Stress and Inflammatory Pathways. Front. Immunol. 2017, 8, 763. [Google Scholar] [CrossRef]
  3. Riediker, M.; Zink, D.; Kreyling, W.; Oberdörster, G.; Elder, A.; Graham, U.; Lynch, I.; Duschl, A.; Ichihara, G.; Ichihara, S.; et al. Particle toxicology and health—where are we? Part. Fibre Toxicol. 2019, 16, 19. [Google Scholar] [CrossRef]
  4. Stone, V.; Miller, M.R.; Clift, M.J.D.; Elder, A.; Mills, N.L.; Møller, P.; Schins, R.P.F.; Vogel, U.; Kreyling, W.G.; Alstrup Jensen, K.; et al. Nanomaterials Versus Ambient Ultrafine Particles: An Opportunity to Exchange Toxicology Knowledge. Environ. Health Perspect. 2017, 125, 106002. [Google Scholar] [CrossRef] [PubMed]
  5. Mazaheri, M.; Lin, W.; Clifford, S.; Yue, D.; Zhai, Y.; Xu, M.; Rizza, V.; Morawska, L. Characteristics of school children’s personal exposure to ultrafine particles in Heshan, Pearl River Delta, China—A pilot study. Environ. Int. 2019, 132, 105134. [Google Scholar] [CrossRef] [PubMed]
  6. Nowack, B.; Bucheli, T.D. Occurrence, behavior and effects of nanoparticles in the environment. Environ. Pollut. 2007, 150, 5–22. [Google Scholar] [CrossRef]
  7. Gao, X.; Zou, H.; Xu, X.; Zhou, L.; Tang, S.; Yuan, W.; Zhang, M. Developing a guideline for measuring the total number concentration of engineering nanomaterials in workplaces in China. J. Occup. Health 2019, 61, 197–202. [Google Scholar] [CrossRef] [PubMed] [Green Version]
  8. Joe, Y.-H.; Shim, J.; Shin, I.-K.; Yook, S.-J.; Park, H.-S. A Study on Electrical Charge Distribution of Aerosol Using Gerdien Ion Counter. Aerosol Air Qual. Res. 2018, 18, 2922–2928. [Google Scholar] [CrossRef]
  9. Marra, J.; Voetz, M.; Kiesling, H.-J. Monitor for detecting and assessing exposure to airborne nanoparticles. J. Nanopart. Res. 2010, 12, 21–37. [Google Scholar] [CrossRef]
  10. Stetefeld, J.; McKenna, S.A.; Patel, T.R. Dynamic light scattering: A practical guide and applications in biomedical sciences. Biophys. Rev. 2016, 8, 409–427. [Google Scholar] [CrossRef]
  11. Ross Hallett, F. Particle size analysis by dynamic light scattering. Food Res. Int. 1994, 27, 195–198. [Google Scholar] [CrossRef]
  12. Agranovski, I. Aerosols. Science and Technology; John Wiley & Sons: Hoboken, NJ, USA, 2011; ISBN 978-3-527-32660-0. [Google Scholar]
  13. Wang, Y.; Wang, Y.; Chen, D.; Liu, X.; Wu, C.; Xie, J. A Miniature System for Separation and Detection of PM Based on 3-D Printed Virtual Impactor and QCM Sensor. IEEE Sens. J. 2018, 18, 6130–6137. [Google Scholar] [CrossRef]
  14. Triyana, K.; Rianjanu, A.; Nugroho, D.B.; As’ari, A.H.; Kusumaatmaja, A.; Roto, R.; Suryana, R.; Wasisto, H.S. A highly sensitive safrole sensor based on polyvinyl acetate (PVAc) nanofiber-coated QCM. Sci. Rep. 2019, 9, 15407. [Google Scholar] [CrossRef] [PubMed] [Green Version]
  15. Xu, J.; Bertke, M.; Wasisto, H.S.; Peiner, E. Piezoresistive microcantilevers for humidity sensing. J. Micromech. Microeng. 2019, 29, 53003. [Google Scholar] [CrossRef]
  16. Wasisto, H.S.; Merzsch, S.; Waag, A.; Uhde, E.; Salthammer, T.; Peiner, E. Airborne engineered nanoparticle mass sensor based on a silicon resonant cantilever. Sens. Actuators B Chem. 2013, 180, 77–89. [Google Scholar] [CrossRef]
  17. Wasisto, H.S.; Merzsch, S.; Stranz, A.; Waag, A.; Uhde, E.; Salthammer, T.; Peiner, E. Silicon resonant nanopillar sensors for airborne titanium dioxide engineered nanoparticle mass detection. Sens. Actuators B Chem. 2013, 189, 146–156. [Google Scholar] [CrossRef]
  18. Schlur, L.; Hofer, M.; Ahmad, A.; Bonnot, K.; Holz, M.; Spitzer, D. Cu(OH)2 and CuO Nanorod Synthesis on Piezoresistive Cantilevers for the Selective Detection of Nitrogen Dioxide. Sensors 2018, 18, 1108. [Google Scholar] [CrossRef] [Green Version]
  19. Zhao, L.; Hu, Y.; Hebibul, R.; Ding, J.; Wang, T.; Xu, T.; Liu, X.; Zhao, Y.; Jiang, Z. A Novel Slope Method for Measurement of Fluid Density with a Micro-cantilever under Flexural and Torsional Vibrations. Sensors 2016, 16, 1471. [Google Scholar] [CrossRef]
  20. Fras, L.J.; Dziekonski, C.; Dera, W.; Jarząbek, D.M. Piezoelectric bimorph as a high-sensitivity viscosity resonant sensor to test the anisotropy of magnetorheological fluid. Rev. Sci. Instrum. 2018, 89, 105111. [Google Scholar] [CrossRef]
  21. Bertke, M.; Fahrbach, M.; Hamdana, G.; Xu, J.; Wasisto, H.S.; Peiner, E. Contact resonance spectroscopy for on-the-machine manufactory monitoring. Sens. Actuators A Phys. 2018, 279, 501–508. [Google Scholar] [CrossRef]
  22. Jarzabek, D.M.; Rymuza, Z.; Horiba, A.; Hirai, Y. Development of an experimental technique for testing rheological properties of ultrathin polymer films used in nanoimprint lithography. J. Vac. Sci. Technol. B Nanotechnol. Microelectron. 2011, 29, 61603. [Google Scholar] [CrossRef]
  23. Brand, O.; Dufour, I.; Heinrich, S.; Josse, F.; Fedder, G.K.; Hierold, C.; Korvink, J.G.; Tabata, O. Resonant MEMS. Fundamentals, Implementation, and Application; Wiley: Hoboken, NJ, USA, 2015; ISBN 9783527676361. [Google Scholar]
  24. Setiono, A.; Nyang’au, W.O.; Fahrbach, M.; Xu, J.; Bertke, M.; Wasisto, H.S.; Peiner, E. Improvement of frequency responses of an in-plane electro-thermal cantilever sensor for real-time measurement. J. Micromech. Microeng. 2019, 29, 124006. [Google Scholar] [CrossRef]
  25. Wasisto, H.S. Direct-Reading Personal Airborne Nanoparticle Detector Based on Micromechanical Silicon Cantilever Resonators; 1 Aufl.; Verl. Dr. Hut: München, Germany, 2014; ISBN 3843916802. [Google Scholar]
  26. Nyang’au, W.O.; Setiono, A.; Bertke, M.; Bosse, H.; Peiner, E. Cantilever-Droplet-Based Sensing of Magnetic Particle Concentrations in Liquids. Sensors 2019, 19, 4758. [Google Scholar] [CrossRef] [PubMed] [Green Version]
  27. Wasisto, H.S.; Merzsch, S.; Uhde, E.; Waag, A.; Peiner, E. Handheld personal airborne nanoparticle detector based on microelectromechanical silicon resonant cantilever. Microelectron. Eng. 2015, 145, 96–103. [Google Scholar] [CrossRef]
  28. Wasisto, H.S.; Merzsch, S.; Uhde, E.; Waag, A.; Peiner, E. Partially integrated cantilever-based airborne nanoparticle detector for continuous carbon aerosol mass concentration monitoring. J. Sens. Sens. Syst. 2015, 4, 111–123. [Google Scholar] [CrossRef] [Green Version]
  29. Wasisto, H.S.; Merzsch, S.; Waag, A.; Uhde, E.; Salthammer, T.; Peiner, E. Portable cantilever-based airborne nanoparticle detector. Sens. Actuators B: Chem. 2013, 187, 118–127. [Google Scholar] [CrossRef]
  30. Bertke, M.; Hamdana, G.; Wu, W.; Wasisto, H.S.; Uhde, E.; Peiner, E. Analysis of asymmetric resonance response of thermally excited silicon micro-cantilevers for mass-sensitive nanoparticle detection. J. Micromech. Microeng. 2017, 27, 64001. [Google Scholar] [CrossRef]
  31. Wasisto, H.S.; Merzsch, S.; Andrej, S.; Waag, A.; Uhde, E.; Salthammer, T.; Peiner, E. Femtogram aerosol nanoparticle mass sensing utilising vertical silicon nanowire resonators. Micro Nano Lett. 2013, 8, 554–558. [Google Scholar] [CrossRef]
  32. Merzsch, S.; Steib, F.; Wasisto, H.S.; Stranz, A.; Hinze, P.; Weimann, T.; Peiner, E.; Waag, A. Production of vertical nanowire resonators by cryogenic-ICP–DRIE. Microsyst. Technol. 2014, 20, 759–767. [Google Scholar] [CrossRef]
  33. Setiono, A.; Xu, J.; Fahrbach, M.; Bertke, M.; Nyang’au, W.O.; Wasisto, H.S.; Peiner, E. Real-Time Frequency Tracking of an Electro-Thermal Piezoresistive Cantilever Resonator with ZnO Nanorods for Chemical Sensing. Chemosensors 2019, 7, 2. [Google Scholar] [CrossRef] [Green Version]
  34. Setiono, A.; Fahrbach, M.; Xu, J.; Bertke, M.; Nyang’au, W.O.; Hamdana, G.; Wasisto, H.S.; Peiner, E. Phase optimization of thermally actuated piezoresistive resonant MEMS cantilever sensors. J. Sens. Sens. Syst. 2019, 8, 37–48. [Google Scholar] [CrossRef] [Green Version]
  35. SCL-Sensor. Tech. Fabrication GmbH. PRSA 300 × 100 µm TL Probes. Available online: https://www.sclsensortech.com/portfolio-item/prsa-l300-f506080-tl-pcbchp-probes-2/ (accessed on 21 January 2020).
  36. Badarlis, A.; Pfau, A.; Kalfas, A. Measurement and Evaluation of the Gas Density and Viscosity of Pure Gases and Mixtures Using a Micro-Cantilever Beam. Sensors 2015, 15, 24318–24342. [Google Scholar] [CrossRef] [PubMed] [Green Version]
  37. Bertke, M.; Xu, J.; Setiono, A.; Kirsch, I.; Uhde, E.; Peiner, E. Fabrication of a microcantilever-based aerosol detector with integrated electrostatic on-chip ultrafine particle separation and collection. J. Micromech. Microeng. 2020, 30, 14001. [Google Scholar] [CrossRef]
  38. Maierhofer, P.; Röhrer, G.; Bainschab, M.; Bergmann, A. On the Inherent Variability of Particulate Matter Concentrations on Small Scales and the Consequences for Miniaturized Particle Sensors. Aerosol Air Qual. Res. 2019. [Google Scholar] [CrossRef]
  39. Seo, Y.H.; Kim, B.H. A self-resonant micro flow velocity sensor based on a resonant frequency shift by flow-induced vibration. J. Micromech. Microeng. 2010, 20, 75024. [Google Scholar] [CrossRef]
  40. Graczyk, H.; Bryan, L.C.; Lewinski, N.; Suarez, G.; Coullerez, G.; Bowen, P.; Riediker, M. Physicochemical characterization of nebulized superparamagnetic iron oxide nanoparticles (SPIONs). J. Aerosol Med. Pulm. Drug Deliv. 2015, 28, 43–51. [Google Scholar] [CrossRef] [Green Version]
  41. Maldonado-Garcia, M.; Kumar, V.; Wilson, J.C.; Pourkamali, S. Chip-Scale Implementation and Cascade Assembly of Particulate Matter Collectors with Embedded Resonant Mass Balances. IEEE Sens. J. 2017, 17, 1617–1625. [Google Scholar] [CrossRef]
  42. Liu, T.-Y.; Sung, C.-A.; Weng, C.-H.; Chu, C.-C.; Zope, A.A.; Pillai, G.; Li, S.-S. Gated CMOS-MEMS Thermal-Piezoresistive Oscillator-Based PM2.5 Sensor with Enhanced Particle Collection Efficiency. In Proceedings of the 2018 IEEE Micro Electro Mechanical Systems (MEMS), Belfast, North Ireland, 21–25 January 2018; pp. 75–78. [Google Scholar]
Figure 1. Scanning electron microscopy (SEM) image of the electrothermal piezoresistive cantilever sensor (EtPCS) showing an actuating part and four piezoresistors configured in a full Wheatstone bridge at the clamped end. A p-doped area (740 × 170 µm2) was created on the free-end of the cantilever beam for the collection of carbon nanoparticles.
Sensors 20 00618 g001
Figure 2. (a) Electrothermal piezoresistive cantilever sensor (EtPCS) setup in its housing employing spring contacts for electrical connection. (b) Setup to measure the signal output of an EtPCS using an MFLI instrument interfaced with a home-made LabVIEW-based software for tracking its resonance frequency in real-time. For nanoparticle trapping by electrophoresis/dielectrophoresis, a high voltage is applied between a sampling area on the cantilever and its surrounding copper ring.
Sensors 20 00618 g002
Figure 3. A LabVIEW-based user interface to execute a frequency sweep around the observed resonance mode of the EtPCS. Reference parameters of 0.43 V amplitude and 63.9° phase with the Fano resonance (a) are calculated to yield an optimized frequency response (b), i.e., a symmetrical amplitude shape and a monotonic phase transition.
Sensors 20 00618 g003
Figure 4. A developed LabVIEW-based user interface to track and lock the resonance frequency of the EtPCS. The selected reference parameters are included for keeping the optimized phase-locking state during resonance tracking.
Sensors 20 00618 g004
Figure 5. SEM image of the atomic force microscopy micro-cantilever sensor (AFM-MCS) showing the meander-shape thermal bimorph actuator at the cantilever free end and four resistors configured in a half Wheatstone bridge, i.e., two active (i.e., longitudinally strained) resistors and two passive (i.e., unstrained) resistors placed at the clamped end of the cantilever and embedded in the bulk chip region, respectively.
Sensors 20 00618 g005
Figure 6. Setup to measure the AFM-MCS signal output using an MFLI instrument (Zurich Instruments AG, Switzerland) interfaced with its default software (LabOne) for observing the cantilever’s resonance frequency by frequency sweeping. A high voltage is applied to the cantilever for nanoparticle trapping by electro-/dielectrophoresis. A manual switch is used to cycle between connecting the cantilever with the actuating signal from a lock-in amplifier and with a high-voltage source for particle collection. During particle measurements, the protection-box cover was opened, as shown in the photograph.
Sensors 20 00618 g006
Figure 7. Frequency response of the AFM-MCS before particle exposure exhibiting a resonance frequency at ~89.38 kHz with phase and amplitude of ~72° and ~19 mV, respectively.
Sensors 20 00618 g007
Figure 8. Schematic of the nanoparticle-generation setup as a test chamber, involving a nebulizer, a diffusion dryer, a fan, and a fast mobility particle sizer (FMPS).
Sensors 20 00618 g008
Figure 9. (a) Typical particle number and mass concentrations over particle diameter and (b) total particle number/mass concentrations over time measured by FMPS.
Sensors 20 00618 g009
Figure 10. Resonance frequency of the EtPCS tracked by the LabVIEW-based PLL in real-time and the corresponding frequency-shift rate at 10-min sampling of carbon nanoparticles under stabilized ambient conditions (T = 23.2 ± 0.19 °C; rH = 43.5 ± 0.59%).
Sensors 20 00618 g010
Figure 11. (a) Carbon nanoparticle mass concentration measured by the EtPCS (full blue circles) in comparison with FMPS (full black line). (b) The frequency stability measurement under a temperature of 22.3 ± 0.4 °C and relative humidity of 23 ± 1%. The inset shows an exemplary detail enlargement of the frequency tracking within 10 min showing σ ≈ 27 mHz.
Sensors 20 00618 g011
Figure 12. Surface morphology of the sampling area of the EtPCS after carbon-nanoparticle exposure. The deposited carbon nanoparticles are uniformly distributed across the area, while particle agglomerates are trapped on the cantilever edge.
Sensors 20 00618 g012
Figure 13. (a) Typical carbon-nanoparticle number and mass concentrations depending on the particle size and (b) total particle number/mass concentrations measured by FMPS.
Sensors 20 00618 g013
Figure 14. Decrement in resonance frequency (taken at a phase of 72°) and the corresponding frequency shift rate at tCT ≈ 7 min and ambient conditions (T = 23.3 ± 0.23 °C; rH = 45.3 ± 0.63%).
Sensors 20 00618 g014
Figure 15. (a) Carbon-nanoparticle mass concentration measured by the AFM-MCS (full blue circle) in comparison with FMPS (full black line). (b) The frequency-stability measurement under a temperature of 23.01 ± 0.03 °C and relative humidity of 21.8 ± 0.4%. The inset shows an exemplary detailed enlargement of the frequency tracking within 7 min showing σ ≈ 17 mHz.
Sensors 20 00618 g015
Figure 16. Surface morphology of the sampling area of the AFM-MCS cantilever after carbon-particle exposure. Particles deposited on the rough surface of the meander resistor are hardly detectable, while few particles were trapped around it.
Sensors 20 00618 g016
Table 1. Comparison of different piezoresistive gravimetric sensor approaches.
ReferenceEtPCS Cantilever (This Work)AFM-MCS Cantilever (This Work)DP-TPR [41]TPO [42]
Particle samplingelectrophoresis (−115 V), continuouselectrophoresis (−115 V), intermittent with frequency sweepingchip-scale single inertial impactorinertial impactor, intermittent with frequency tracking
Air-flow rate680 mL/min0<0.1–0.25 mL/min
Resonance frequency201.54 kHz89.38 kHz5.26 MHz~950 kHz
Mass sensitivity0.013 Hz/pg0.14 Hz/pg42 Hz/pg1.946 Hz/pg
Particle collection efficiency0.12%− (no air-flow)100% *
Collecting time10 min7 min60 min5 min
LOD1.4 µg/m30.7 µg/m30.01–0.2 µg/m3 **50 µg/m3
* assumed for calculating particle mass concentration. ** calculated assuming 100% particle collection efficiency (not verified by reference measurements).

