Thin-Film Flexible Wireless Pressure Sensor for Continuous Pressure Monitoring in Medical Applications

 ,
,  ,
,  ,
,  ,
,
Abstract
1. Introduction
2. Materials and Methods
2.1. Sensor Design
Parasitic Components
2.2. Device Fabrication
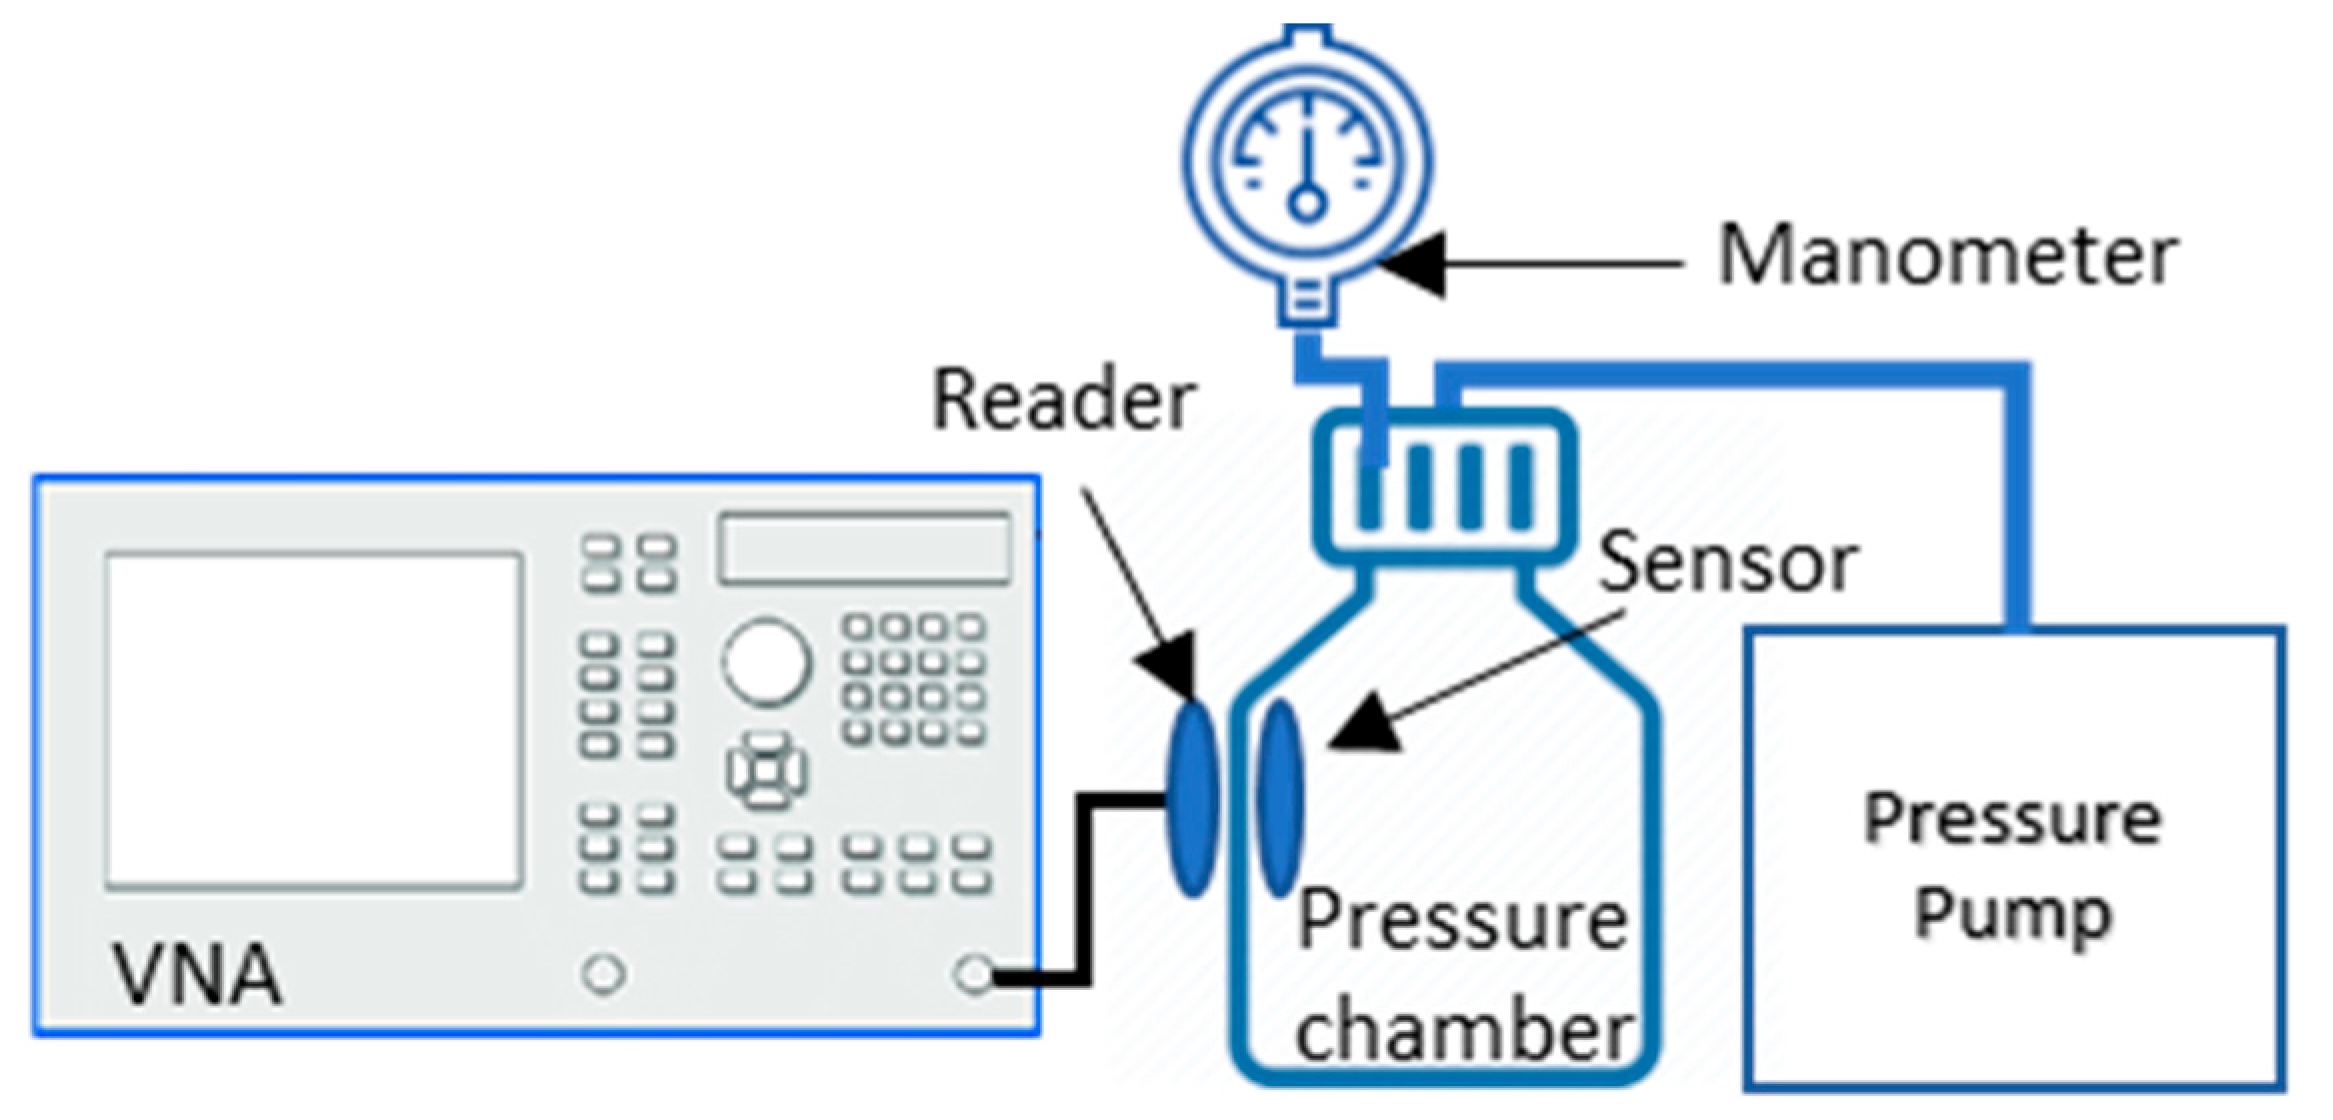
2.3. Device Validation
3. Results
3.1. Analytical Results: Numerical Estimation of Sensor Parameters
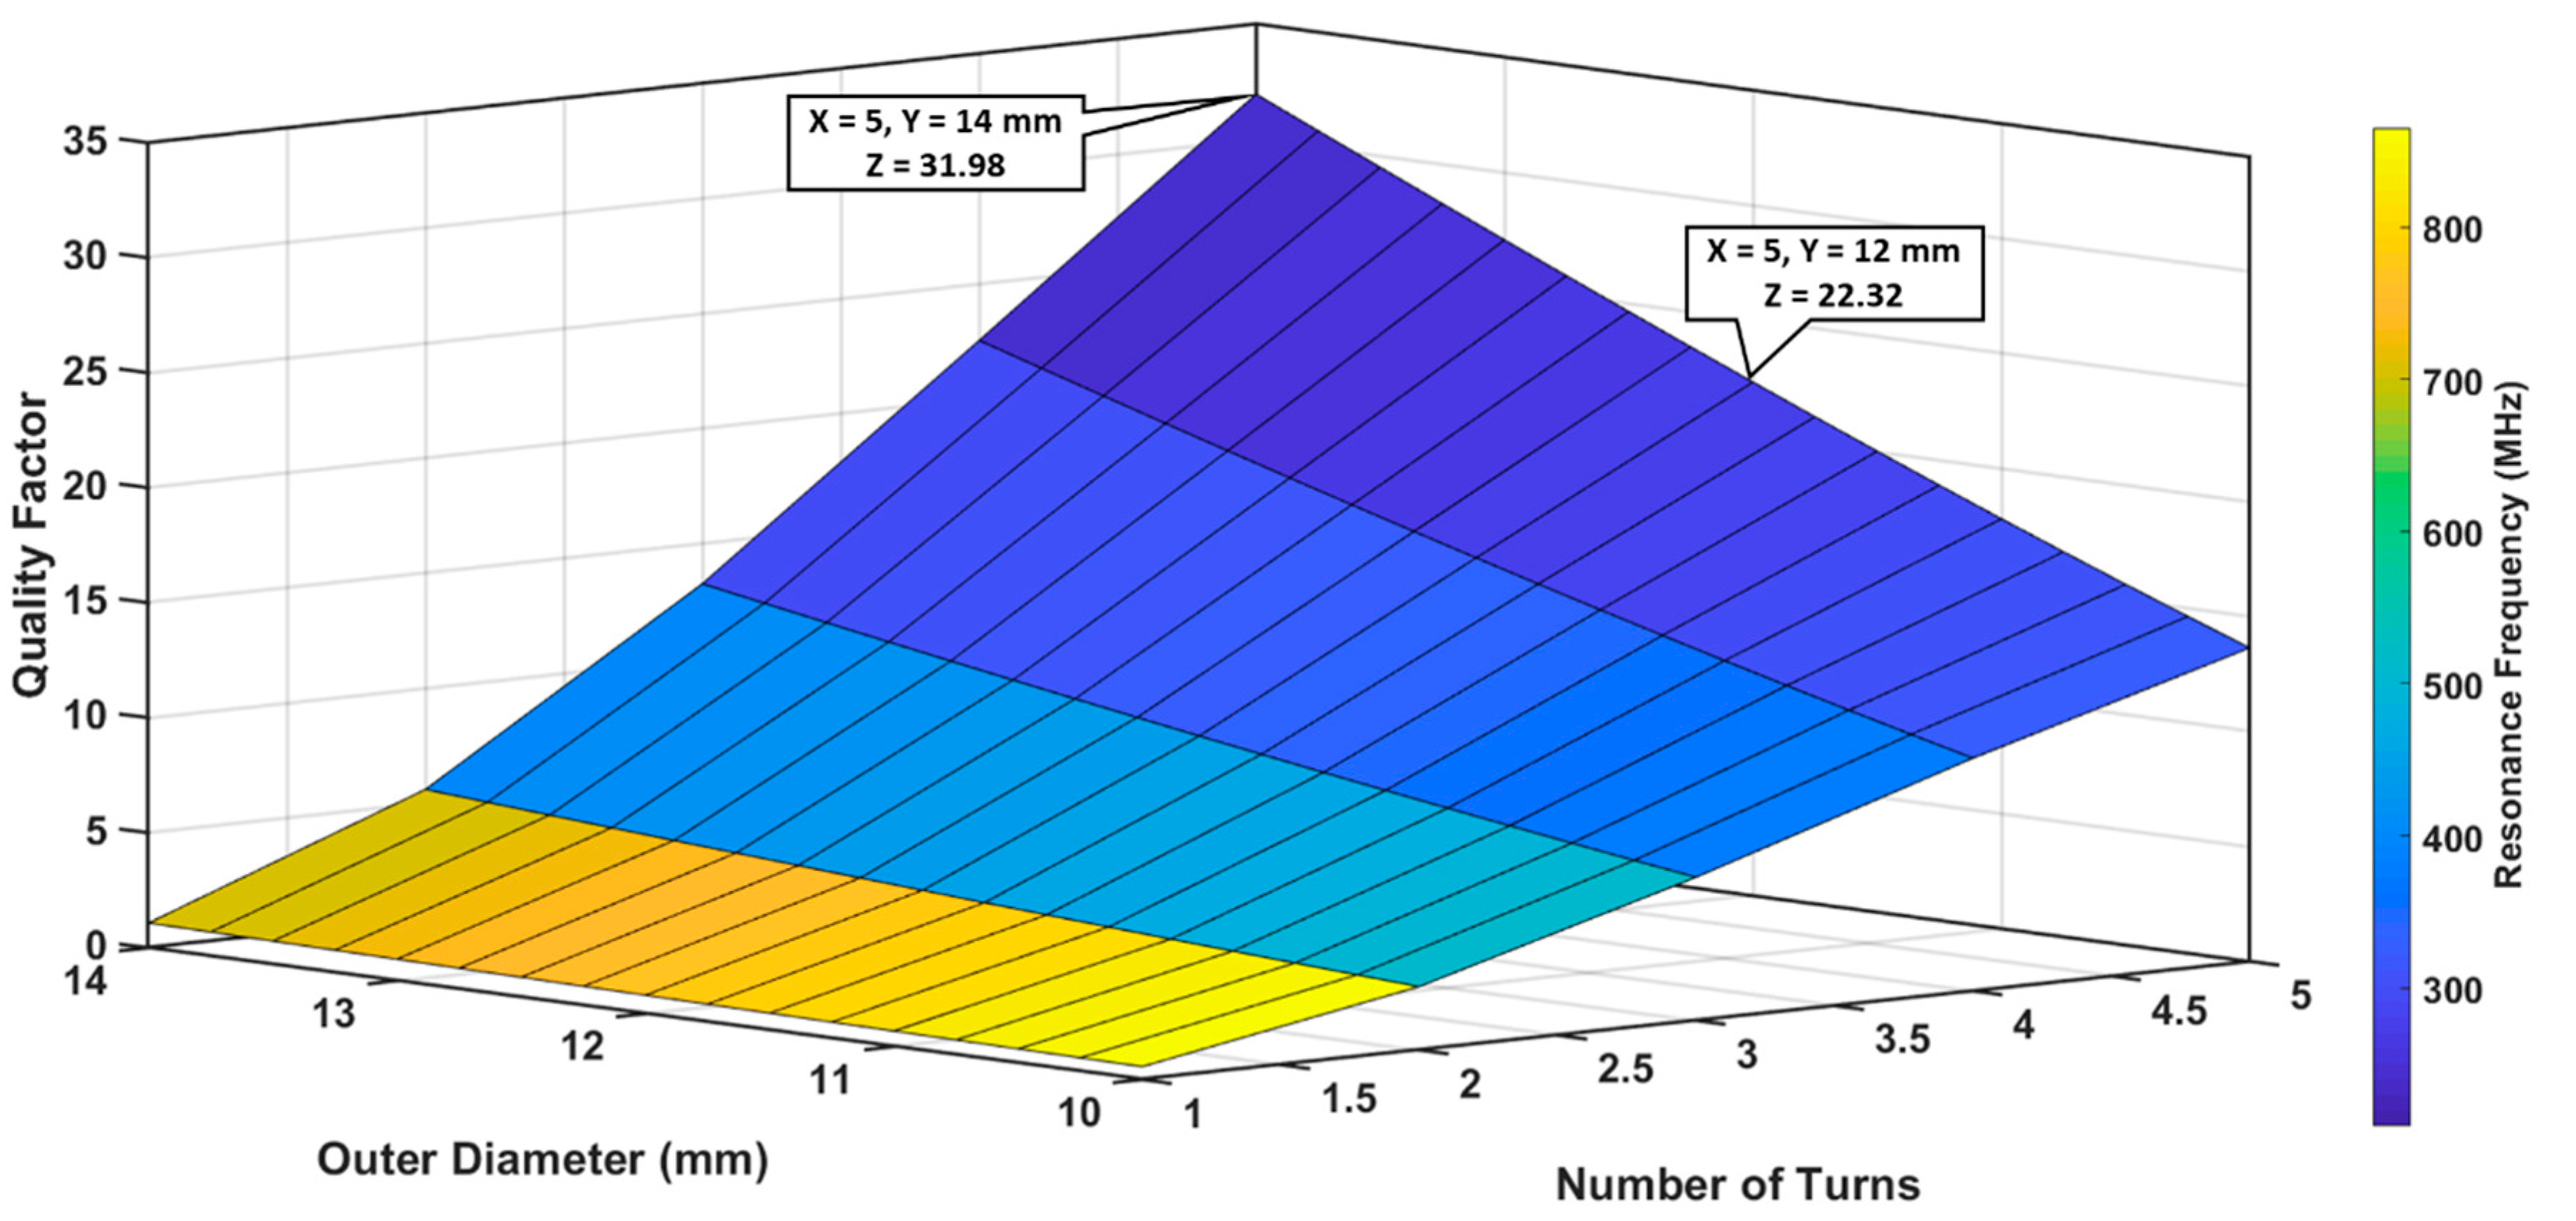
3.1.1. Optimization of Outer Diameter and Number of Turns
3.1.2. Optimization of Trace width and Trace separation
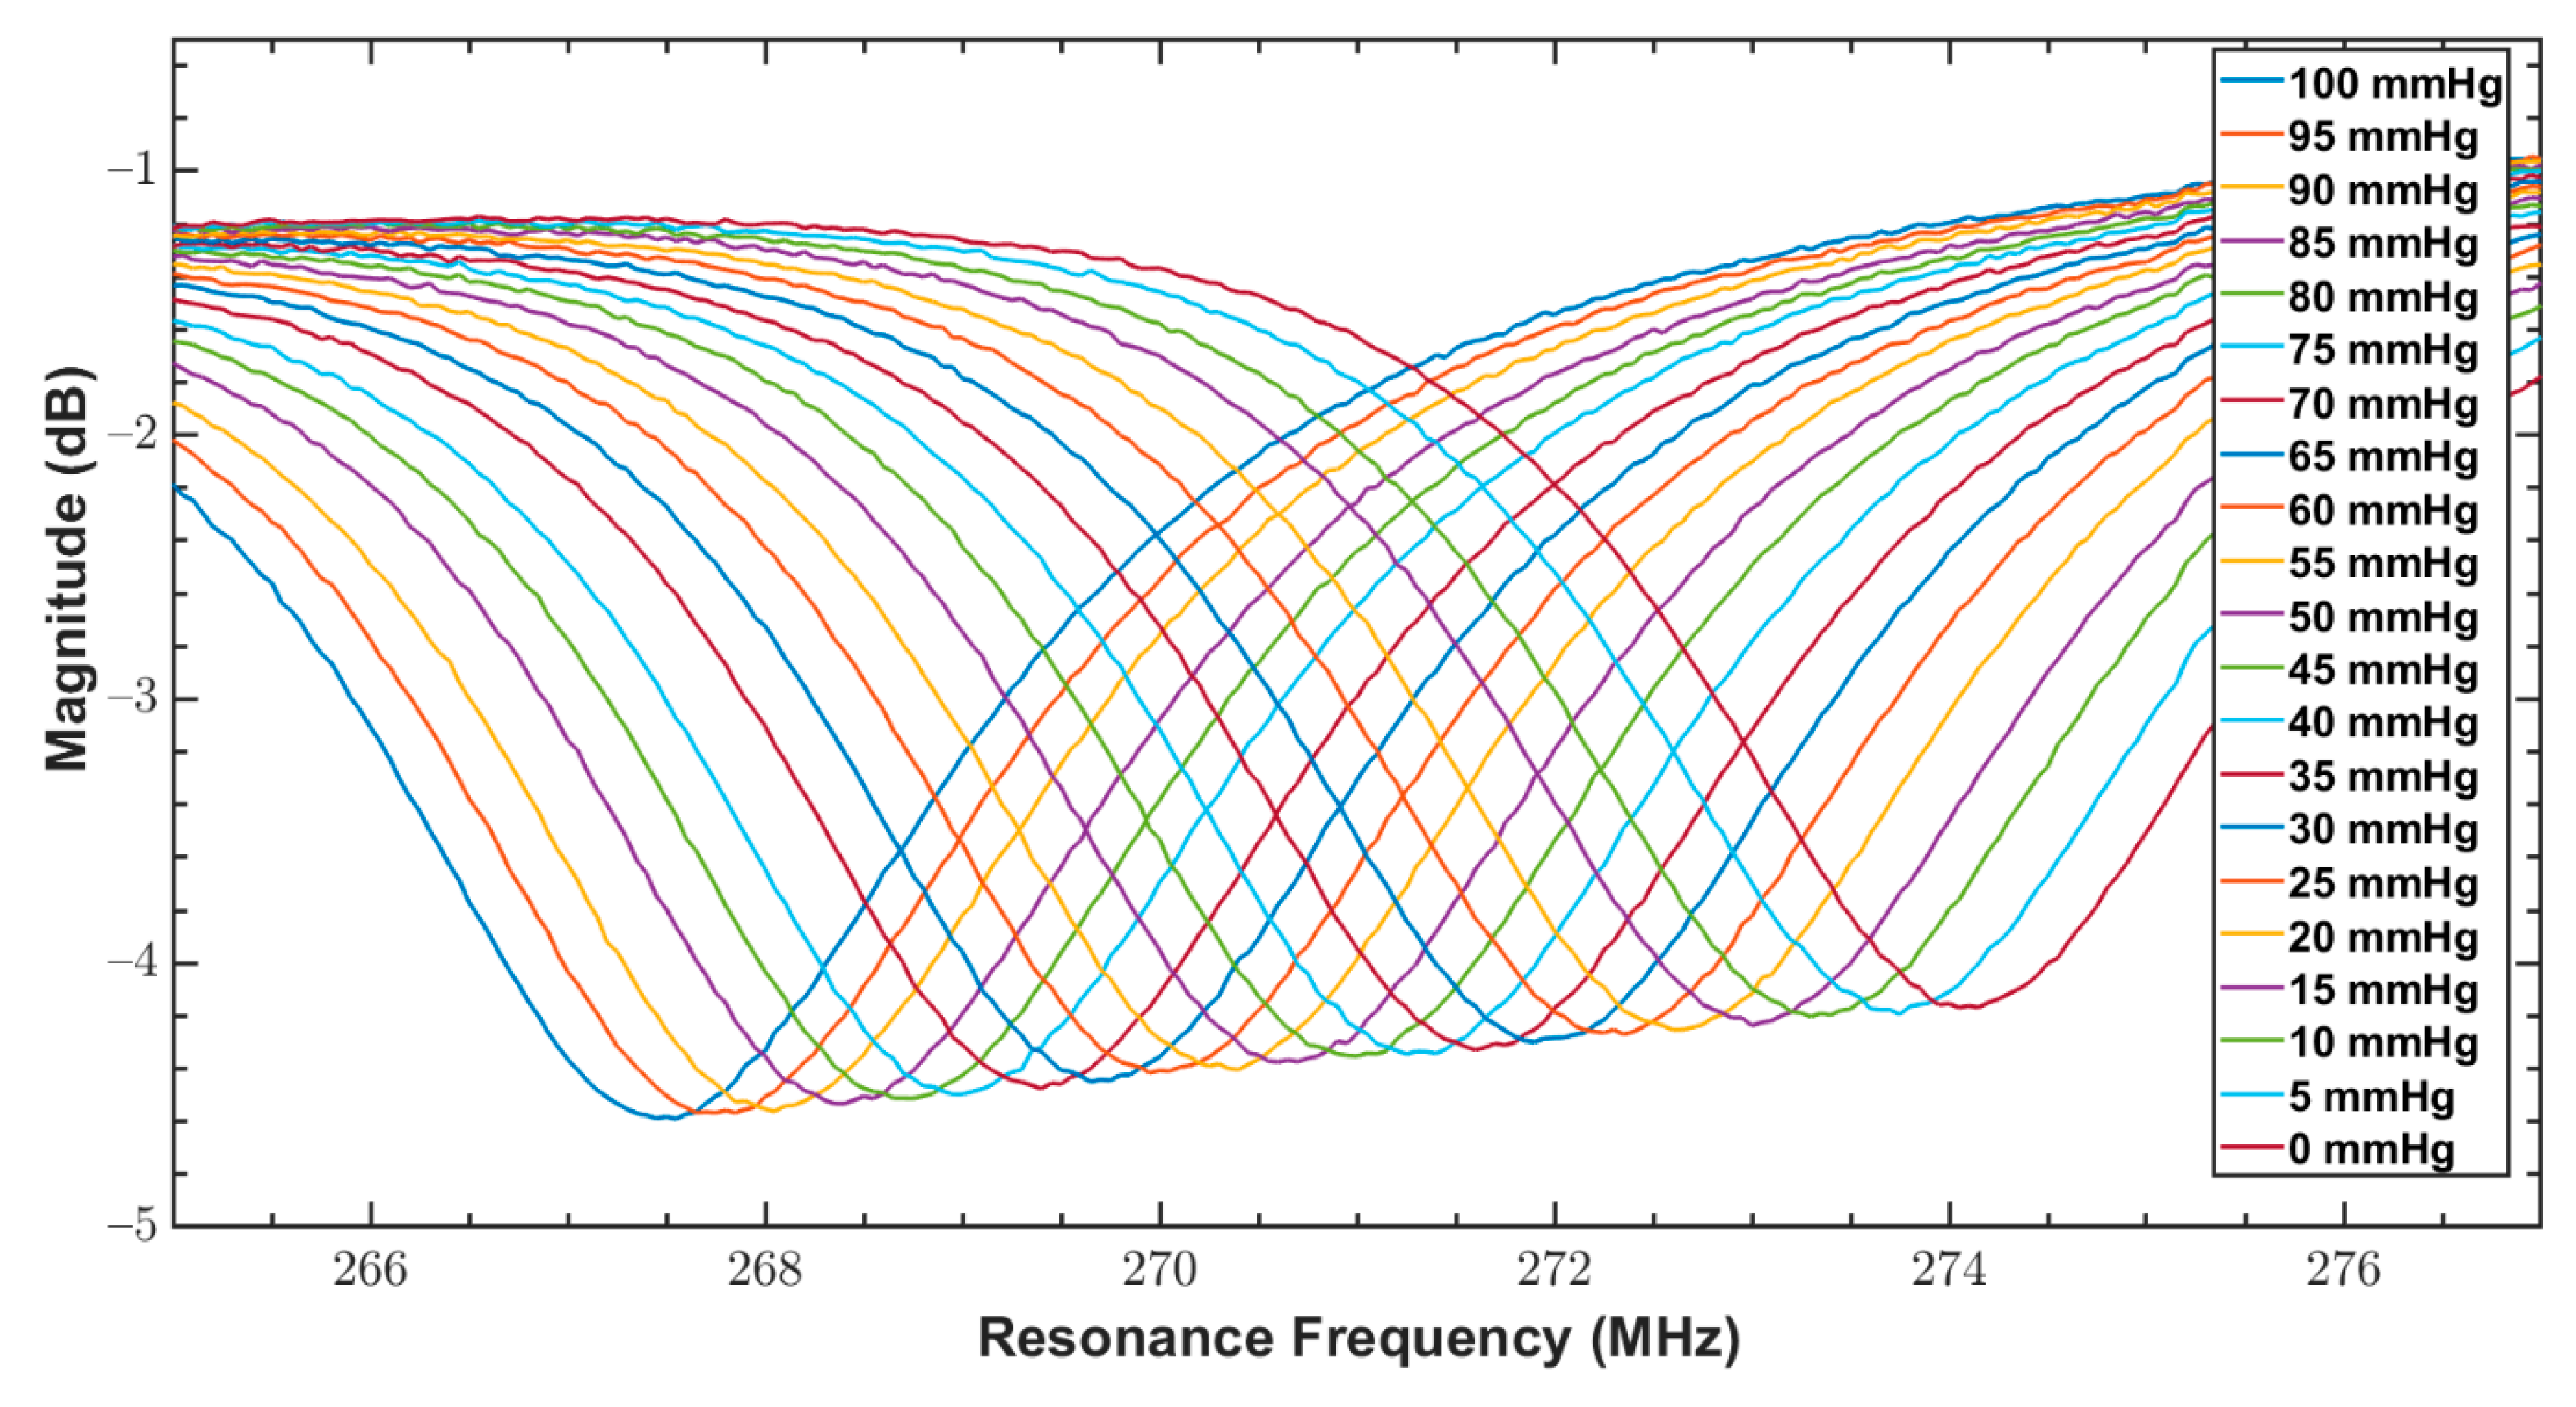
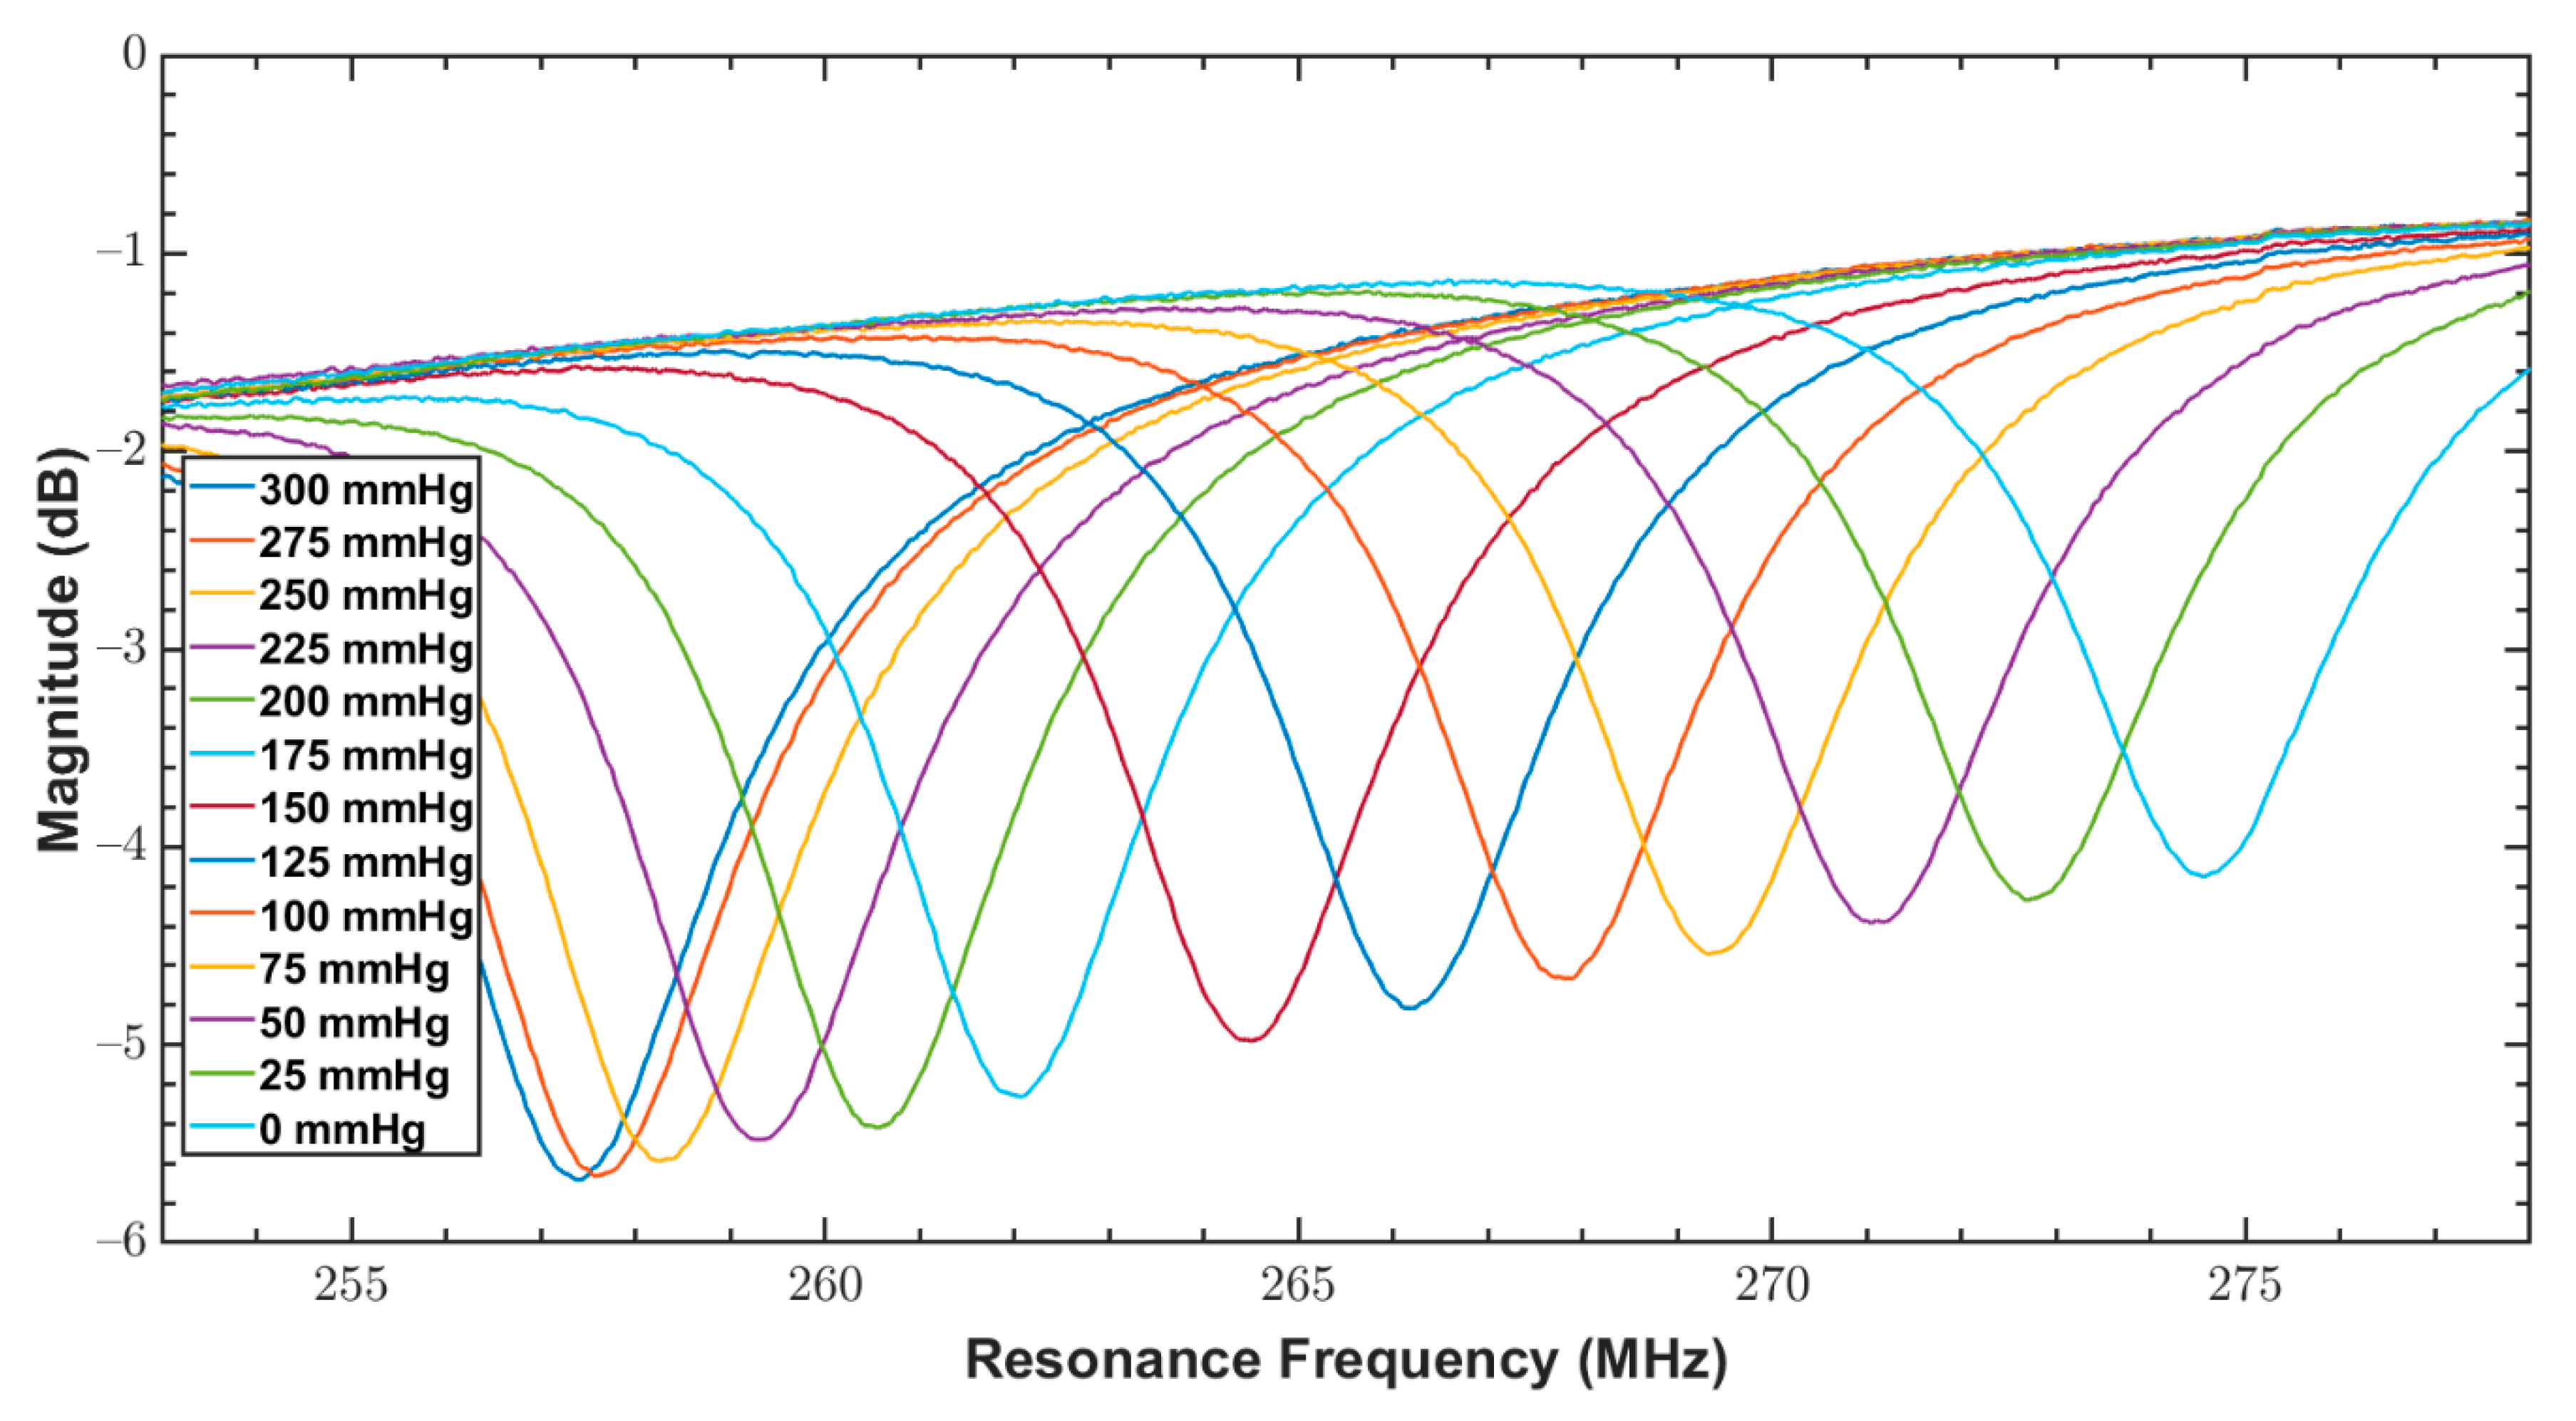
3.2. Experimental Prototype and Results
4. Discussion
5. Conclusions
Author Contributions
Funding
Conflicts of Interest
References
- Trung, T.Q.; Lee, N.E. Flexible and Stretchable Physical Sensor Integrated Platforms for Wearable Human-Activity Monitoringand Personal Healthcare. Adv. Mater. 2016, 28, 4338–4372. [Google Scholar] [CrossRef] [PubMed]
- Liu, Y.; Pharr, M.; Salvatore, G.A. Lab-on-Skin: A Review of Flexible and Stretchable Electronics for Wearable Health Monitoring. ACS Nano 2017, 11, 9614–9635. [Google Scholar] [CrossRef] [PubMed]
- Lei, K.F.; Lee, K.F.; Lee, M.Y. Development of a flexible PDMS capacitive tactile sensor with adjustable measurement range for plantar pressure measurement. Microsyst. Technol. 2014, 20, 1351–1358. [Google Scholar] [CrossRef]
- Burke, M.; Murphy, B.; Geraghty, D. Measurement of sub-bandage pressure during venous compression therapy using flexible force sensors. In Proceedings of the IEEE SENSORS Conference, Valencia, Spain, 2–5 November 2014; pp. 1623–1626. [Google Scholar] [CrossRef]
- Ghosh, S.; Mukhopadhyay, A.; Sikka, M.; Nagla, K.S. Pressure mapping and performance of the compression bandage/garment for venous leg ulcer treatment. J. Tissue Viability 2008, 17, 82–94. [Google Scholar] [CrossRef]
- Valencia, I.C.; Falabella, A.; Kirsner, R.S.; Eaglstein, W.H. Chronic venous insufficiency and venous leg ulceration. J. Am. Acad. Dermatol. 2001, 44, 401–424. [Google Scholar] [CrossRef]
- Partsch, H.; Clark, M.; Bassez, S.; Benigni, J.; Becker, F.; Blazek, V.; Caprini, J.; Cornu-Thénard, A.; Hafner, J.; Flour, M.; et al. Measurement of lower leg compression in vivo: Recommendations for the performance of measurements of interface pressure and stiffness. Dermatol. Surg. 2006, 32, 224–233. [Google Scholar] [CrossRef]
- Casey, V.; McAree, B.; Moloney, M.C.; Grace, P. Wearable sub-bandage pressure measurement system. In Proceedings of the 2010 IEEE Sensors Applications Symposium (SAS), Cancun, Mexico, 9–11 November 2016; pp. 41–45. [Google Scholar] [CrossRef]
- Flaud, P.; Bassez, S.; Counord, J.L. Comparative in vitro study of three interface pressure sensors used to evaluate medical compression hosiery. Dermatol. Surg. 2010, 36, 1930–1940. [Google Scholar] [CrossRef]
- Hegarty, M.S.; Grant, E.; Reid, L. An overview of technologies related to care for venous leg ulcers. IEEE Trans. Inf. Technol. Biomed. 2010, 14, 387–393. [Google Scholar] [CrossRef]
- Rahimi, M.; Blaber, A.P.; Menon, C. Towards the evaluation of force-sensing resistors for in situ measurement of interface pressure during leg compression therapy. In Proceedings of the 2016 IEEE Healthcare Innovation Point-Of-Care Technologies Conference (HI-POCT), Cancun, Mexico, 9–11 November 2016; pp. 25–28. [Google Scholar] [CrossRef]
- Kaisti, M.; Panula, T.; Leppänen, J.; Punkkinen, R.; Tadi, M.J.; Vasankari, T.; Jaakkola, S.; Kiviniemi, T.; Airaksinen, J.; Kostiainen, P.; et al. Clinical assessment of a non-invasive wearable MEMS pressure sensor array for monitoring of arterial pulse waveform, heart rate and detection of atrial fibrillation. NPJ Digit. Med. 2019, 2, 1–10. [Google Scholar] [CrossRef]
- Brown, M.S.; Ashley, B.; Koh, A. Wearable technology for chronic wound monitoring: Current dressings, advancements, and future prospects. Front. Bioeng. Biotechnol. 2018, 6, 1–21. [Google Scholar] [CrossRef]
- Zang, Y.; Zhang, F.; Di, C.A.; Zhu, D. Advances of flexible pressure sensors toward artificial intelligence and health care applications. Mater. Horiz. 2015, 2, 140–156. [Google Scholar] [CrossRef]
- Fraulini, K.E. Interface pressure. Decubitis 2014, 3, 1–12. [Google Scholar] [CrossRef]
- Barbenel, J.C.; Sockalingham, S. Device for measuring soft tissue interface pressures. J. Biomed. Eng. 1990, 12, 519–522. [Google Scholar] [CrossRef]
- Van Pijkeren, T.; Naeff, M.; Kwee, H.H. A new method for the measurement of normal pressure between amputation residual limb and socket. Bull. Prosthet. Res. 1980, 10, 31–34. [Google Scholar]
- Bu, N.; Ueno, N.; Fukuda, O. Monitoring of respiration and heartbeat during sleep using a flexible piezoelectric film sensor and empirical mode decomposition. In Proceedings of the 2007 29th Annual International Conference of the IEEE Engineering in Medicine and Biology Society, Lyon, France, 22–26 August 2007; pp. 1362–1366. [Google Scholar] [CrossRef]
- Han, M.; Wang, H.; Yang, Y.; Bai, W.; Yan, Z.; Li, H.; Xue, Y.; Wang, X.; Akar, B.; Zhao, H.; et al. Three-dimensional piezoelectric polymer microsystems for vibrational energy harvesting, robotic interfaces and biomedical implants. Nat. Electron. 2019, 2, 26–35. [Google Scholar] [CrossRef]
- Sharma, T.; Je, S.S.; Gill, B.; Zhang, J.X.J. Patterning piezoelectric thin film PVDF-TrFE based pressure sensor for catheter application. Sens. Actuators A Phys. 2012, 177, 87–92. [Google Scholar] [CrossRef]
- Gautschi, G. Piezoelectric Sensorics; Springer: Berlin/Heidelberg, Gemany, 2002; Volume 3. [Google Scholar]
- Chen, X.; Shao, J.; An, N.; Li, X.; Tian, H.; Xua, C.; Ding, Y. Self-powered flexible pressure sensors with vertically well-aligned piezoelectric nanowire arrays for monitoring vital signs. J. Mater. Chem. C 2015, 3, 11806–11814. [Google Scholar] [CrossRef]
- Gong, S.; Schwalb, W.H.; Wang, Y.; Chen, Y.; Tang, Y.; Si, K.J.; Shirinzadeh, B.; Cheng, W. A wearable and highly sensitive pressure sensor with ultrathin gold nanowires. Nat. Commun. 2014, 5, 1–8. [Google Scholar] [CrossRef]
- Ng, K.C.-K.; Leung, Y.-F.; Lee, Y.-L. An ultra-sensitive resistive pressure sensor based on hollow-sphere microstructure induced elasticity in conducting polymer fil. Hand Surg. 2014, 19, 423–425. [Google Scholar] [CrossRef]
- Kenry, J.; Yeo, C.; Lim, C.T. Emerging flexible and wearable physical sensing platforms for healthcare and biomedical applications. Microsyst. Nanoeng. 2016, 2. [Google Scholar] [CrossRef]
- Chitnis, G.; Maleki, T.; Samuels, B.; Cantor, L.B.; Ziaie, B. A minimally invasive implantable wireless pressure sensor for continuous IOP monitoring. IEEE Trans. Biomed. Eng. 2013, 60, 250–256. [Google Scholar] [CrossRef] [PubMed]
- Boutry, C.M.; Beker, L.; Kaizawa, Y.; Vassos, C.; Tran, H.; Hinckley, A.C.; Pfattner, R.; Niu, S.; Li, J.; Claverie, J.; et al. Biodegradable and flexible arterial-pulse sensor for the wireless monitoring of blood flow. Nat. Biomed. Eng. 2019, 3, 47–57. [Google Scholar] [CrossRef] [PubMed]
- Takahata, K.; Dehennis, A.; Wise, K.D.; Gianchandani, Y.B. A Wireless Microsensor For Monitoring Flow and Pressure in a Blood Vessel Utilizing a Dual-Inductor Antenna Stent and Two Pressure Sensors. In Proceedings of the 17th IEEE International Conference on Micro Electro Mechanical Systems, Maastricht, The Netherlands, 25–29 January 2004; pp. 5–8. [Google Scholar]
- Park, J.; Kim, J.K.; Patil, S.J.; Park, J.K.; Park, S.A.; Lee, D.W. A wireless pressure sensor integrated with a biodegradable polymer stent for biomedical applications. Sensors 2016, 16, 809. [Google Scholar] [CrossRef] [PubMed]
- Chhetry, A.; Yoon, H.; Park, J.Y. A flexible and highly sensitive capacitive pressure sensor based on conductive fibers with a microporous dielectric for wearable electronics. J. Mater. Chem. C 2017, 5, 10068–10076. [Google Scholar] [CrossRef]
- Al Khaburi, J.A.J. Pressure Mapping of Medical Compression Bandages Used for Venous Leg Ulcer Treatment. 2010. Available online: http://etheses.whiterose.ac.uk/3386/1/Thesis_Corrected.pdf (accessed on 10 September 2020).
- Partsch, H. The Static Stiffness Index: A Simple Method to Assess the Elastic Property of Compression Material In Vivo. Dermatol. Surg. 2006, 31, 625–630. [Google Scholar] [CrossRef]
- Van den Kerckhove, E.; Fieuws, S.; Massagé, P.; Hierner, R.; Boeckx, W.; Deleuze, J.-P.; Laperre, J.; Anthonissen, M. Reproducibility of repeated measurements with the Kikuhime pressure sensor under pressure garments in burn scar treatment. Burns 2007, 33, 572–578. [Google Scholar] [CrossRef]
- Finnie, A. Interface pressure measurements in leg ulcer management. Br. J. Nurs. 2000, 9 (Suppl. 1), S8–S18. [Google Scholar] [CrossRef]
- Parmar, S.; Khodasevych, I.; Troynikov, O. Evaluation of flexible force sensors for pressure monitoring in treatment of chronic venous disorders. Sensors 2017, 17, 1923. [Google Scholar] [CrossRef]
- Khodasevych, I.; Parmar, S.; Troynikov, O. Flexible sensors for pressure therapy: Effect of substrate curvature and stiffness on sensor performance. Sensors 2017, 17, 2399. [Google Scholar] [CrossRef]
- Rai, T.B.; Goddard, M.; Makin, G.S. How long do compression bandages maintain their pressure during ambulatory treatment of varicose veins. Br. J. Surg. 1980, 67, 122–124. [Google Scholar]
- Hafner, J.; Lüthi, W.; Hänssle, H.; Kammerlander, G.; Burg, G. Instruction of compression therapy by means of interface pressure measurement. Dermatol. Surg. 2000, 26, 481–488. [Google Scholar] [CrossRef] [PubMed]
- Mehmood, N.; Hariz, A.; Templeton, S.; Voelcker, N.H. An improved flexible telemetry system to autonomously monitor sub-bandage pressure and wound moisture. Sensors 2014, 14, 21770–21790. [Google Scholar] [CrossRef] [PubMed]
- Farooqui, M.F.; Shamim, A. Low cost inkjet printed smart bandage for wireless monitoring of chronic wounds. Sci. Rep. 2016, 6, 28949. [Google Scholar] [CrossRef] [PubMed]
- Rahimi, R.; Ochoa, M.; Zieger, M.; Sood, R.; Ziaie, B. A wireless strain sensor for wound monitoring with direct laser-defined patterning on a commercial dressing. In Proceedings of the 2016 IEEE 29th International Conference on Micro Electro Mechanical Systems (MEMS), Shanghai, China, 24–28 January 2016; pp. 481–484. [Google Scholar] [CrossRef]
- Deng, W.J.; Wang, L.F.; Dong, L.; Huang, Q.A. LC Wireless Sensitive Pressure Sensors with Microstructured PDMS Dielectric Layers for Wound Monitoring. IEEE Sens. J. 2018, 18, 4886–4892. [Google Scholar] [CrossRef]
- Fonseca, M.A.; Allen, M.G.; Kroh, J.; White, J. Flexible Wireless Passive Pressure Sensors for Biomedical Applicatons. In Proceedings of the Solid-State Sensors, Actuators, and Microsystems Workshop, Hilton Head Island, SC, USA, 4–8 June 2006; pp. 37–42. [Google Scholar]
- Li, C.; Wu, P.M.; Shutter, L.A.; Narayan, R.K. Dual-mode operation of flexible piezoelectric polymer diaphragm for intracranial pressure measurement. Appl. Phys. Lett. 2010, 96, 2008–2011. [Google Scholar] [CrossRef]
- Chen, P.-J.; Saati, S.; Varma, R.; Humayun, M.S.; Tai, Y.-C. Wireless Intraocular Pressure Sensing Using Microfabricated Minimally Invasive Flexible-Coiled LC Sensor Implant. J. Microelectromech. Syst. 2010, 19, 721–734. [Google Scholar] [CrossRef]
- Mohan, S.S.; Hershenson, M.D.M.; Boyd, S.P.; Lee, T.H. Simple accurate expressions for planar spiral inductances. IEEE J. Solid-State Circuits 1999, 34, 1419–1420. [Google Scholar] [CrossRef]
- Schormans, M.; Valente, V.; Demosthenous, A. Practical Inductive Link Design for Biomedical Wireless Power Transfer: A Tutorial. IEEE Trans. Biomed. Circuits Syst. 2018, 1–19. [Google Scholar] [CrossRef]
- Kuhn, W.B.; Ibrahim, N.M. Analysis of current crowding effects in multiturn spiral inductors. IEEE Trans. Microw. Theory Tech. 2001, 49, 31–38. [Google Scholar] [CrossRef]
- Ammouri, A.; Salah, T.B.; Morel, H. A spiral planar inductor: An experimentally verified physically based model for frequency and time domains. Int. J. Numer. Model. Electron. Netw. Devices Fields 2018, 31, 1–13. [Google Scholar] [CrossRef]
- Islam, A.B.; Islam, S.K.; Tulip, F.S. Design and Optimization of Printed Circuit Board Inductors for Wireless Power Transfer System. Circuits Syst. 2013, 4, 237–244. [Google Scholar] [CrossRef]
- Huang, Q.A.; Dong, L.; Wang, L.F. LC Passive Wireless Sensors Toward a Wireless Sensing Platform: Status, Prospects, and Challenges. J. Microelectromech. Syst. 2016, 25, 822–841. [Google Scholar] [CrossRef]
- MIT.edu. Material: PDMS (Polydimethylsiloxane). Available online: http://www.mit.edu/~6.777/matprops/pdms.htm (accessed on 24 April 2019).


| Parameter/Result | S1/R1 (40 mm) | S2/R2 (12 mm) |
|---|---|---|
| Outer diameter, (mm) | 40 | 12 |
| Inner diameter, (mm) | 20 | 5.3 |
| Trace width, (mm) | 0.5 | 0.2 |
| Trace separation, (mm) | 0.5 | 0.5 |
| Number of turns, | 10 | 5 |
| Capacitor electrode radius, (mm) | 7 | 2 |
| Dielectric layer thickness, (μm) | 200 | 200 |
| Spiral length, (mm) | 942.5 | 135.9 |
| Skin depth, (μm) | 15.15 | 4.12 |
| DC resistance, (Ω) | 0.9371 | 0.3377 |
| AC resistance, (Ω) | 3.7755 | 17.0536 |
| Relative permittivity of PDMS [3], | 2.65 | 2.65 |
| Calculated resonance frequency, (MHz) | 19.188 | 259.44 |
| Measured resonance frequency, (MHz) | 30.843750 | 274.10 |
| Sensitivity, (kHz/mmHg) | −8.110 | −65.48 |
| Capacitance, (pF) | 18.06 | 1.4743 |
| Parasitic capacitance, (pF) | 0.72434 | 0.10442 |
| Inductance, (μH) | 3.8095 | 0.25572 |
| Self-resonance frequency, (MHz) | 95.81 | 974.80 |
| Quality factor, at | 97.4584 | 23.92 |
| Parameters | S1 (40 mm) | S2 (12 mm) |
|---|---|---|
| (sensitivty) | −8.11 × 10³ | −65.48 × 10³ |
| ) | 3.083 × 10⁷ | 2.74 × 10⁸ |
| (goodness of fit) | 0.9977 | 0.9989 |
| Parameters | S1 (40 mm) | S2 (12 mm) |
|---|---|---|
| 15.27 | 77.12 | |
| −9.797 × 10³ | −8.439 × 10⁴ | |
| ) | 3.084 × 10⁷ | 2.75 × 10⁸ |
| (goodness of fit) | 0.9991 | 0.993 |
| Sensor | Parameter | Pressure (mmHg) | |||||
|---|---|---|---|---|---|---|---|
| 100 | 80 | 60 | 40 | 20 | 0 | ||
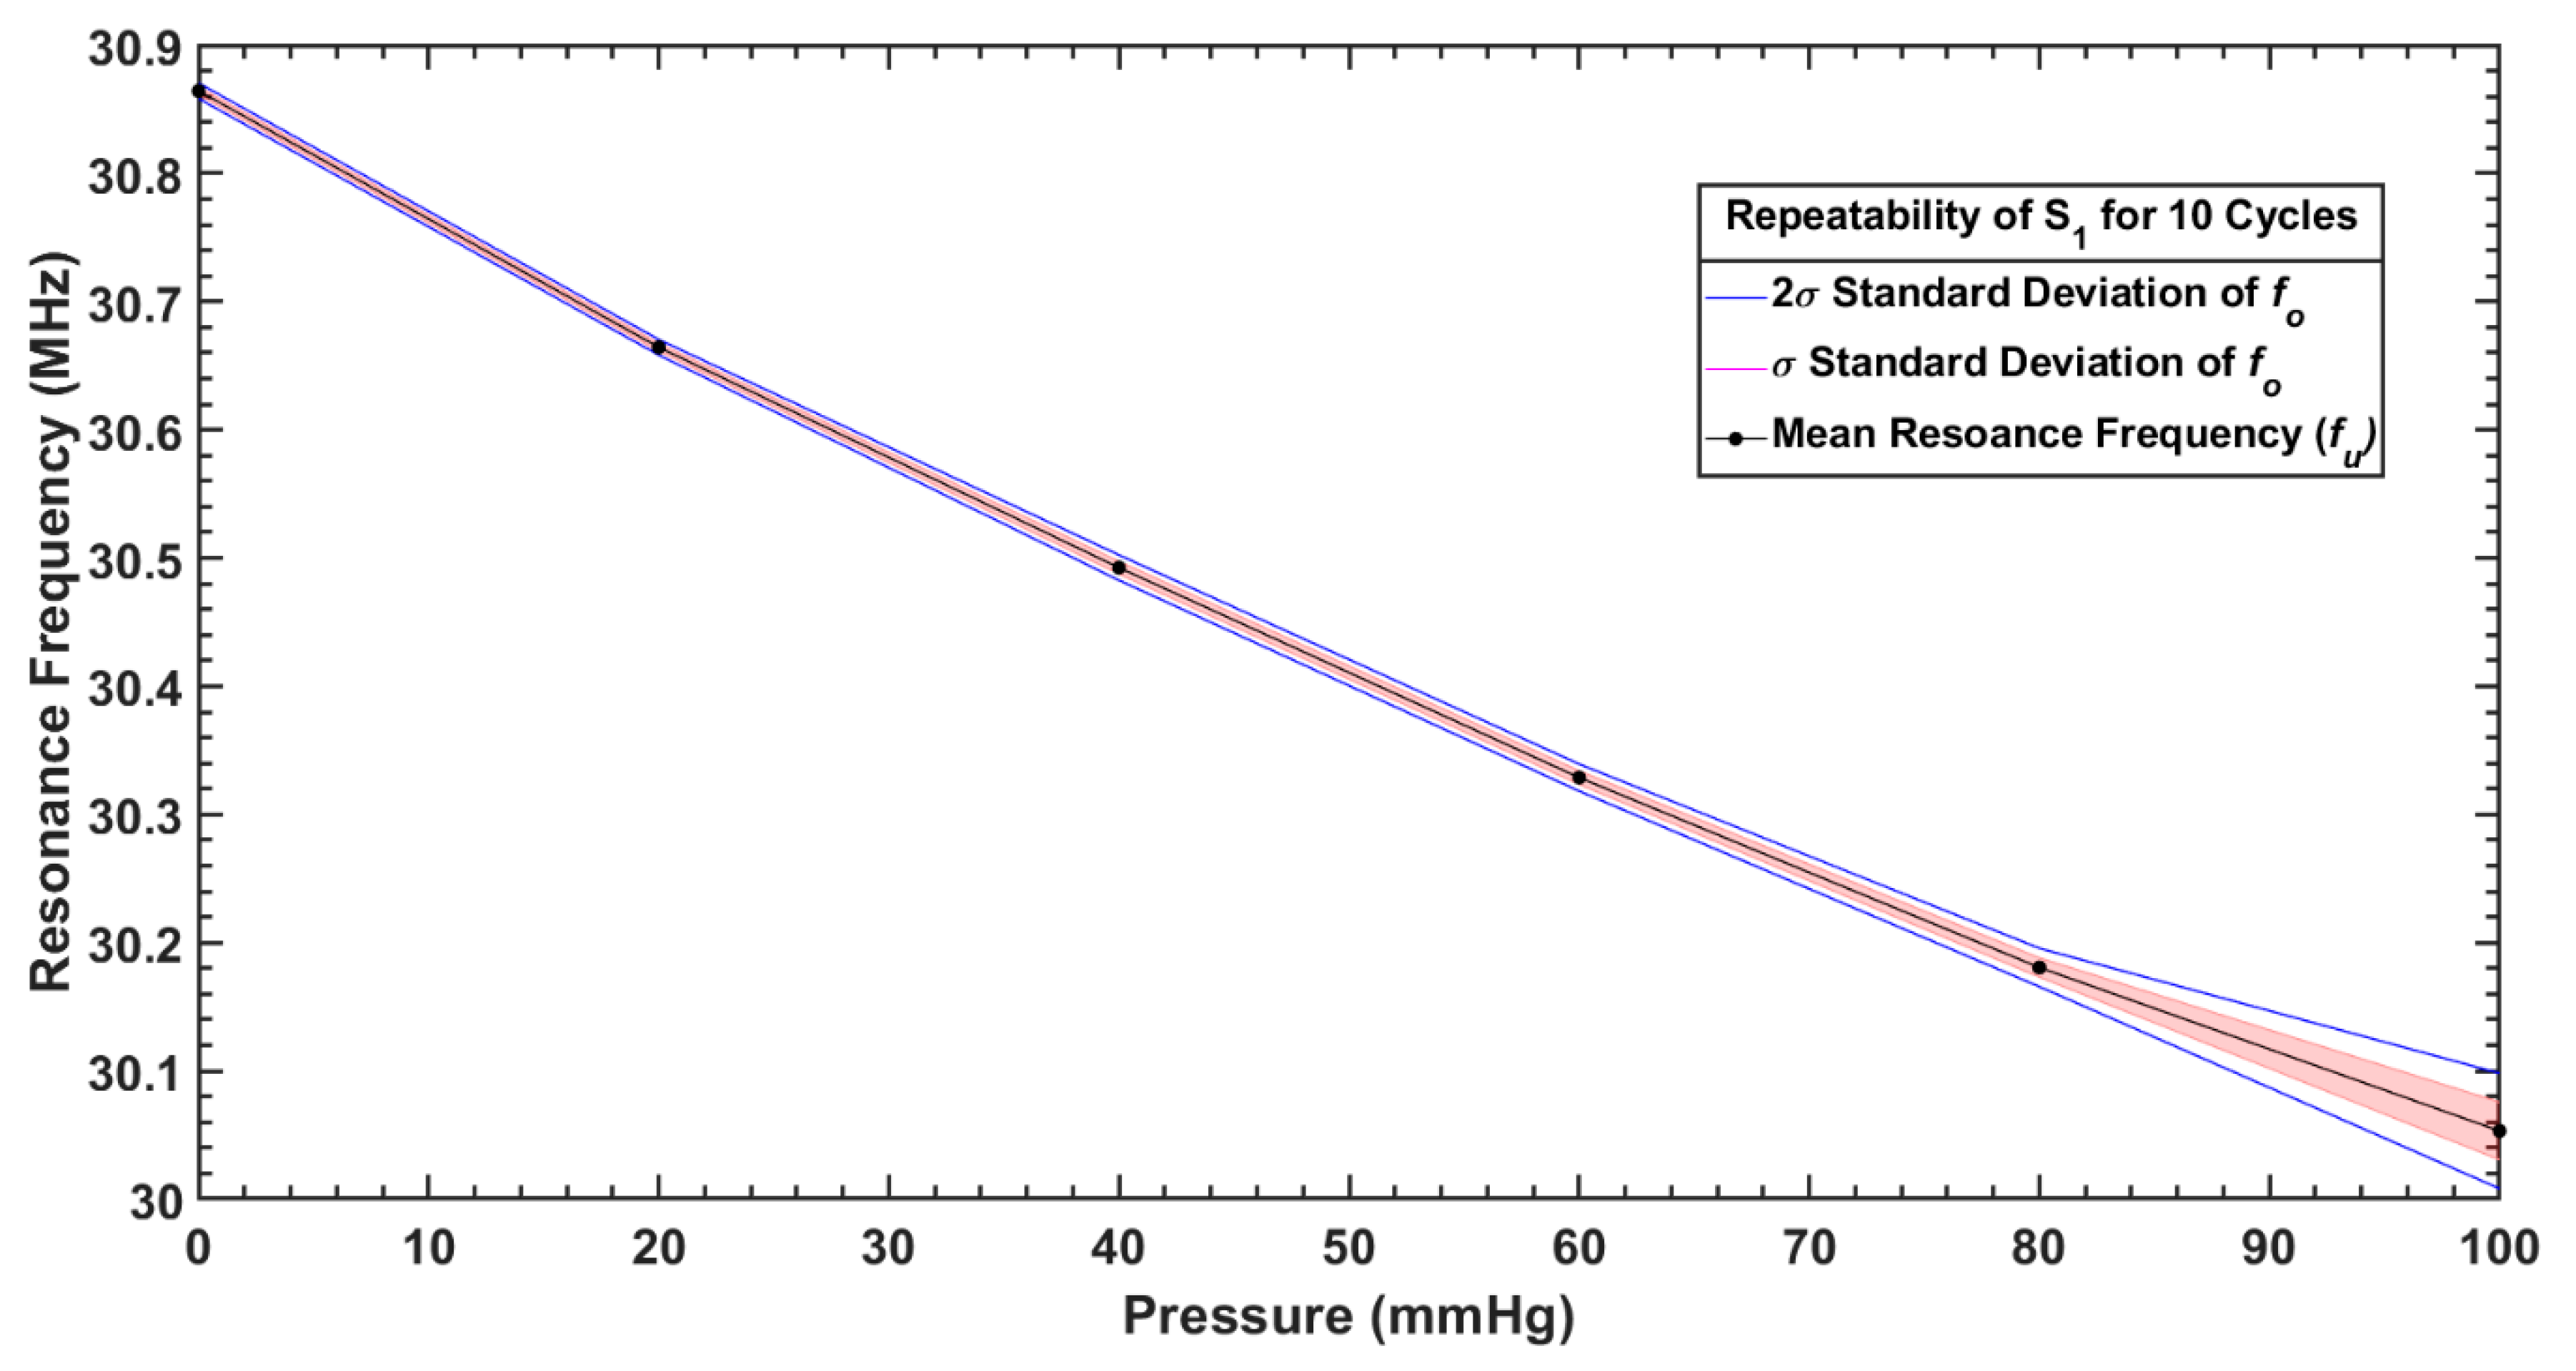
| S1 | Mean, (MHz) | 30.05 | 30.18 | 30.32 | 30.49 | 30.66 | 30.86 |
| Standard deviation, (kHz) | 22.48 | 7.48 | 5.27 | 4.93 | 3.01 | 3.01 | |
| S2 | Mean, (MHz) | 267.64 | 268.69 | 270.00 | 271.29 | 272.62 | 274.12 |
| Standard deviation, (kHz) | 26.81 | 80.96 | 59.86 | 45.94 | 42.49 | 67.49 | |
| Study | Sensing Mechanism | Methodology | Linear Operational Range | Sensitivity | Fabrication Cost | Application |
|---|---|---|---|---|---|---|
| This study | Capacitive | LaserJet printing, Copper etching, Sandwiching of PDMS layer | 0–100 mmHg | 8.11 kHz/mmHg 65.48 kHz/mmHg | Low | Interface pressure monitoring during compression therapy |
| Deng et al. [42] | Capacitive | Si wafer moulding, PDMS casting, Conductive printing, Packaging | 0–200 mmHg | 270 kHz/mmHg | High | Wound monitoring |
| Casey et al. [8] | Capacitive | Micro-machining, Si wafer moulding, Electrodes patterning, Component mounting | 10–80 mmHg | N/A | High | Sub-bandage pressure measurements |
| Farooqui et al. [40] | Capacitive | Screen printing, Conductive printing, Component mounting, Packaging | 5–100 mmHg | 0.0523 pF/mmHg | Medium | Smart bandage for chronic wounds |
| Fonseca et al. [43] | Capacitive | Standard lithography, Wet-chemical etching, Laser-cutting | 70–120 mmHg | 5.76 kHz/mmHg | High | Implantable pressure sensing |
| Chen et al. [45] | Capacitive | Oxide patterning, Coating, and patterning, Metal deposition, Deep Si etching | 0–100 mmHg | 160 kHz/mmHg | High | Intraocular pressure monitoring |
| Li et al. [44] | Capacitive | Microfabrication | 0–50 mmHg | 0.419 kHz/mmHg | High | Intracranial blood pressure monitoring |
| Rahimi et al. [41] | Inductive | Corona treatments, Laser patterning of mask, Screen printing of electrodes, Temperature curing | 0–35% | 150 kHz% strain | High | Wound monitoring |
| Mehmood et al. [39] | Resistive (FSR) | Off the shelf sensors integration with electronics, Biocompatible coating | 0–60 mmHg | N/A | Medium | Sub-bandage pressure and wound moisture |
| Burke et al. [4] | Resistive (FSR) | Off the shelf sensors integration with electronics | 0–96 mmHg | 31.27 mV/mmHg | Medium | Sub-bandage pressure during venous compression therapy |
Publisher’s Note: MDPI stays neutral with regard to jurisdictional claims in published maps and institutional affiliations. |
© 2020 by the authors. Licensee MDPI, Basel, Switzerland. This article is an open access article distributed under the terms and conditions of the Creative Commons Attribution (CC BY) license (http://creativecommons.org/licenses/by/4.0/).
Share and Cite
Farooq, M.; Iqbal, T.; Vazquez, P.; Farid, N.; Thampi, S.; Wijns, W.; Shahzad, A. Thin-Film Flexible Wireless Pressure Sensor for Continuous Pressure Monitoring in Medical Applications. Sensors 2020, 20, 6653. https://doi.org/10.3390/s20226653
Farooq M, Iqbal T, Vazquez P, Farid N, Thampi S, Wijns W, Shahzad A. Thin-Film Flexible Wireless Pressure Sensor for Continuous Pressure Monitoring in Medical Applications. Sensors. 2020; 20(22):6653. https://doi.org/10.3390/s20226653
Chicago/Turabian StyleFarooq, Muhammad, Talha Iqbal, Patricia Vazquez, Nazar Farid, Sudhin Thampi, William Wijns, and Atif Shahzad. 2020. "Thin-Film Flexible Wireless Pressure Sensor for Continuous Pressure Monitoring in Medical Applications" Sensors 20, no. 22: 6653. https://doi.org/10.3390/s20226653
APA StyleFarooq, M., Iqbal, T., Vazquez, P., Farid, N., Thampi, S., Wijns, W., & Shahzad, A. (2020). Thin-Film Flexible Wireless Pressure Sensor for Continuous Pressure Monitoring in Medical Applications. Sensors, 20(22), 6653. https://doi.org/10.3390/s20226653