Machine-Learning Analysis of Voice Samples Recorded through Smartphones: The Combined Effect of Ageing and Gender

 ,
, 
 ,
,  ,
,  and
and 
Abstract
1. Introduction
2. Materials and Methods
2.1. Subjects
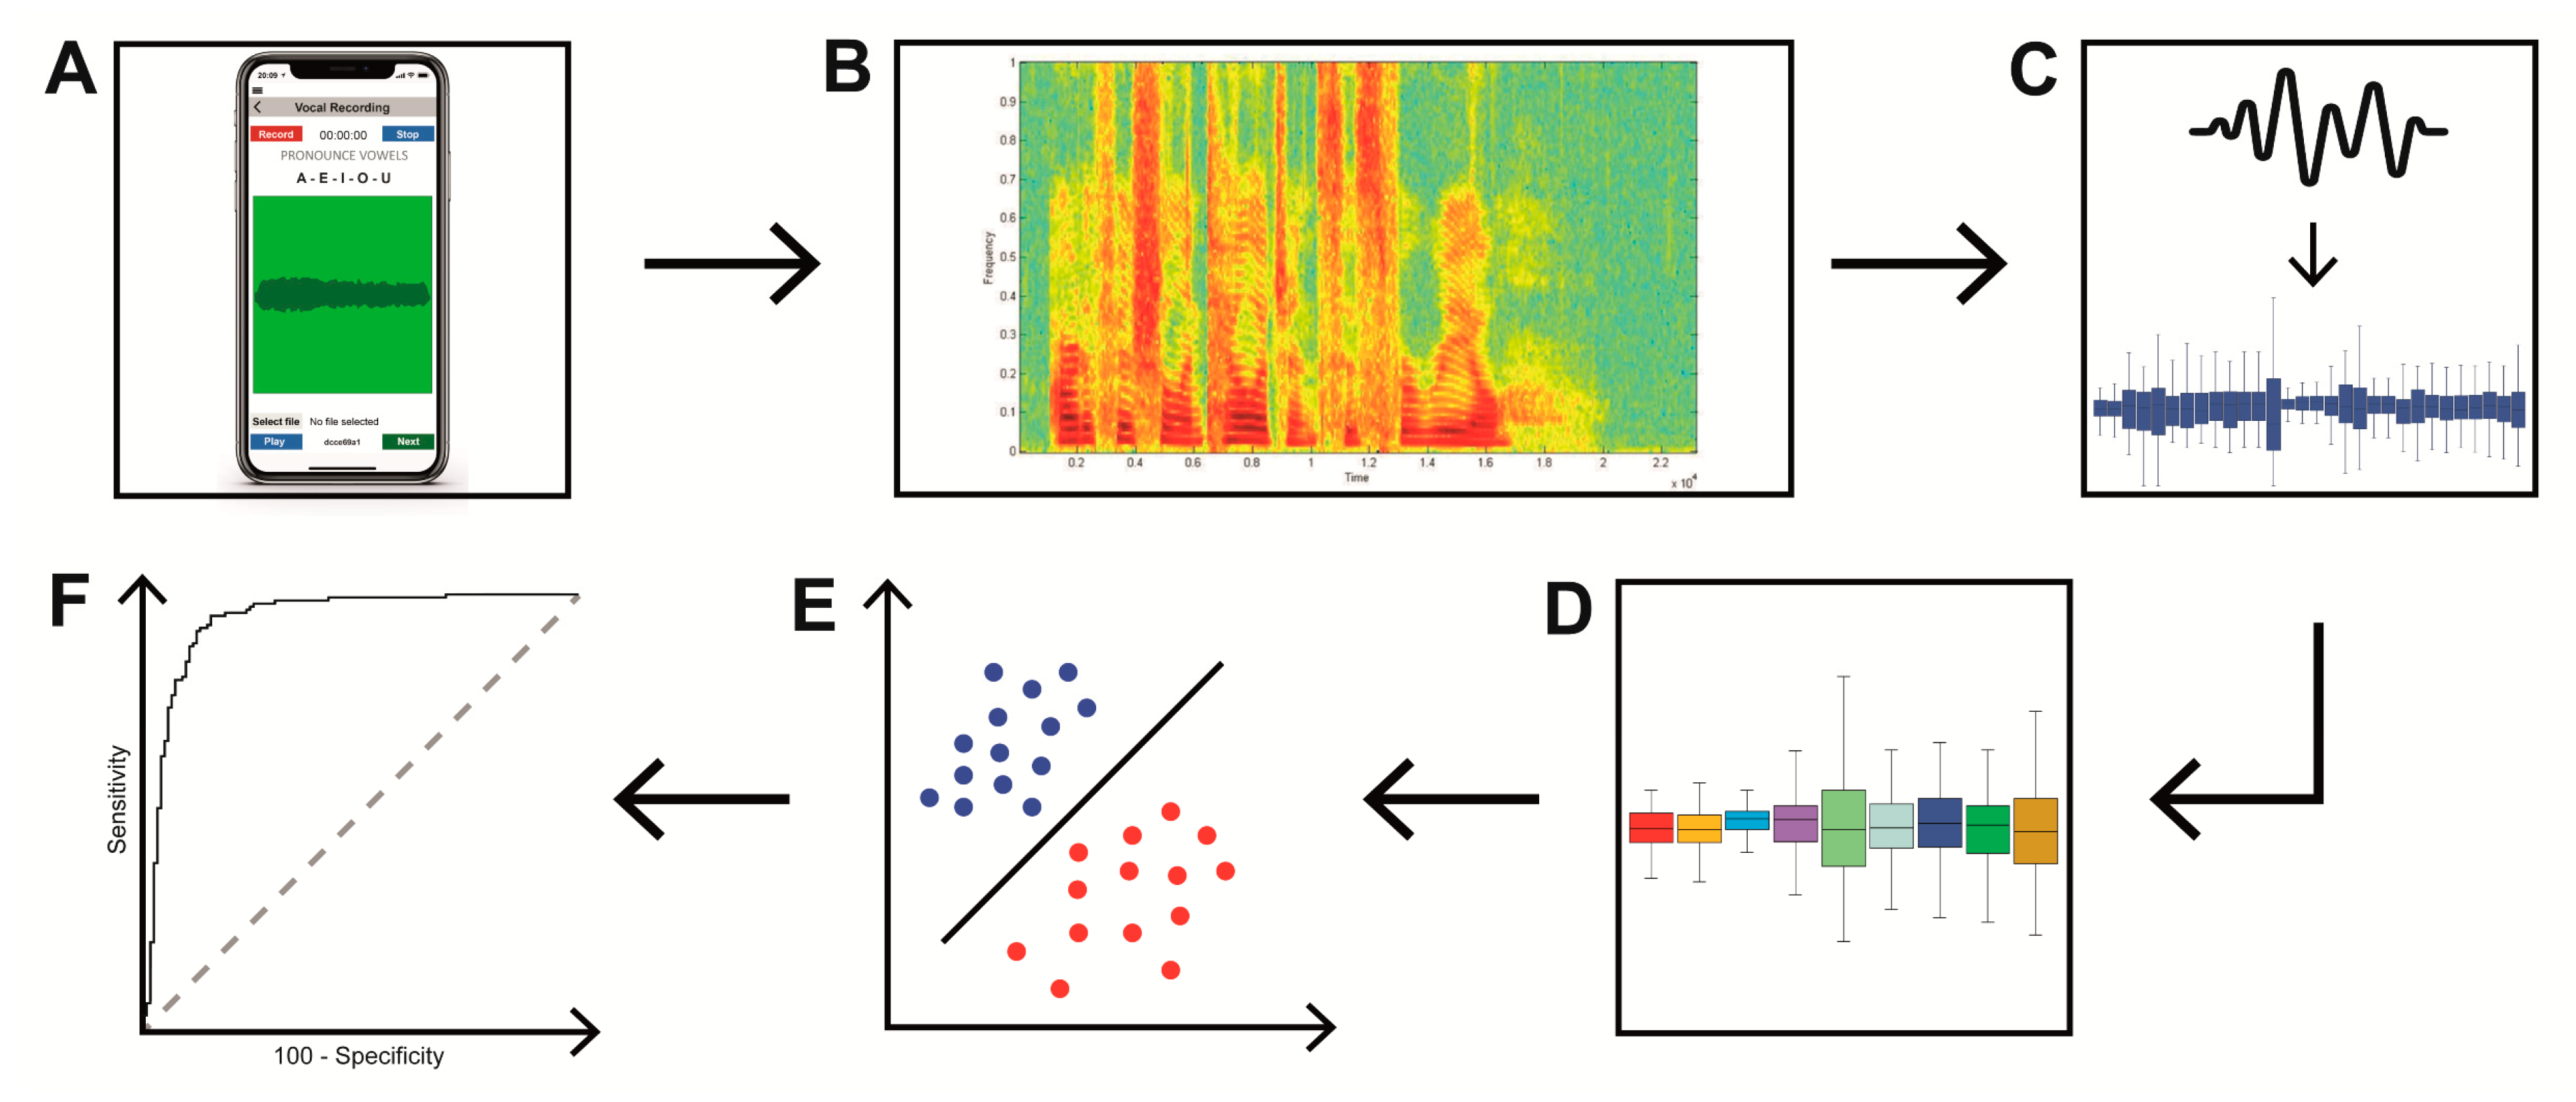
2.2. Voice Recordings
2.3. Machine-Learning Analysis
2.4. Statistical Analysis
2.5. Data Availability
3. Results
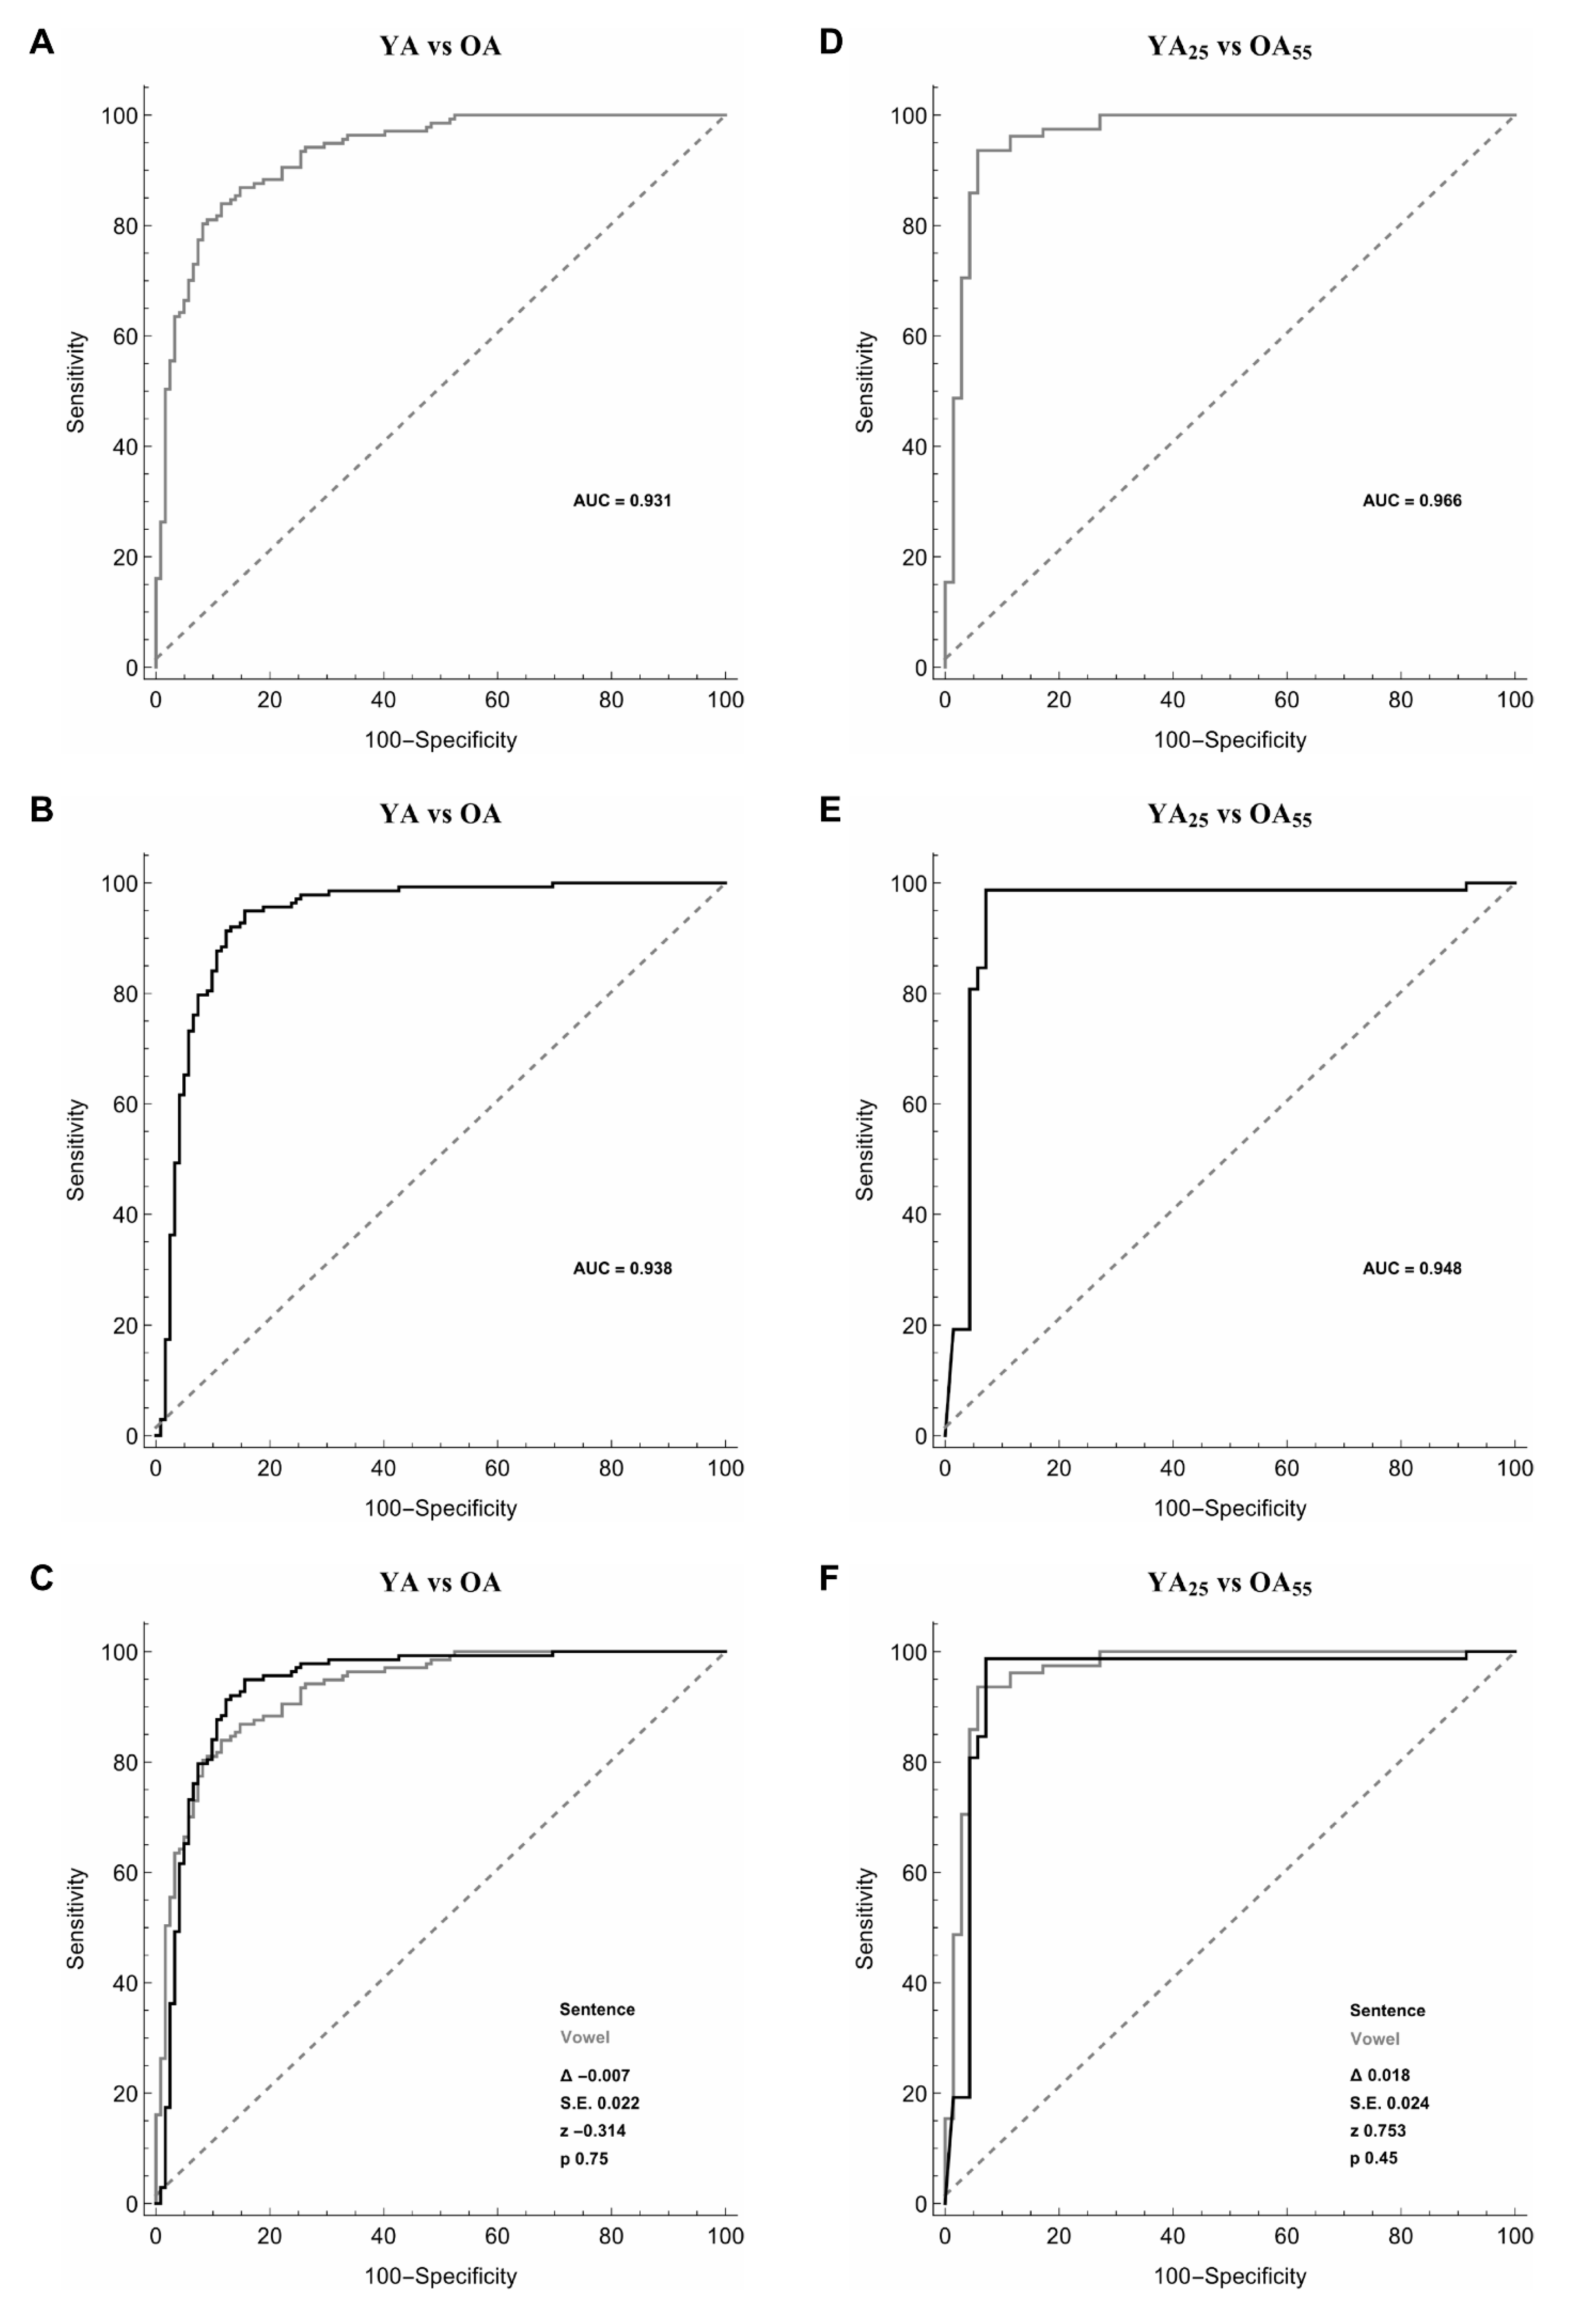
3.1. YA and OA
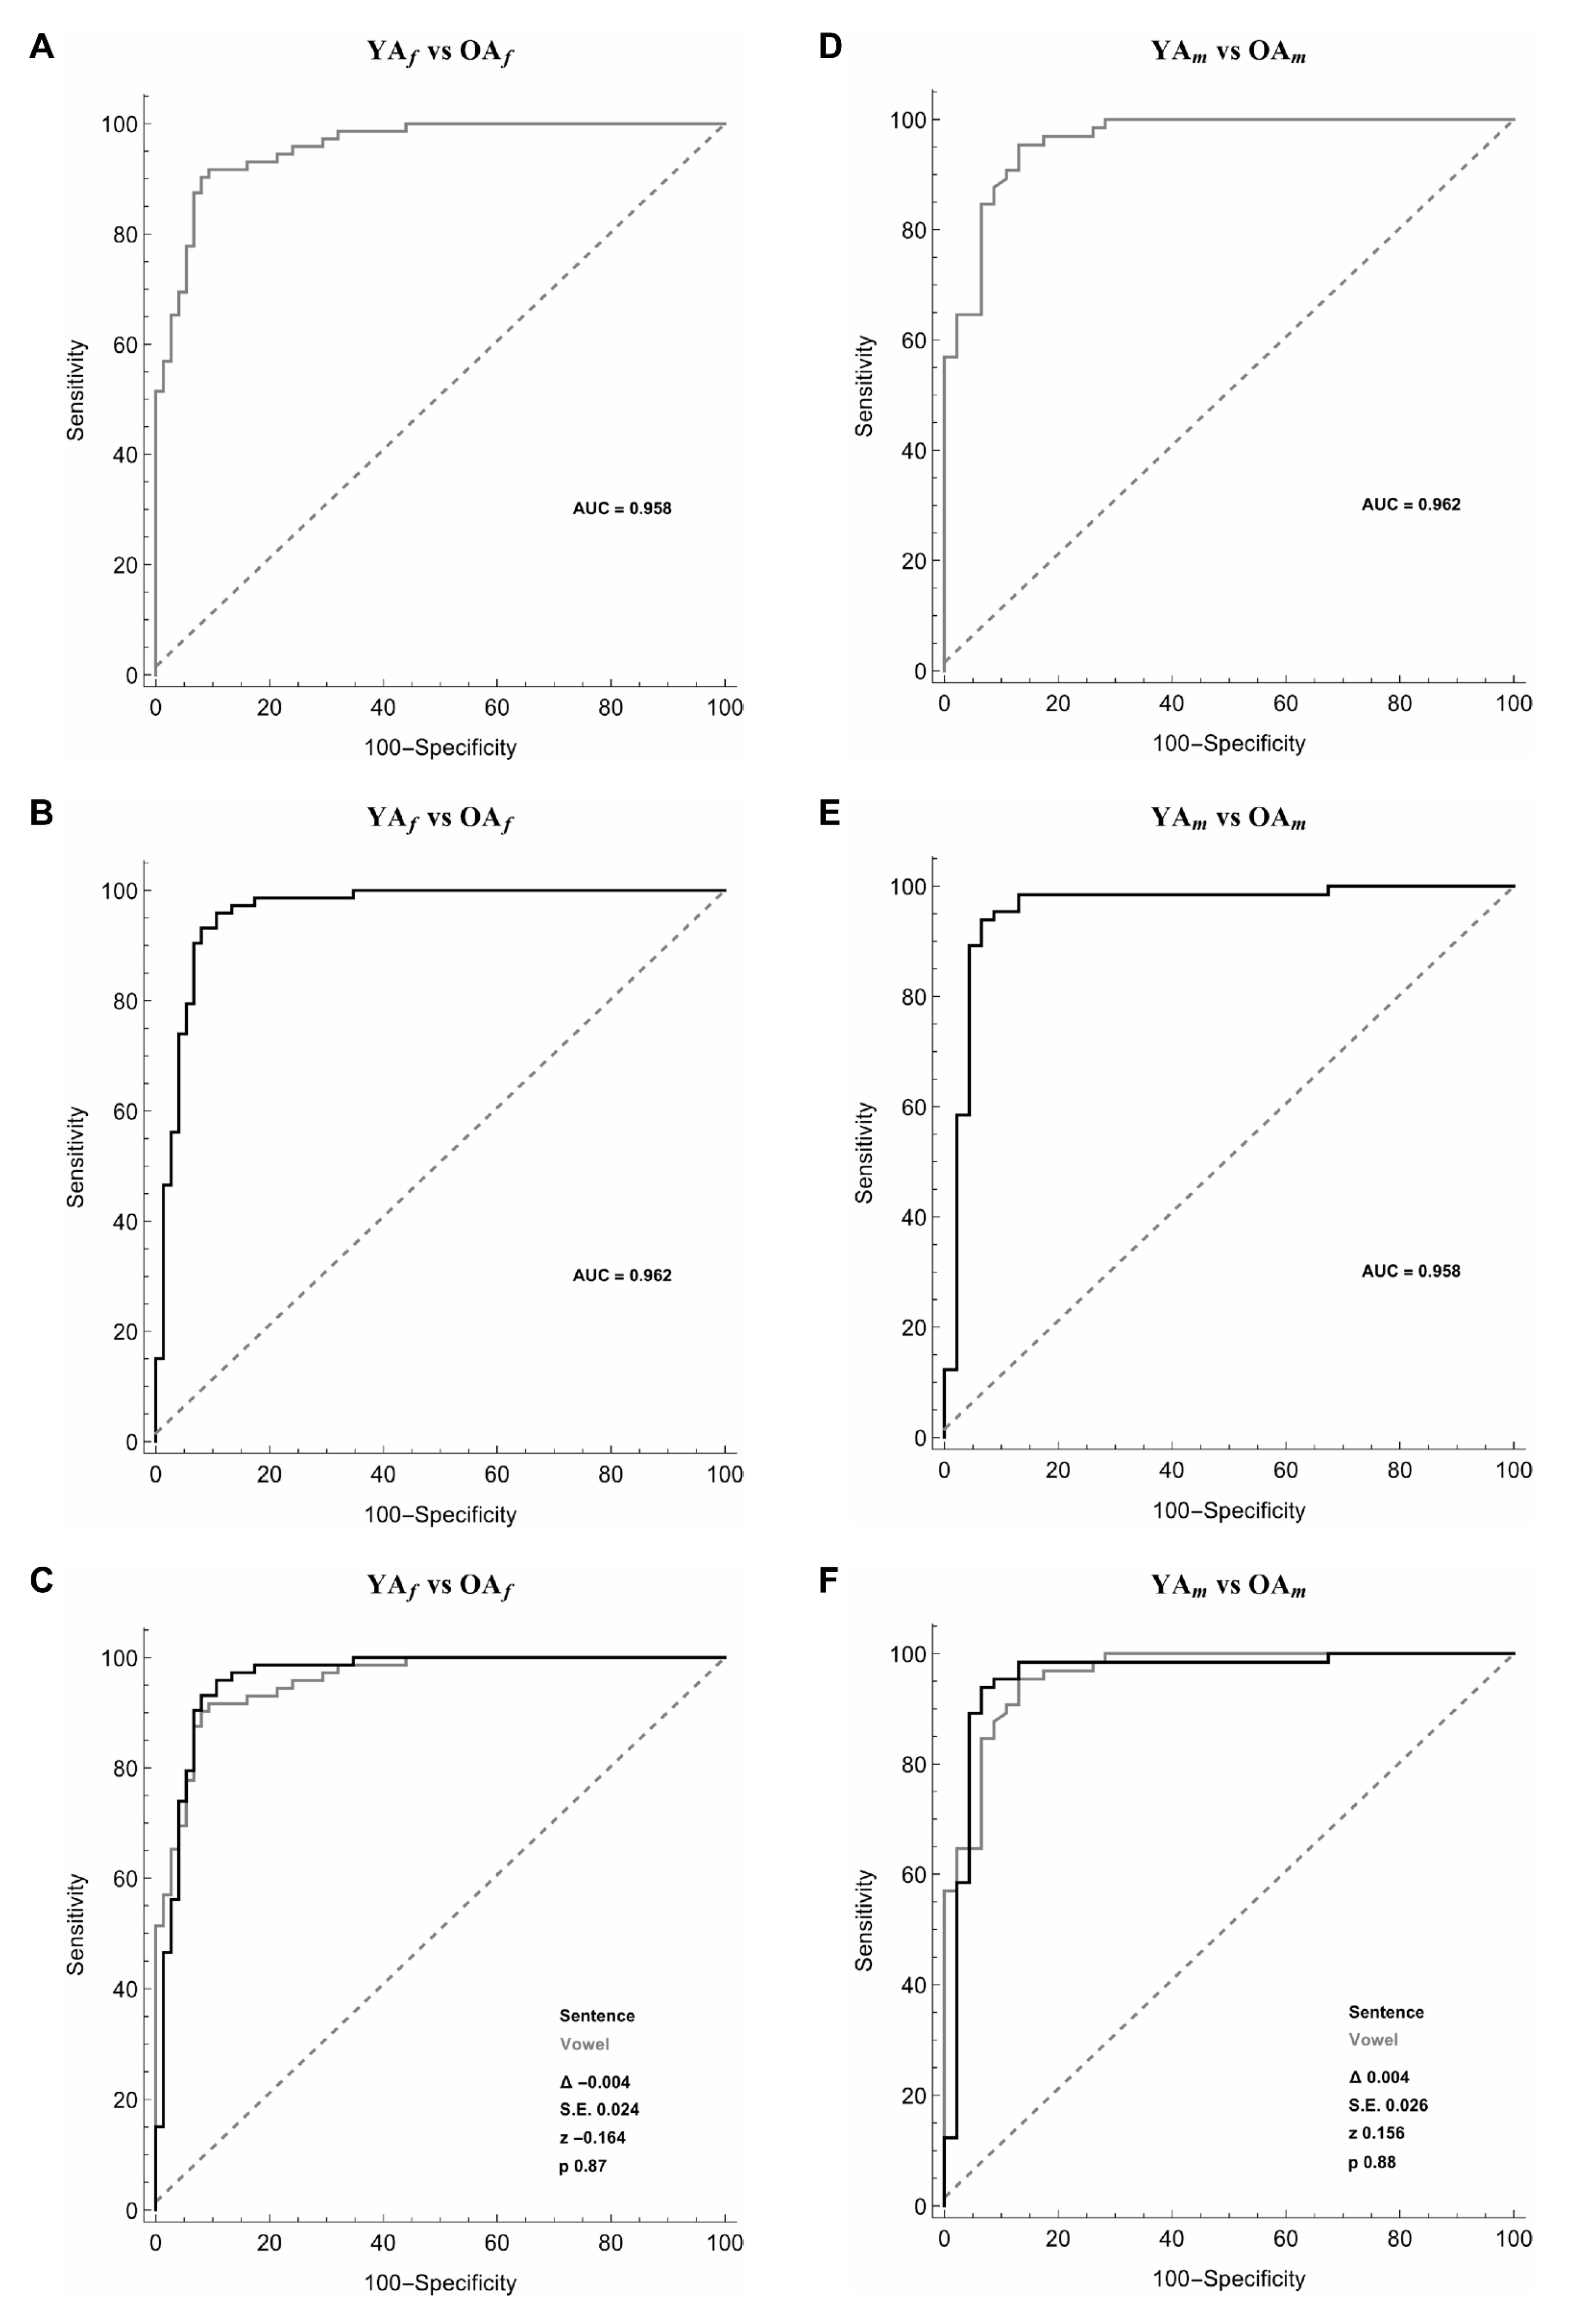
3.2. Female YA and Female OA
3.3. Male YA and Male OA
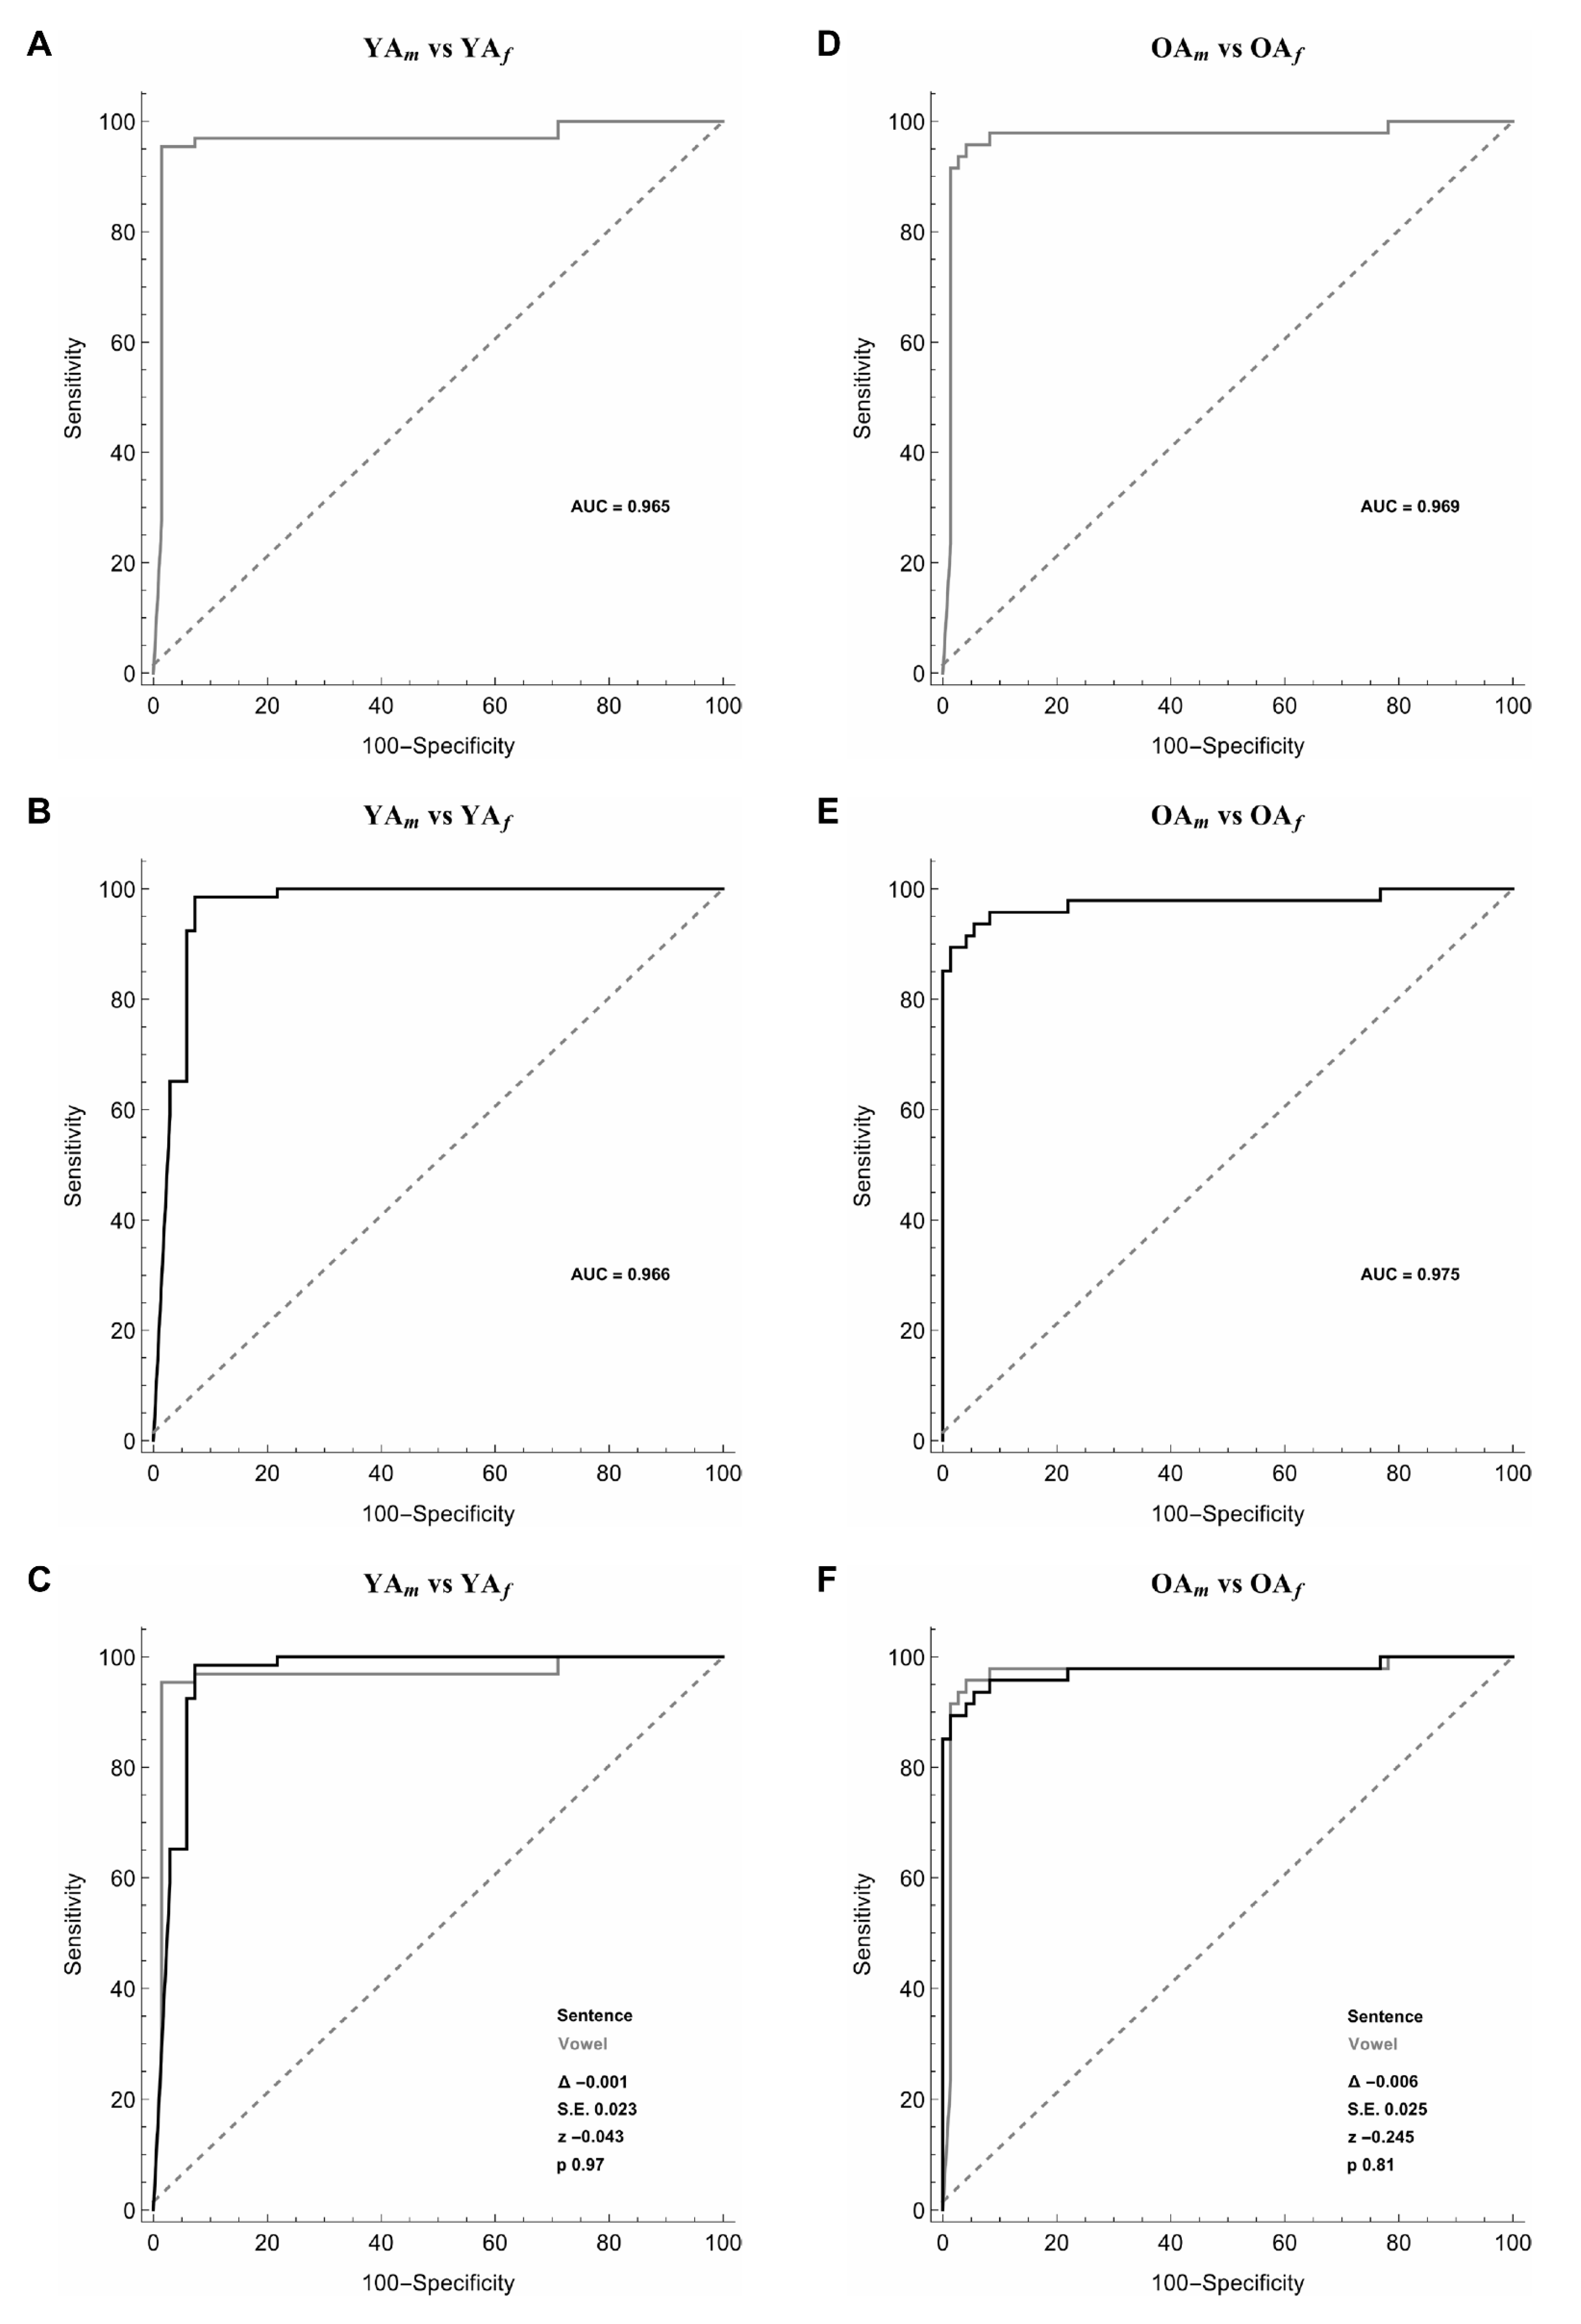
3.4. Male and Female YA
3.5. Male and Female OA
4. Discussion
4.1. The Effect of Ageing on Voice
4.2. The Effect of Gender on Voice
5. Conclusions
Supplementary Materials
Author Contributions
Funding
Conflicts of Interest
References
- Goy, H.; Fernandes, D.N.; Pichora-Fuller, M.K.; van Lieshout, P. Normative Voice Data for Younger and Older Adults. J. Voice 2013, 27, 545–555. [Google Scholar] [CrossRef]
- Kendall, K. Presbyphonia: A review. Curr. Opin. Otolaryngol. Head Neck Surg. 2007, 15, 137–140. [Google Scholar] [CrossRef]
- De Araújo Pernambuco, L.; Espelt, A.; Balata, P.M.M.; de Lima, K.C. Prevalence of voice disorders in the elderly: A systematic review of population-based studies. Eur. Arch. Otorhinolaryngol. 2015, 272, 2601–2609. [Google Scholar] [CrossRef]
- Mezzedimi, C.; Di Francesco, M.; Livi, W.; Spinosi, M.C.; De Felice, C. Objective Evaluation of Presbyphonia: Spectroacoustic Study on 142 Patients with Praat. J. Voice 2017, 31, 257.e25–257.e32. [Google Scholar] [CrossRef]
- Bruzzi, C.; Salsi, D.; Minghetti, D.; Negri, M.; Casolino, D.; Sessa, M. Presbiphonya. Acta Biomed. 2017, 88, 6–10. [Google Scholar] [CrossRef]
- Gonçalves, T.M.; Dos Santos, D.C.; Pessin, A.B.B.; Martins, R.H.G. Scanning Electron Microscopy of the Presbylarynx. Otolaryngol. Head Neck Surg. 2016, 154, 1073–1078. [Google Scholar] [CrossRef]
- Hirano, S.; Minamiguchi, S.; Yamashita, M.; Ohno, T.; Kanemaru, S.-I.; Kitamura, M. Histologic characterization of human scarred vocal folds. J. Voice 2009, 23, 399–407. [Google Scholar] [CrossRef]
- Sato, K.; Hirano, M. Histologic investigation of the macula flava of the human newborn vocal fold. Ann. Otol. Rhinol. Laryngol. 1995, 104, 556–562. [Google Scholar] [CrossRef]
- Chan, R.W.; Gray, S.D.; Titze, I.R. The importance of hyaluronic acid in vocal fold biomechanics. Otolaryngol. Head Neck Surg. 2001, 124, 607–614. [Google Scholar] [CrossRef]
- Chen, X.; Thibeault, S.L. Characteristics of age-related changes in cultured human vocal fold fibroblasts. Laryngoscope 2008, 118, 1700–1704. [Google Scholar] [CrossRef]
- Allah, R.; Dkhil, M.; Farhoud, E. Fibroblasts in the human vocal fold mucosa: An ultrastructural study of different age groups. Singap. Med. J. 2009, 50, 201–207. [Google Scholar]
- Hammond, T.H.; Gray, S.D.; Butler, J.; Zhou, R.; Hammond, E. Age- and gender-related elastin distribution changes in human vocal folds. Otolaryngol. Head Neck Surg. 1998, 119, 314–322. [Google Scholar] [CrossRef]
- McMullen, C.A.; Andrade, F.H. Contractile dysfunction and altered metabolic profile of the aging rat thyroarytenoid muscle. J. Appl. Physiol. 2006, 100, 602–608. [Google Scholar] [CrossRef]
- Claflin, D.R.; Faulkner, J.A. Shortening velocity extrapolated to zero load and unloaded shortening velocity of whole rat skeletal muscle. J. Physiol. 1985, 359, 357–363. [Google Scholar] [CrossRef]
- Vaca, M.; Mora, E.; Cobeta, I. The Aging Voice: Influence of Respiratory and Laryngeal Changes. Otolaryngol. Head Neck Surg. 2015, 153, 409–413. [Google Scholar] [CrossRef]
- Hodge, F.S.; Colton, R.H.; Kelley, R.T. Vocal Intensity Characteristics inNormal and Elderly Speakers. J. Voice 2001, 15, 503–511. [Google Scholar] [CrossRef]
- Prakup, B. Acoustic Measures of the Voices of Older Singers and Nonsingers. J. Voice 2012, 26, 341–350. [Google Scholar] [CrossRef]
- Ferrand, C.T. Harmonics-to-Noise Ratio. J. Voice 2002, 16, 480–487. [Google Scholar] [CrossRef]
- Baughman, R.P.; Loudon, R.G. Sound spectral analysis of voice-transmitted sound. Am. Rev. Respir. Dis. 1986, 134, 167–169. [Google Scholar] [CrossRef] [PubMed]
- Titze, I.R.; Baken, R.J.; Bozeman, K.W.; Granqvist, S.; Henrich, N.; Herbst, C.T.; Howard, D.M.; Hunter, E.J.; Kaelin, D.; Kent, R.D.; et al. Toward a consensus on symbolic notation of harmonics, resonances, and formants in vocalization. J. Acoust. Soc. Am. 2015, 137, 3005–3007. [Google Scholar] [CrossRef]
- Hillenbrand, J.; Houde, R.A. Acoustic correlates of breathy vocal quality: Dysphonic voices and continuous speech. J. Speech Hear. Res. 1996, 39, 311–321. [Google Scholar] [CrossRef]
- Hillenbrand, J.; Cleveland, R.A.; Erickson, R.L. Acoustic correlates of breathy vocal quality. J. Speech Hear. Res. 1994, 37, 769–778. [Google Scholar] [CrossRef]
- Delgado-Hernández, J.; León-Gómez, N.M.; Izquierdo-Arteaga, L.M.; Llanos-Fumero, Y. Cepstral analysis of normal and pathological voice in Spanish adults. Smoothed cepstral peak prominence in sustained vowels versus connected speech. Acta Otorrinolaringol. Esp. 2018, 69, 134–140. [Google Scholar] [CrossRef]
- Li, M.; Han, K.; Narayanan, S. Automatic Speaker Age and Gender Recognition Using Acoustic and Prosodic Level Information Fusion. Comput. Speech Lang. 2012, 27. [Google Scholar] [CrossRef]
- Spiegl, W.; Stemmer, G.; Lasarcyk, E.; Kolhatkar, V.; Cassidy, A.; Potard, B.; Shum, S.; Song, Y.; Xu, P.; Beyerlein, P.; et al. Analyzing Features for Automatic Age Estimation on Cross-Sectional Data. In Proceedings of the INTERSPEECH 2009, 10th Annual Conference of the International Speech Communication Association, Brighton, UK, 6–10 September 2009; pp. 2923–2926. [Google Scholar]
- Stolcke, A.; Kajarekar, S.S.; Ferrer, L.; Shrinberg, E. Speaker Recognition with Session Variability Normalization Based on MLLR Adaptation Transforms. IEEE Trans. Audio Speech Lang. Process. 2007, 15, 1987–1998. [Google Scholar] [CrossRef]
- Berardi, M.L.; Hunter, E.J.; Ferguson, S.H. Talker age estimation using machine learning. Proc Meet Acoust 2017, 30. [Google Scholar] [CrossRef]
- Zhavoronkov, A.; Li, R.; Ma, C.; Mamoshina, P. Deep biomarkers of aging and longevity: From research to applications. Aging 2019, 11, 10771–10780. [Google Scholar] [CrossRef]
- Deo, R.C. Machine Learning in Medicine. Circulation 2015, 132, 1920–1930. [Google Scholar] [CrossRef]
- Costantini, G.; Todisco, M.; Perfetti, R.; Basili, R.; Casali, D. Svm Based Transcription System with Short-Term Memory Oriented to Polyphonic Piano Music. In Proceedings of the MELECON 2010—2010 15th IEEE Mediterranean Electrotechnical Conference, La Valletta, Malta, 26–28 April 2010; pp. 196–201. [Google Scholar]
- Costantini, G.; Casali, D.; Todisco, M. An SVM Based Classification Method for EEG Signals. In Proceedings of the 14th WSEAS international conference on Circuits, Corfu Island, Greece, 22–24 July 2010; Volume 2224. [Google Scholar]
- Van Calster, B.; Wynants, L. Machine Learning in Medicine. N. Engl. J. Med. 2019, 380, 2588. [Google Scholar] [CrossRef]
- Kockmann, M.; Burget, L.; Černocký, J. Brno University of Technology System for Interspeech 2010 Paralinguistic Challenge. In Proceedings of the INTERSPEECH 2010, 11th Annual Conference of the International Speech Communication Association, Makuhari, Chiba, Japan, 26–30 September 2010. [Google Scholar]
- Meinedo, H.; Trancoso, I. Age and Gender Classification Using Fusion of Acoustic and Prosodic Features. In Proceedings of the INTERSPEECH 2010, 11th Annual Conference of the International Speech Communication Association, Makuhari, Chiba, Japan, 26–30 September 2010. [Google Scholar]
- Přibil, J.; Přibilová, A.; Matoušek, J. GMM-based speaker age and gender classification in Czech and Slovak. J. Electr. Eng. 2017, 68, 3–12. [Google Scholar] [CrossRef]
- Grzybowska, J.; Kacprzak, S. Speaker Age Classification and Regression Using i-Vectors. In Proceedings of the INTERSPEECH 2016, 16th Annual Conference of the International Speech Communication Association, San Francisco, CA, USA, 8–12 September 2016; pp. 1402–1406. [Google Scholar]
- Sedaghi, M. A Comparative Study of Gender and Age Classification in Speech Signals. Iran. J. Electr. Electron. Eng. 2009, 5, 1–12. [Google Scholar]
- Barkana, B.D.; Zhou, J. A new pitch-range based feature set for a speaker’s age and gender classification. Appl. Acoust. 2015, 98, 52–61. [Google Scholar] [CrossRef]
- Higgins, J.P. Smartphone Applications for Patients’ Health and Fitness. Am. J. Med. 2016, 129, 11–19. [Google Scholar] [CrossRef]
- Alameen, G. Review of Audacity computer software. TESL-EJ 2007, 11, 1–11. [Google Scholar]
- Russell, S.J.; Norvig, P.; Davis, E. Artificial Intelligence: A Modern Approach, 3rd ed.; Prentice Hall Series in Artificial Intelligence; Prentice Hall: Upper Saddle River, NJ, USA, 2010; ISBN 978-0-13-604259-4. [Google Scholar]
- Specht, D. A General Regression Neural Network. IEEE Trans. Neural Netw. 1991, 2, 568–578. [Google Scholar] [CrossRef]
- Alpaydin, E. Introduction to Machine Learning, 2nd ed.; Adaptive Computation and Machine Learning; MIT Press: Cambridge, MA, USA, 2010; ISBN 978-0-262-01243-0. [Google Scholar]
- Schuller, B.; Steidl, S.; Batliner, A.; Hirschberg, J.; Burgoon, J.K.; Baird, A.; Elkins, A.; Zhang, Y.; Coutinho, E.; Evanini, K. The INTERSPEECH 2016 Computational Paralinguistics Challenge: Deception, Sincerity and Native Language. In Proceedings of the INTERSPEECH 2016, 16th Annual Conference of the International Speech Communication Association, San Francisco, CA, USA, 8–12 September 2016; pp. 2001–2005. [Google Scholar]
- Eyben, F.; Weninger, F.; Gross, F.; Schuller, B. Recent Developments in openSMILE, the Munich Open-Source Multimedia Feature Extractor. In Proceedings of the 21st ACM International Conference on Multimedia—MM’13; ACM Press: Barcelona, Spain, 2013; pp. 835–838. [Google Scholar]
- Schuller, B.; Steidl, S.; Batliner, A.; Vinciarelli, A.; Scherer, K.; Ringeval, F.; Chetouani, M.; Weninger, F.; Eyben, F.; Marchi, E.; et al. The INTERSPEECH 2013 Computational Paralinguistics Challenge: Social Signals, Conflict, Emotion, Autism. In Proceedings of the INTERSPEECH 2013, 13th Annual Conference of the International Speech Communication Association, Lyon, France, 25–29 August 2013; p. 152. [Google Scholar]
- Davis, S.; Mermelstein, P. Comparison of parametric representations for monosyllabic word recognition in continuously spoken sentences. IEEE Trans. Acoust. Speech Signal Process. 1980, 28, 357–366. [Google Scholar] [CrossRef]
- Young, S.; Kershaw, D.; Odell, J.; Ollason, D.; Valtchev, V.; Woodland, P. The HTK Book. Camb. Univ. Eng. Dep. 2002, 3, 12. [Google Scholar]
- Hermansky, H.; Morgan, N. RASTA processing of speech. IEEE Trans. Speech Audio Process. 1994, 2, 578–589. [Google Scholar] [CrossRef]
- Heman-Ackah, Y.D.; Michael, D.D.; Goding, G.S. The relationship between cepstral peak prominence and selected parameters of dysphonia. J. Voice 2002, 16, 20–27. [Google Scholar] [CrossRef]
- Heman-Ackah, Y.D.; Sataloff, R.T.; Laureyns, G.; Lurie, D.; Michael, D.D.; Heuer, R.; Rubin, A.; Eller, R.; Chandran, S.; Abaza, M.; et al. Quantifying the cepstral peak prominence, a measure of dysphonia. J. Voice 2014, 28, 783–788. [Google Scholar] [CrossRef]
- Hall, M.A.; Smith, L.A. Practical Feature Subset Selection for Machine Learning. In Proceedings of the 21st Australasian Computer Science Conference ACSC’98, Perth, Australia, 4–6 February 1998; pp. 181–191. [Google Scholar]
- Hall, M. Correlation-Based Feature Selection for Machine Learning. Dep. Comput. Sci. 2000, 19, 1–198. [Google Scholar]
- Fayyad, U.M.; Irani, K.B. On the handling of continuous-valued attributes in decision tree generation. Mach. Learn. 1992, 8, 87–102. [Google Scholar] [CrossRef]
- Platt, J. Fast Training of Support Vector Machines Using Sequential Minimal Optimization. In Advances in Kernel Methods: Support Vector Learning; MIT Press: Cambridge, MA, USA, 1999; pp. 185–208. ISBN 978-0-262-19416-7. [Google Scholar]
- Frank, E.; Hall, M.; Holmes, G.; Kirkby, R.; Pfahringer, B.; Witten, I.H.; Trigg, L. Weka-A Machine Learning Workbench for Data Mining. In Data Mining and Knowledge Discovery Handbook; Maimon, O., Rokach, L., Eds.; Springer: Boston, MA, USA, 2009; pp. 1269–1277. ISBN 978-0-387-09822-7. [Google Scholar]
- DeLong, E.R.; DeLong, D.M.; Clarke-Pearson, D.L. Comparing the areas under two or more correlated receiver operating characteristic curves: A nonparametric approach. Biometrics 1988, 44, 837–845. [Google Scholar] [CrossRef]
- Assembly, U.G. Convention on the Rights of the Child. U. N. Treaty Ser. 1989, 1577, 1–15. [Google Scholar]
- Livingston, G.; Huntley, J.; Sommerlad, A.; Ames, D.; Ballard, C.; Banerjee, S.; Brayne, C.; Burns, A.; Cohen-Mansfield, J.; Cooper, C.; et al. Dementia prevention, intervention, and care: 2020 report of the Lancet Commission. Lancet 2020, 396, 413–446. [Google Scholar] [CrossRef]
- Hegde, S.; Shetty, S.; Rai, S.; Dodderi, T. A Survey on Machine Learning Approaches for Automatic Detection of Voice Disorders. J. Voice 2019, 33, 947.e11–947.e33. [Google Scholar] [CrossRef]
- Zhan, A.; Mohan, S.; Tarolli, C.; Schneider, R.B.; Adams, J.L.; Sharma, S.; Elson, M.J.; Spear, K.L.; Glidden, A.M.; Little, M.A.; et al. Using Smartphones and Machine Learning to Quantify Parkinson Disease Severity: The Mobile Parkinson Disease Score. JAMA Neurol. 2018, 75, 876–880. [Google Scholar] [CrossRef]
- Arora, S.; Venkataraman, V.; Zhan, A.; Donohue, S.; Biglan, K.M.; Dorsey, E.R.; Little, M.A. Detecting and monitoring the symptoms of Parkinson’s disease using smartphones: A pilot study. Parkinsonism Relat. Disord. 2015, 21, 650–653. [Google Scholar] [CrossRef]
- Hakkesteegt, M.M.; Brocaar, M.P.; Wieringa, M.H.; Feenstra, L. Influence of Age and Gender on the Dysphonia Severity Index. Folia Phoniatr. Logop. 2006, 58, 264–273. [Google Scholar] [CrossRef] [PubMed]
- Awan, S.N. The aging female voice: Acoustic and respiratory data. Clin. Linguist. Phon. 2006, 20, 171–180. [Google Scholar] [CrossRef]
- Ma, E.P.-M.; Love, A.L. Electroglottographic Evaluation of Age and Gender Effects During Sustained Phonation and Connected Speech. J. Voice 2010, 24, 146–152. [Google Scholar] [CrossRef]
- de Aquino, F.S.; Ferreira, L.P.; de Aquino, F.S.; Ferreira, L.P. Vocal Parameters of Elderly Female Choir Singers. Int. Arch. Otorhinolaryngol. 2016, 20, 25–29. [Google Scholar] [CrossRef]
- Deliyski, D. Effects of aging on selected acoustic voice parameters: Preliminary normative data and educational implications. Educ. Gerontol. 2001, 27, 159–168. [Google Scholar] [CrossRef]
- Decoster, W.; Debruyne, F. The ageing voice: Changes in fundamental frequency, waveform stability and spectrum. Acta Otorhinolaryngol. Belg. 1997, 51, 105–112. [Google Scholar]
- Harnsberger, J.D.; Shrivastav, R.; Brown, W.S.; Rothman, H.; Hollien, H. Speaking rate and fundamental frequency as speech cues to perceived age. J. Voice 2008, 22, 58–69. [Google Scholar] [CrossRef]
- Benjamin, B.J. Frequency variability in the aged voice. J. Gerontol. 1981, 36, 722–726. [Google Scholar] [CrossRef]
- Orlikoff, R.F. The Relationship of Age and Cardiovascular Health to Certain Acoustic Characteristics of Male Voices. J. Speech Lang. Hear. Res. 1990, 33, 450–457. [Google Scholar] [CrossRef]
- Ramig, L.A.; Ringel, R.L. Effects of Physiological Aging on Selected Acoustic Characteristics of Voice. J. Speech Lang. Hear. Res. 1983, 26, 22–30. [Google Scholar] [CrossRef]
- Zraick, R.I.; Smith-Olinde, L.; Shotts, L.L. Adult Normative Data for the KayPENTAX Phonatory Aerodynamic System Model 6600. J. Voice 2012, 26, 164–176. [Google Scholar] [CrossRef]
- Connor, N.P.; Suzuki, T.; Sewall, G.K.; Lee, K.; Heisey, D.M. Neuromuscular Junction Changes in Aged Rat Thyroarytenoid Muscle. Ann. Otol. Rhinol. Laryngol. 2002, 111, 579–586. [Google Scholar] [CrossRef]
- Tiago, R.S.L.; de Pontes, P.A.L.; de Brasil, O.O.C. do Quantitative analysis of myelinic fibers in human laryngeal nerves according to age. Braz. J. Otorhinolaryngol. 2008, 74, 45–52. [Google Scholar] [CrossRef]
- D’haeseleer, E.; Depypere, H.; Claeys, S.; Baudonck, N.; Van Lierde, K. The Impact of Hormone Therapy on Vocal Quality in Postmenopausal Women. J. Voice 2012, 26, 671.e1–671.e7. [Google Scholar] [CrossRef]
- Suppa, A.; Asci, F.; Saggio, G.; Marsili, L.; Casali, D.; Zarezadeh, Z.; Ruoppolo, G.; Berardelli, A.; Costantini, G. Voice analysis in adductor spasmodic dysphonia: Objective diagnosis and response to botulinum toxin. Parkinsonism Relat. Disord. 2020, 73, 23–30. [Google Scholar] [CrossRef]
- Bai, X. Biomarkers of Aging. Adv. Exp. Med. Biol. 2018, 1086, 217–234. [Google Scholar] [CrossRef]
- Jylhävä, J.; Pedersen, N.L.; Hägg, S. Biological Age Predictors. EBioMedicine 2017, 21, 29–36. [Google Scholar] [CrossRef]
- Khan, S.S.; Singer, B.D.; Vaughan, D.E. Molecular and physiological manifestations and measurement of aging in humans. Aging Cell 2017, 16, 624–633. [Google Scholar] [CrossRef]
- Hamczyk, M.R.; Nevado, R.M.; Barettino, A.; Fuster, V.; Andrés, V. Biological Versus Chronological Aging. J. Am. Coll. Cardiol. 2020, 75, 919–930. [Google Scholar] [CrossRef]
- Mueller, P. The Aging Voice. Semin Speech Lang. 1997, 18, 159–169. [Google Scholar] [CrossRef]
- de Souza, L.B.R.; Santos, M.M.D. Body mass index and acoustic voice parameters: Is there a relationship? Braz. J. Otorhinolaryngol. 2018, 84, 410–415. [Google Scholar] [CrossRef]
- Suppa, A.; Marsili, L.; Giovannelli, F.; Stasio, F.D.; Rocchi, L.; Upadhyay, N.; Ruoppolo, G.; Cincotta, M.; Berardelli, A. Abnormal motor cortex excitability during linguistic tasks in adductor-type spasmodic dysphonia. Eur. J. Neurosci. 2015, 42, 2051–2060. [Google Scholar] [CrossRef]


| Group | Age (years) | Weight (Kg) | Height (cm) | BMI |
|---|---|---|---|---|
| YA | 25.1 ± 3.1 | 64.5 ± 12.4 | 171.4 ± 8.5 | 21.8 ± 3.1 |
| OA | 58.9 ± 11.0 | 66.9 ± 11.9 | 166.5 ± 9.8 | 25.2 ± 4.1 |
| YA25 | 22.9 ± 2.2 | 61.4 ± 10.3 | 171.0 ± 8.1 | 20.9 ± 2.5 |
| OA55 | 66.4 ± 8.1 | 68.6 ± 11.9 | 163.0 ± 9.1 | 25.8 ± 4.3 |
| YAf | 24.7 ± 3.0 | 56.5 ± 7.6 | 166.2 ± 5.7 | 20.5 ± 2.7 |
| YAm | 25.5 ± 3.2 | 73.4 ± 10.7 | 177.2 ± 7.1 | 23.3 ± 2.8 |
| OAf | 59.8 ± 10.5 | 65.7 ± 11.3 | 161.2 ± 7.3 | 25.4 ± 4.7 |
| OAm | 58.1 ± 11.3 | 76.4 ± 9.6 | 175.0 ± 6.9 | 25.0 ± 3.1 |
| Comparisons | Speech-Task | Number of Instances | Cross-Validation | Assoc. Criterion | Youden Index | Se (%) | Sp (%) | PPV (%) | NPV (%) | Acc (%) | AUC |
|---|---|---|---|---|---|---|---|---|---|---|---|
| YA vs. OA | Vowel | 259 | 10 folds | 0.50 | 0.72 | 86.9 | 85.2 | 86.9 | 85.2 | 86.1 | 0.961 |
| Sentence | 260 | 10 folds | 0.50 | 0.77 | 89.1 | 87.7 | 89.1 | 87.7 | 88.5 | 0.938 | |
| YA25 vs. OA55 | Vowel | 148 | 5 folds | 0.59 | 0.86 | 93.6 | 92.9 | 93.6 | 92.9 | 93.2 | 0.966 |
| Sentence | 148 | 5 folds | 0.52 | 0.91 | 92.8 | 98.5 | 98.7 | 91.4 | 95.3 | 0.984 | |
| YAf vs. OAf | Vowel | 147 | 5 folds | 0.57 | 0.81 | 90.3 | 90.7 | 90.3 | 90.7 | 90.5 | 0.958 |
| Sentence | 148 | 5 folds | 0.66 | 0.85 | 91.9 | 93.2 | 93.2 | 92.0 | 92.6 | 0.962 | |
| YAm vs. OAm | Vowel | 111 | 5 folds | 0.53 | 0.82 | 91.0 | 90.9 | 93.8 | 87.0 | 91.0 | 0.962 |
| Sentence | 111 | 5 folds | 0.52 | 0.87 | 91.3 | 95.2 | 96.9 | 87.0 | 92.8 | 0.958 | |
| YAm vs. YAf | Vowel | 134 | 5 folds | 0.69 | 0.91 | 95.4 | 95.7 | 95.4 | 95.7 | 95.5 | 0.965 |
| Sentence | 135 | 5 folds | 0.61 | 0.89 | 90.3 | 98.4 | 98.5 | 89.9 | 94.1 | 0.966 | |
| OAm vs. OAf | Vowel | 120 | 5 folds | 0.74 | 0.87 | 89.4 | 97.1 | 95.5 | 93.2 | 94.2 | 0.969 |
| Sentence | 120 | 5 folds | 0.63 | 0.86 | 89.8 | 95.8 | 93.6 | 93.2 | 93.3 | 0.975 |
© 2020 by the authors. Licensee MDPI, Basel, Switzerland. This article is an open access article distributed under the terms and conditions of the Creative Commons Attribution (CC BY) license (http://creativecommons.org/licenses/by/4.0/).
Share and Cite
Asci, F.; Costantini, G.; Di Leo, P.; Zampogna, A.; Ruoppolo, G.; Berardelli, A.; Saggio, G.; Suppa, A. Machine-Learning Analysis of Voice Samples Recorded through Smartphones: The Combined Effect of Ageing and Gender. Sensors 2020, 20, 5022. https://doi.org/10.3390/s20185022
Asci F, Costantini G, Di Leo P, Zampogna A, Ruoppolo G, Berardelli A, Saggio G, Suppa A. Machine-Learning Analysis of Voice Samples Recorded through Smartphones: The Combined Effect of Ageing and Gender. Sensors. 2020; 20(18):5022. https://doi.org/10.3390/s20185022
Chicago/Turabian StyleAsci, Francesco, Giovanni Costantini, Pietro Di Leo, Alessandro Zampogna, Giovanni Ruoppolo, Alfredo Berardelli, Giovanni Saggio, and Antonio Suppa. 2020. "Machine-Learning Analysis of Voice Samples Recorded through Smartphones: The Combined Effect of Ageing and Gender" Sensors 20, no. 18: 5022. https://doi.org/10.3390/s20185022
APA StyleAsci, F., Costantini, G., Di Leo, P., Zampogna, A., Ruoppolo, G., Berardelli, A., Saggio, G., & Suppa, A. (2020). Machine-Learning Analysis of Voice Samples Recorded through Smartphones: The Combined Effect of Ageing and Gender. Sensors, 20(18), 5022. https://doi.org/10.3390/s20185022