Reactive Navigation on Natural Environments by Continuous Classification of Ground Traversability
Abstract
1. Introduction
2. Related Works
- The use of 2D polar traversability maps based on 3D laser scans classified point by point for selecting motion directions on natural environments.
- The employment of extensive robotic simulations to appropriately tune reactivity before performing real tests with uncertain global localisation.
3. Mobile Robot Simulation
4. Reactive-Navigation Scheme
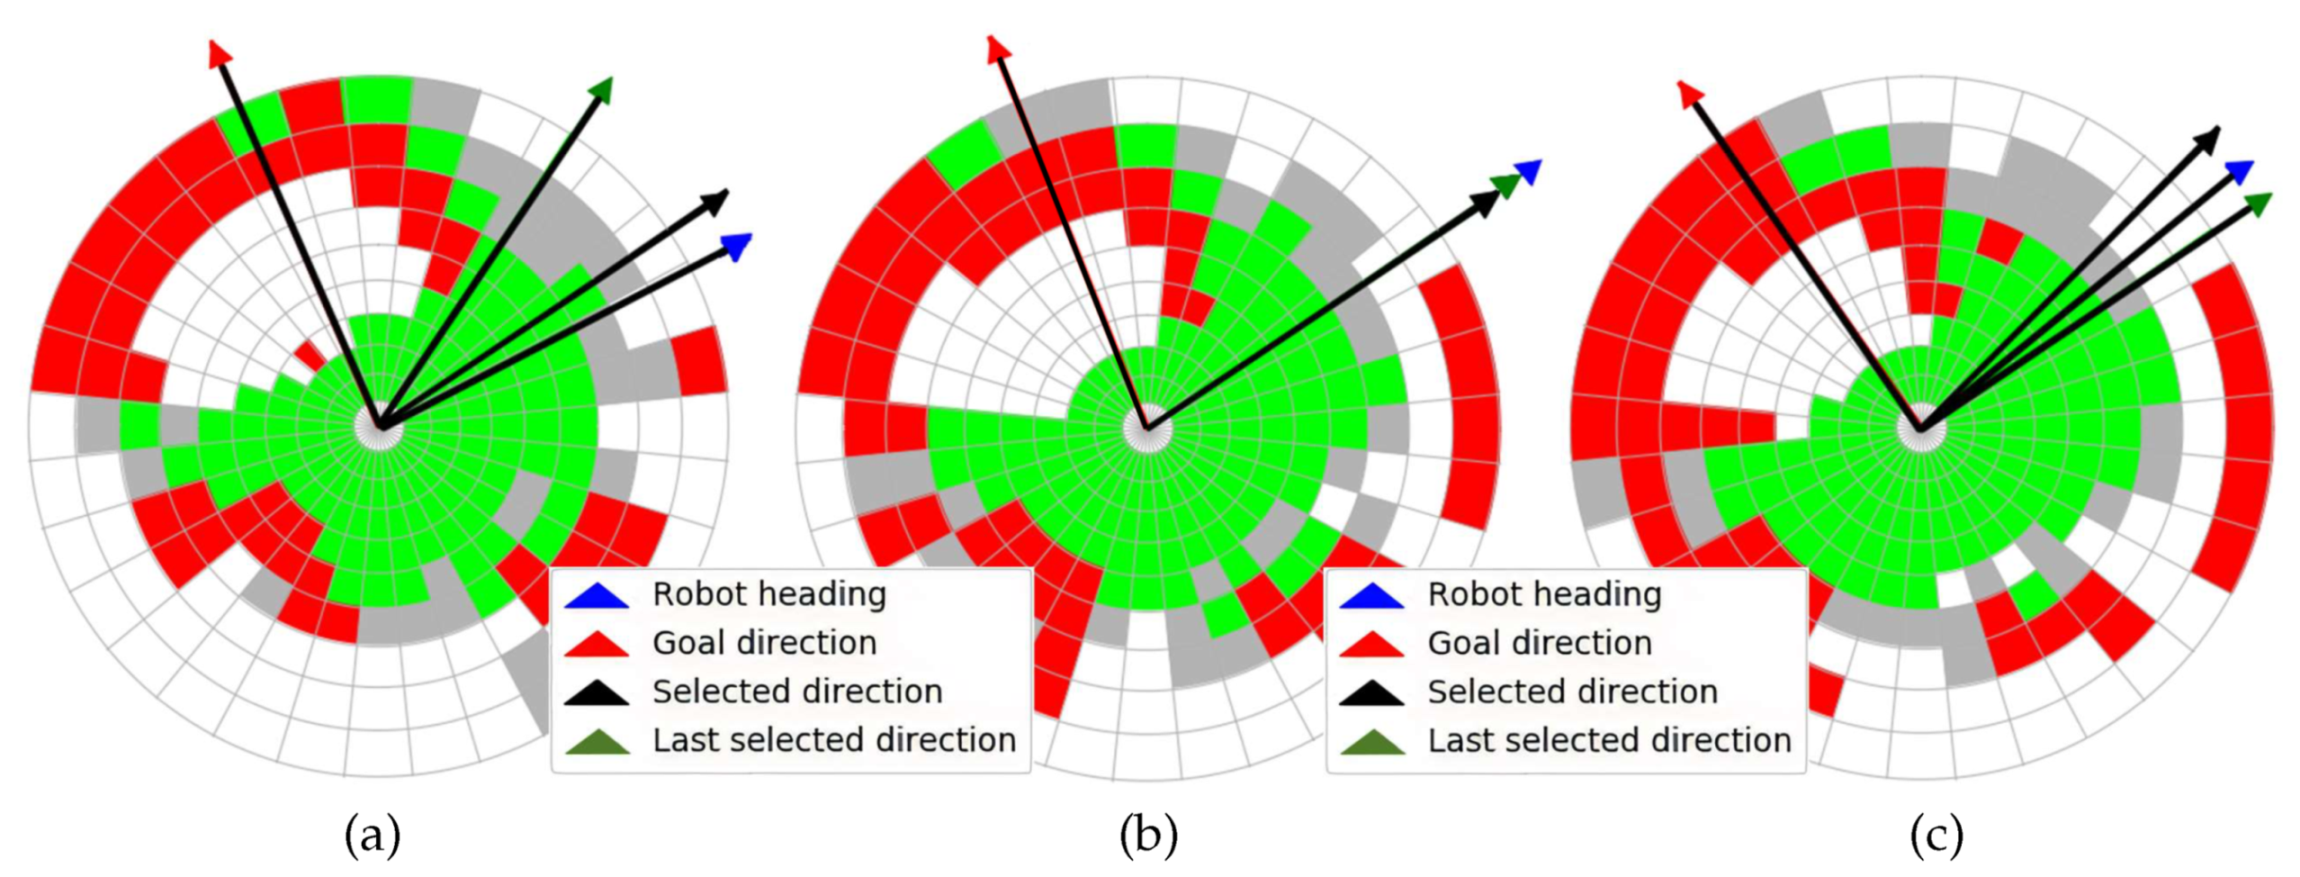
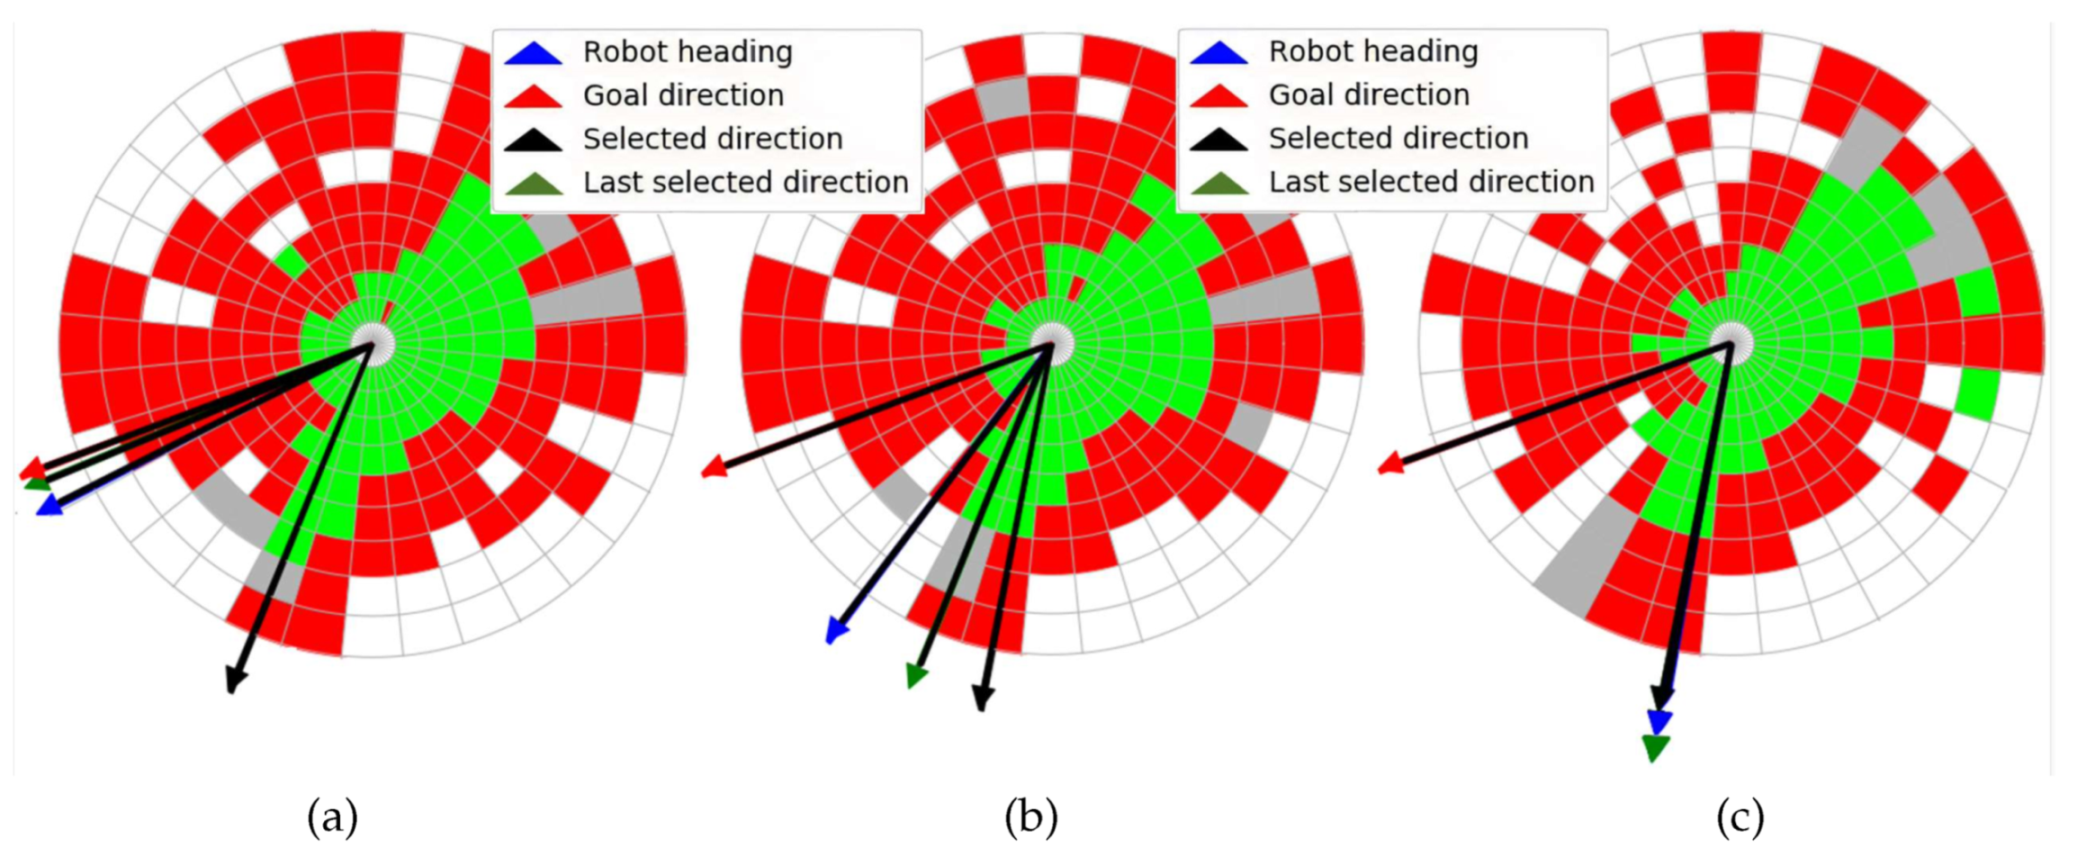
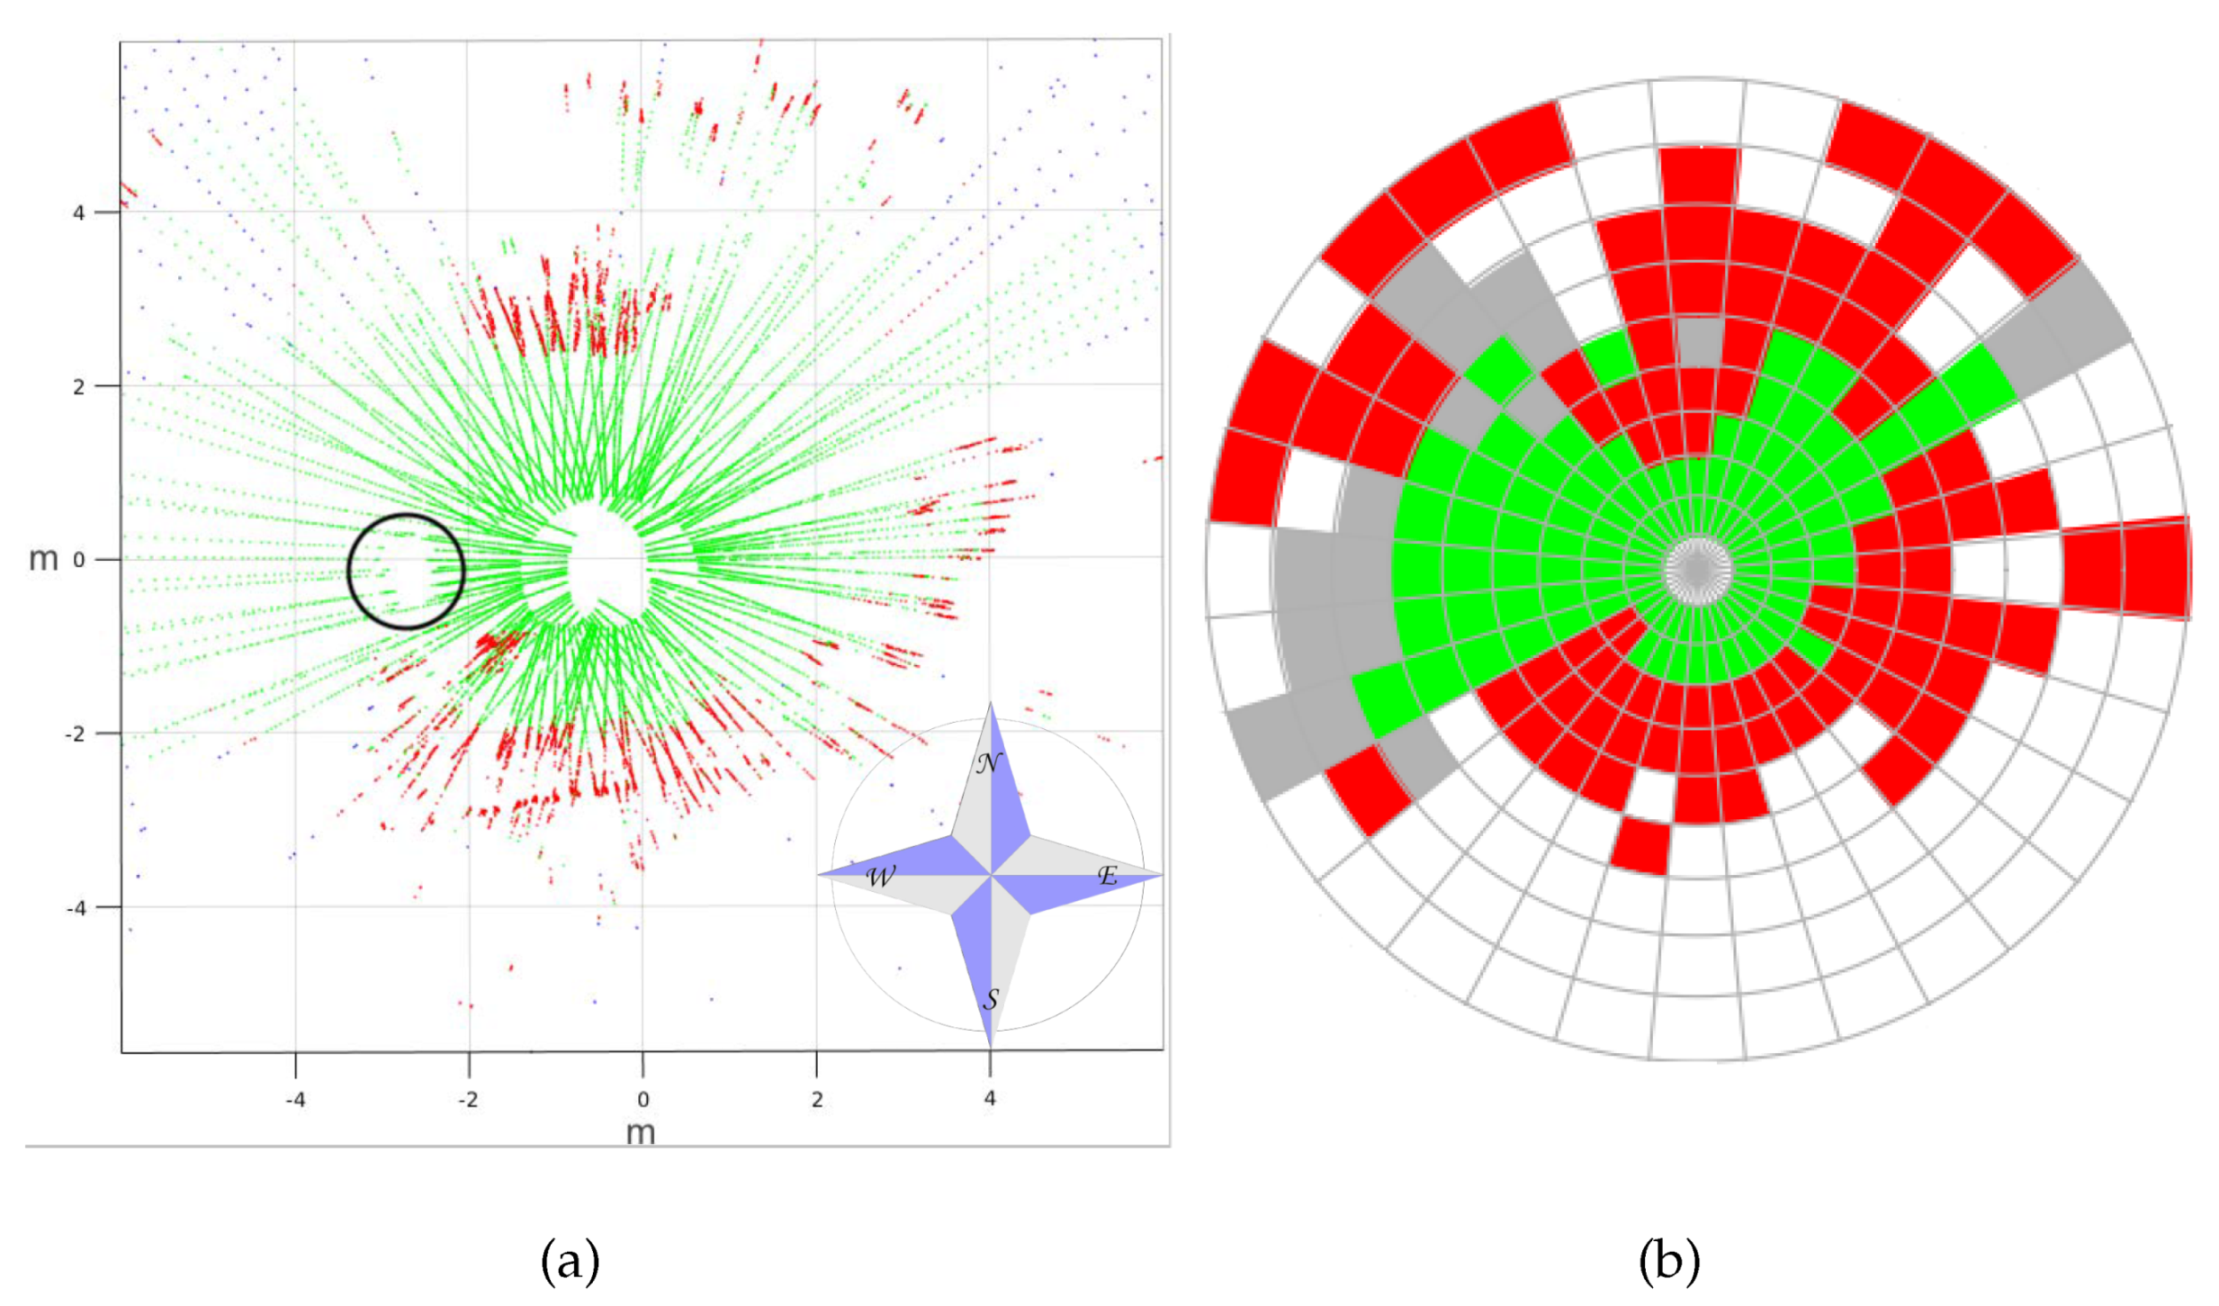
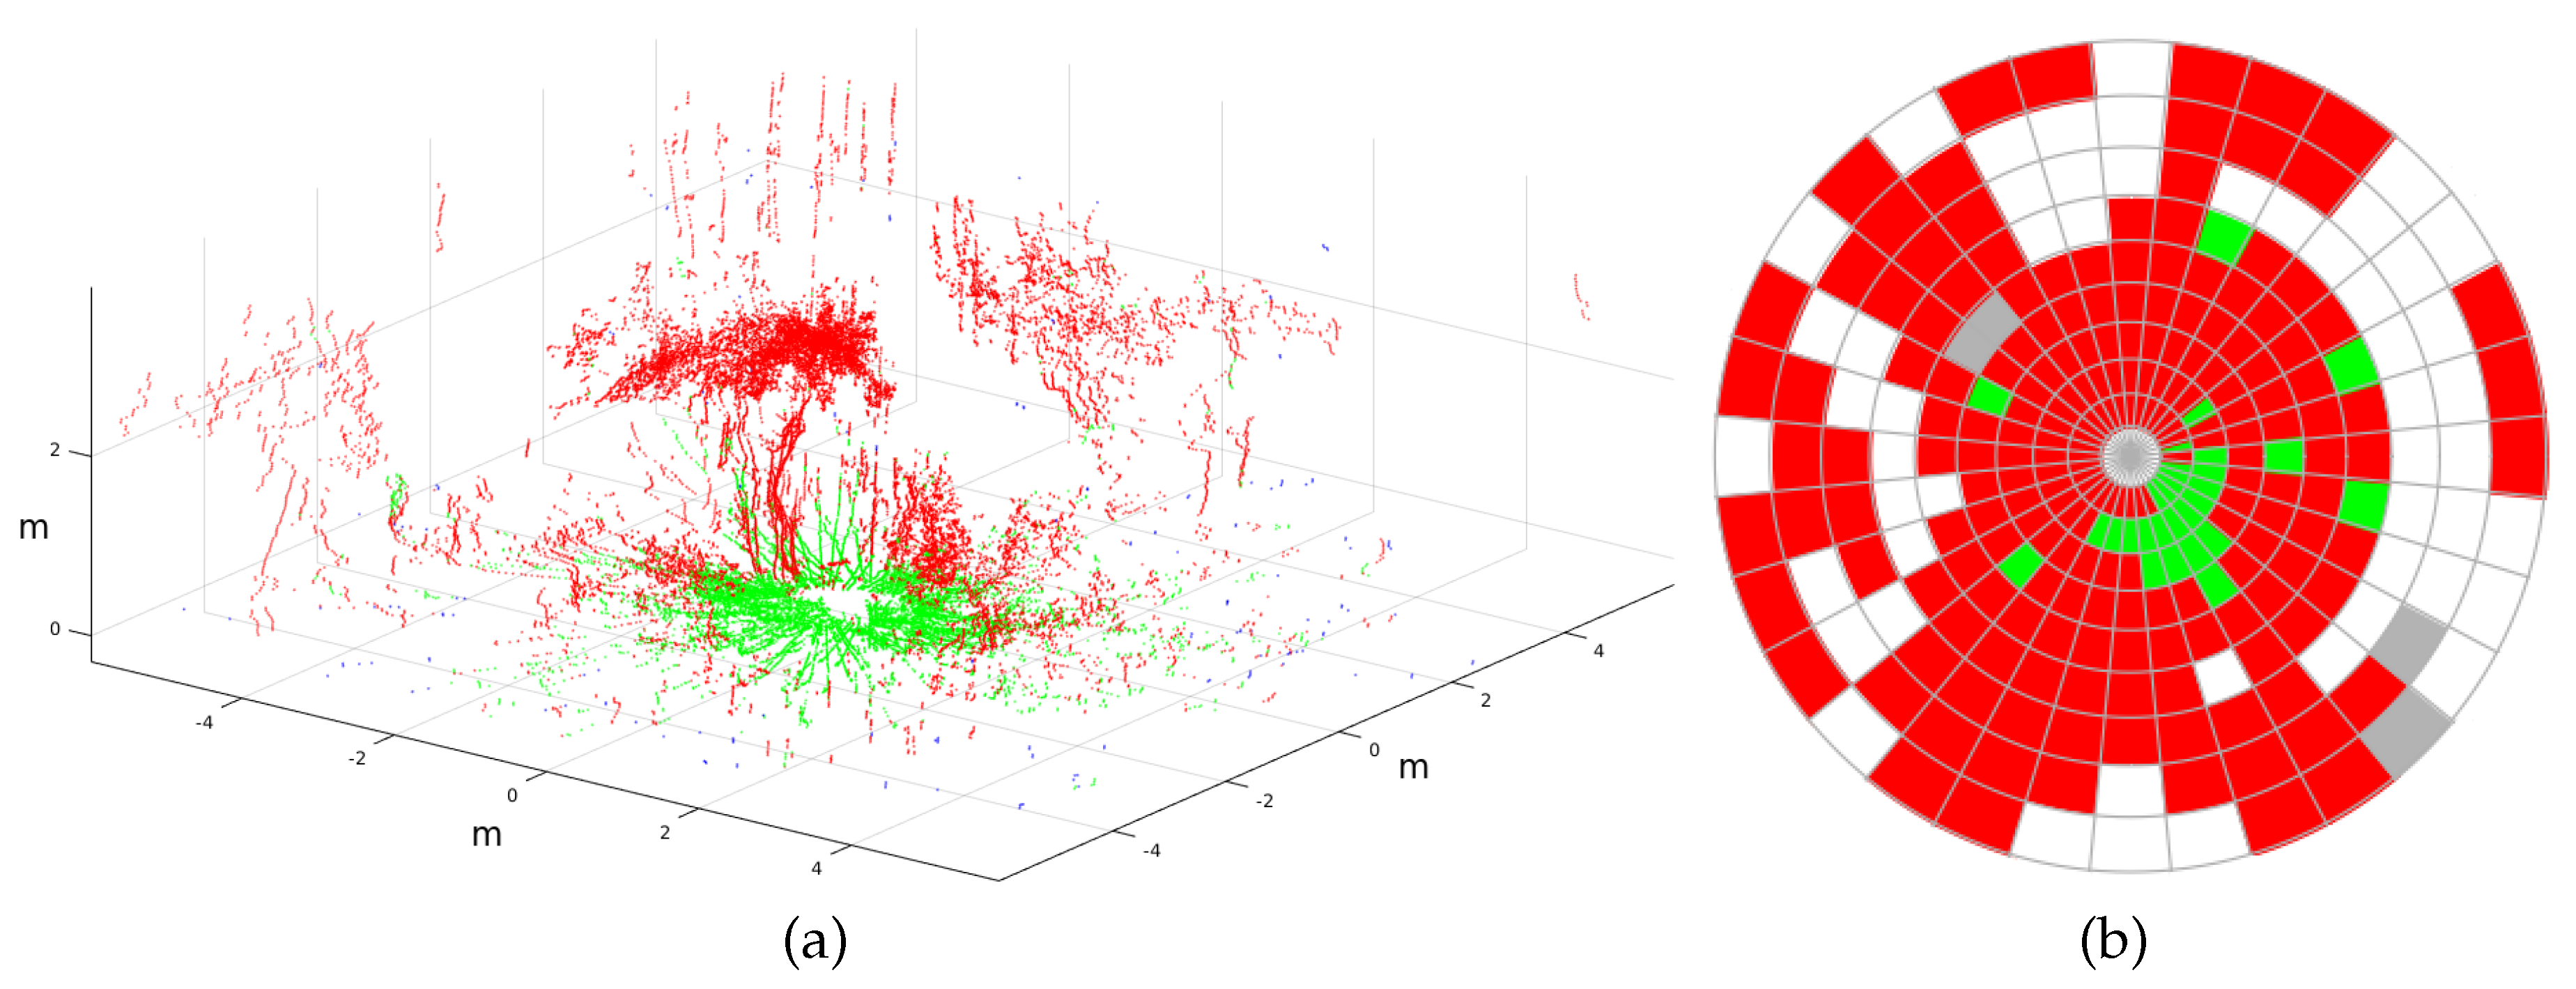
- If the cell does not contain any point at all, it is labelled as empty in white.
- With at least 15% of nontraversable points, the cell is classified as nontraversable in red.
- With more than 85% of traversable points, the cell is labelled as traversable in green.
- In any other case, the cell is classified as indefinite in grey.
5. Simulated Experiments
6. Andabata Experiments
6.1. Trail in a Hollow
6.2. Park Course
6.3. Discussion
7. Conclusions
Author Contributions
Funding
Conflicts of Interest
Abbreviations
| 2D | Two-dimensional |
| 2.5D | Two-and-a-half-dimensional |
| 3D | Three-dimensional |
| GPS | Global positioning system |
| ICR | Instantaneous center of rotation |
| ODE | Open dynamics engine |
| RAM | Random access memory |
| ROS | Robot operating system |
| SLAM | Simultaneous localisation and mapping |
| USB | Universal serial bus |
References
- Patle, B.K.; Babu-L, G.; Pandey, A.; Parhi, D.R.K.; Jagadeesh, A. A review: On path planning strategies for navigation of mobile robot. Defense Tech. 2019, 15, 582–606. [Google Scholar] [CrossRef]
- Bagnell, J.A.; Bradley, D.; Silver, D.; Sofman, B.; Stentz, A. Learning for autonomous navigation. IEEE Robot. Autom. Mag. 2010, 17, 74–84. [Google Scholar] [CrossRef]
- Larson, J.; Trivedi, M.; Bruch, M. Off-road terrain traversability analysis and hazard avoidance for UGVs. In Proceedings of the IEEE Intelligent Vehicles Symposium, Washington, DC, USA, 5–7 October 2011. [Google Scholar]
- Chen, L.; Yang, J.; Kong, H. Lidar-histogram for fast road and obstacle detection. In Proceedings of the IEEE International Conference on Robotics and Automation, Marina Bay Sands, Singapore, 29 May–3 June 2017; pp. 1343–1348. [Google Scholar]
- Papadakis, P. Terrain traversability analysis methods for unmanned ground vehicles: A survey. Eng. Appl. Artif. Intell. 2013, 26, 1373–1385. [Google Scholar] [CrossRef]
- Biesiadecki, J.J.; Leger, P.C.; Maimone, M.W. Tradeoffs Between Directed and Autonomous Driving on the Mars Exploration Rovers. Int. J. Robot. Res. 2007, 26, 91–104. [Google Scholar] [CrossRef]
- Pan, Y.; Xu, X.; Wang, Y.; Ding, X.; Xiong, R. GPU accelerated real-time traversability mapping. In Proceedings of the IEEE International Conference on Robotics and Biomimetics, Dali, China, 6–8 December 2019; pp. 734–740. [Google Scholar]
- Suger, B.; Steder, B.; Burgard, W. Traversability analysis for mobile robots in outdoor environments: A semi-supervised learning approach based on 3D-Lidar data. In Proceedings of the IEEE International Conference on Robotics and Automation (ICRA), Seattle, WA, USA, 26–30 May 2015; pp. 3941–3946. [Google Scholar]
- Bellone, M.; Reina, G.; Giannoccaro, N.; Spedicato, L. 3D traversability awareness for rough terrain mobile robots. Sens. Rev. 2014, 34, 220–232. [Google Scholar]
- Reddy, S.K.; Pal, P.K. Computing an unevenness field from 3D laser range data to obtain traversable region around a mobile robot. Robot. Auton. Syst. 2016, 84, 48–63. [Google Scholar] [CrossRef]
- Ahtiainen, J.; Stoyanov, T.; Saarinen, J. Normal Distributions Transform Traversability Maps: LIDAR-Only Approach for Traversability Mapping in Outdoor Environments. J. Field Robot. 2017, 34, 600–621. [Google Scholar] [CrossRef]
- Bellone, M.; Reina, G.; Caltagirone, L.; Wahde, M. Learning traversability from point clouds in challenging scenarios. IEEE Trans. Intell. Transp. Syst. 2018, 19, 296–305. [Google Scholar] [CrossRef]
- Chavez-Garcia, R.O.; Guzzi, J.; Gambardella, L.M.; Giusti, A. Learning ground traversability from simulations. IEEE Robot. Autom. Lett. 2018, 3, 1695–1702. [Google Scholar] [CrossRef]
- Martínez, J.L.; Morán, M.; Morales, J.; Robles, A.; Sánchez, M. Supervised learning of natural-terrain traversability with synthetic 3D laser scans. Appl. Sci. 2020, 10, 1140. [Google Scholar] [CrossRef]
- Krusi, P.; Furgale, P.; Bosse, M.; Siegwart, R. Driving on point clouds: Motion planning, trajectory optimization, and terrain assessment in generic nonplanar environments. J. Field Robot. 2017, 34, 940–984. [Google Scholar] [CrossRef]
- Santamaria-Navarro, A.; Teniente, E.; Morta, M.; Andrade-Cetto, J. Terrain classification in complex three-dimensional outdoor environments. J. Field Robot. 2015, 32, 42–60. [Google Scholar] [CrossRef]
- Ye, C.; Borenstein, J. T-transformation: Traversability Analysis for Navigation on Rugged Terrain. In Proceedings of the Defense and Security Symposium, Orlando, FL, USA, 2 September 2004; pp. 473–483. [Google Scholar]
- Thrun, S.; Montemerlo, M.; Aron, A. Probabilistic Terrain Analysis For High-Speed Desert Driving. In Proceedings of the Robotics: Science and Systems II, Philadelphia, PA, USA, 16–19 August 2006; pp. 1–7. [Google Scholar]
- Pang, C.; Zhong, X.; Hu, H.; Tian, J.; Peng, X.; Zeng, J. Adaptive Obstacle Detection for Mobile Robots in Urban Environments Using Downward-Looking 2D LiDAR. Sensors 2018, 18, 1749. [Google Scholar] [CrossRef]
- Zhang, K.; Yang, Y.; Fu, M.; Wang, M. Traversability assessment and trajectory planning of unmanned ground vehicles with suspension systems on rough terrain. Sensors 2019, 19, 4372. [Google Scholar] [CrossRef]
- Martínez, J.L.; Mandow, A.; Reina, A.J.; Cantador, T.J.; Morales, J.; García-Cerezo, A. Navigability analysis of natural terrains with fuzzy elevation maps from ground-based 3D range scans. In Proceedings of the IEEE/RSJ International Conference on Intelligent Robots and Systems (IROS), Tokyo, Japan, 3–7 November 2013; pp. 1576–1581. [Google Scholar]
- Almqvist, H.; Magnusson, M.; Lilienthal, A. Improving point cloud accuracy obtained from a moving platform for consistent pile attack pose estimation. J. Intell. Robot. Syst. Theory Appl. 2014, 75, 101–128. [Google Scholar] [CrossRef]
- Droeschel, D.; Schwarz, M.; Behnke, S. Continuous mapping and localization for autonomous navigation in rough terrain using a 3D laser scanner. Robot. Auton. Syst. 2017, 88, 104–115. [Google Scholar] [CrossRef]
- Yi, Y.; Mengyin, F.; Xin, Y.; Guangming, X.; Gong, J.W. Autonomous Ground Vehicle Navigation Method in Complex Environment. In Proceedings of the IEEE Intelligent Vehicles Symposium, San Diego, CA, USA, 21–24 June 2010; pp. 1060–1065. [Google Scholar]
- Martínez, J.L.; Morán, M.; Morales, J.; Reina, A.J.; Zafra, M. Field navigation using fuzzy elevation maps built with local 3D laser scans. Appl. Sci. 2018, 8, 397. [Google Scholar] [CrossRef]
- Pérez-Higueras, N.; Jardón, A.; Rodríguez, A.; Balaguer, C. 3D Exploration and Navigation with Optimal-RRT Planners for Ground Robots in Indoor Incidents. Sensors 2020, 20, 220. [Google Scholar] [CrossRef]
- Koenig, K.; Howard, A. Design and use paradigms for Gazebo, an open-source multi-robot simulator. In Proceedings of the IEEE-RSJ International Conference on Intelligent Robots and Systems (IROS), Sendai, Japan, 28 September–2 October 2004; pp. 2149–2154. [Google Scholar]
- Sebastian, B.; Ben-Tzvi, P. Physics Based Path Planning for Autonomous Tracked Vehicle in Challenging Terrain. J. Intell. Robot. Syst. 2019, 95, 511–526. [Google Scholar] [CrossRef]
- Schäfer, H.; Hach, A.; Proetzsch, M.; Berns, K. 3D Obstacle Detection and Avoidance in Vegetated Off-road Terrain. In Proceedings of the IEEE International Conference on Robotics and Automation (ICRA), Pasadena, CA, USA, 19–23 May 2008; pp. 923–928. [Google Scholar]
- Lacroix, S.; Mallet, A.; Bonnafous, D.; Bauzil, G.; Fleury, S.; Herrb, M.; Chatila, R. Autonomous rover navigation on unknown terrains: Functions and integration. Int. J. Robot. Res. 2002, 21, 917–942. [Google Scholar] [CrossRef]
- Rekleitis, I.; Bedwani, J.L.; Dupuis, E.; Lamarche, T.; Allard, P. Autonomous over-the-horizon navigation using LIDAR data. Auton. Rob. 2013, 34, 1–18. [Google Scholar] [CrossRef]
- Langer, D.; Rosenblatt, J.; Hebert, M. An Integrated System for Autonomous Off-Road Navigation. In Proceedings of the IEEE International Conference on Robotics and Automation (ICRA), San Diego, CA, USA, 8–13 May 1994; pp. 414–419. [Google Scholar]
- Howard, A.; Seraji, H.; Werger, B. Global and regional path planners for integrated planning and navigation. J. Field Robot. 2005, 22, 767–778. [Google Scholar] [CrossRef]
- Pfrunder, A.; Borges, P.V.K.; Romero, A.R.; Catt, G.; Elfes, A. Real-time autonomous ground vehicle navigation in heterogeneous environments using a 3D LiDAR. In Proceedings of the IEEE/RSJ International Conference on Intelligent Robots and Systems (IROS), Vancouver, BC, Canada, 24–28 September 2017; pp. 2601–2608. [Google Scholar]
- Rohmer, E.; Singh, S.P.N.; Freese, M. V-REP: A Versatile and Scalable Robot Simulation Framework. In Proceedings of the IEEE International Conference on Intelligent Robots and Systems (IROS), Tokyo, Japan, 3–7 November 2013; pp. 1321–1326. [Google Scholar]
- Quigley, M.; Gerkey, B.; Conley, K.; Faust, J.; Foote, T.; Leibs, J.; Berger, E.; Wheeler, R.; Ng, A. ROS: An open-source robot operating system. In Proceedings of the IEEE International Conference on Robotics and Automation: Workshop on Open Source Software (ICRA), Kobe, Japan, 12–17 May 2009; pp. 1–6. [Google Scholar]
- Pedregosa, F.; Varoquaux, G.; Gramfort, A.; Michel, V.; Thirion, B.; Grisel, O.; Blondel, M.; Prettenhofer, P.; Weiss, R.; Dubourg, V.; et al. Scikit-learn: Machine learning in Python. J. Mach. Learn. Res. 2011, 12, 2825–2830. [Google Scholar]
- Mandow, A.; Martínez, J.L.; Morales, J.; Blanco, J.L.; García-Cerezo, A.; González, J. Experimental kinematics for wheeled skid-steer mobile robots. In Proceedings of the IEEE/RSJ International Conference on Intelligent Robots and Systems (IROS), San Diego, CA, USA, 29 October–2 November 2007; pp. 1222–1227. [Google Scholar]
- Sánchez, M.; Martínez, J.L.; Morales, J.; Robles, A.; Morán, M. Automatic generation of labeled 3D point clouds of natural environments with Gazebo. In Proceedings of the IEEE International Conference on Mechatronics (ICM), Ilmenau, Germany, 18–20 March 2019; pp. 161–166. [Google Scholar]
- Martínez, J.L.; Morales, J.; Reina, A.J.; Mandow, A.; Pequeno-Boter, A.; García-Cerezo, A. Construction and calibration of a low-cost 3D laser scanner with 360 field of view for mobile robots. In Proceedings of the IEEE International Conference on Industrial Technology (ICIT), Seville, Spain, 17–19 March 2015; pp. 149–154. [Google Scholar]
- Rankin, A.; Bajracharya, M.; Huertas, A.; Howard, A.; Moghaddam, B.; Brennan, S.; Ansar, A.; Tang, B.; Turmon, M.; Matthies, L. Stereo-vision-based perception capabilities developed during the Robotics Collaborative Technology Alliances program. In Proceedings of the SPIE Defense, Security, and Sensing, Orlando, FL, USA, 7 May 2010; pp. 1–15. [Google Scholar]
- Reina, A.J.; Martínez, J.L.; Mandow, A.; Morales, J.; García-Cerezo, A. Collapsible Cubes: Removing Overhangs from 3D Point Clouds to Build Local Navigable Elevation Maps. In Proceedings of the IEEE/ASME International Conference on Advanced Intelligent Mechatronics (AIM), Besançon, France, 8–11 July 2014; pp. 1012–1017. [Google Scholar]
- Kober, J.; Bagnell, J.A.; Peters, J. Reinforcement learning in robotics: A survey. Int. J. Robot. Res. 2013, 32, 1238–1274. [Google Scholar] [CrossRef]





Publisher’s Note: MDPI stays neutral with regard to jurisdictional claims in published maps and institutional affiliations. |
© 2020 by the authors. Licensee MDPI, Basel, Switzerland. This article is an open access article distributed under the terms and conditions of the Creative Commons Attribution (CC BY) license (http://creativecommons.org/licenses/by/4.0/).
Share and Cite
Martínez, J.L.; Morales, J.; Sánchez, M.; Morán, M.; Reina, A.J.; Fernández-Lozano, J.J. Reactive Navigation on Natural Environments by Continuous Classification of Ground Traversability. Sensors 2020, 20, 6423. https://doi.org/10.3390/s20226423
Martínez JL, Morales J, Sánchez M, Morán M, Reina AJ, Fernández-Lozano JJ. Reactive Navigation on Natural Environments by Continuous Classification of Ground Traversability. Sensors. 2020; 20(22):6423. https://doi.org/10.3390/s20226423
Chicago/Turabian StyleMartínez, Jorge L., Jesús Morales, Manuel Sánchez, Mariano Morán, Antonio J. Reina, and J. Jesús Fernández-Lozano. 2020. "Reactive Navigation on Natural Environments by Continuous Classification of Ground Traversability" Sensors 20, no. 22: 6423. https://doi.org/10.3390/s20226423
APA StyleMartínez, J. L., Morales, J., Sánchez, M., Morán, M., Reina, A. J., & Fernández-Lozano, J. J. (2020). Reactive Navigation on Natural Environments by Continuous Classification of Ground Traversability. Sensors, 20(22), 6423. https://doi.org/10.3390/s20226423


