IRT and GPR Techniques for Moisture Detection and Characterisation in Buildings


Abstract
1. Introduction
1.1. Applications of IRT and GPR in Building Moisture Analysis
1.2. Benefits of IRT and GPR Applied to Building Inspection
1.3. Motivation
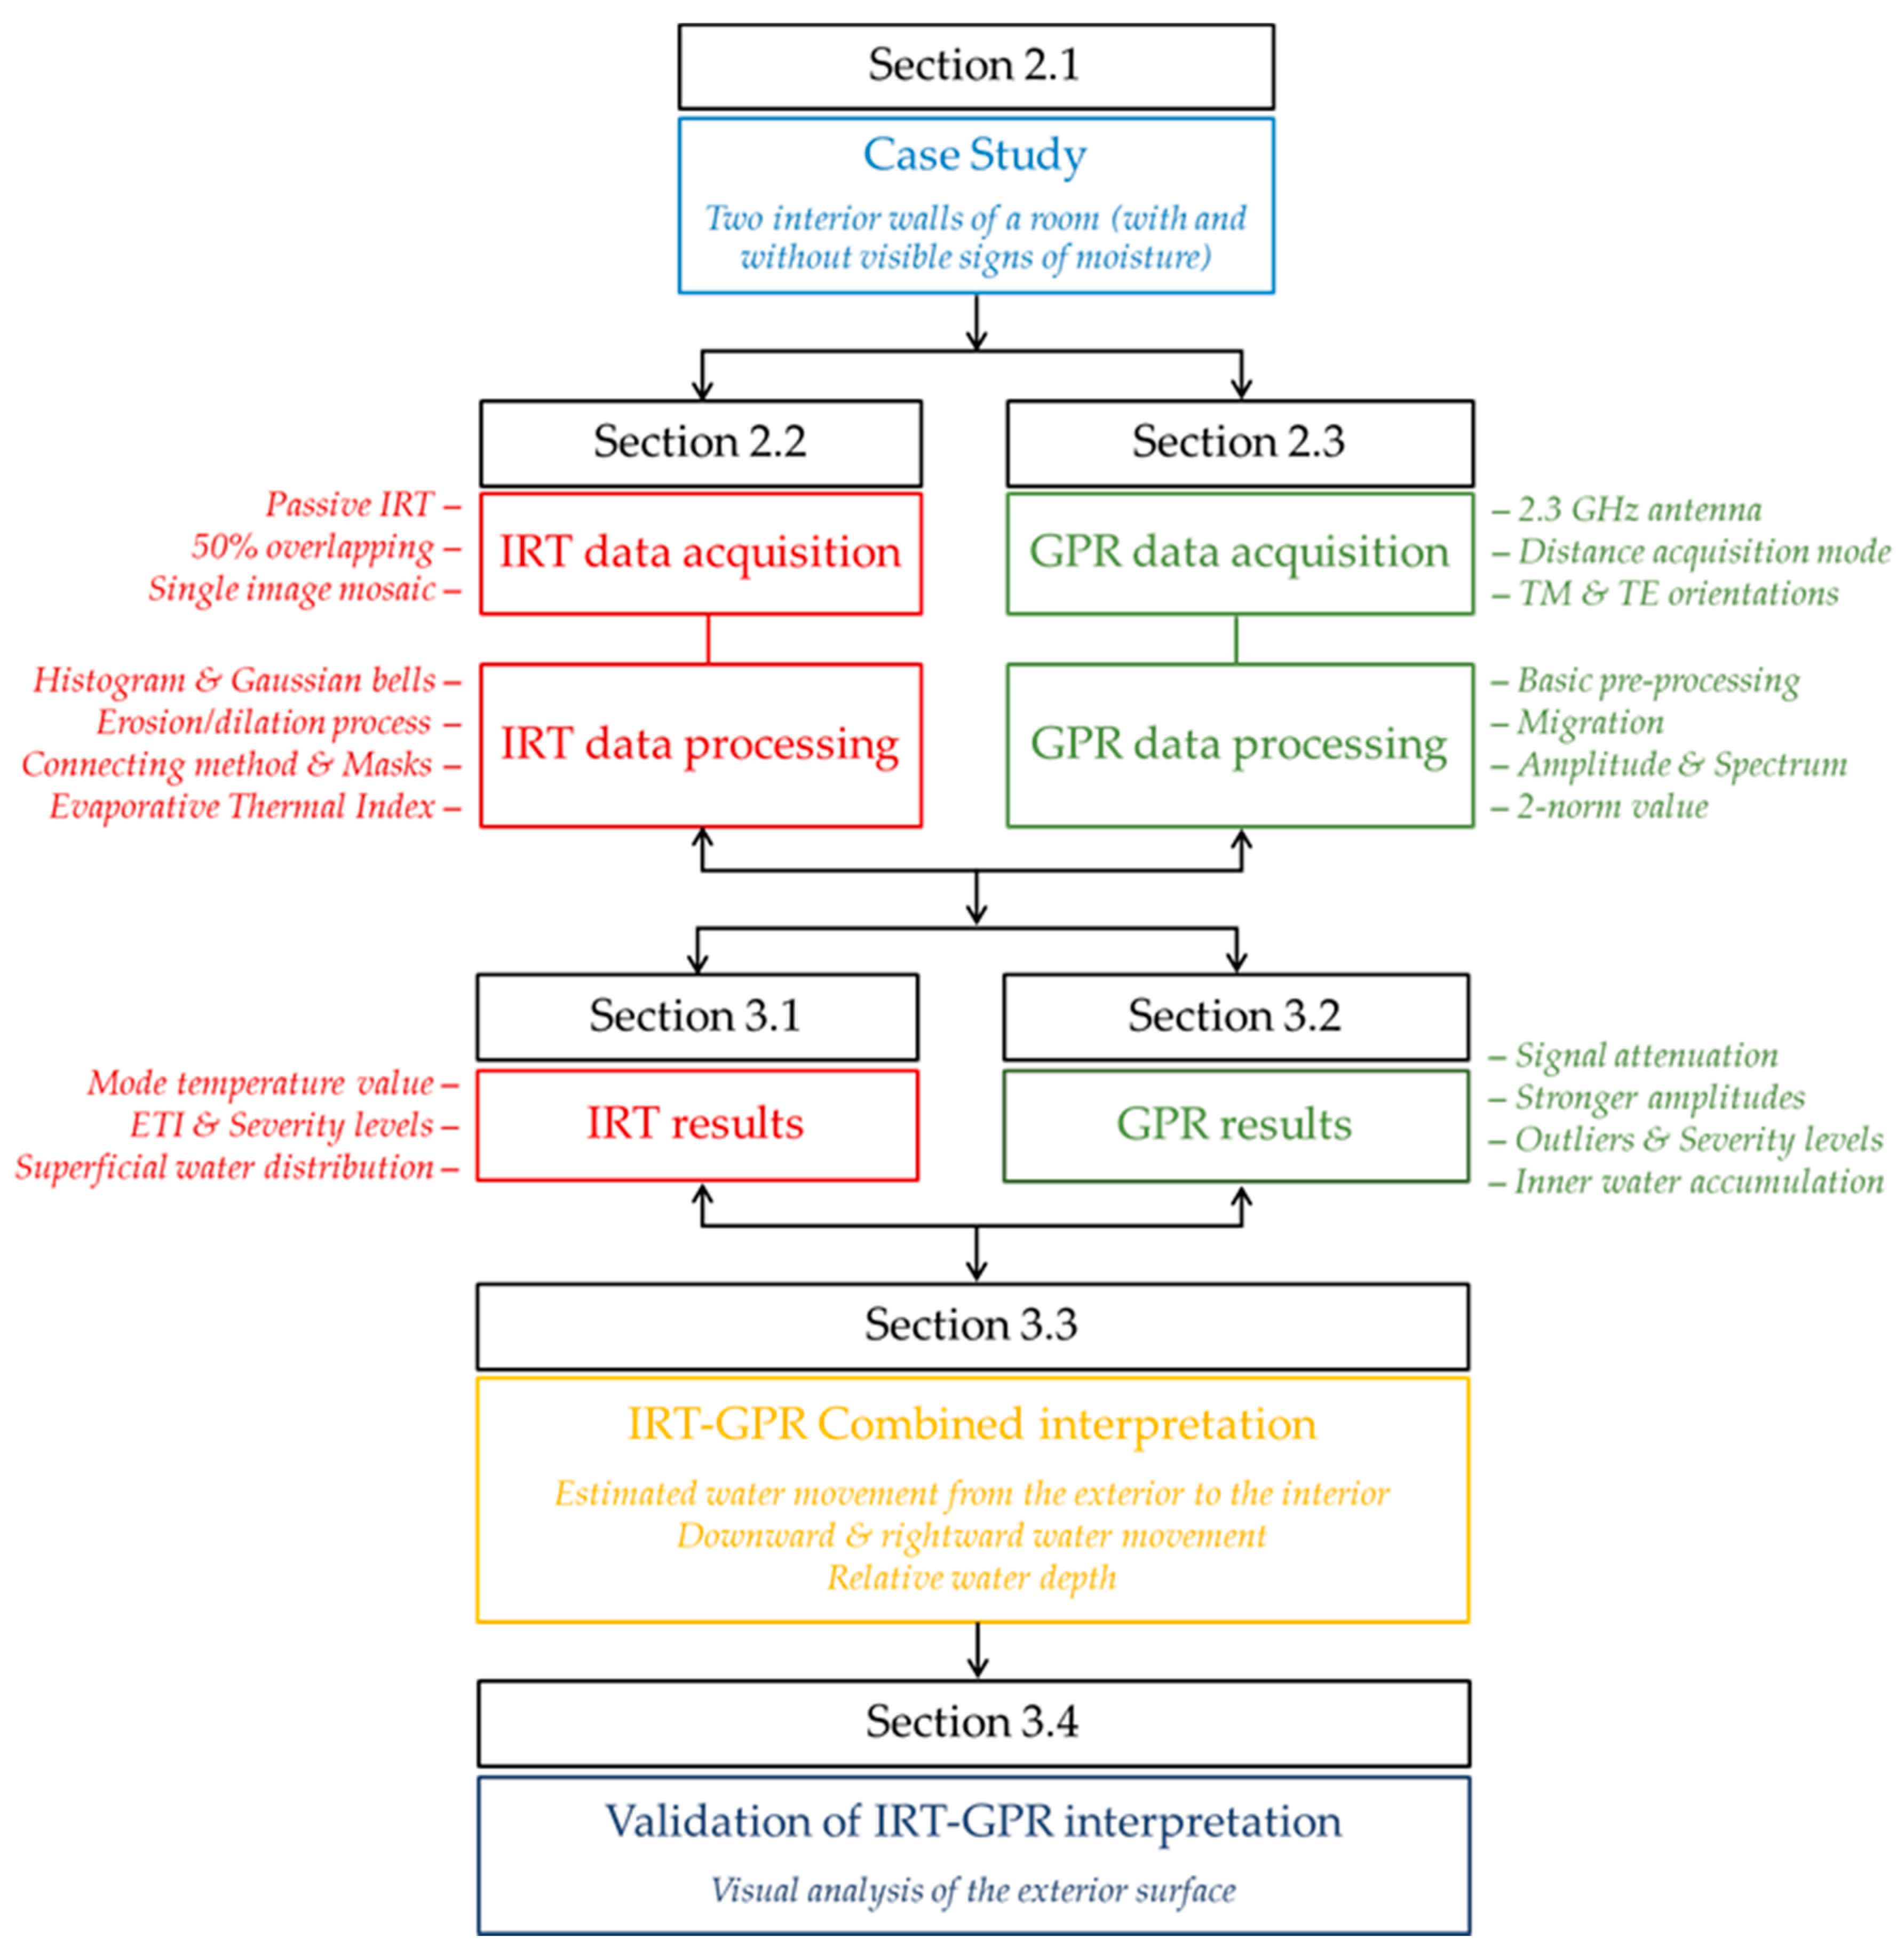
2. Materials and Methods
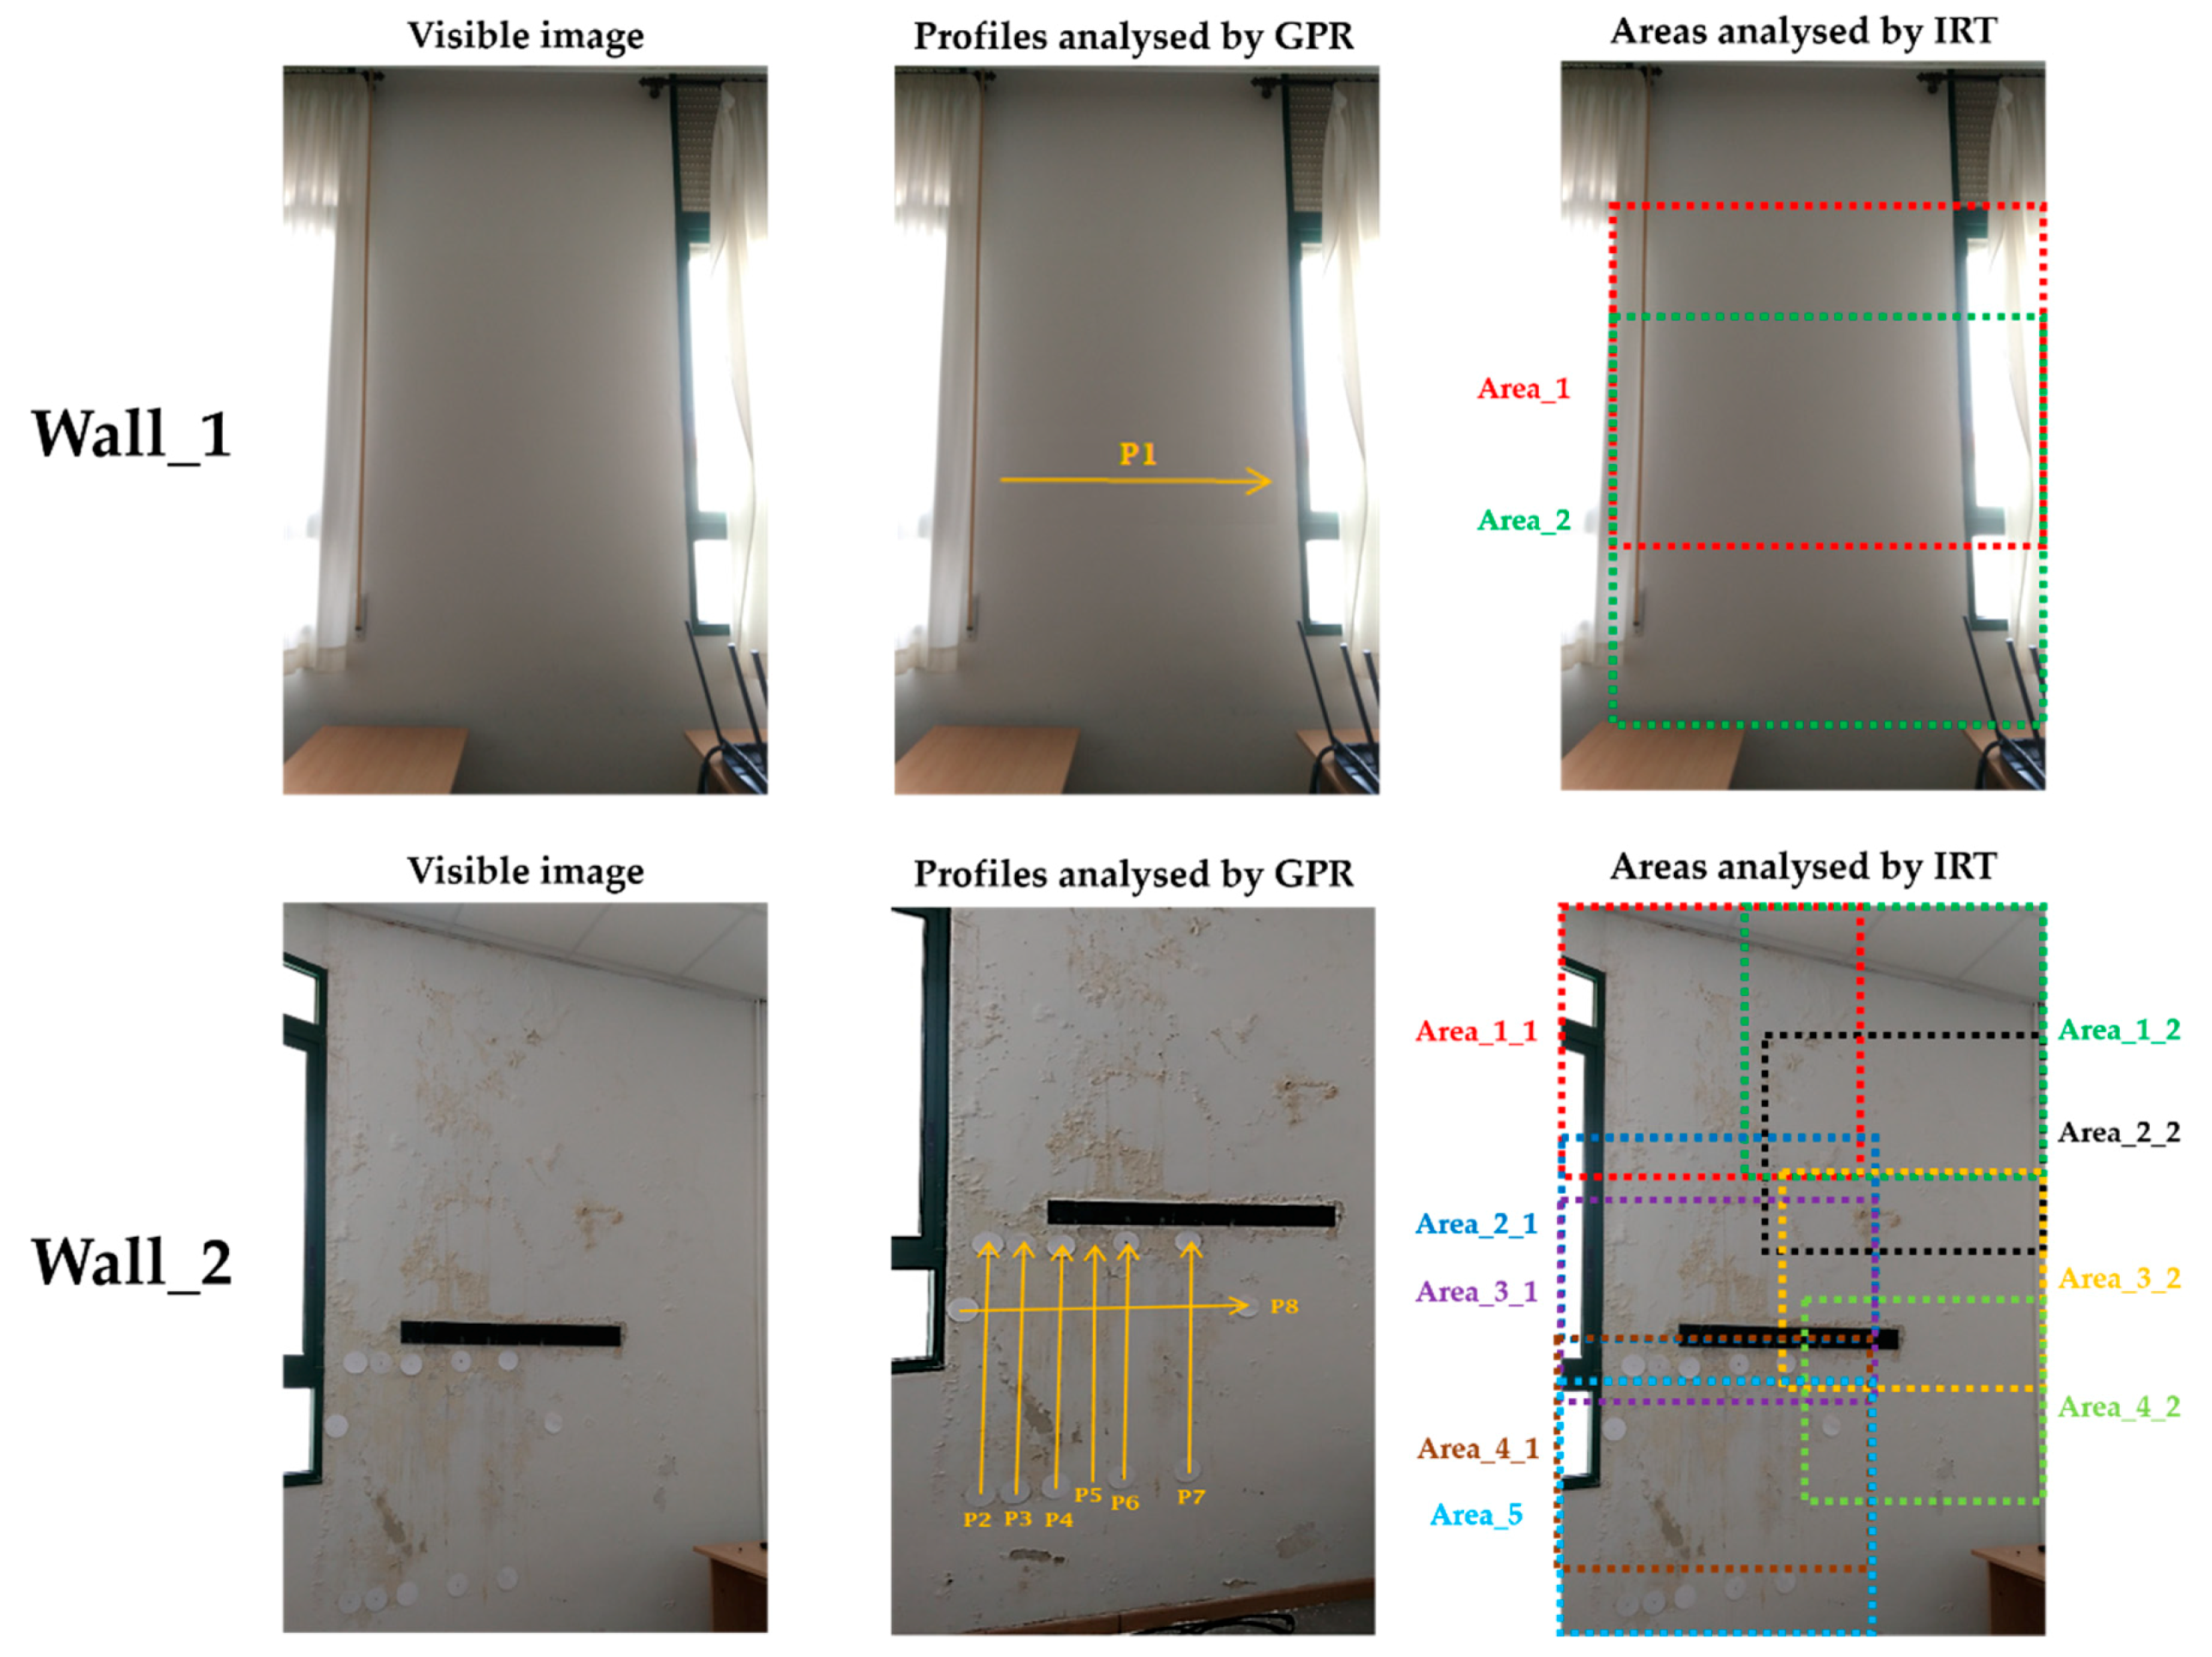
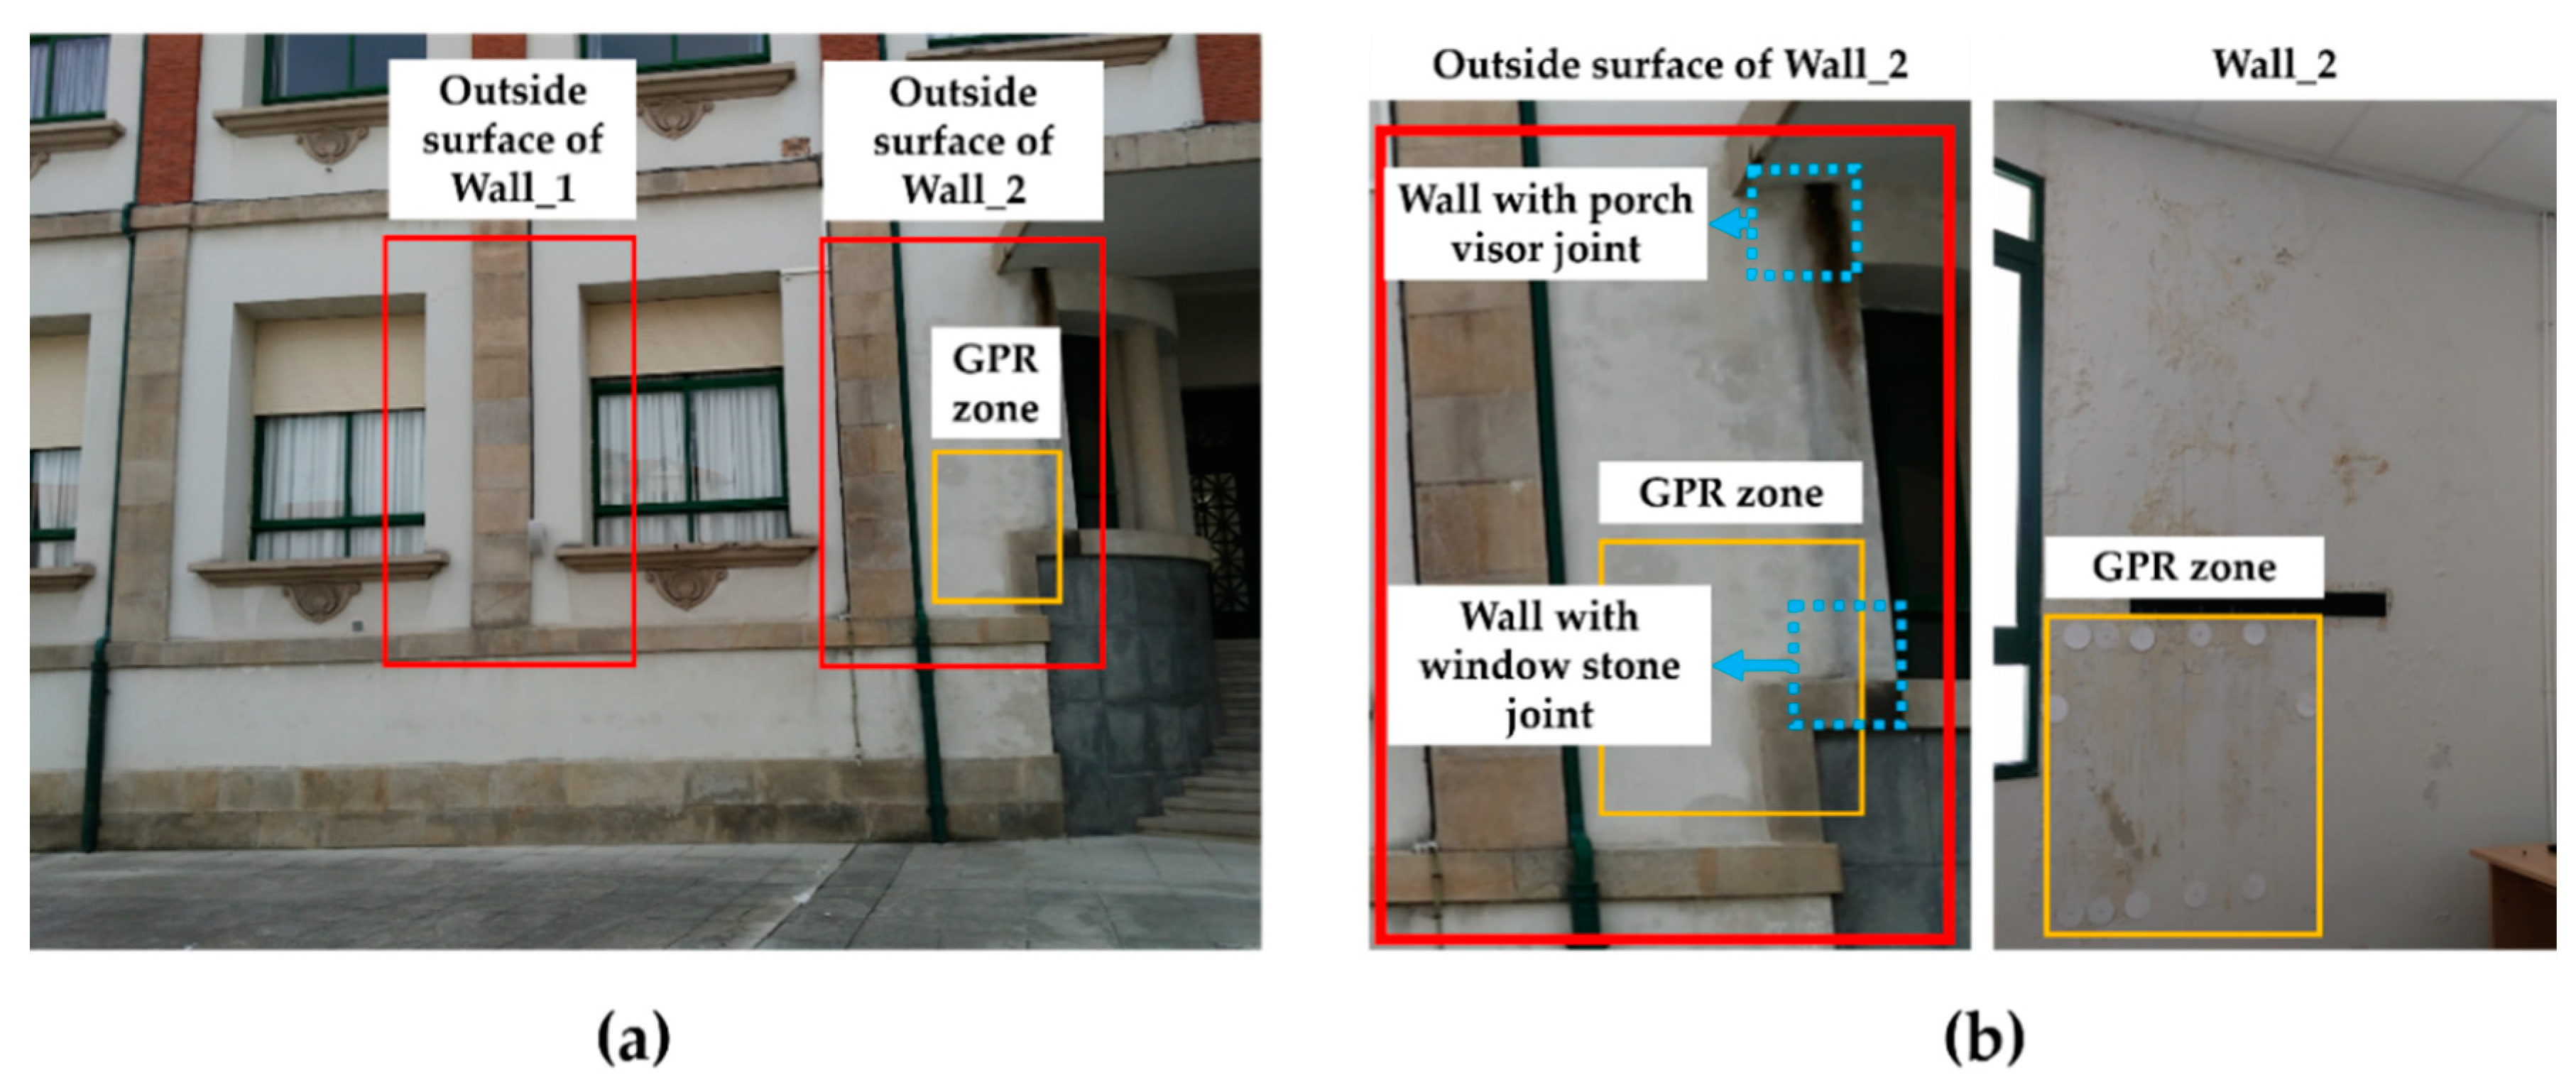
2.1. Case Study
2.2. IRT Data Acquisition and Processing
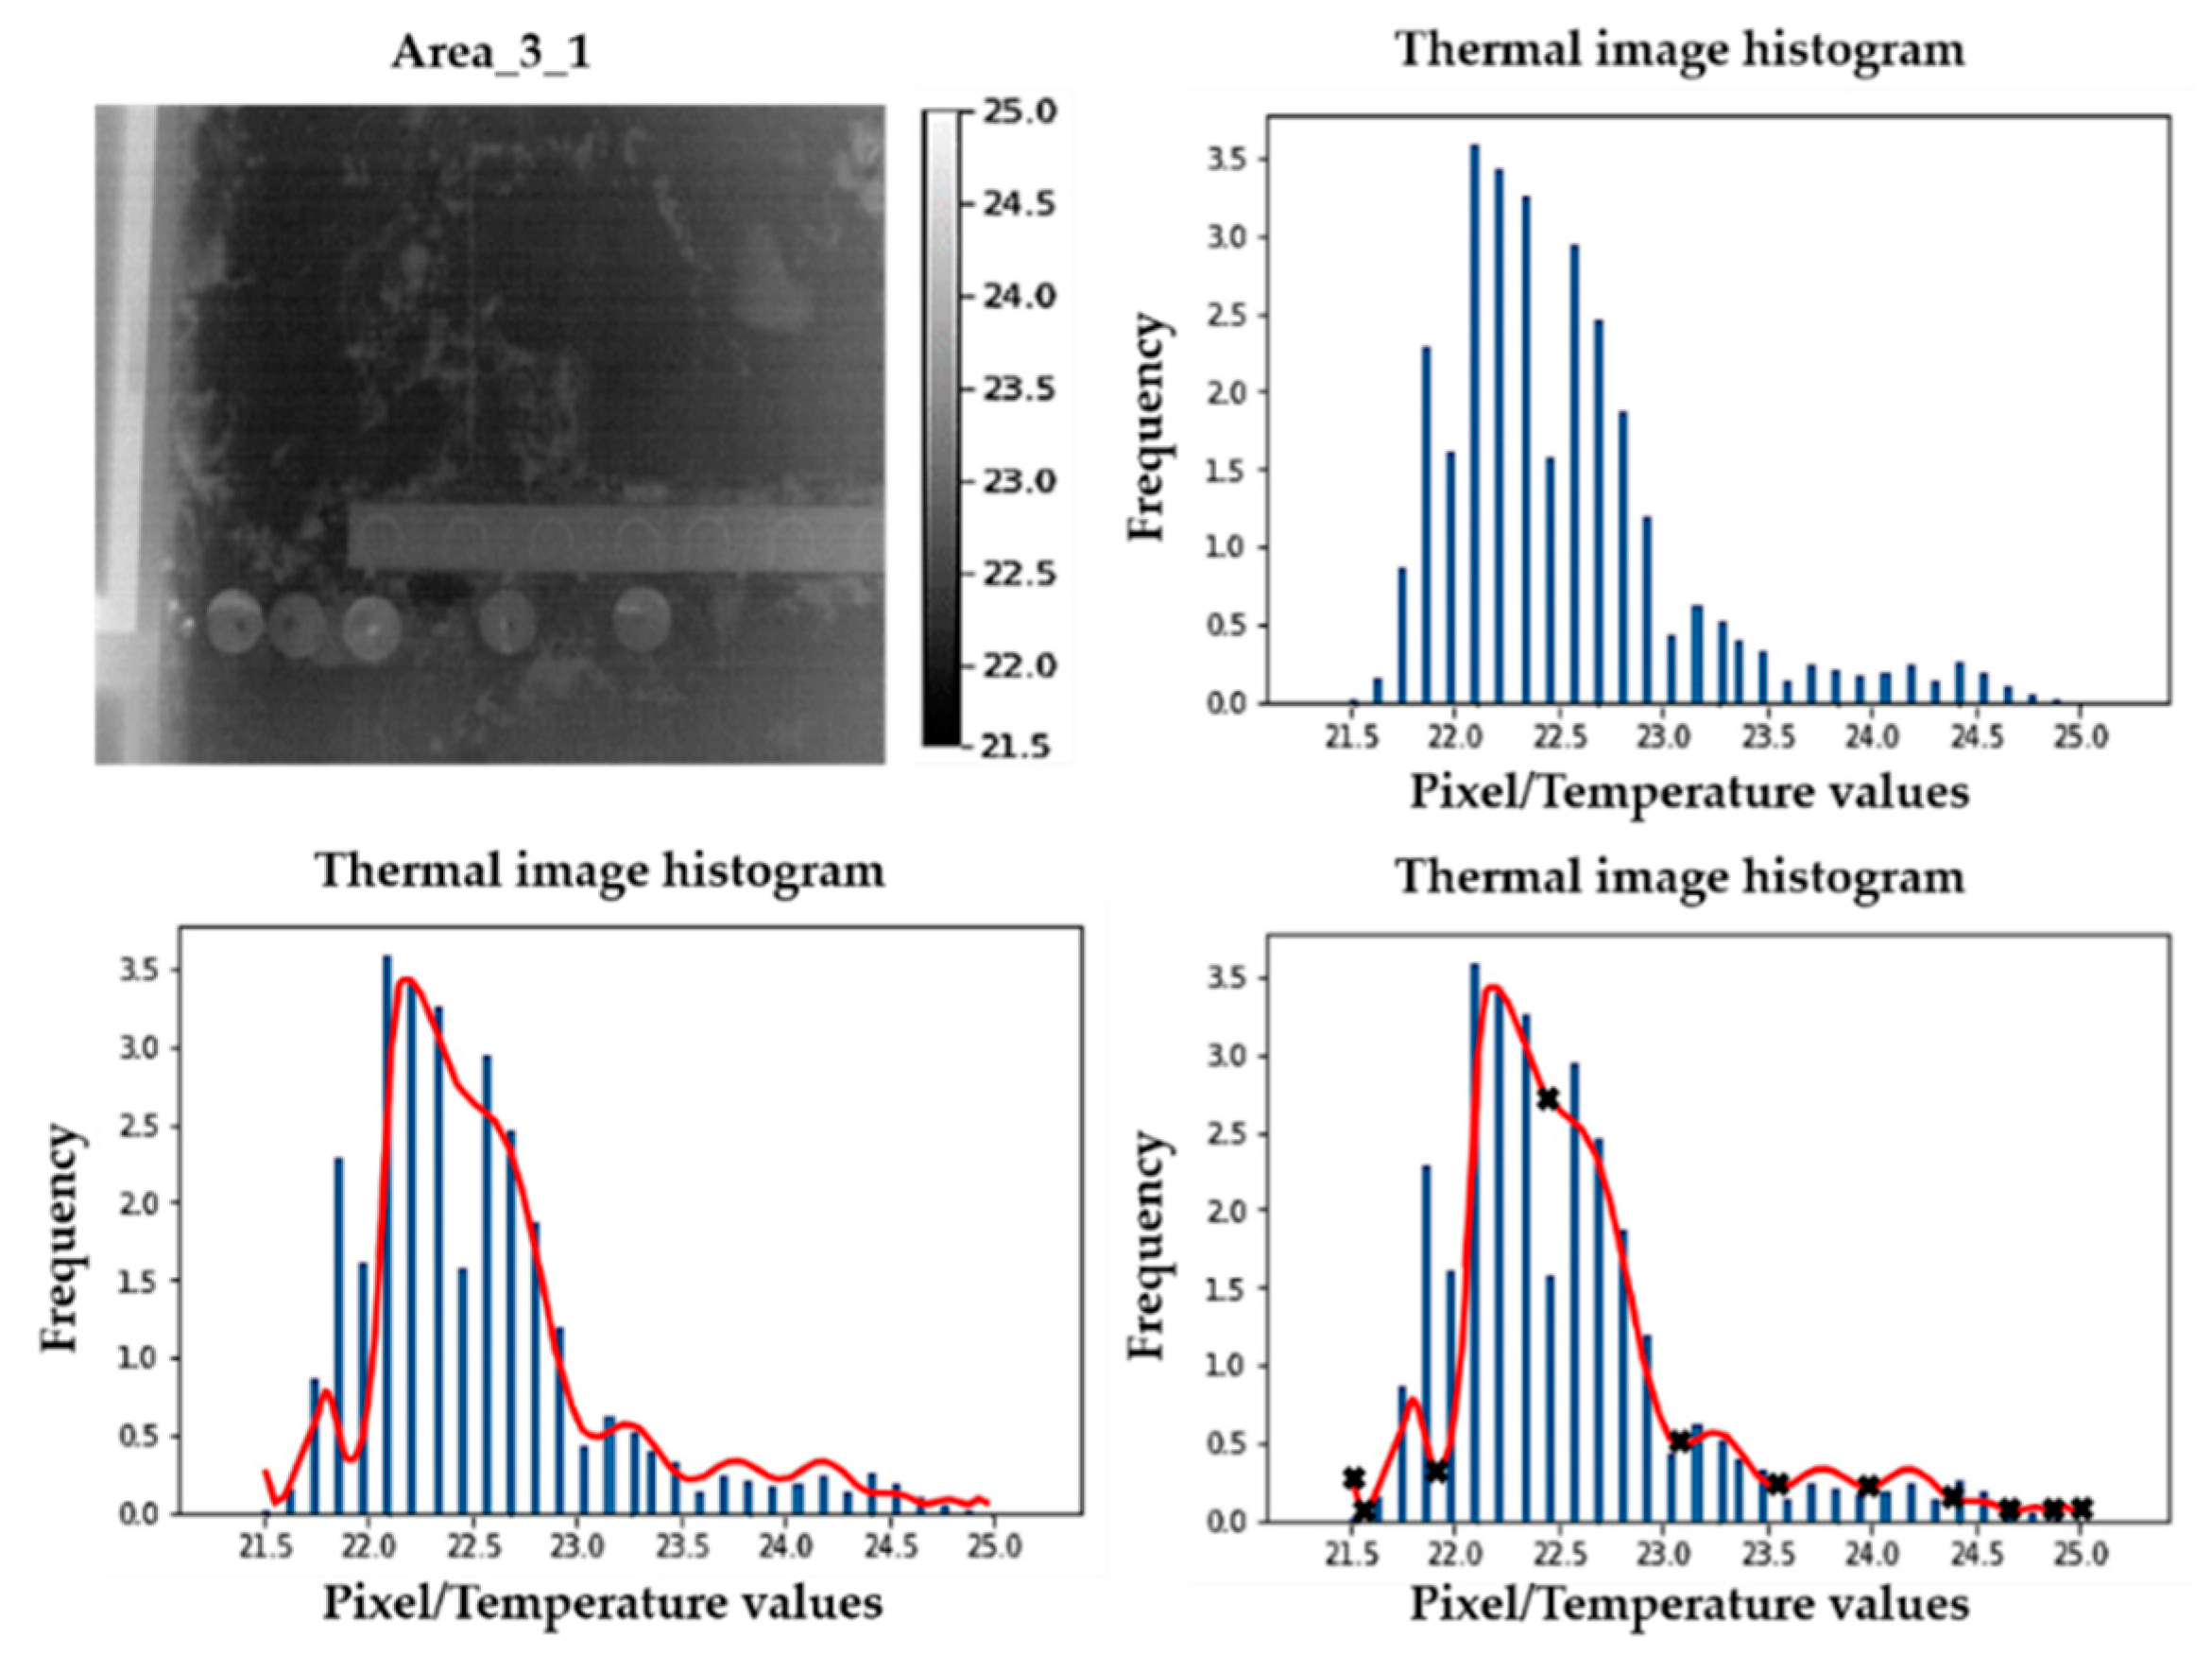
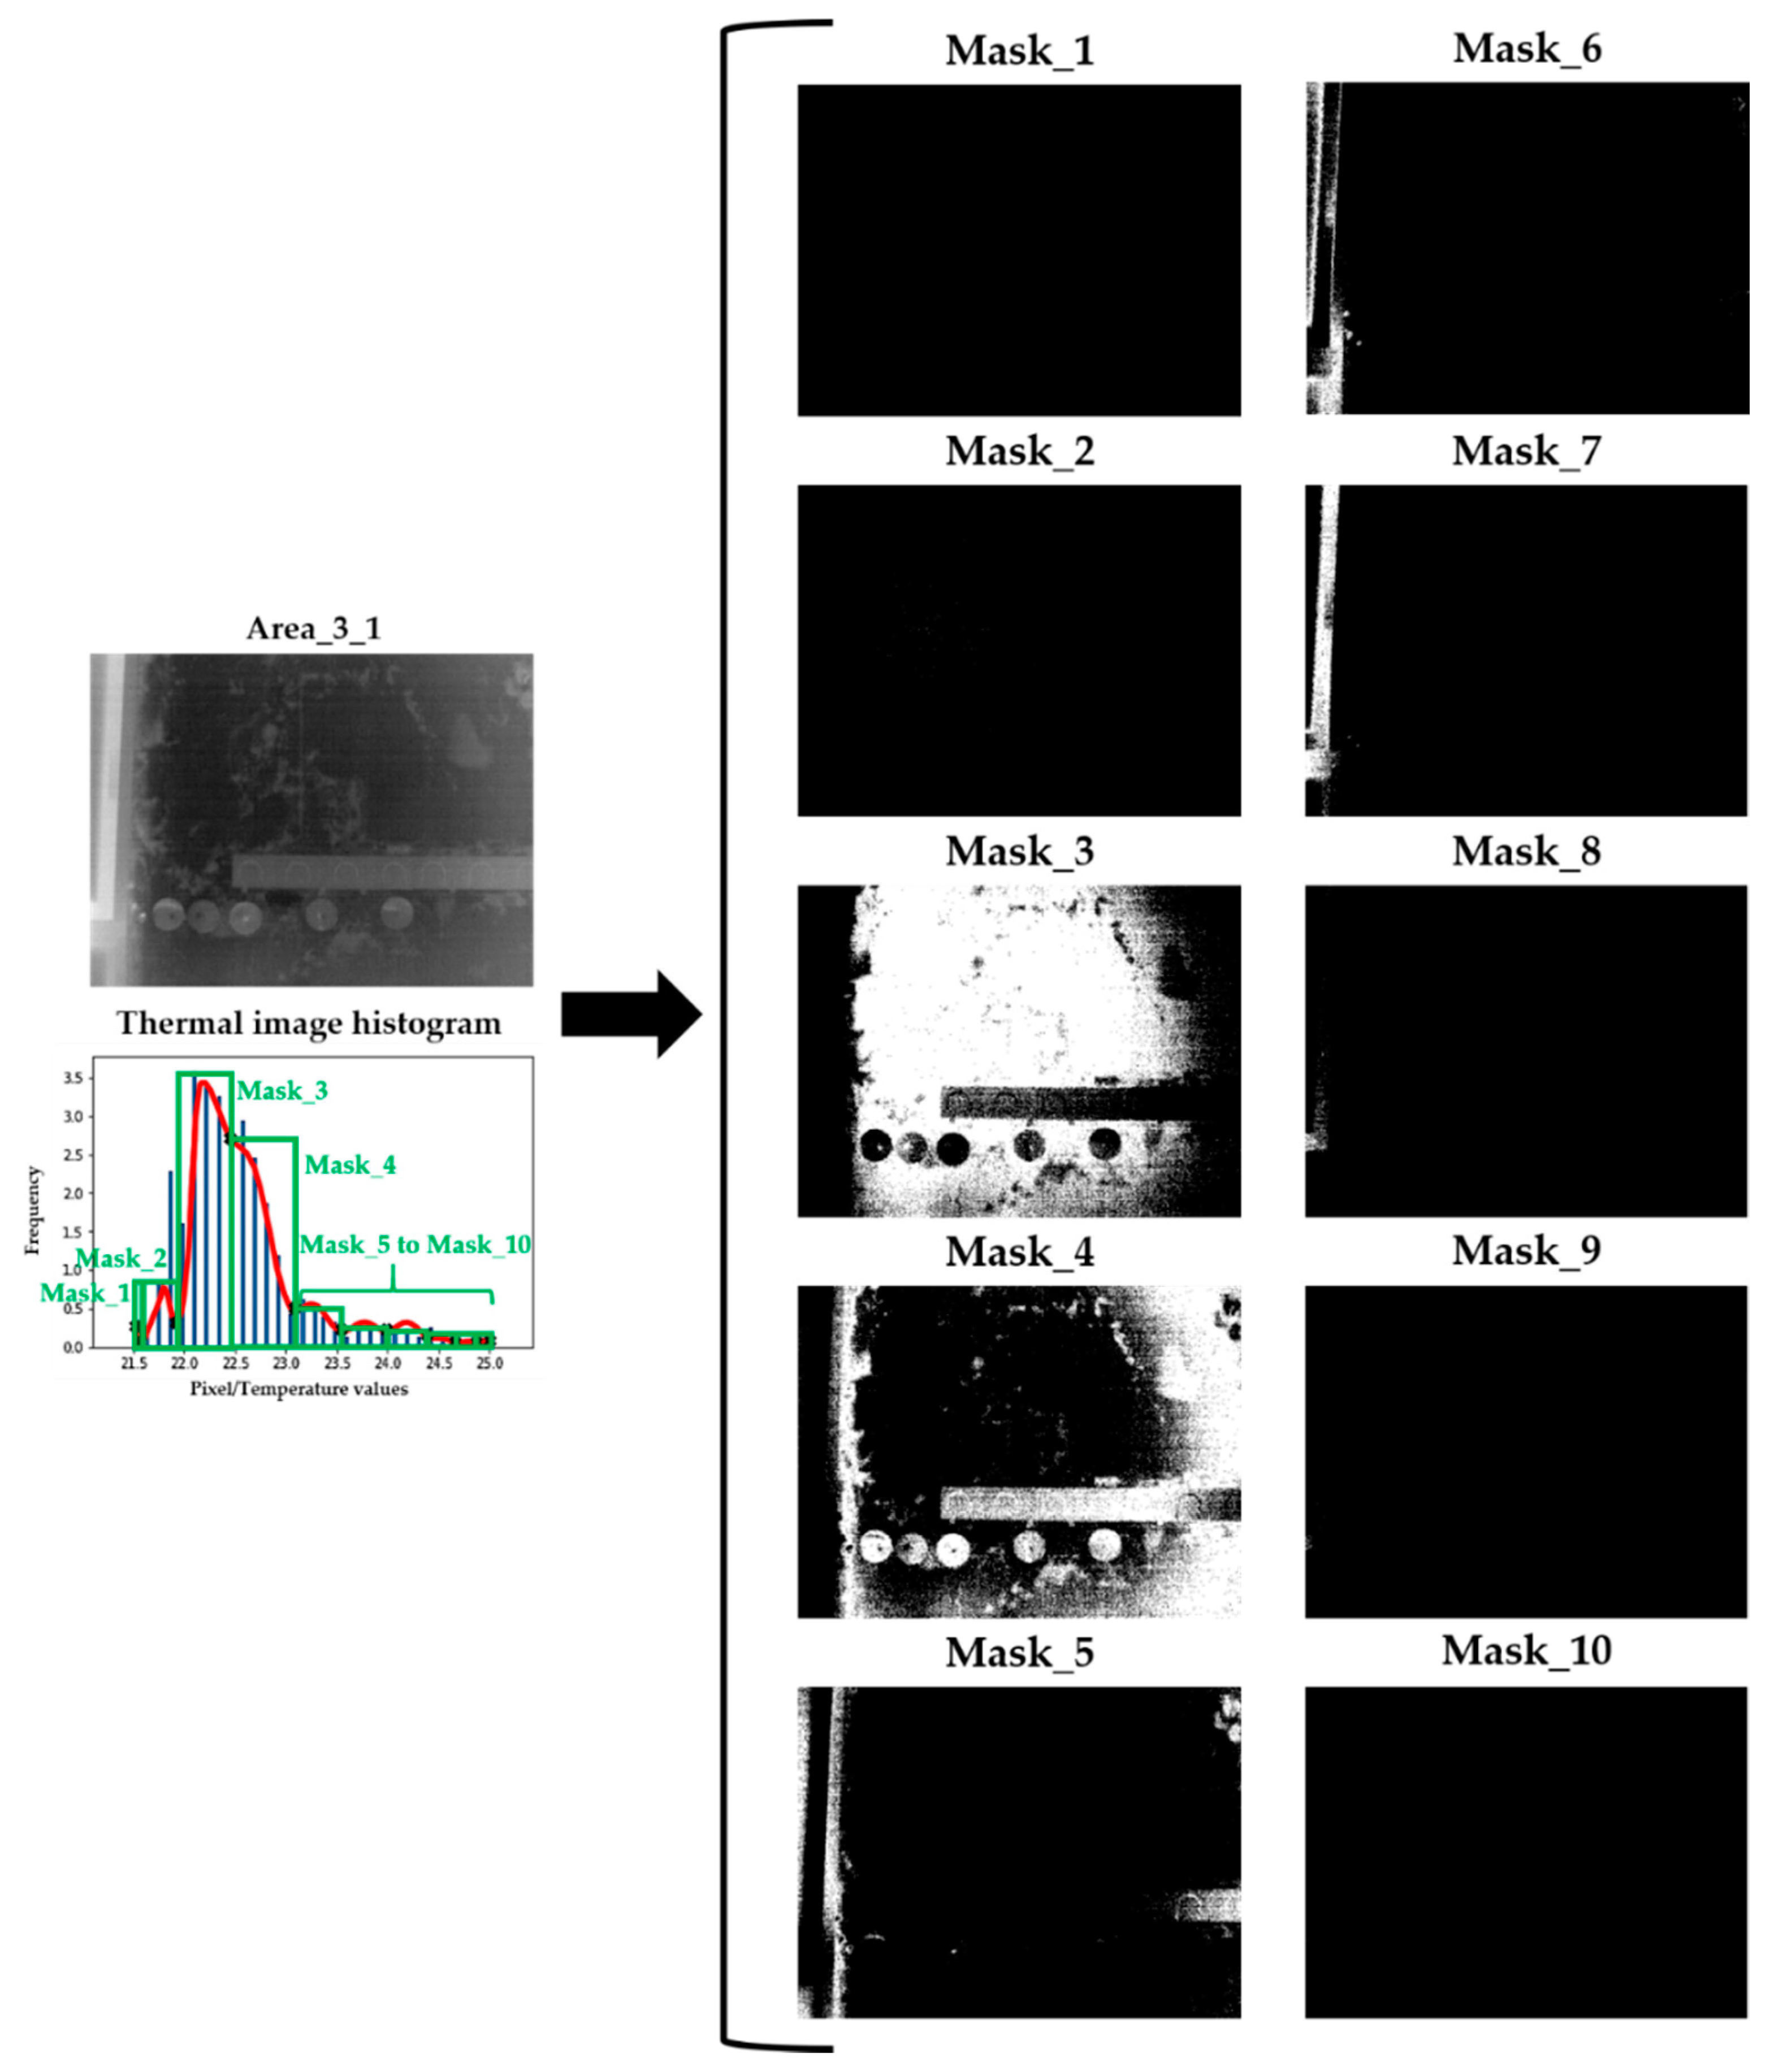
2.2.1. Step 1: Determination of Ends of Possible Gaussian Bells
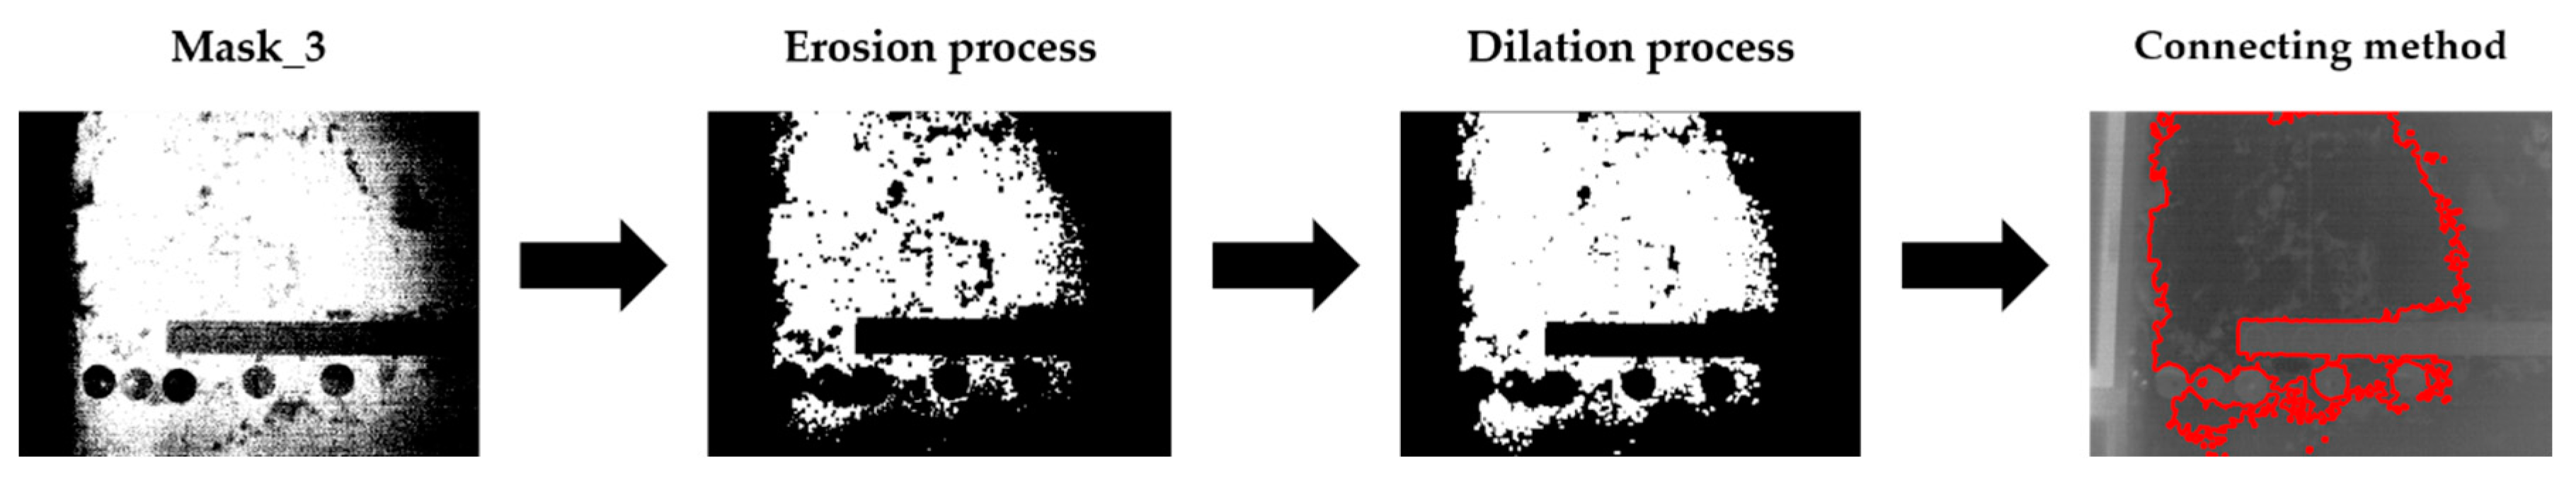
2.2.2. Step 2: Erosion/Dilation Process and Connecting Method Application
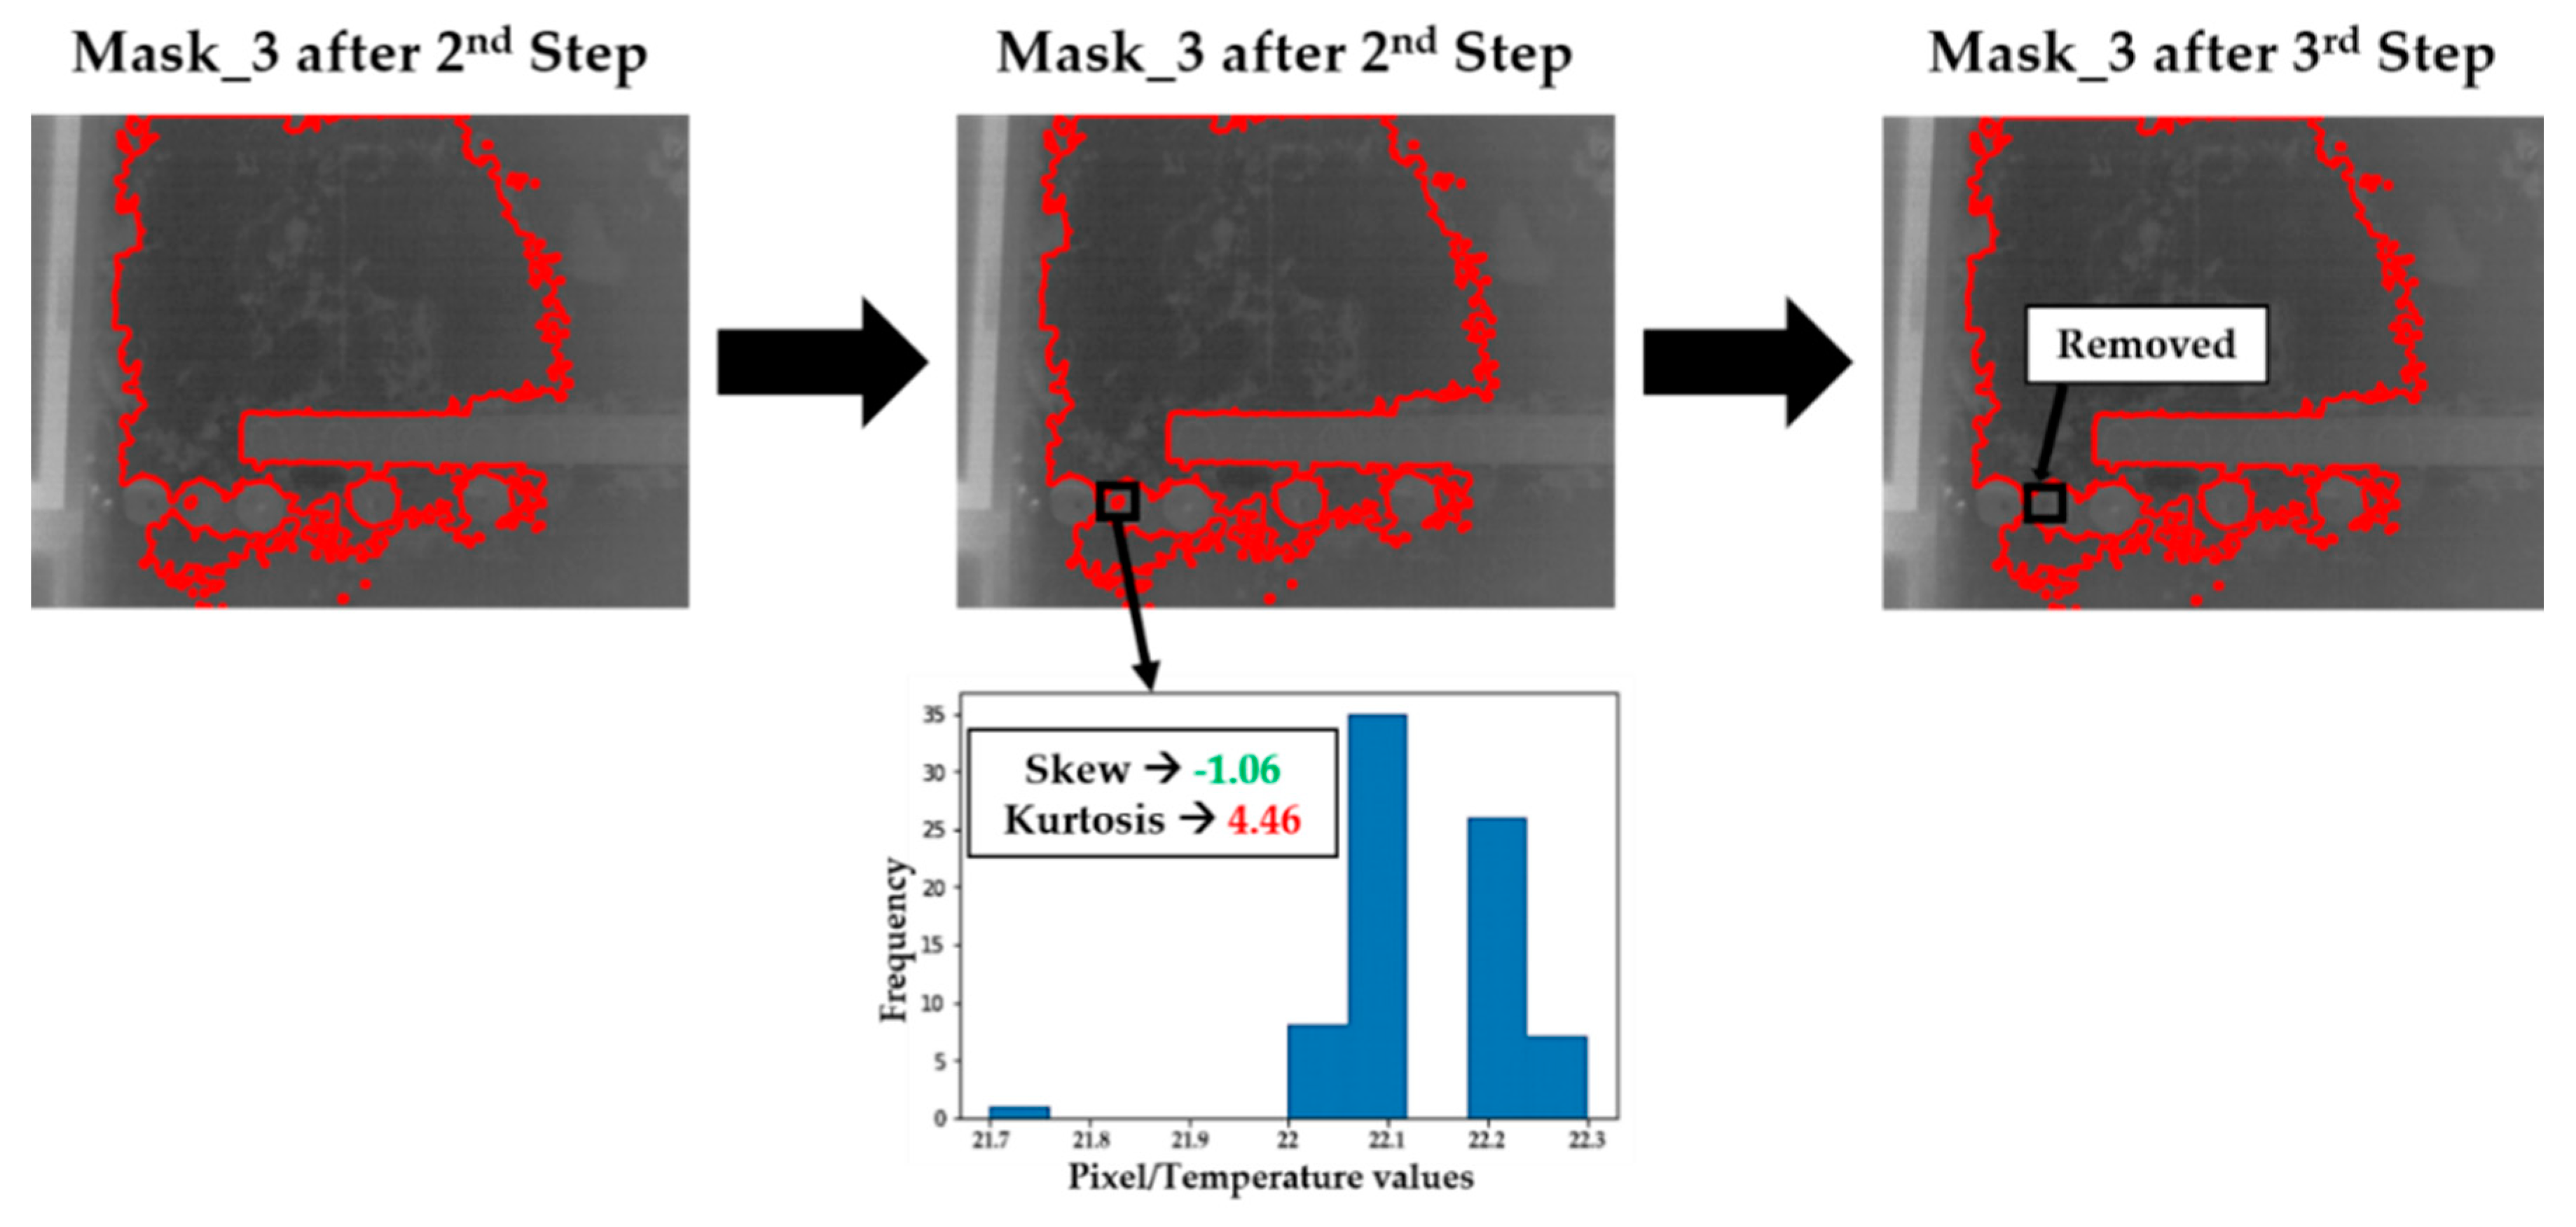
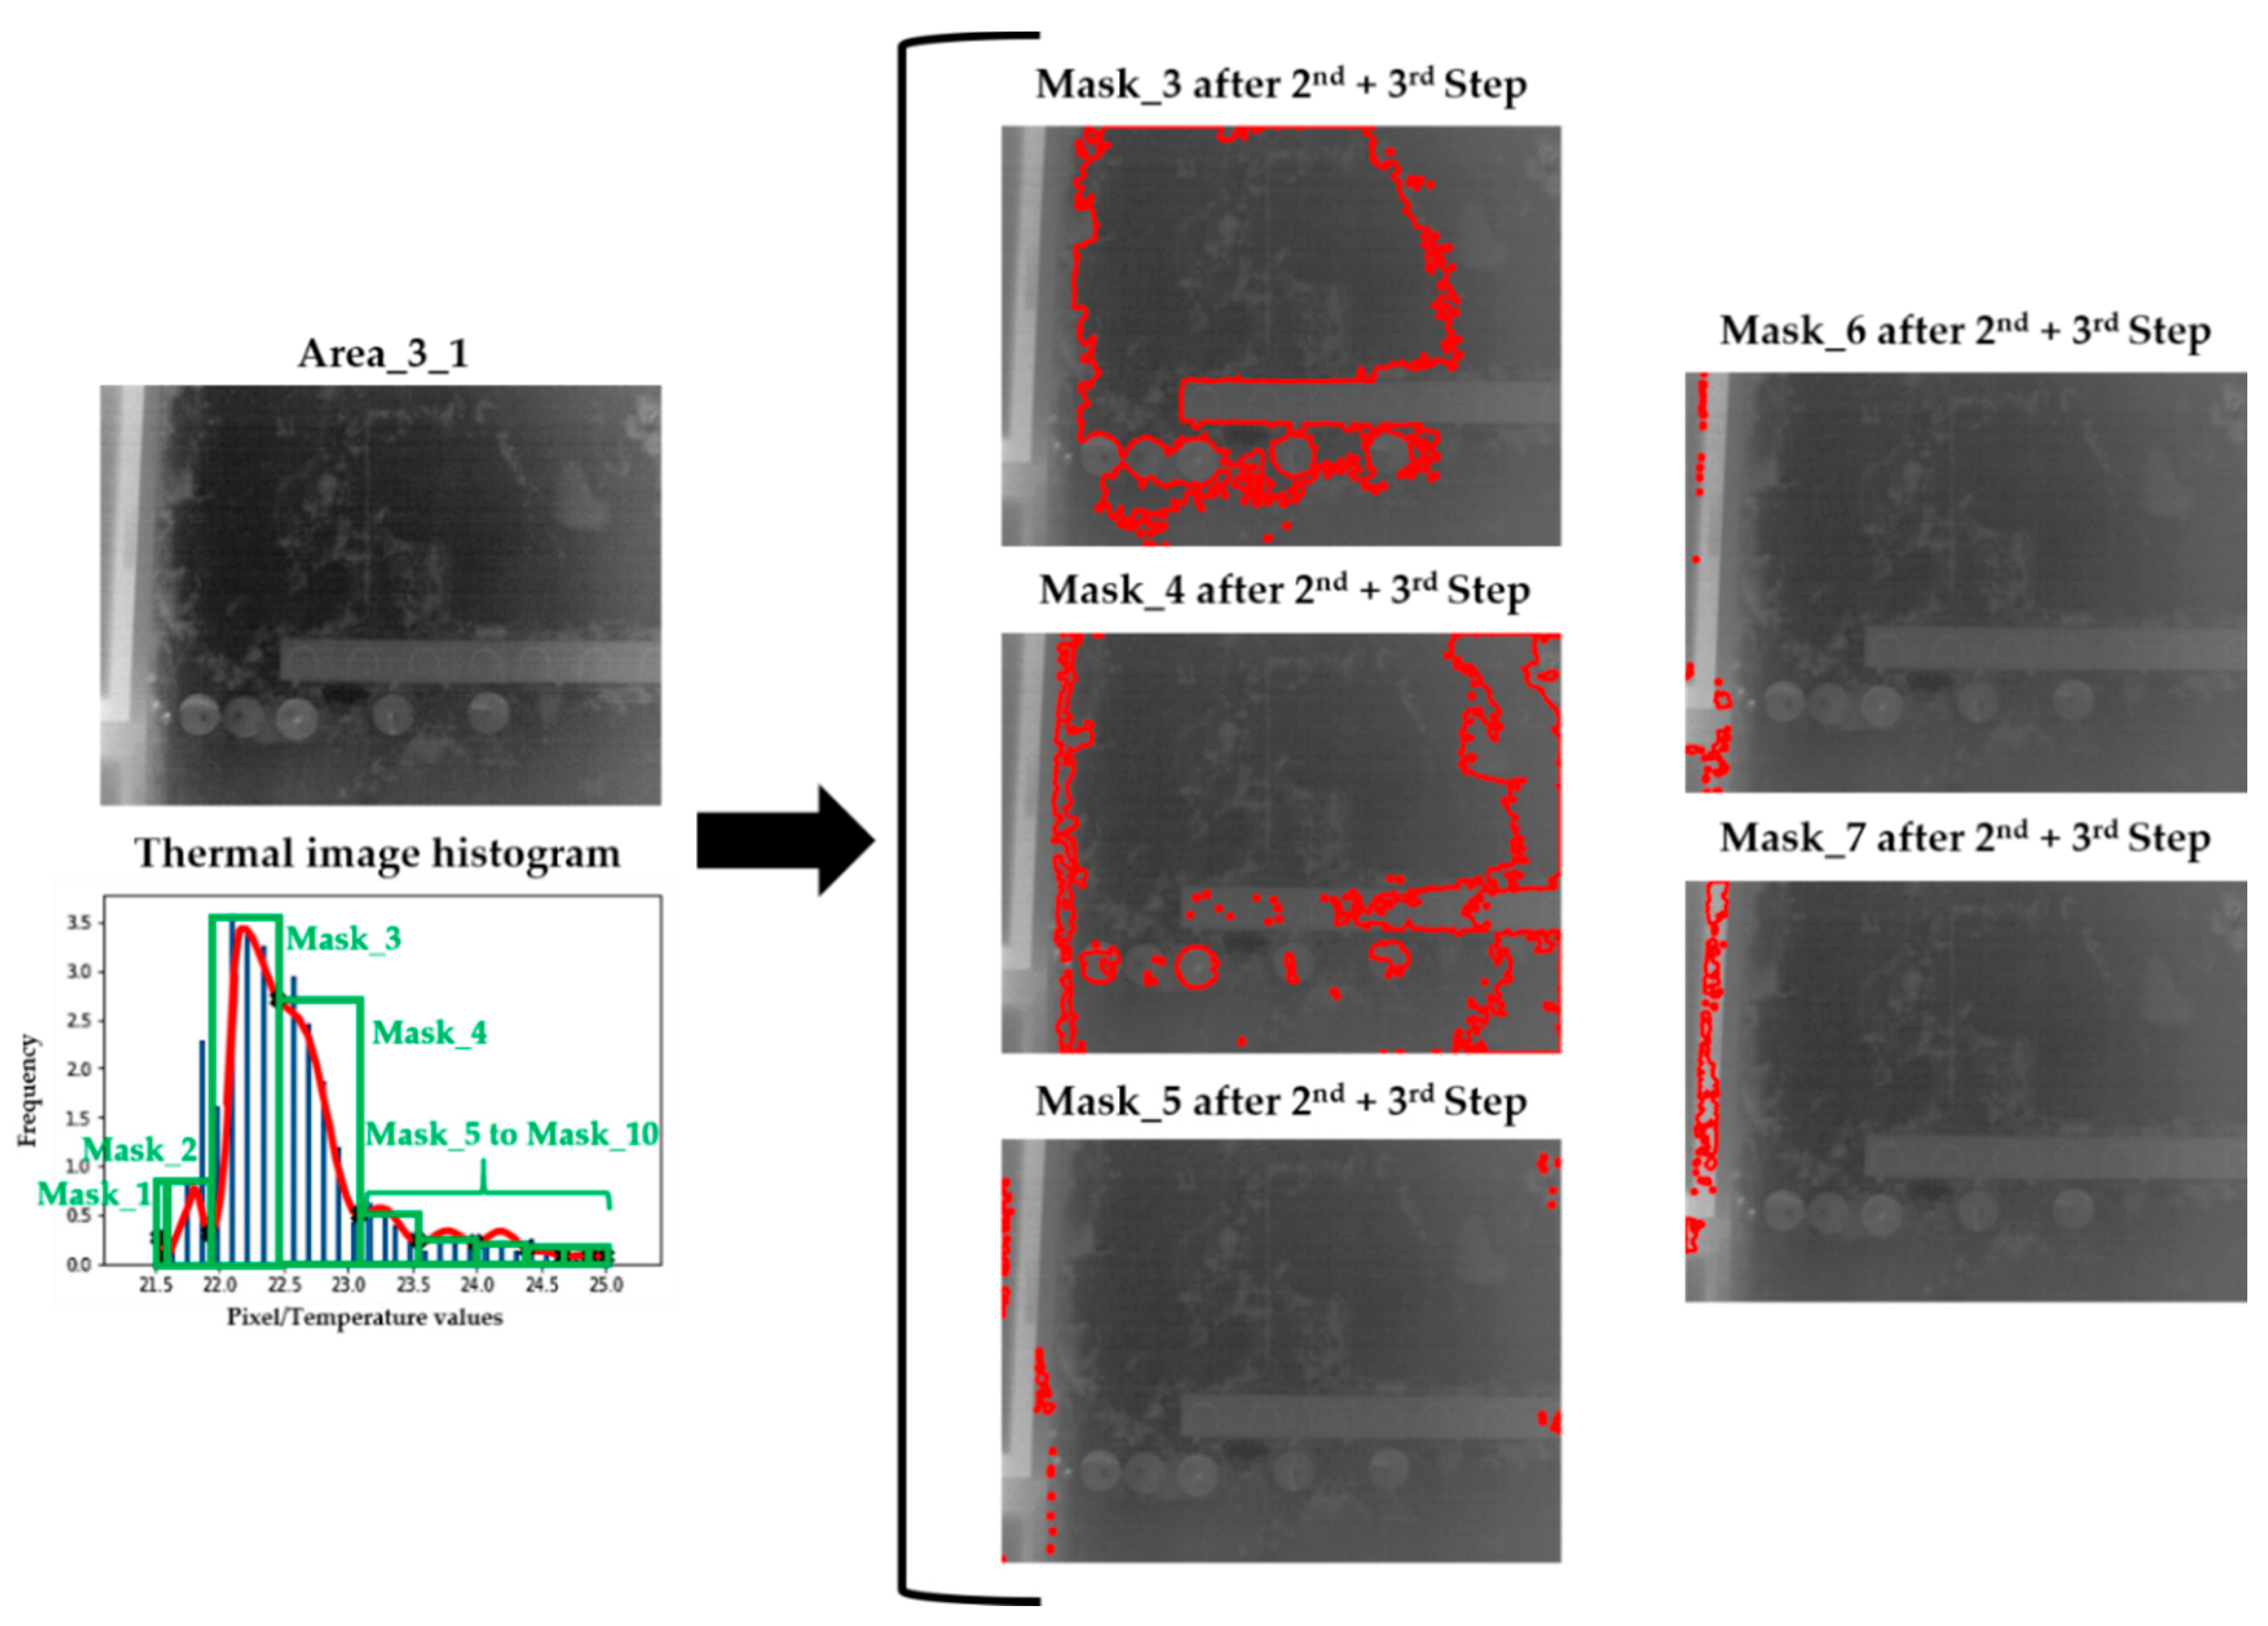
2.2.3. Step 3: Removing of Candidates for Superficial Moisture Areas with False Gaussian Bells
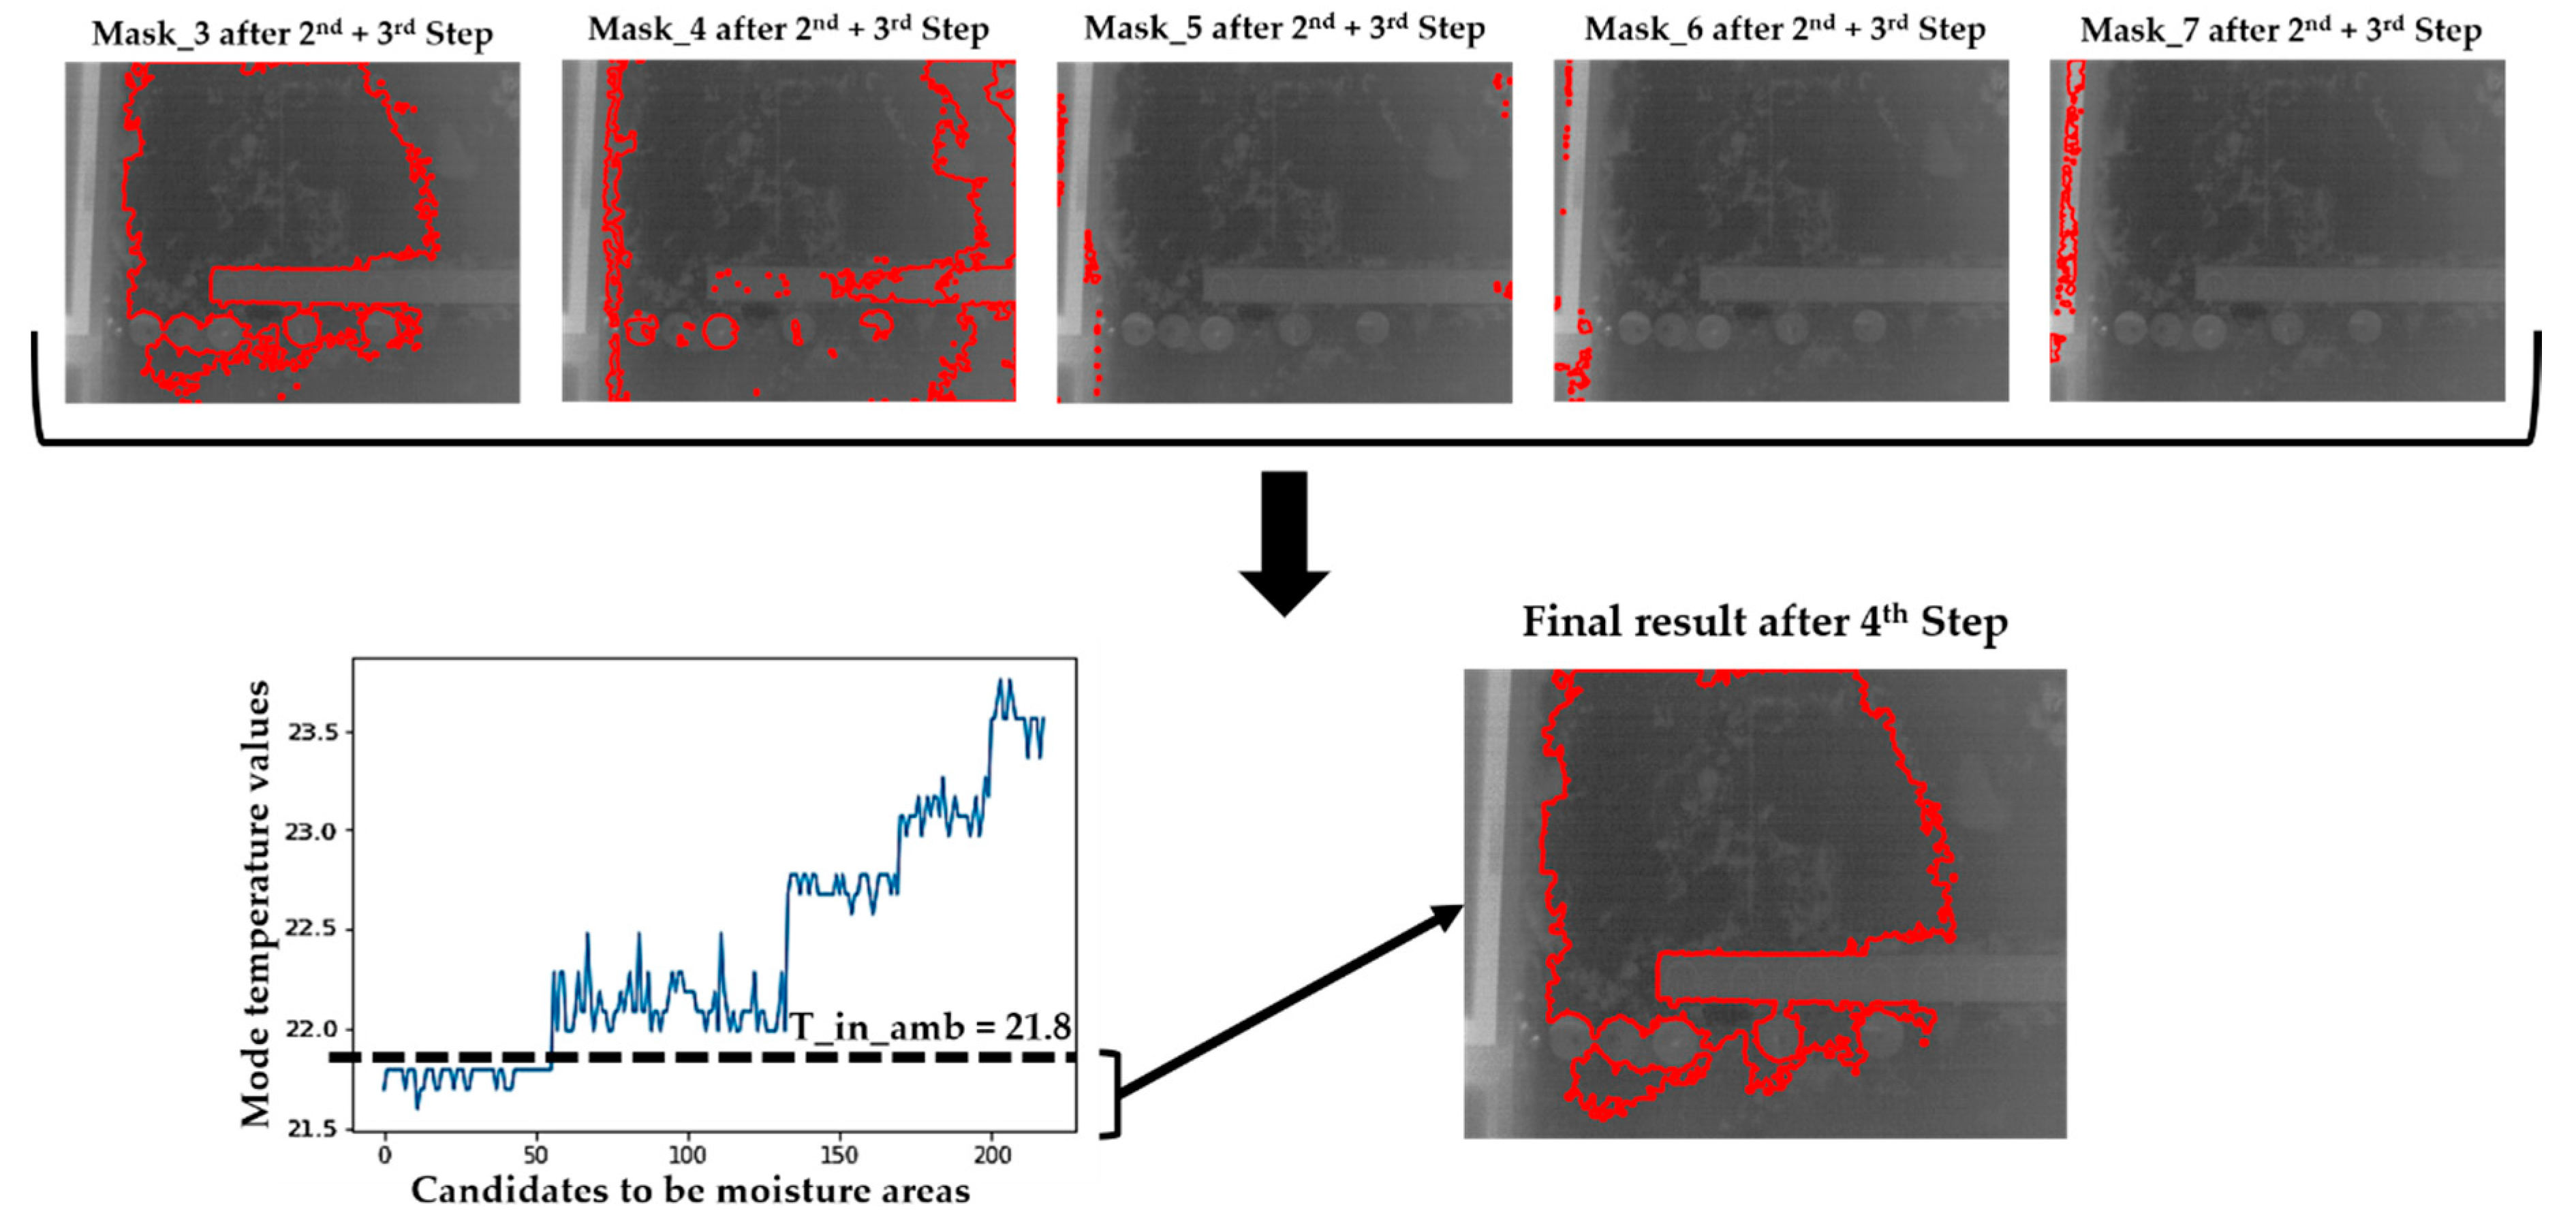
2.2.4. Step 4: Removal of Candidates for Superficial Moisture Areas According to Their Mode Temperatures and the Ambient Temperature
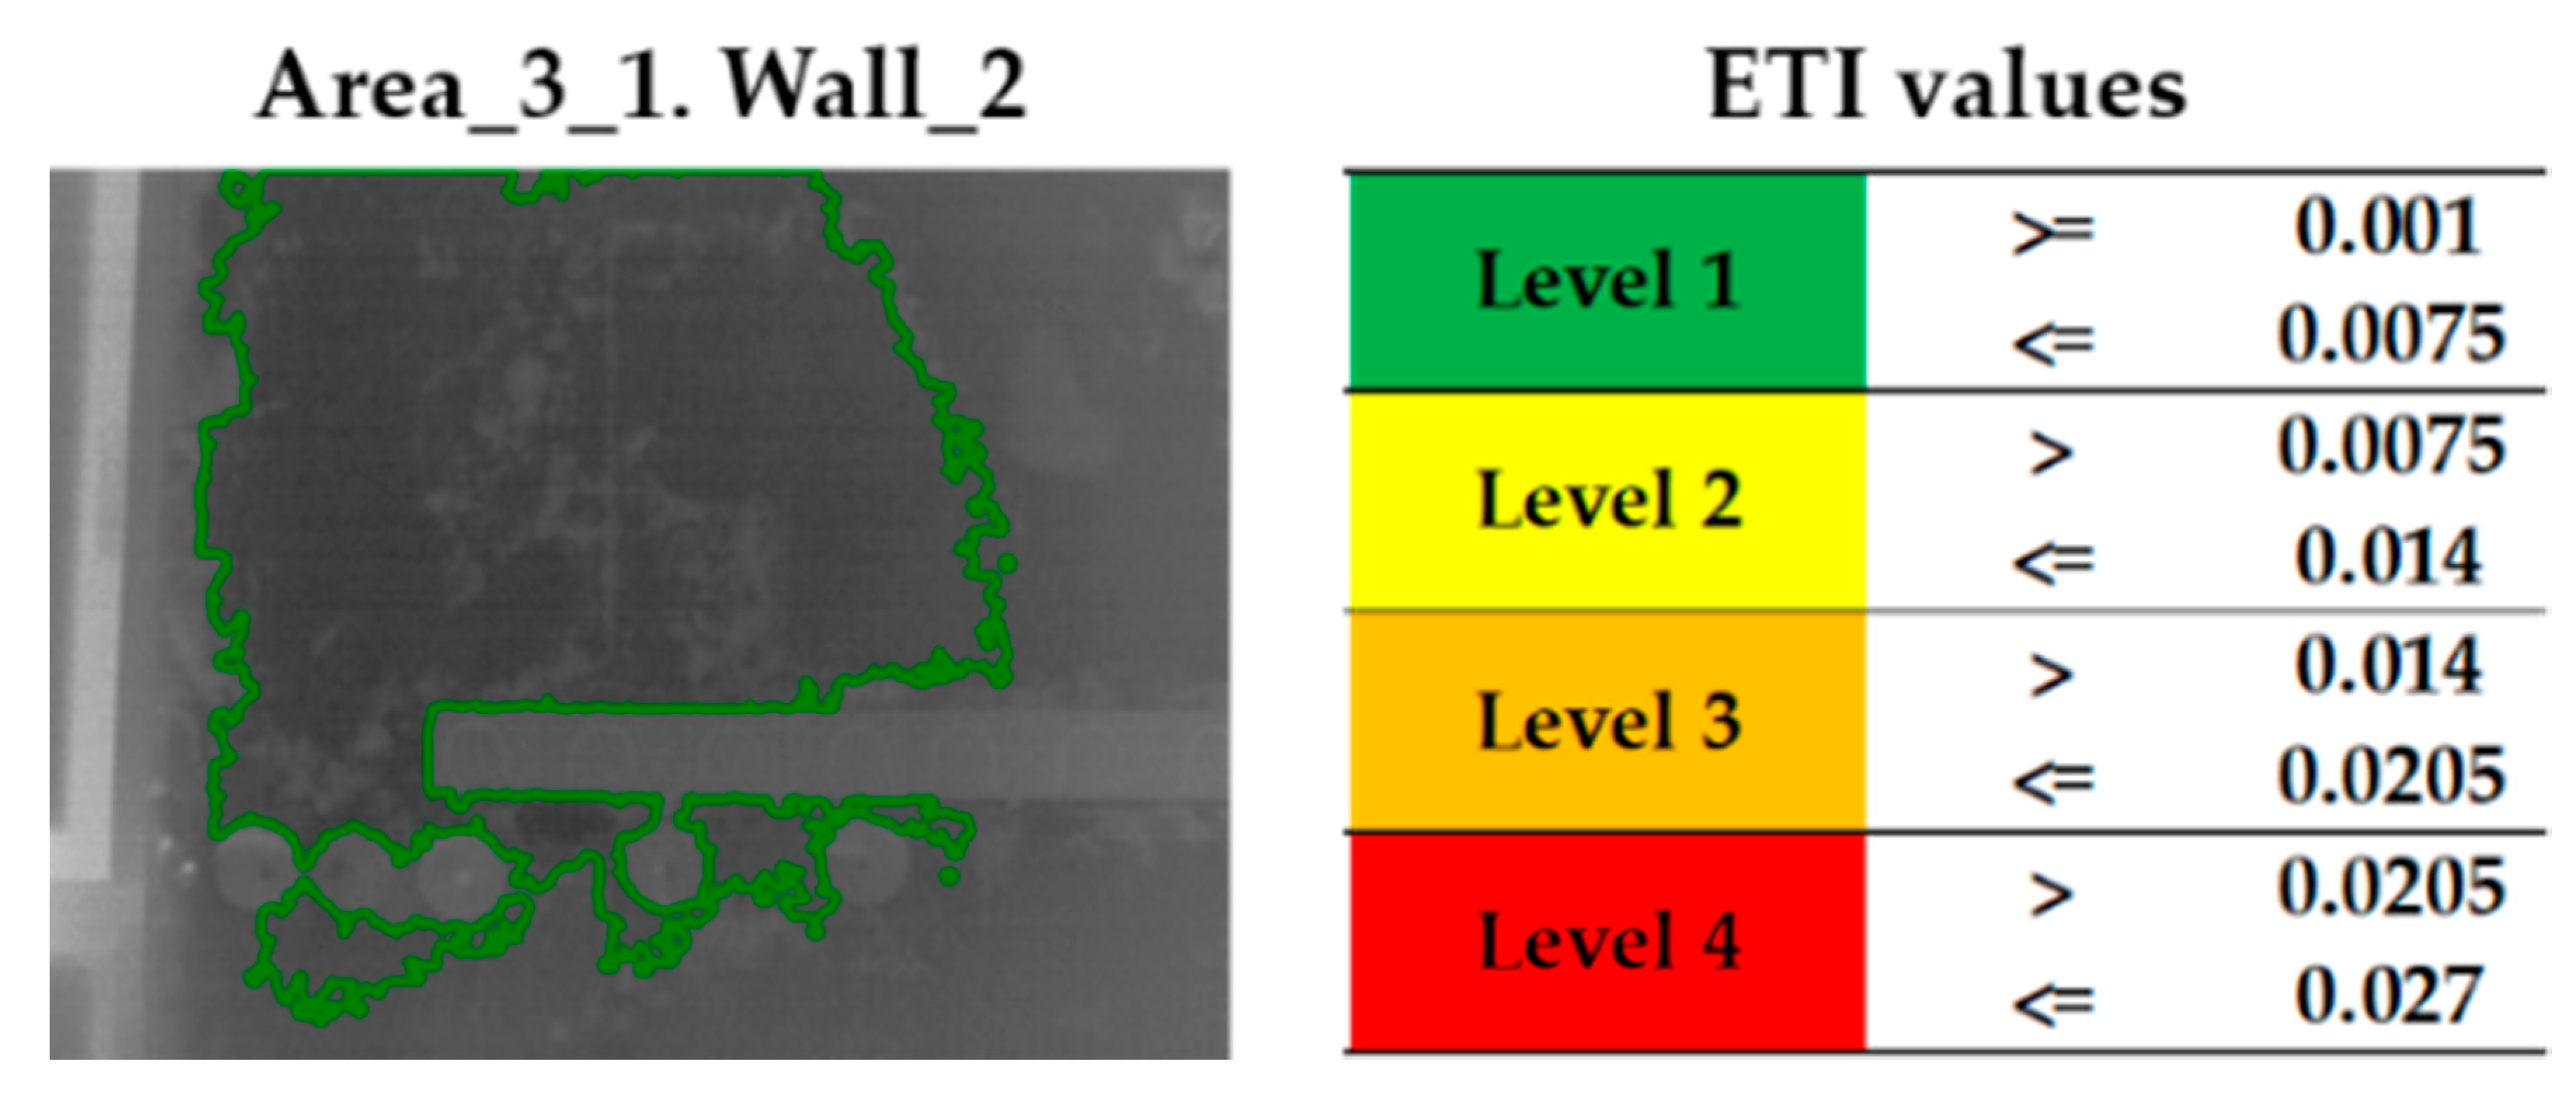
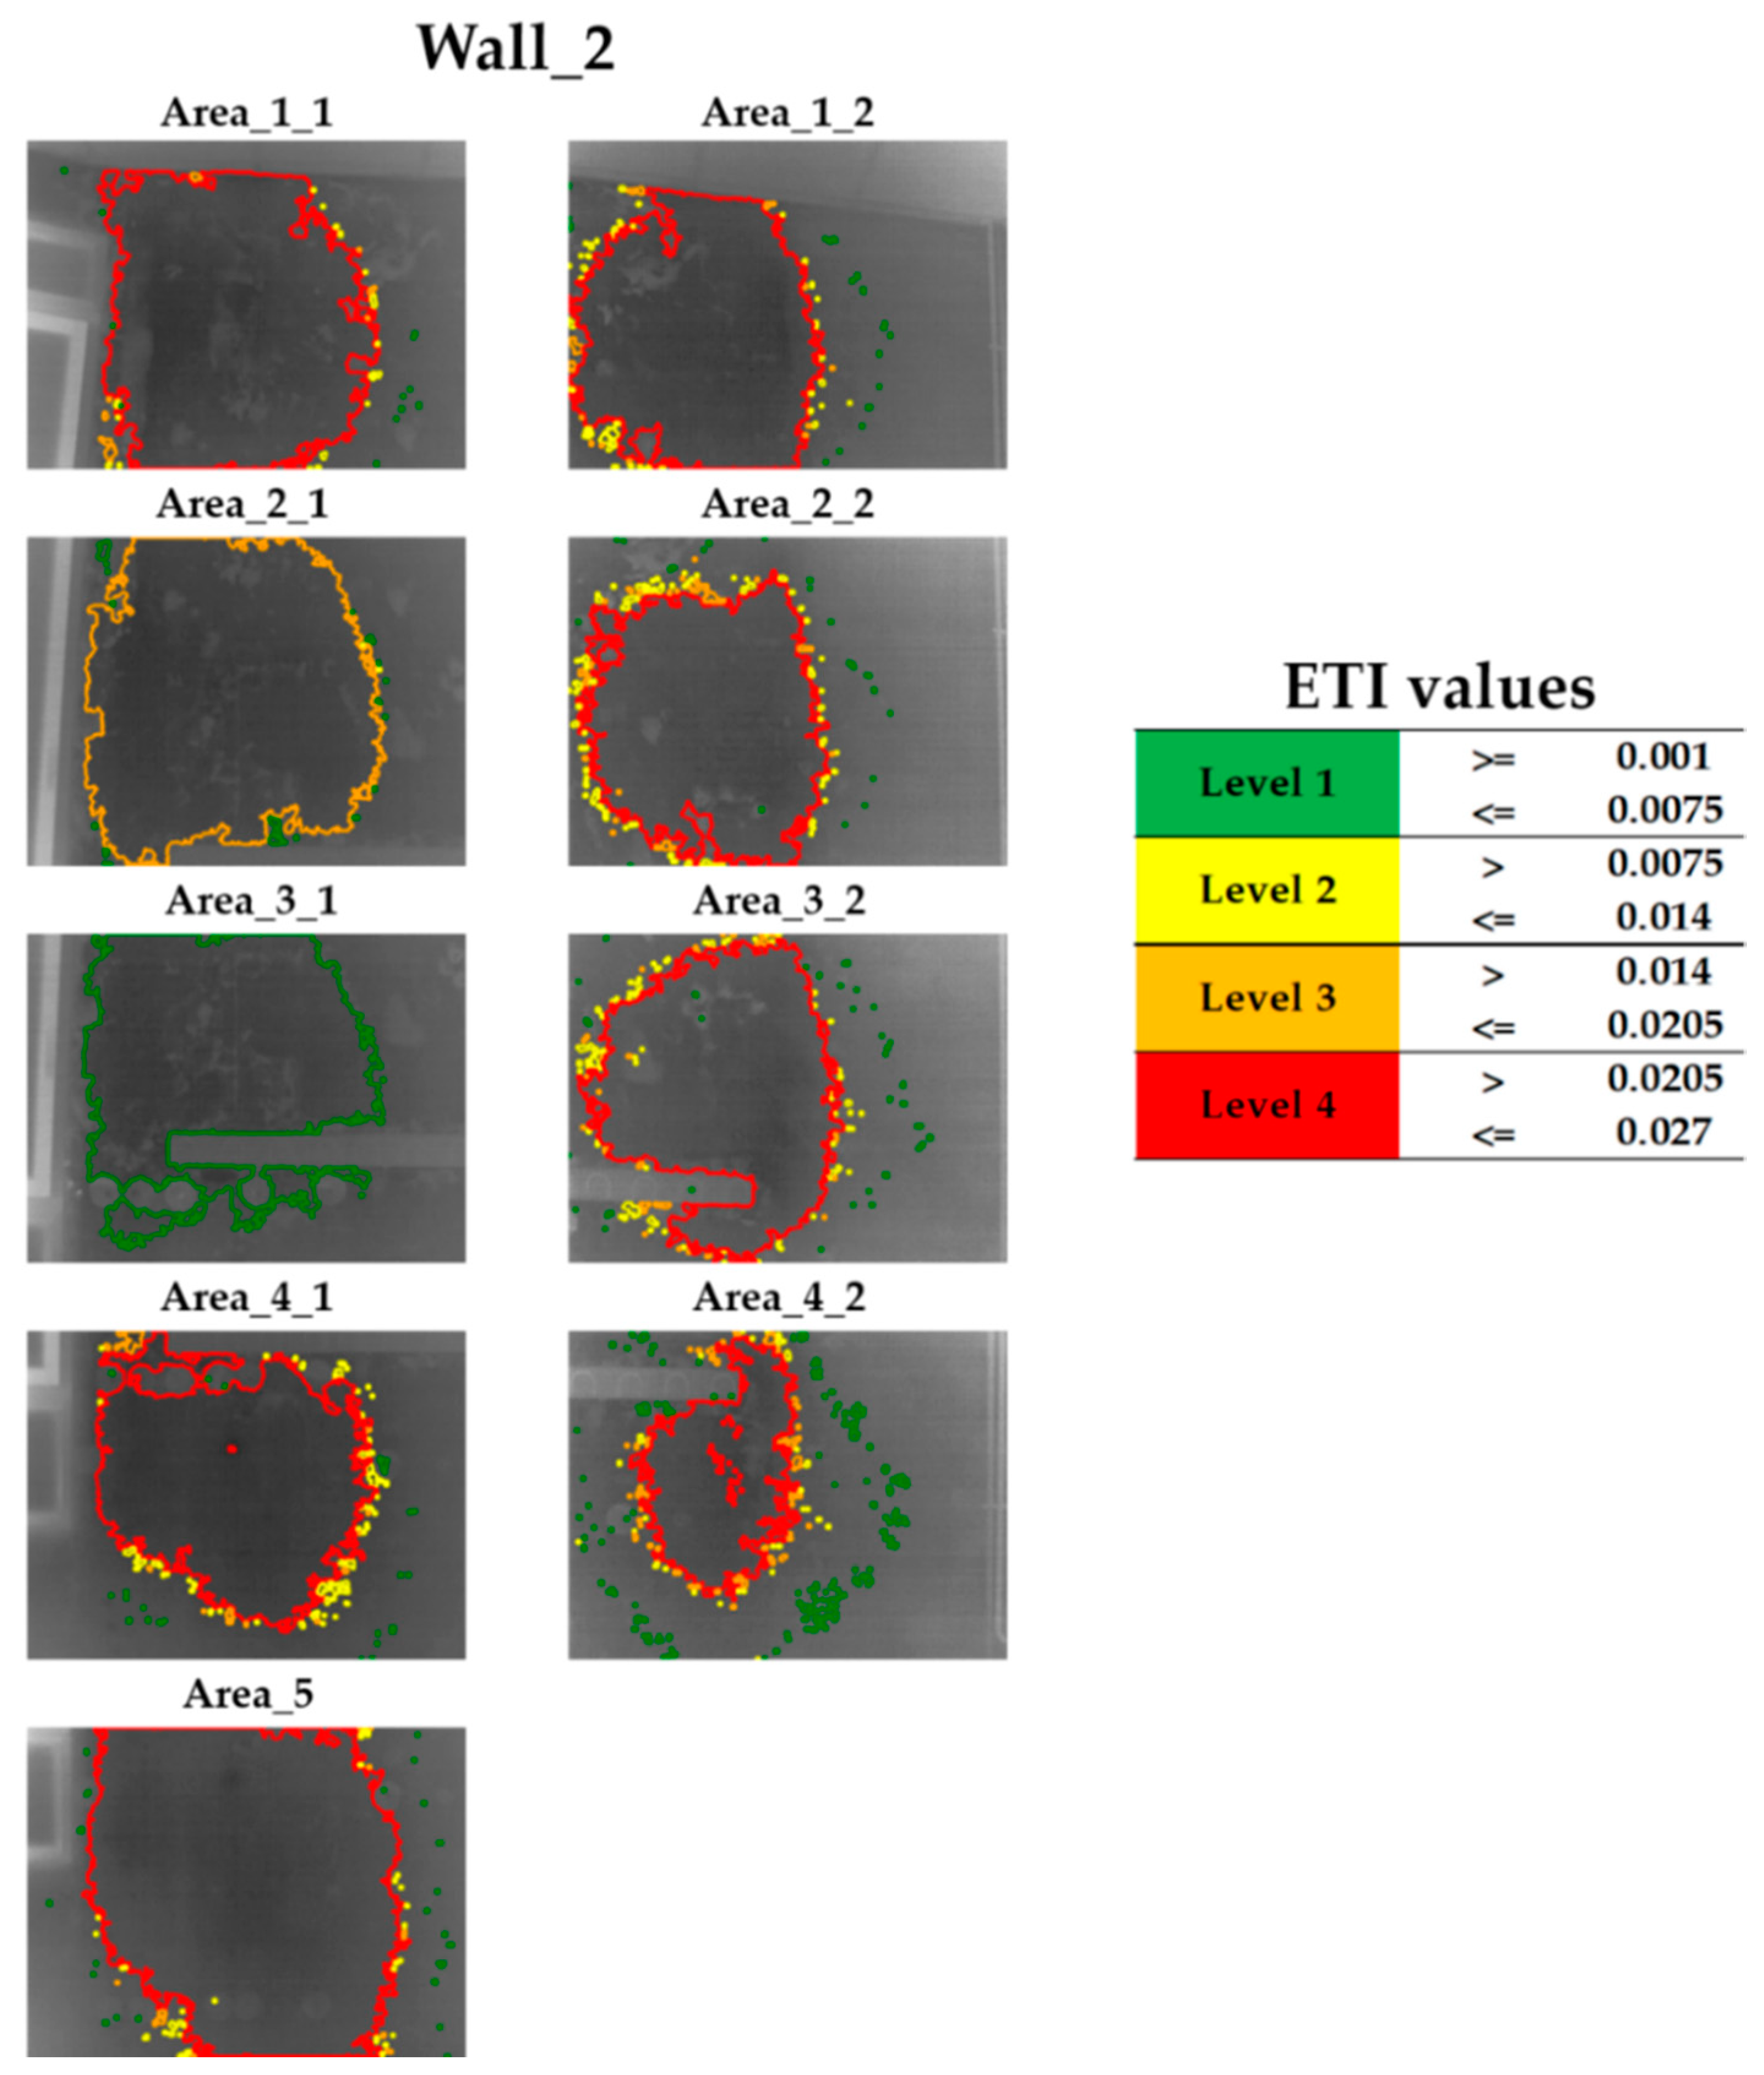
2.2.5. Step 5: Moisture Severity Levels: Evaporative Thermal Index (ETI) Calculation on Each Candidate for Superficial Moisture Area
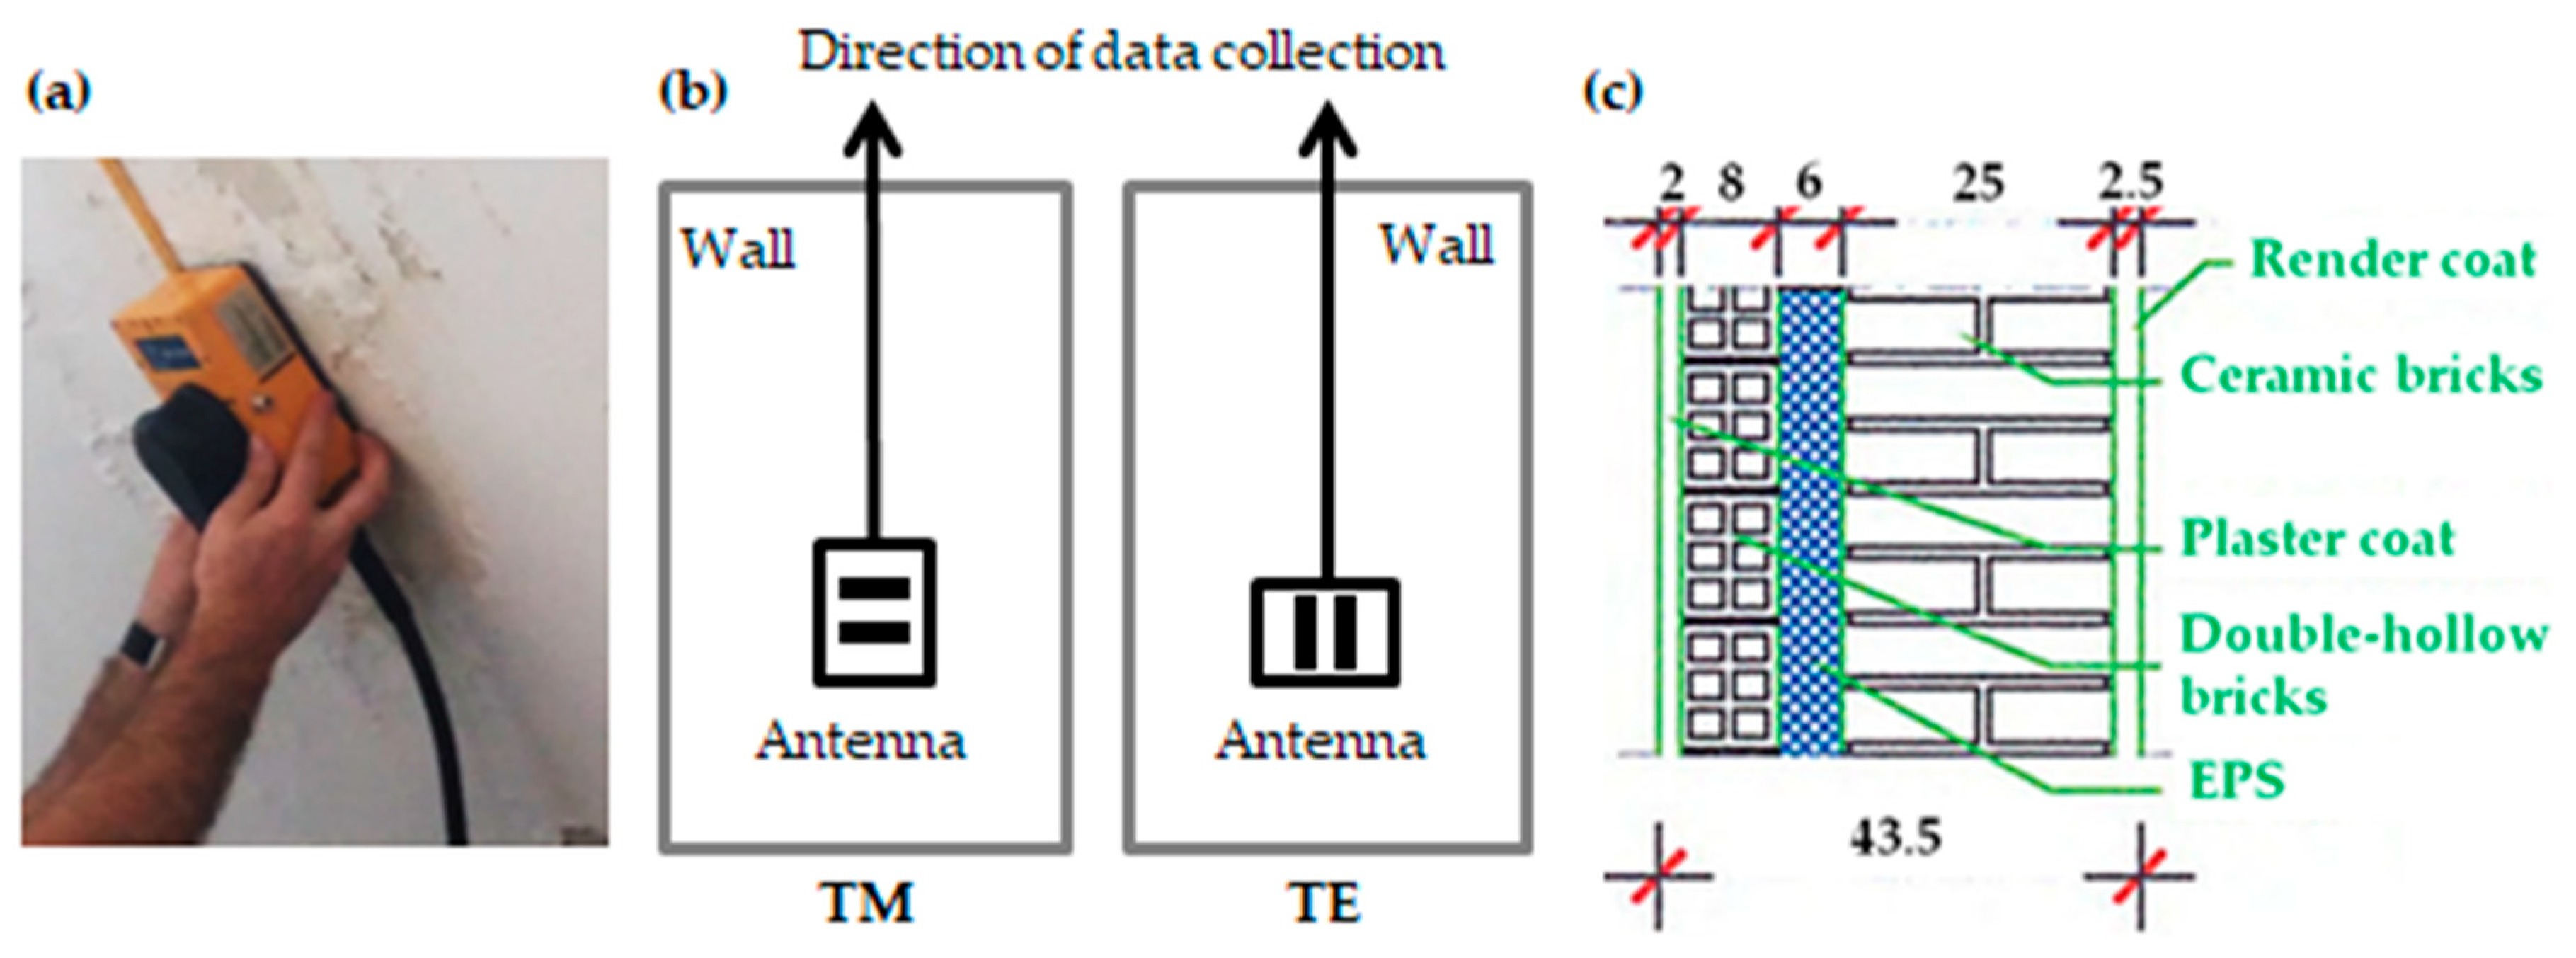
2.3. GPR Data Acquisition and Processing
- 1
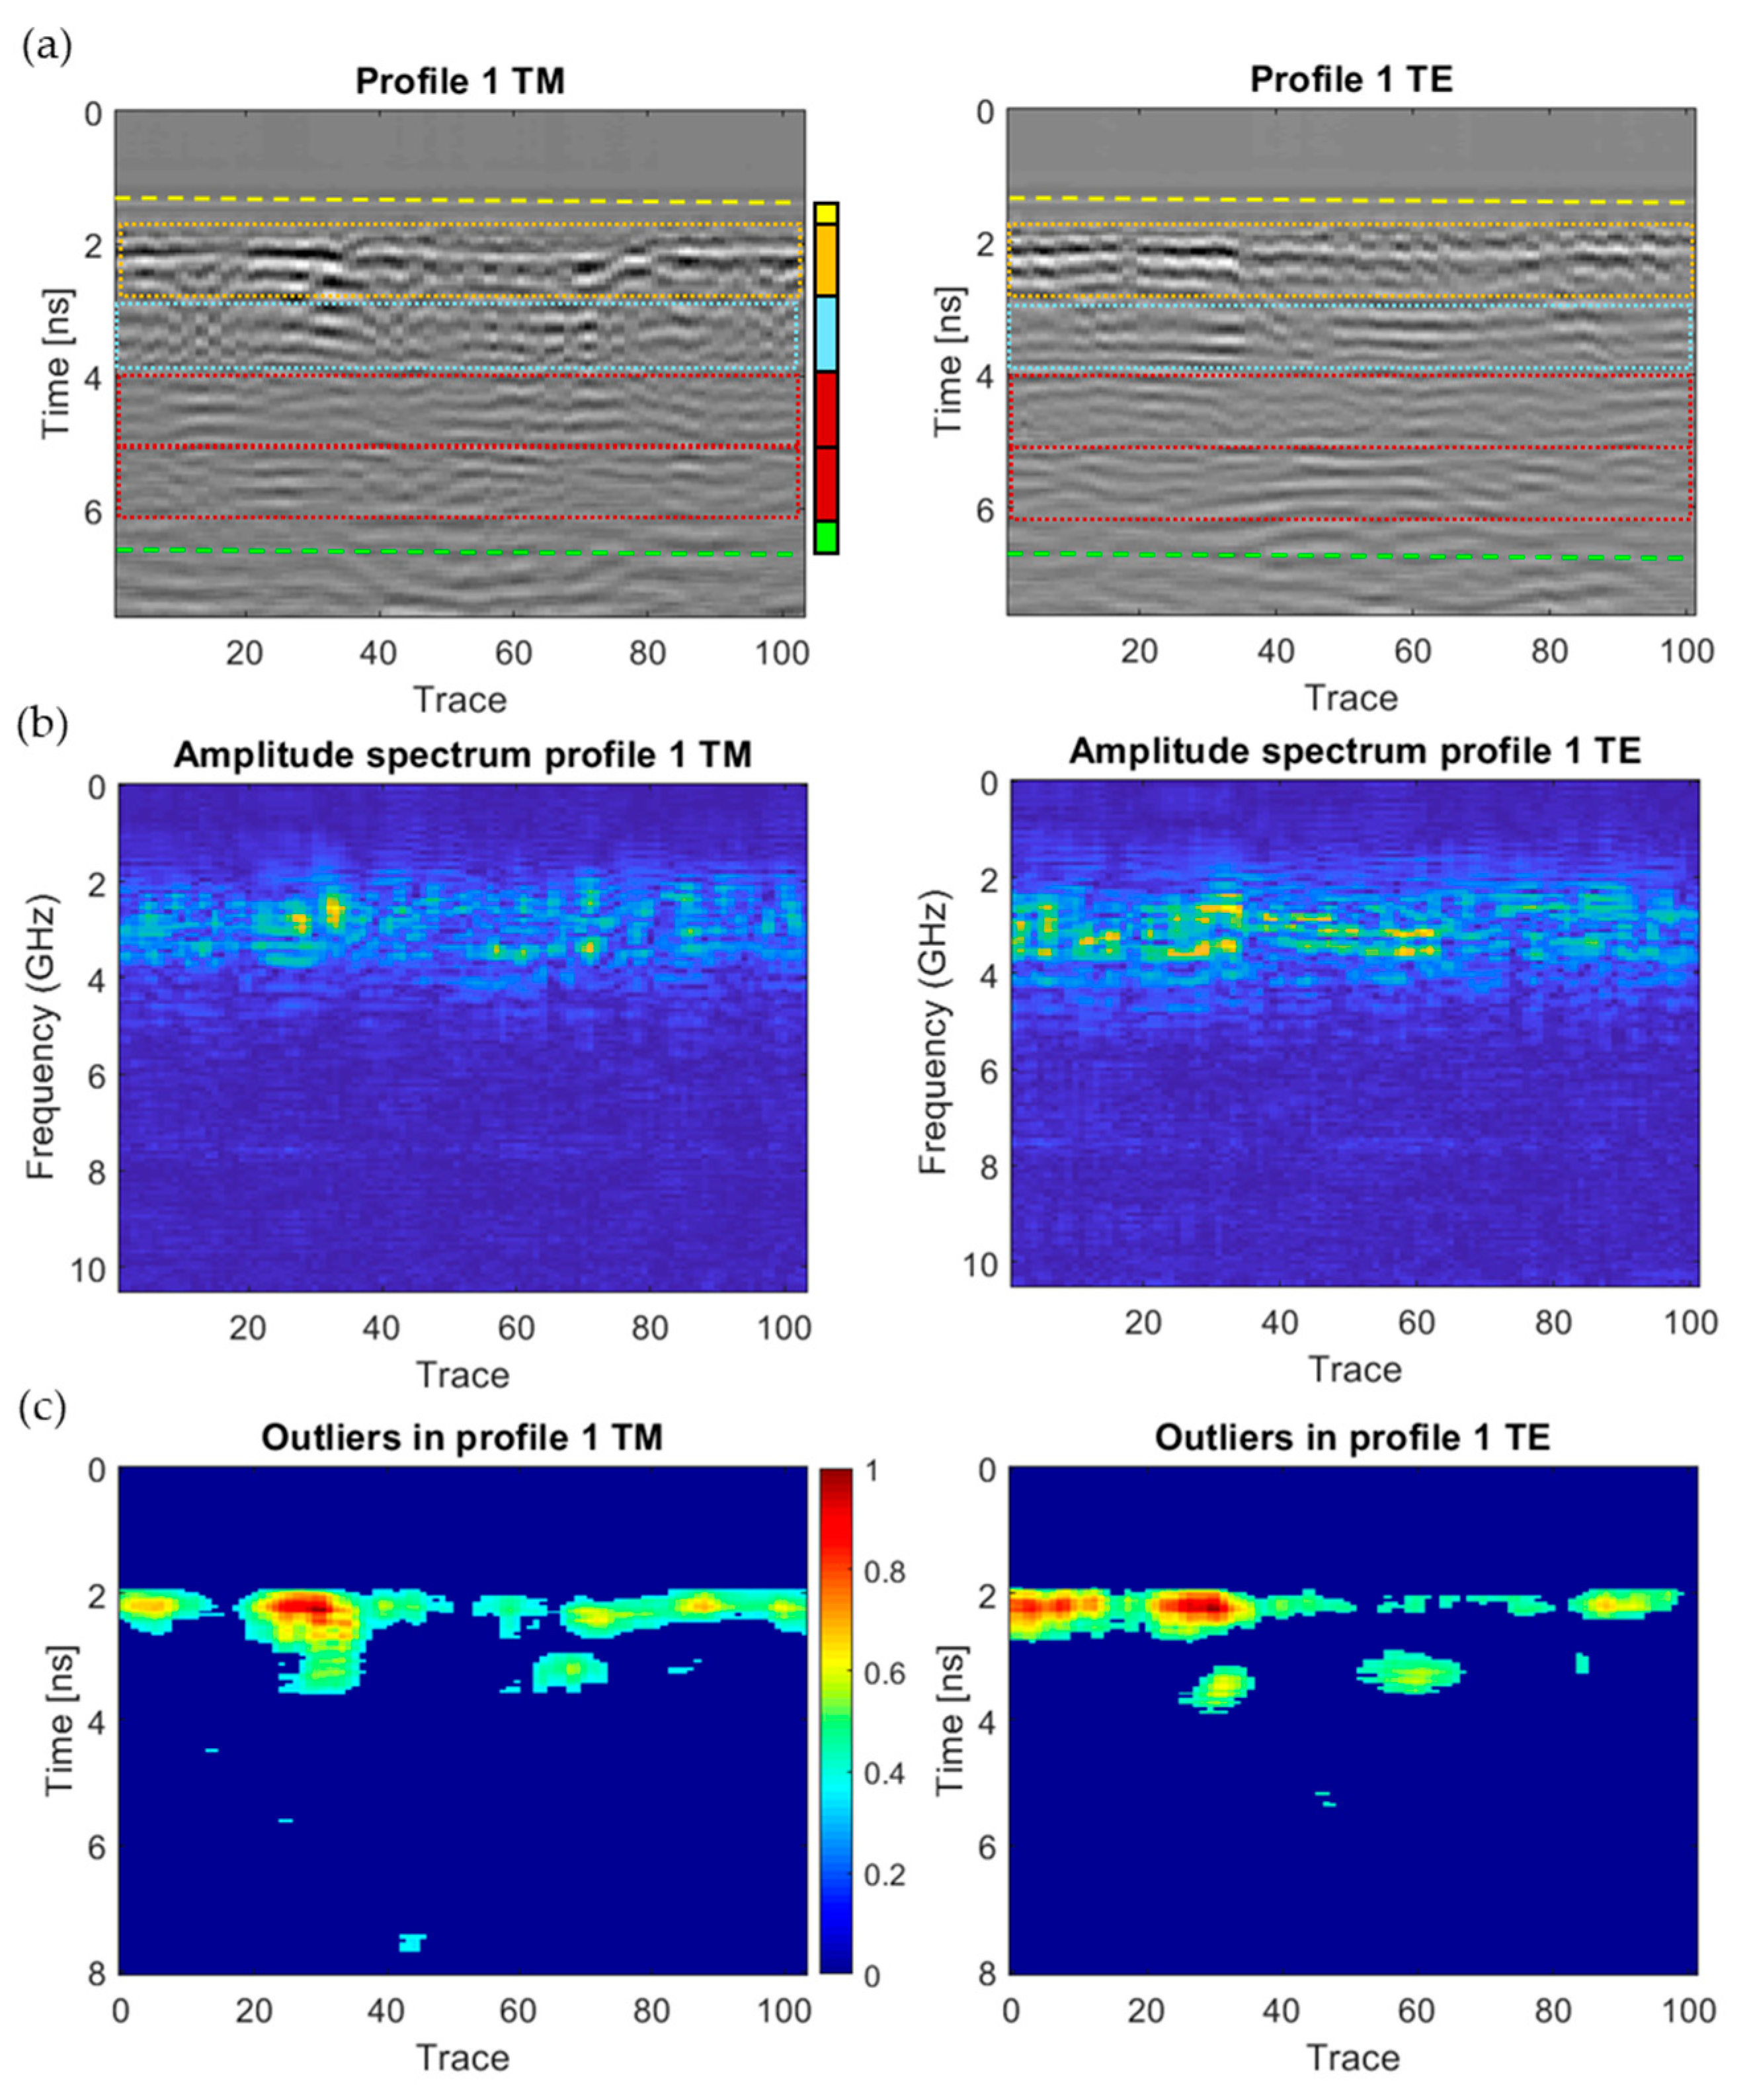
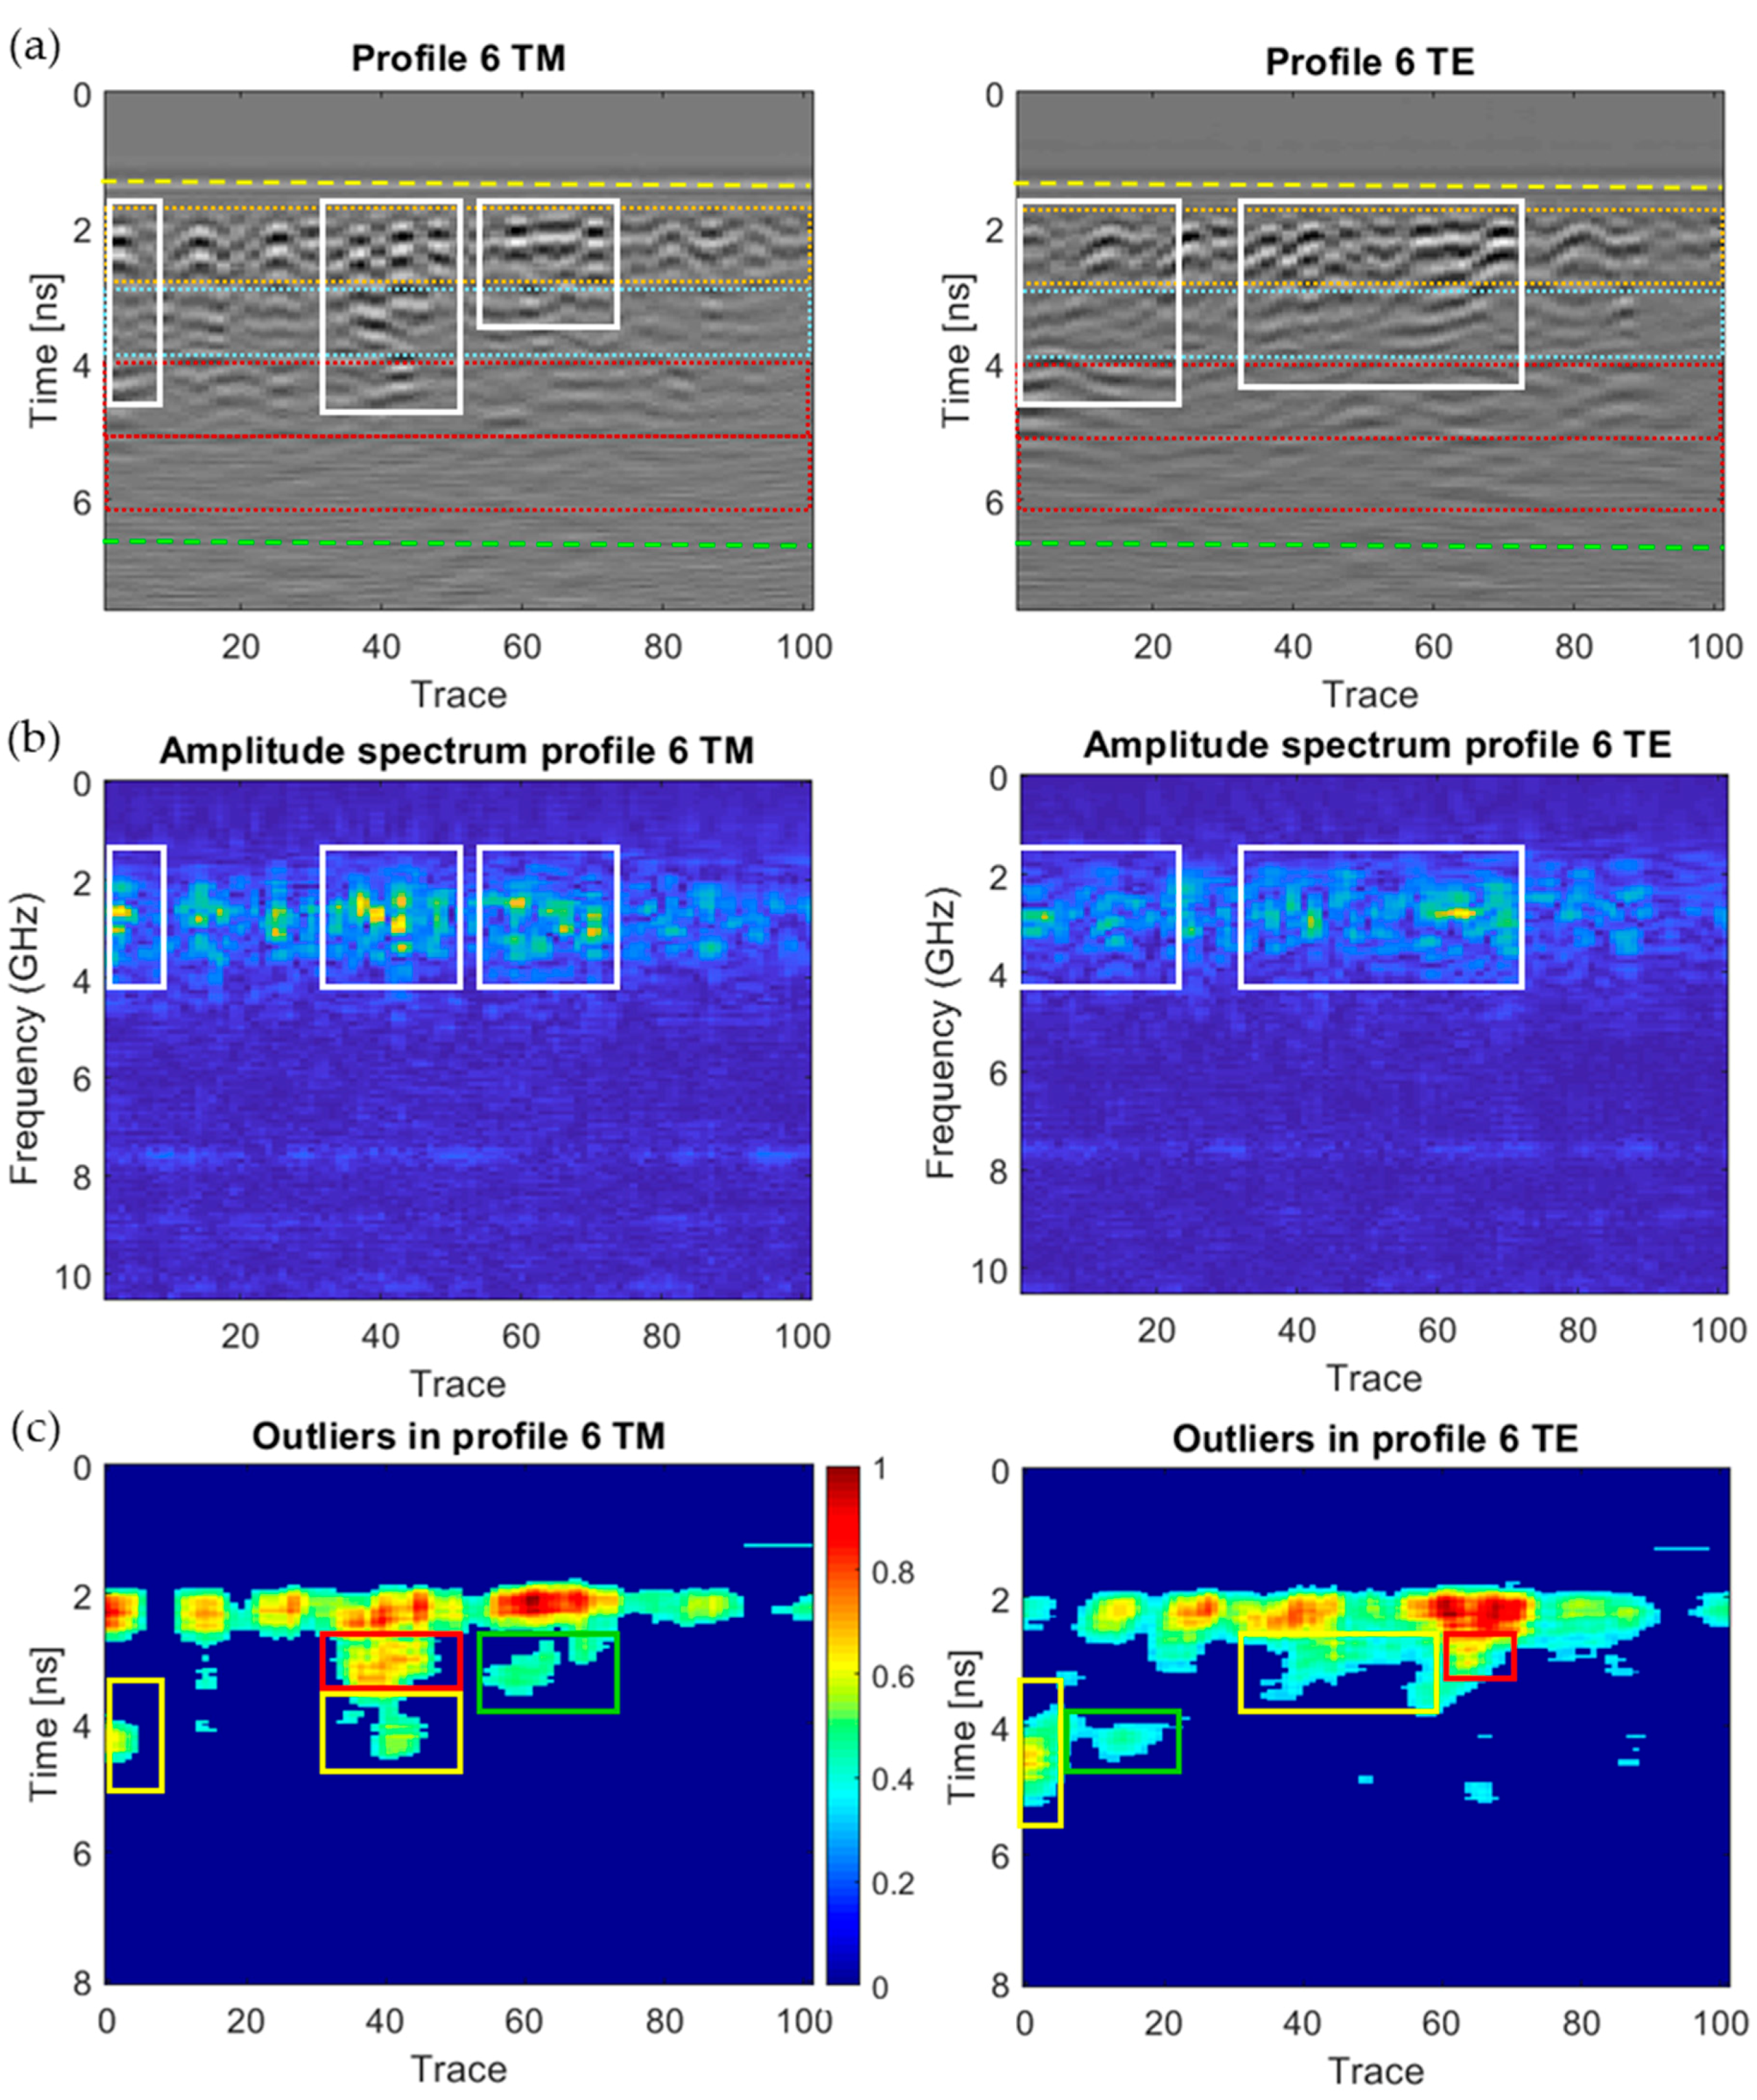
- The radargrams of the TM and TE modes are filtered with an averaging 2D filter working on a 7 × 7 window.
- 2
- Then, the absolute value of the matrix obtained from the filtering process is computed.
- 3
- This matrix is later normalised in the [0,1] interval dividing all the cells by the maximum value of the matrix.
- 4
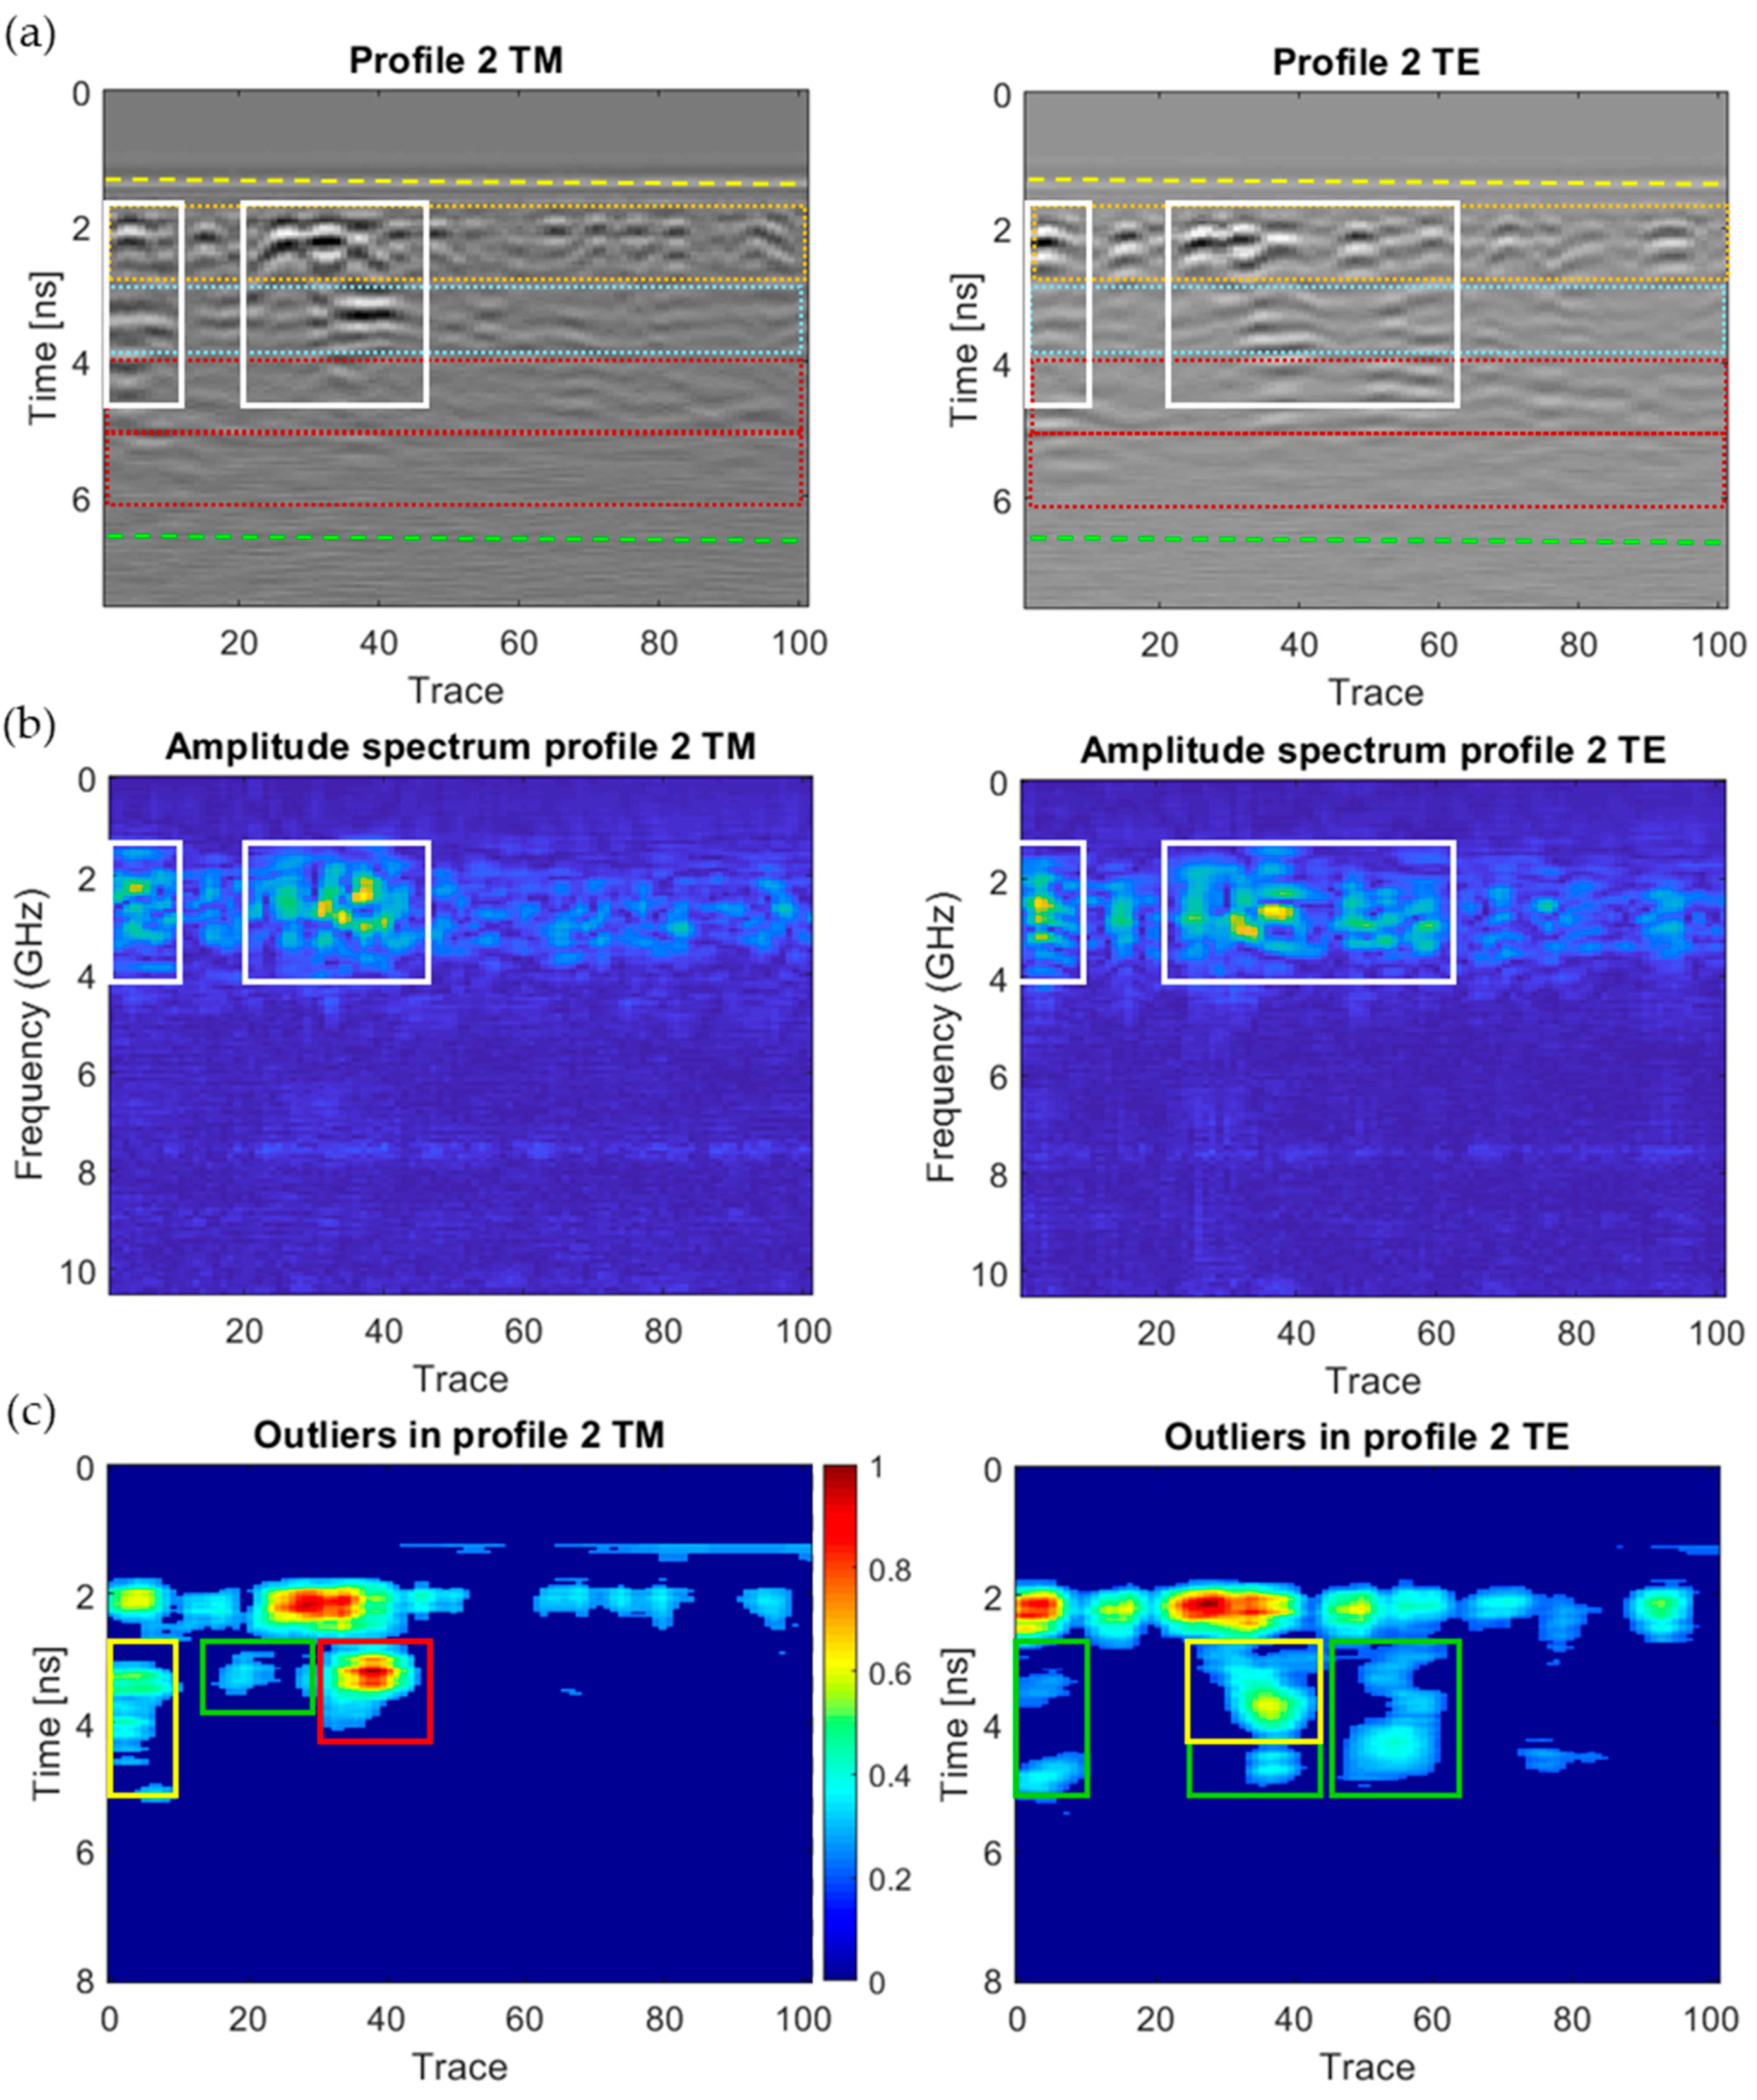
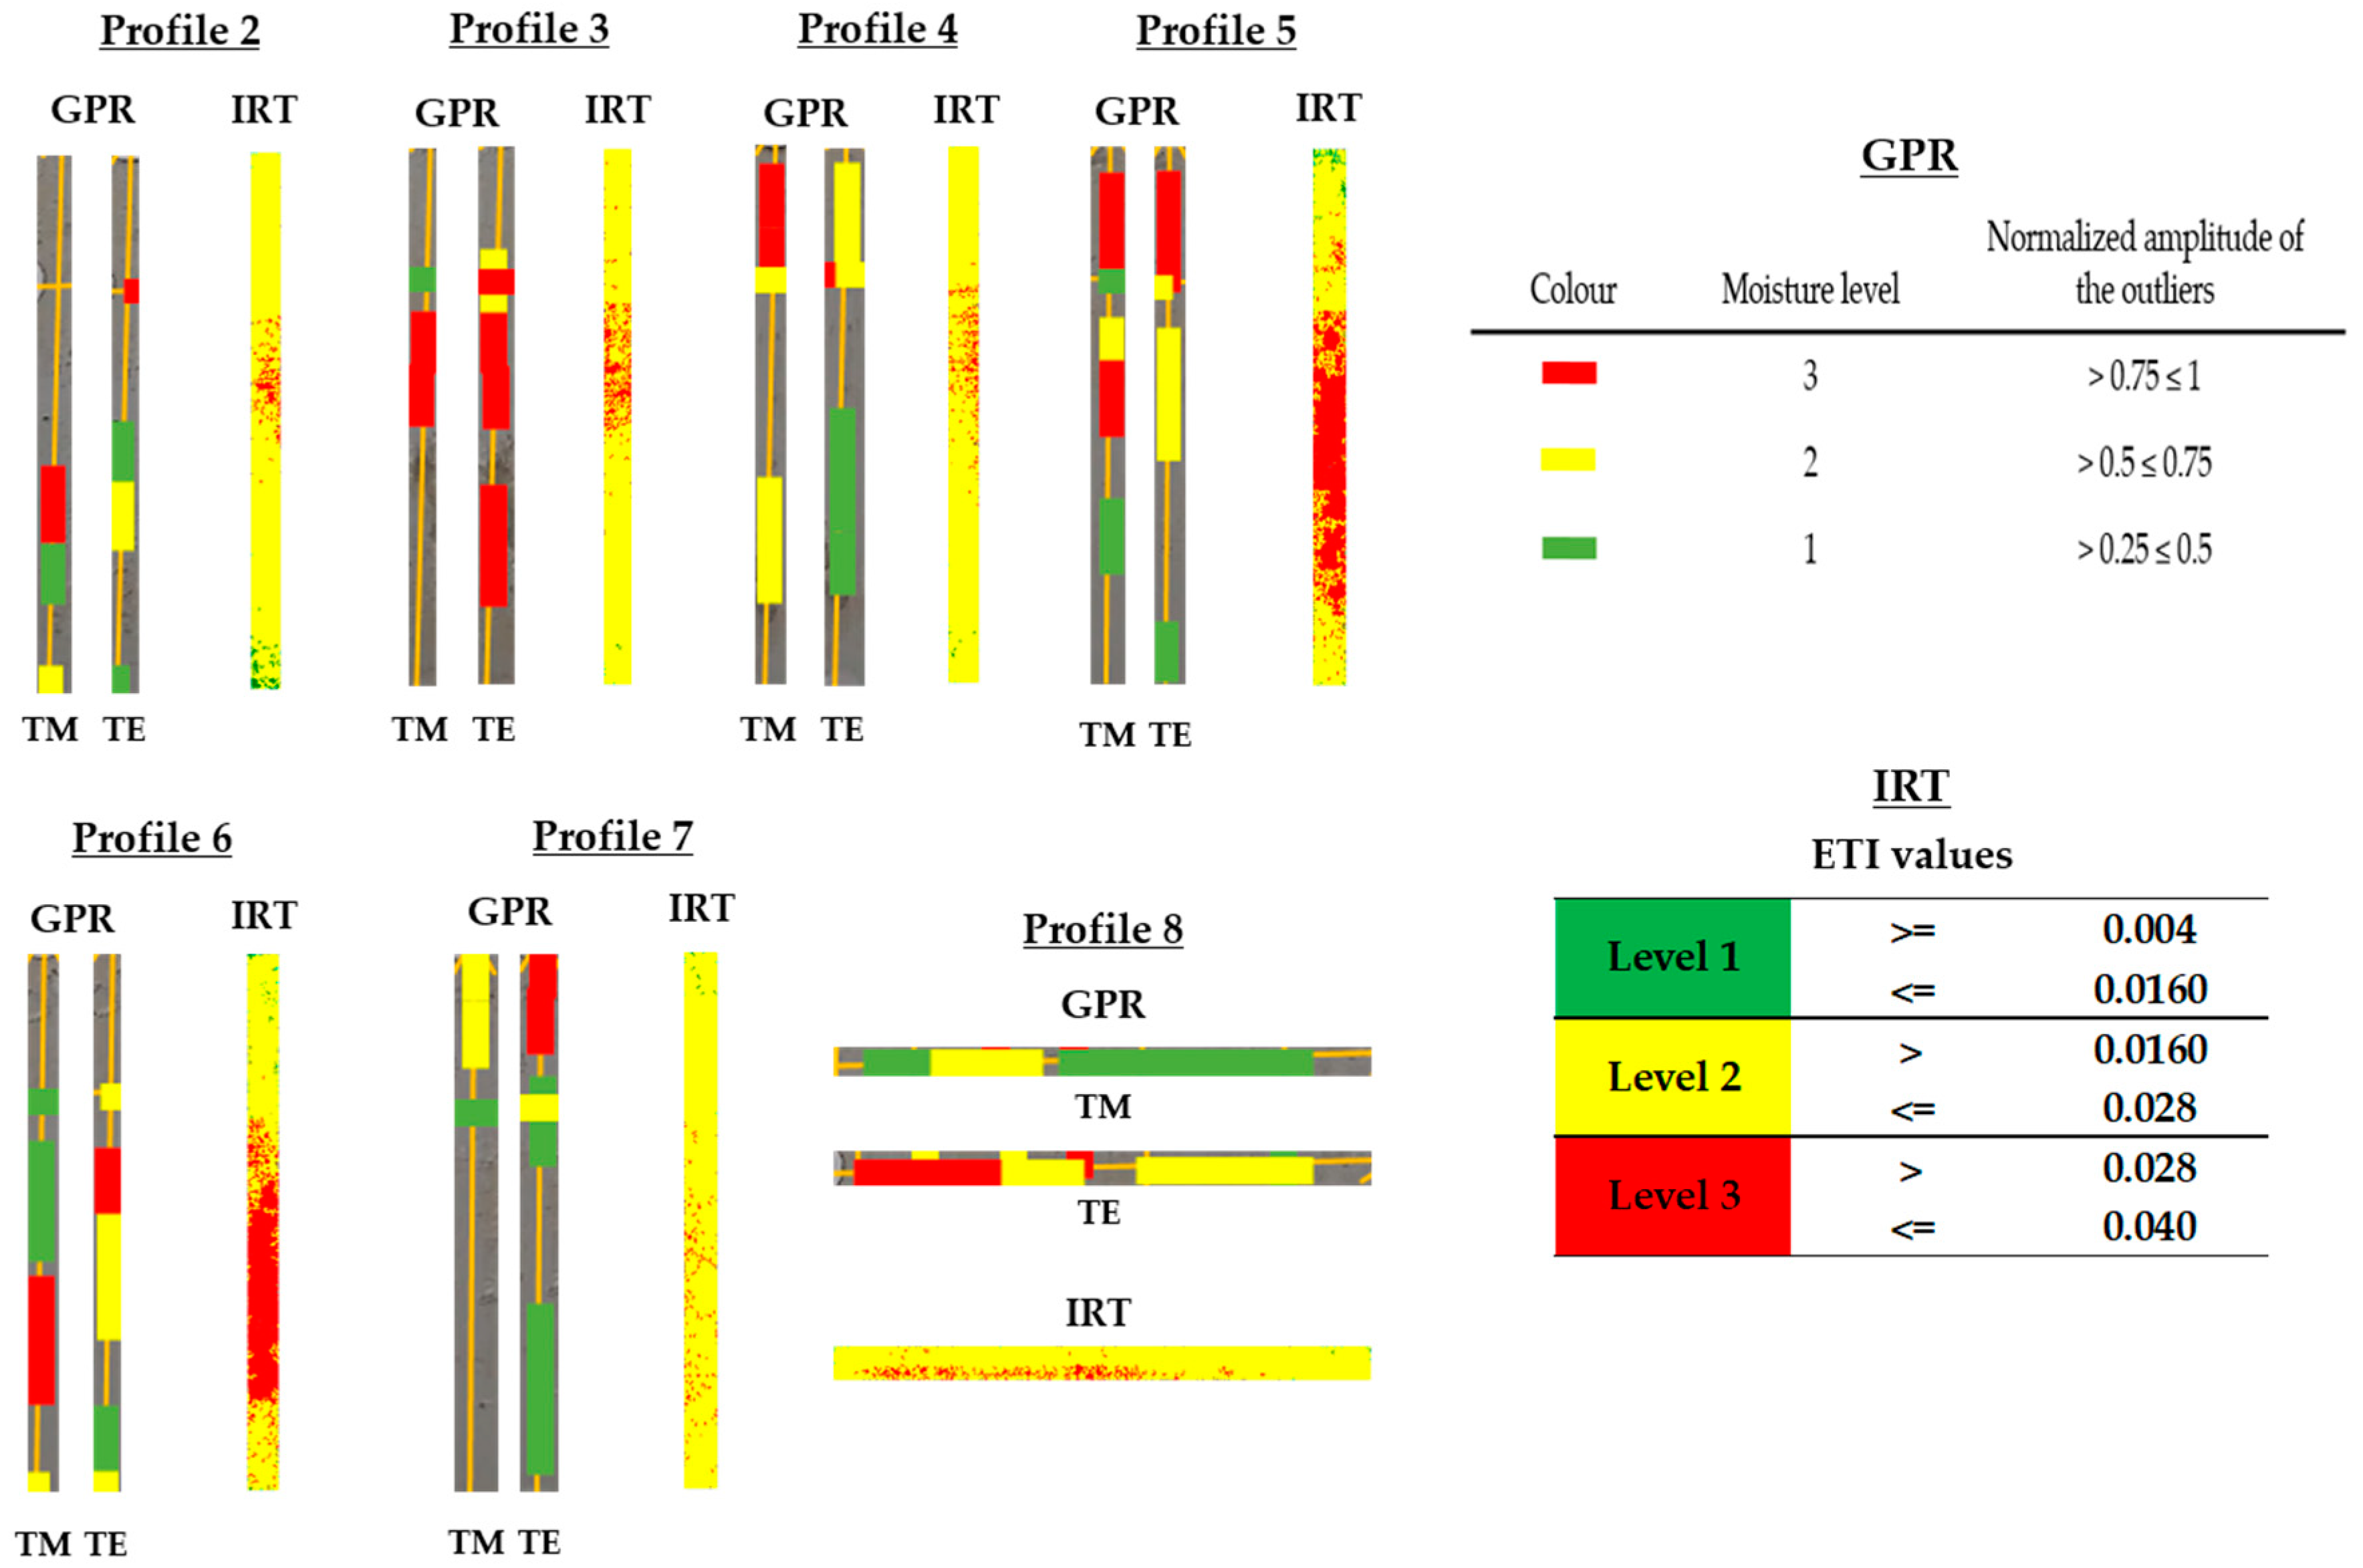
- Finally, the outliers in the normalised matrix are detected using the InterQuartile Range (IQR) criterion: those values that are greater than the upper 1.5 times IQR whisker or lesser than the lower 1.5 times IQR whisker are considered outliers and plotted, using a colour-scale shown on the right side of the TM subplot.
3. Results and Discussion
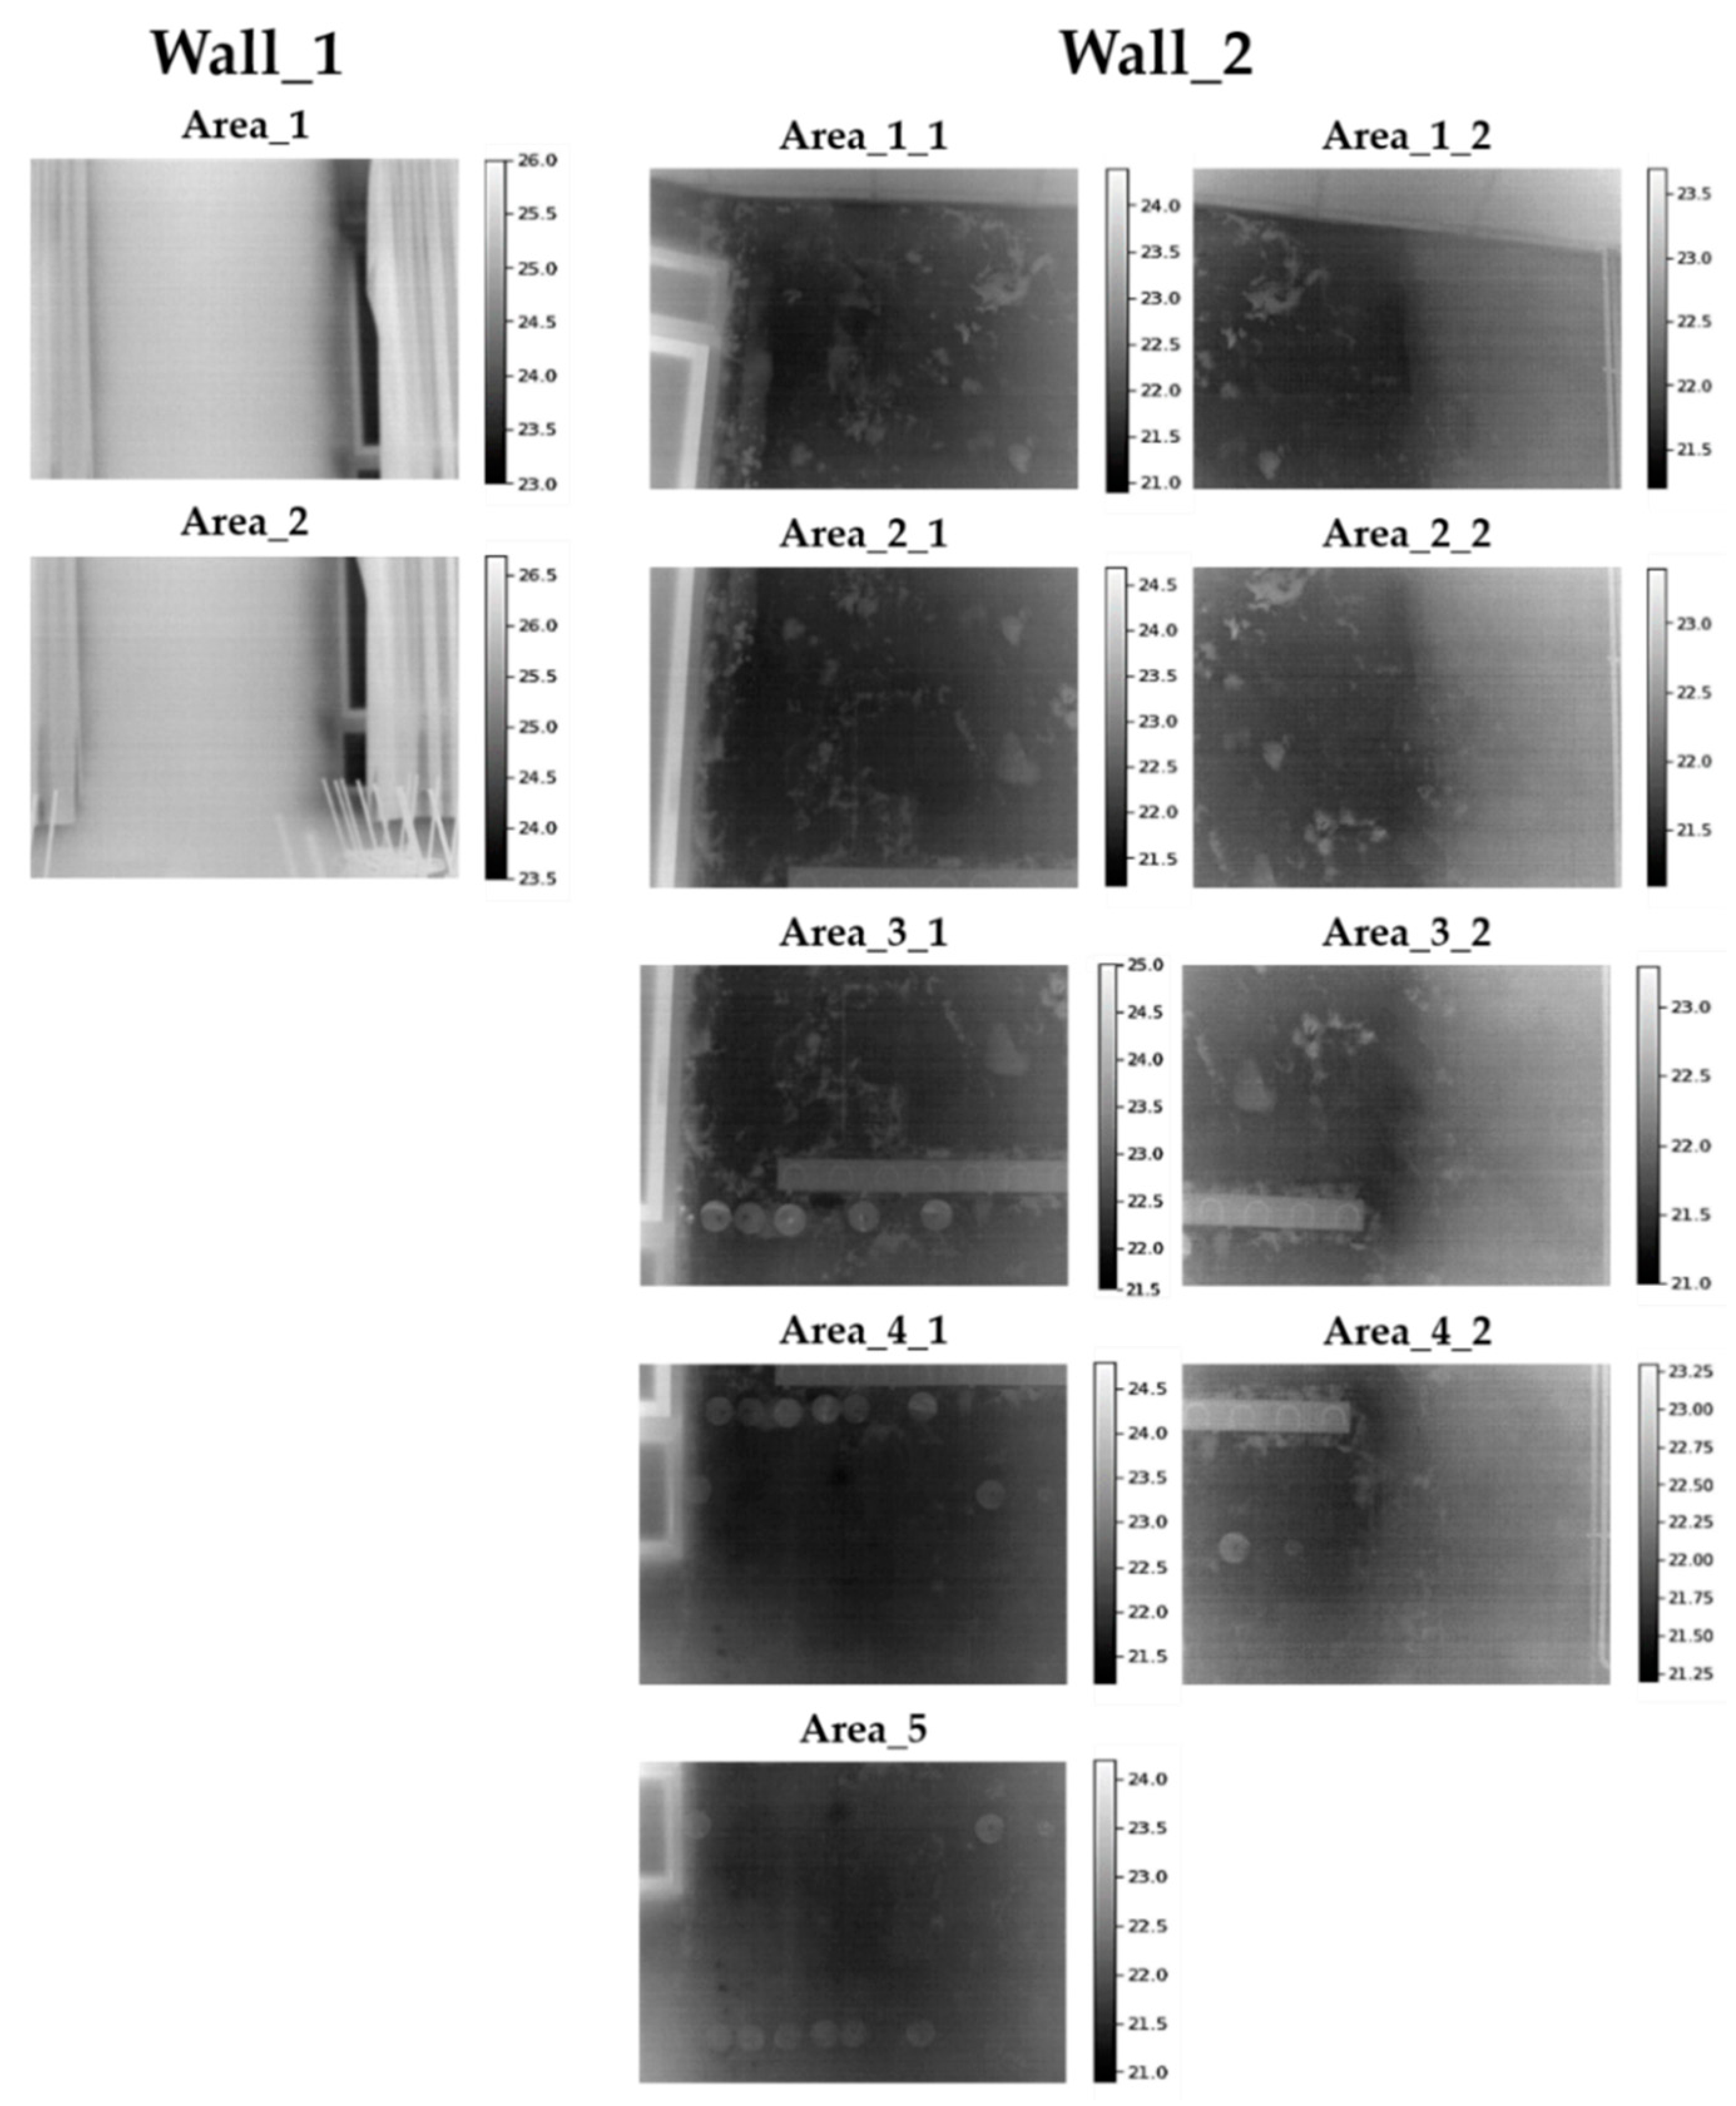
3.1. IRT Imaging and Data Interpretation
3.2. GPR Imaging and Data Interpretation
- 1
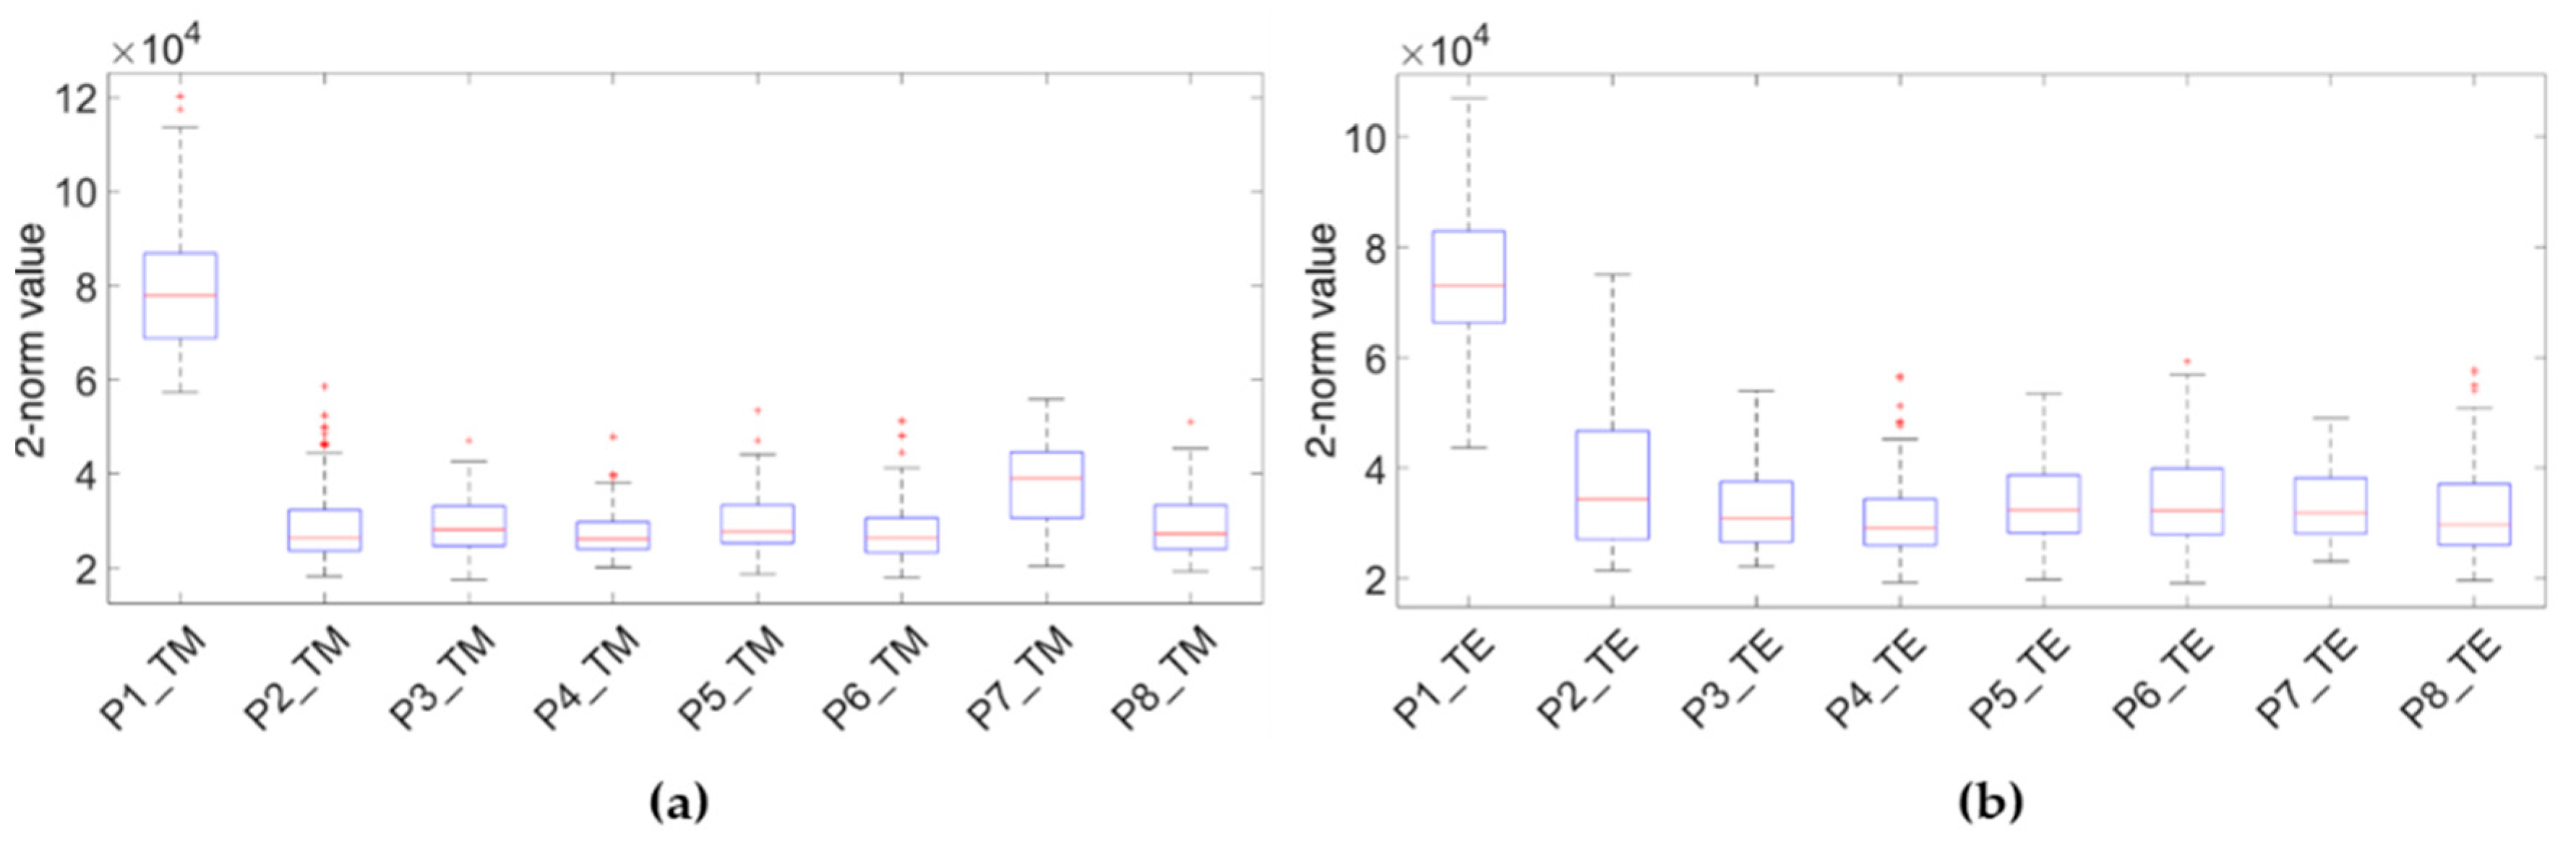
- The attenuation observed at the deeper layers of Wall_2 (Figure 18a).It is important to mention that moisture content causes a severe change in the dielectric properties of the materials, which leads to a decrease in the propagation velocity in the media and the subsequent signal attenuation. Observing the radargrams produced by Profile 2 (Figure 18a), the attenuation occurs at the external row of the double layer of ceramic bricks and render coat (from 4 to 6.5 ns). This interpretation is consistent with the results obtained in the boxplot (Figure 13), and it confirms that the value of the median of the 2-norm of the traces is lower in Wall_2 than in Wall_1 because of the attenuation produced by deeper moisture (there are no reflections in the coda).
- 2
- The high-amplitude values of the reflected signals in moisture areas (Figure 18b).The reflection occurs when the propagating EM radar wave encounters a discontinuity in the EM properties of the media. The strength or intensity (also called amplitude) of the reflected fields is proportional to the magnitude of the dielectric constant (permittivity) change, which is characterised by the Reflection Coefficient (RC). For a non-conductive medium and perpendicular incident wave, coming from an upper medium (1) and going to a lower medium (2), RC is expressed as:where Ɛ1 is the dielectric constant of the upper medium and Ɛ2 is the dielectric constant of the lower medium.The RC increases as the dielectric contrast increases, and it takes a value between −1 ≤ RC ≤ 1. Thus, the reflection will be better identified when the RC shows a higher value and, on the contrary, the reflection may not be recorded if the coefficient is too low. For a brick/water interface, with dielectric constants of 5 and 81 for clay and fresh water [70], respectively, the RC is ±0.6. Observing the graphics in Figure 18, moisture areas (white rectangles) show more prominent reflections with higher amplitude (a) and stronger spectrum (b).
- 3
- Looking for outliers deeper than ≈2.5 ns (the end of the interior bricklayer) (Figure 18c).Observing the outliers in Figure 18c, moisture areas (inside coloured rectangles) are identified from traces 0 to 10 and 20 to 60, although the highest moisture is represented as red colour (normalised amplitude value of the outliers close to 1) corresponding to the trace range from 30 to 45 (red rectangle in the TM configuration). The area having the most severe moisture interpreted is coincident with the EPS insulation boards (from 3 to 4 ns), but a low-severity moisture level is also deeply detected at the inner row of the double layer of ceramic bricks (from 4 to 5 ns).
3.3. IRT-GPR Combined Interpretation
3.4. Validation of IRT-GPR Interpretation
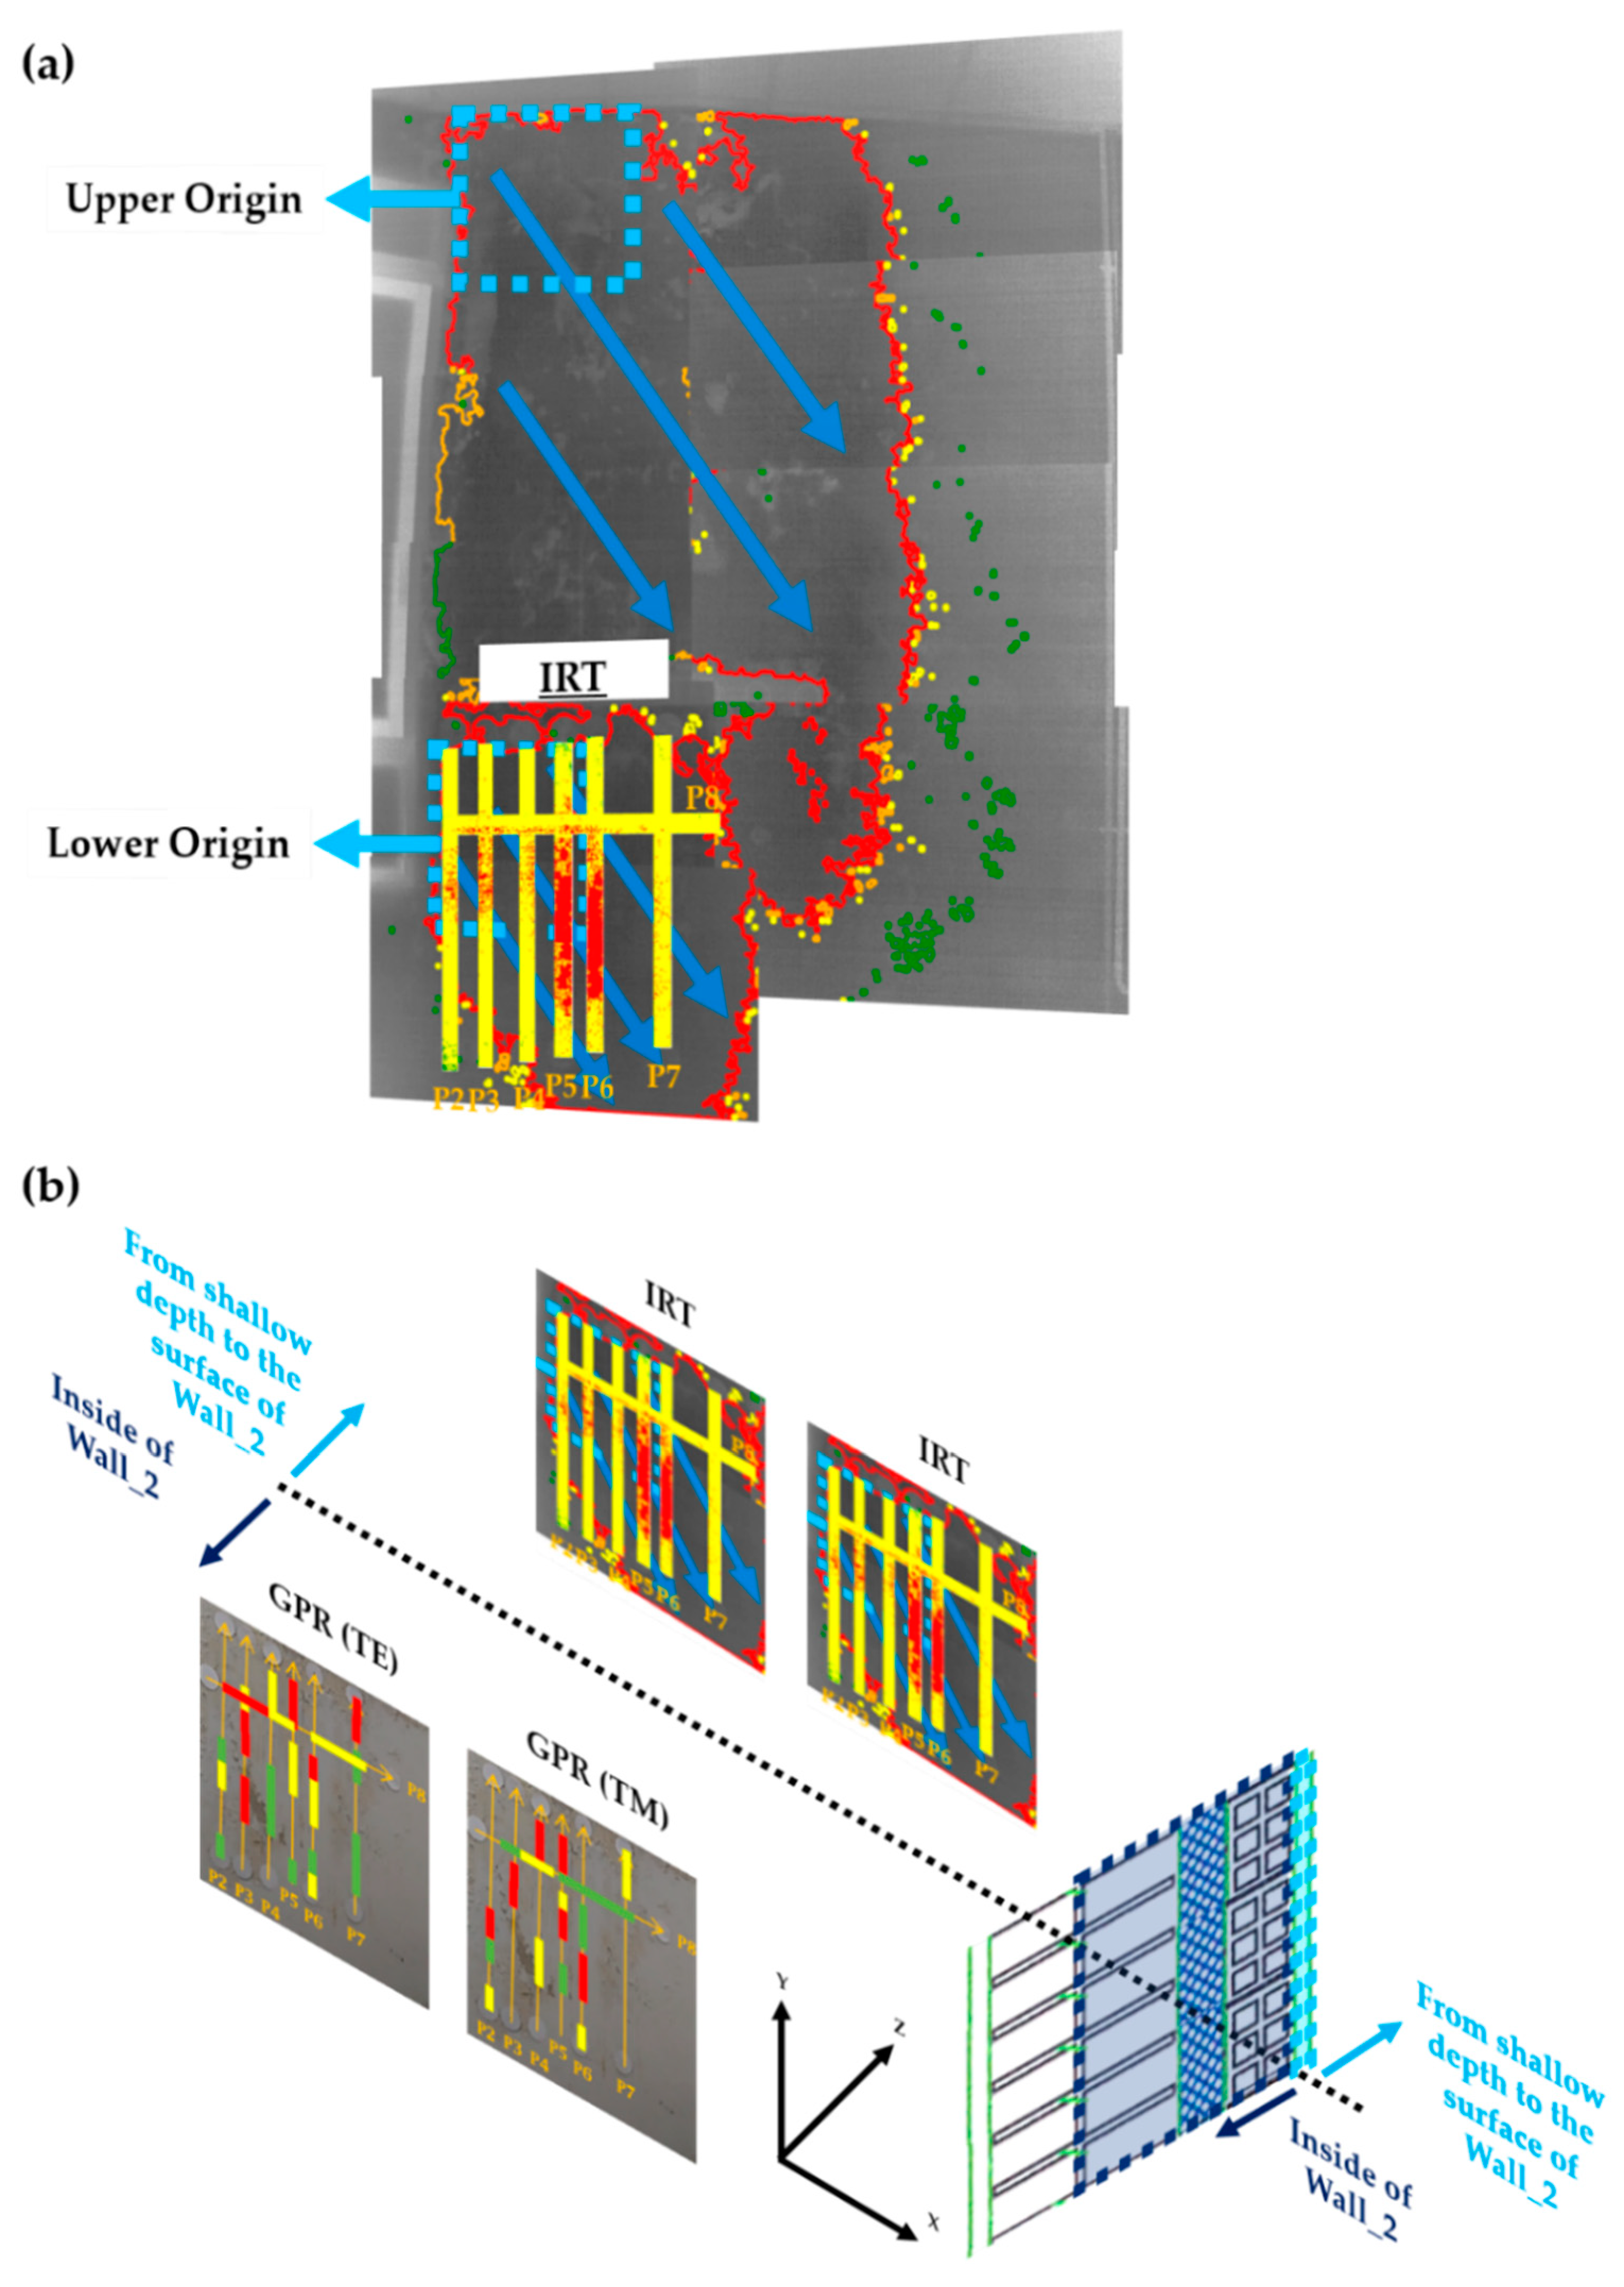
- 1
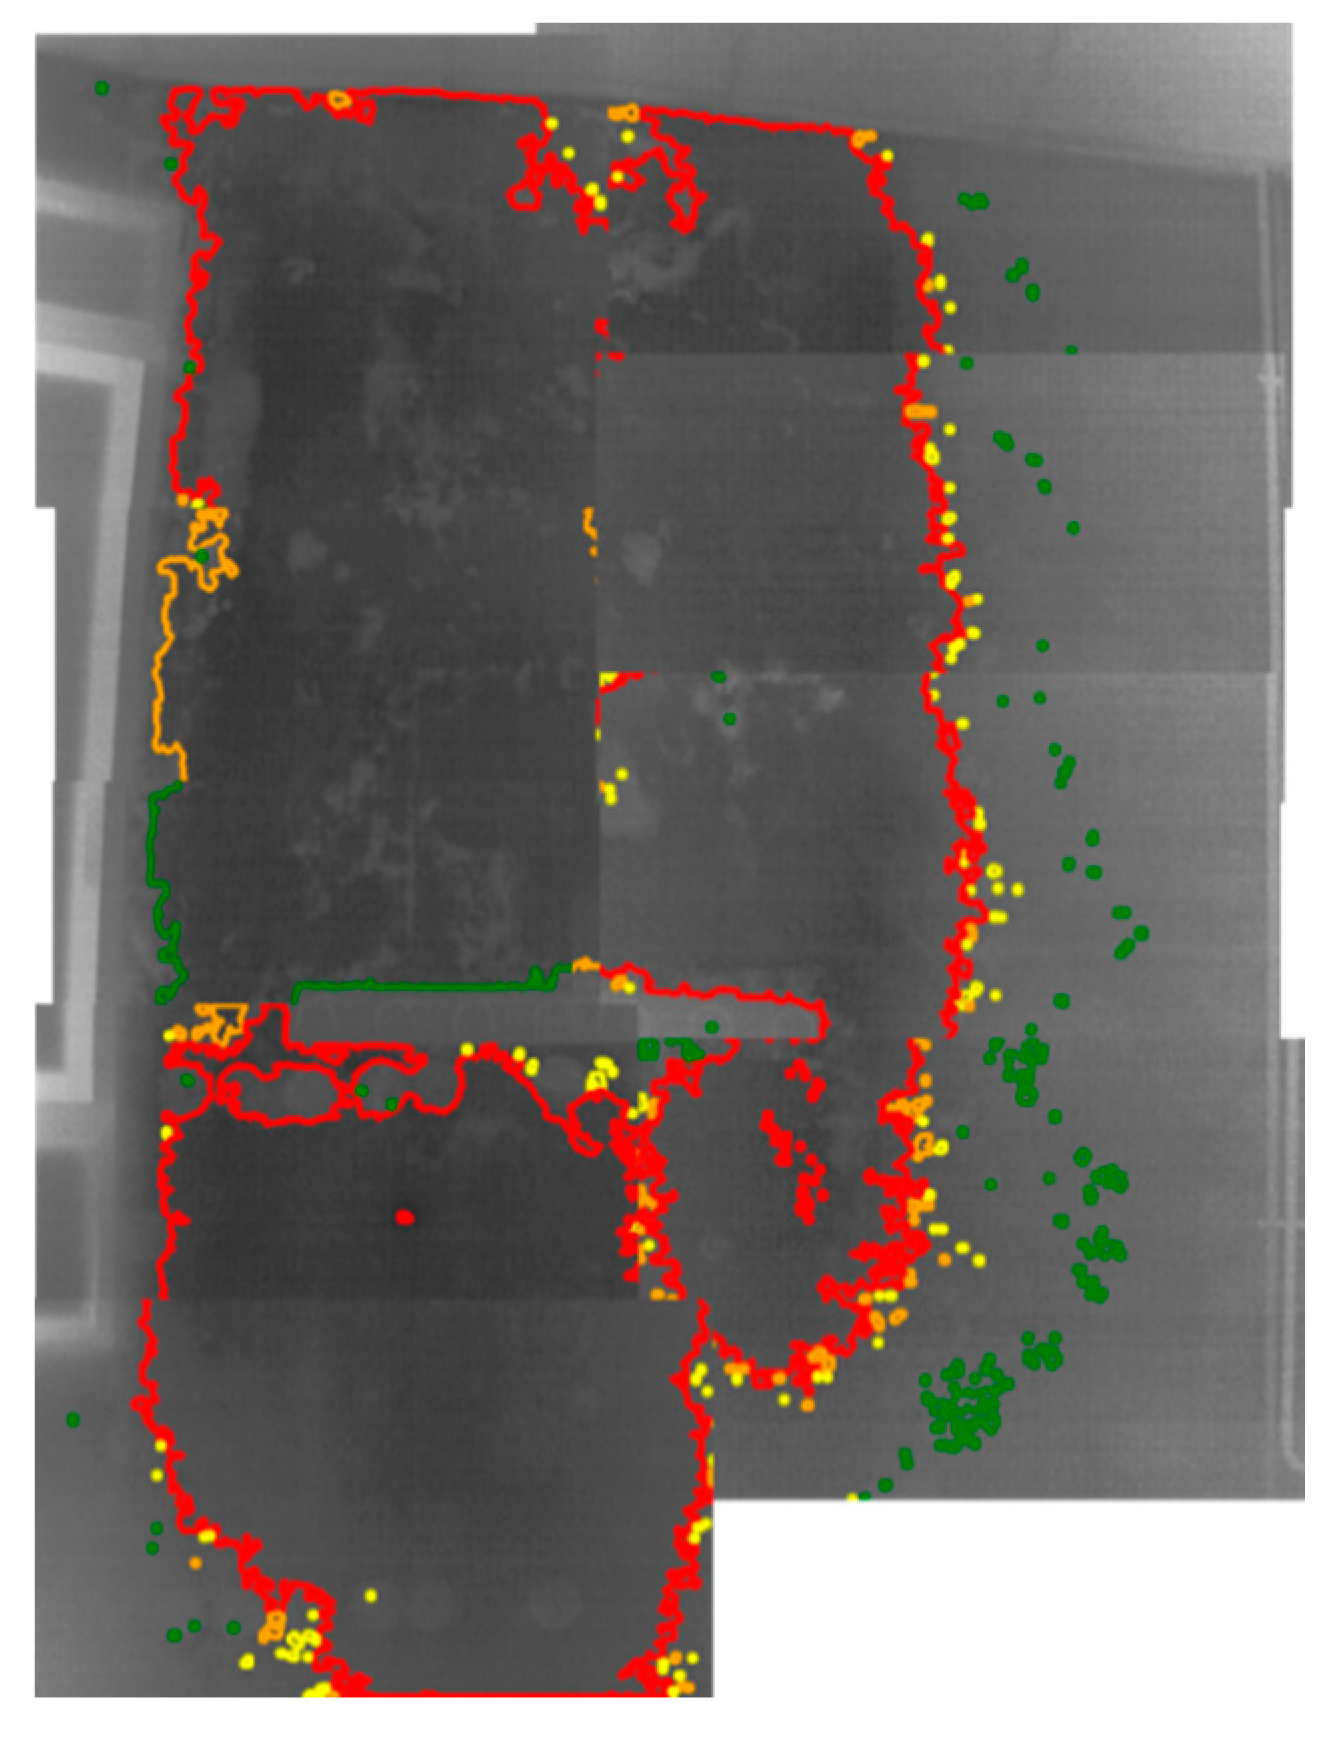
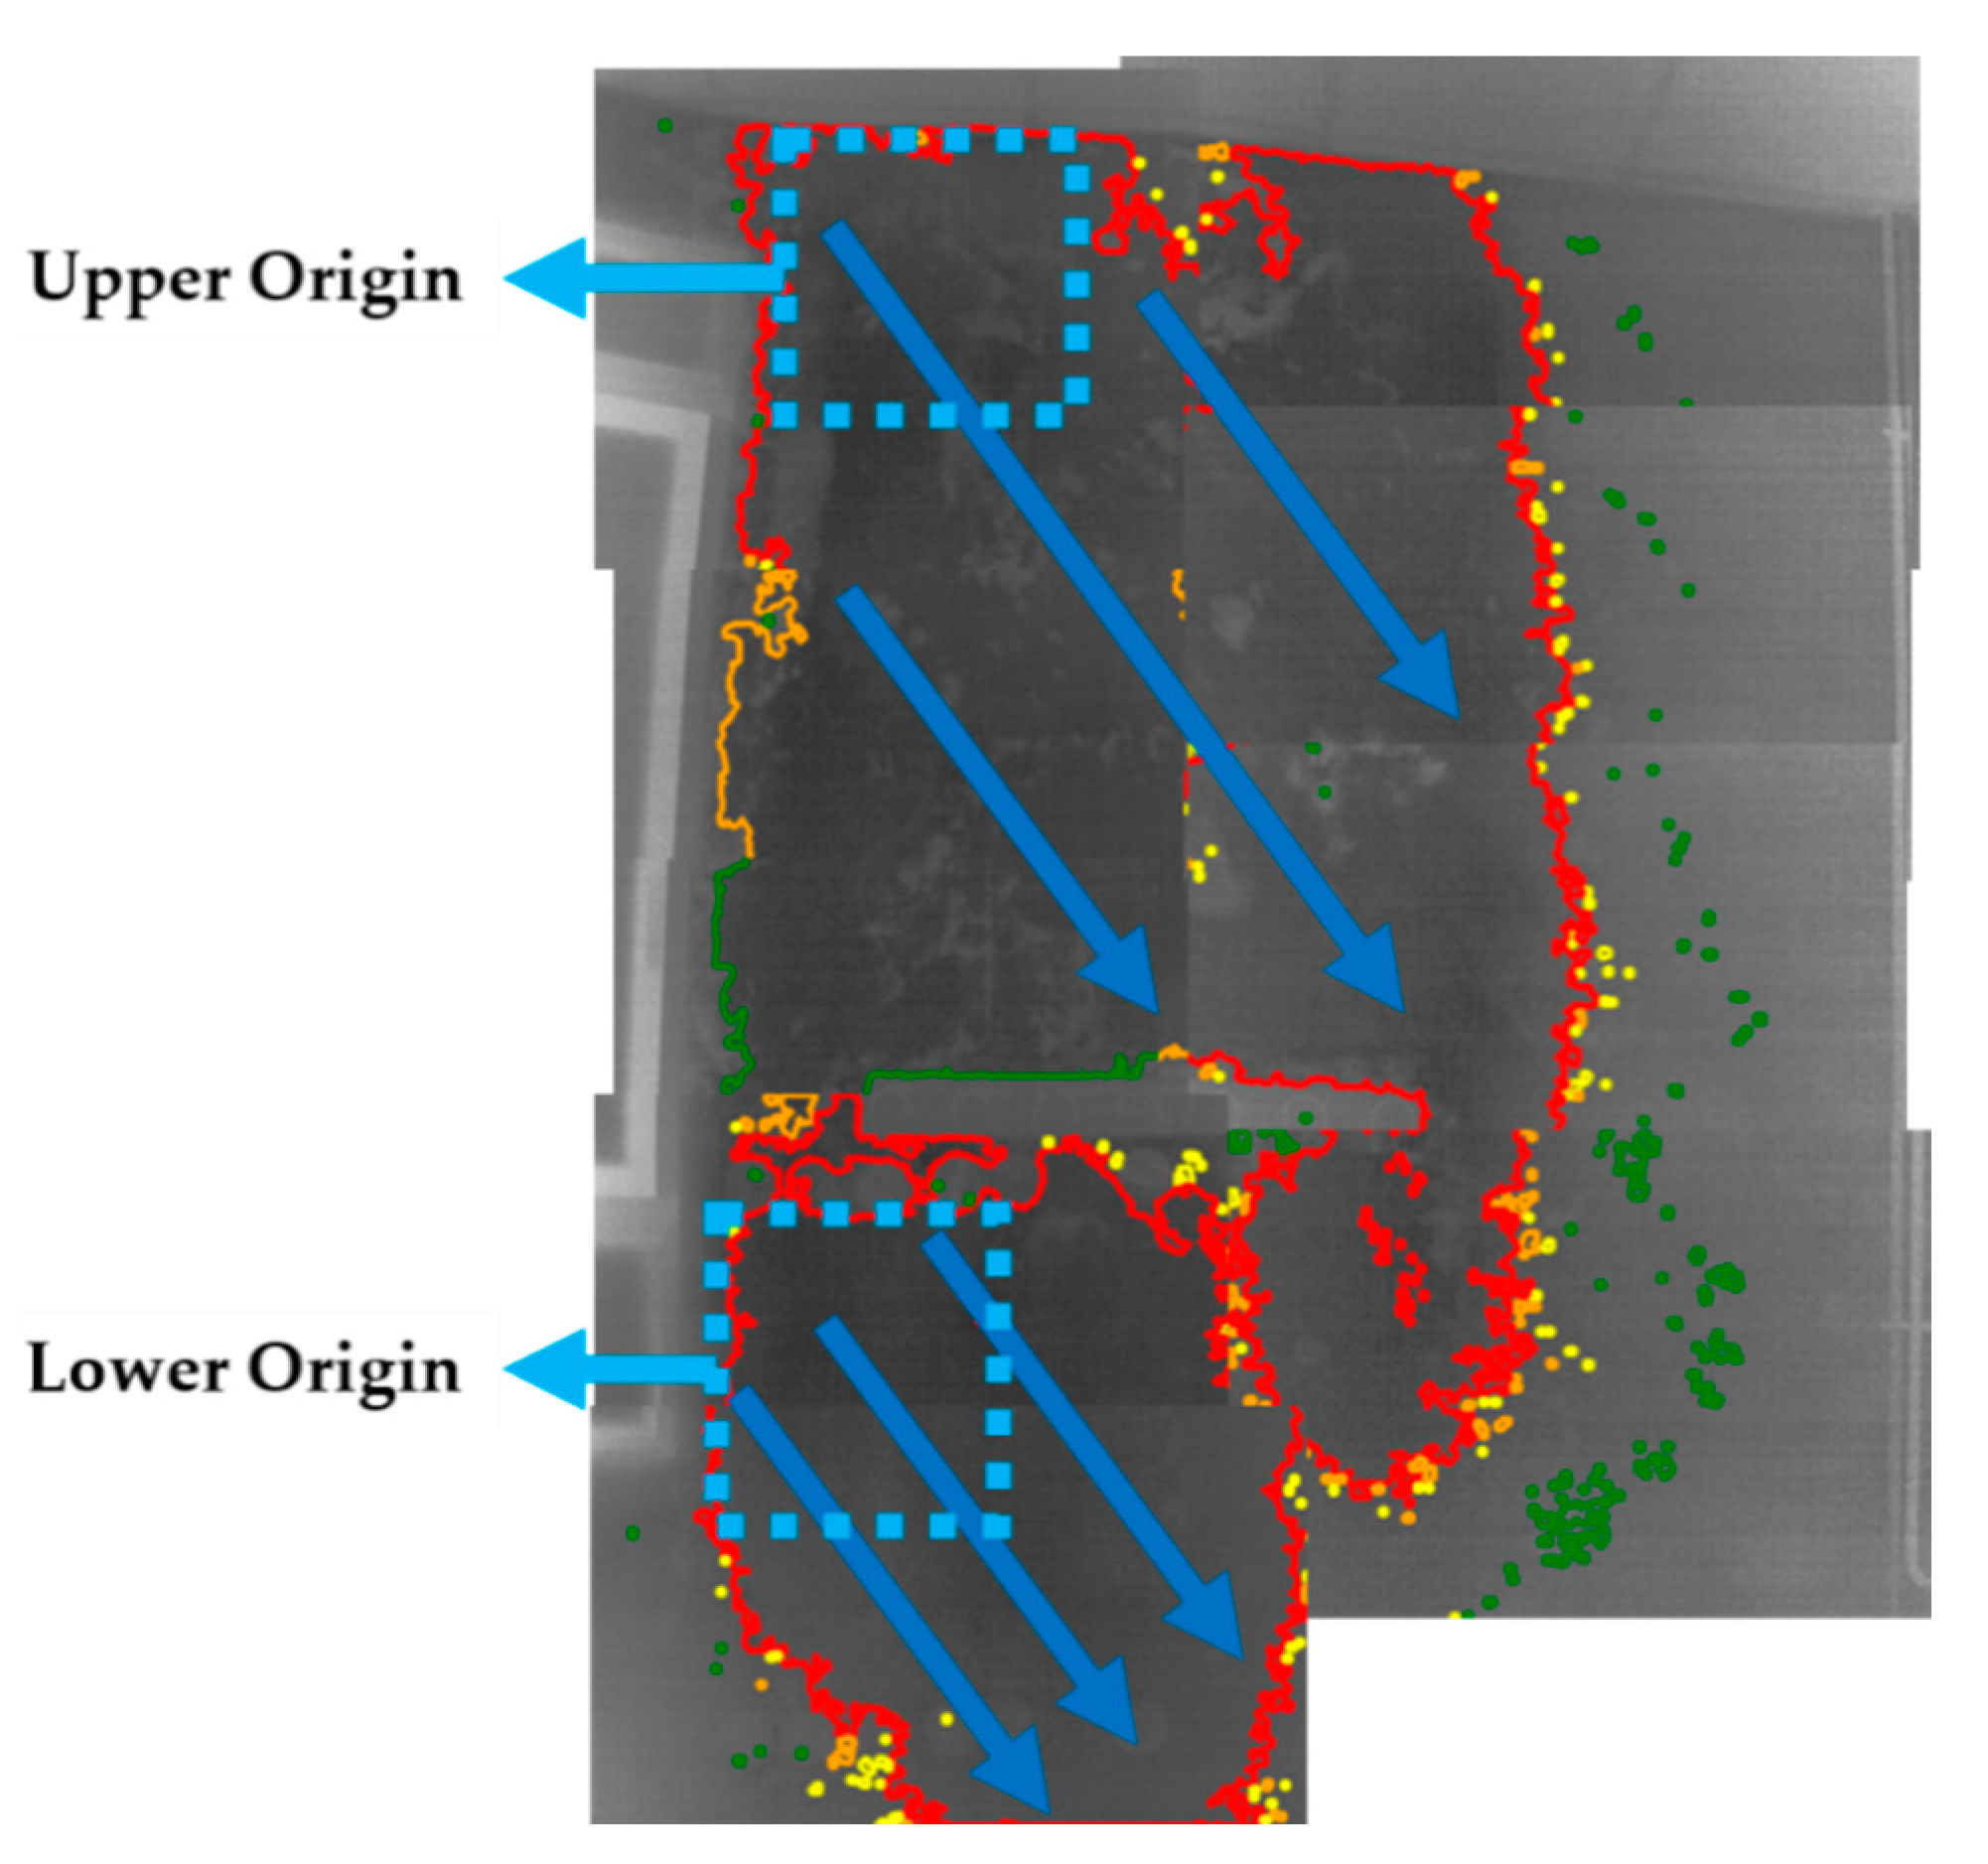
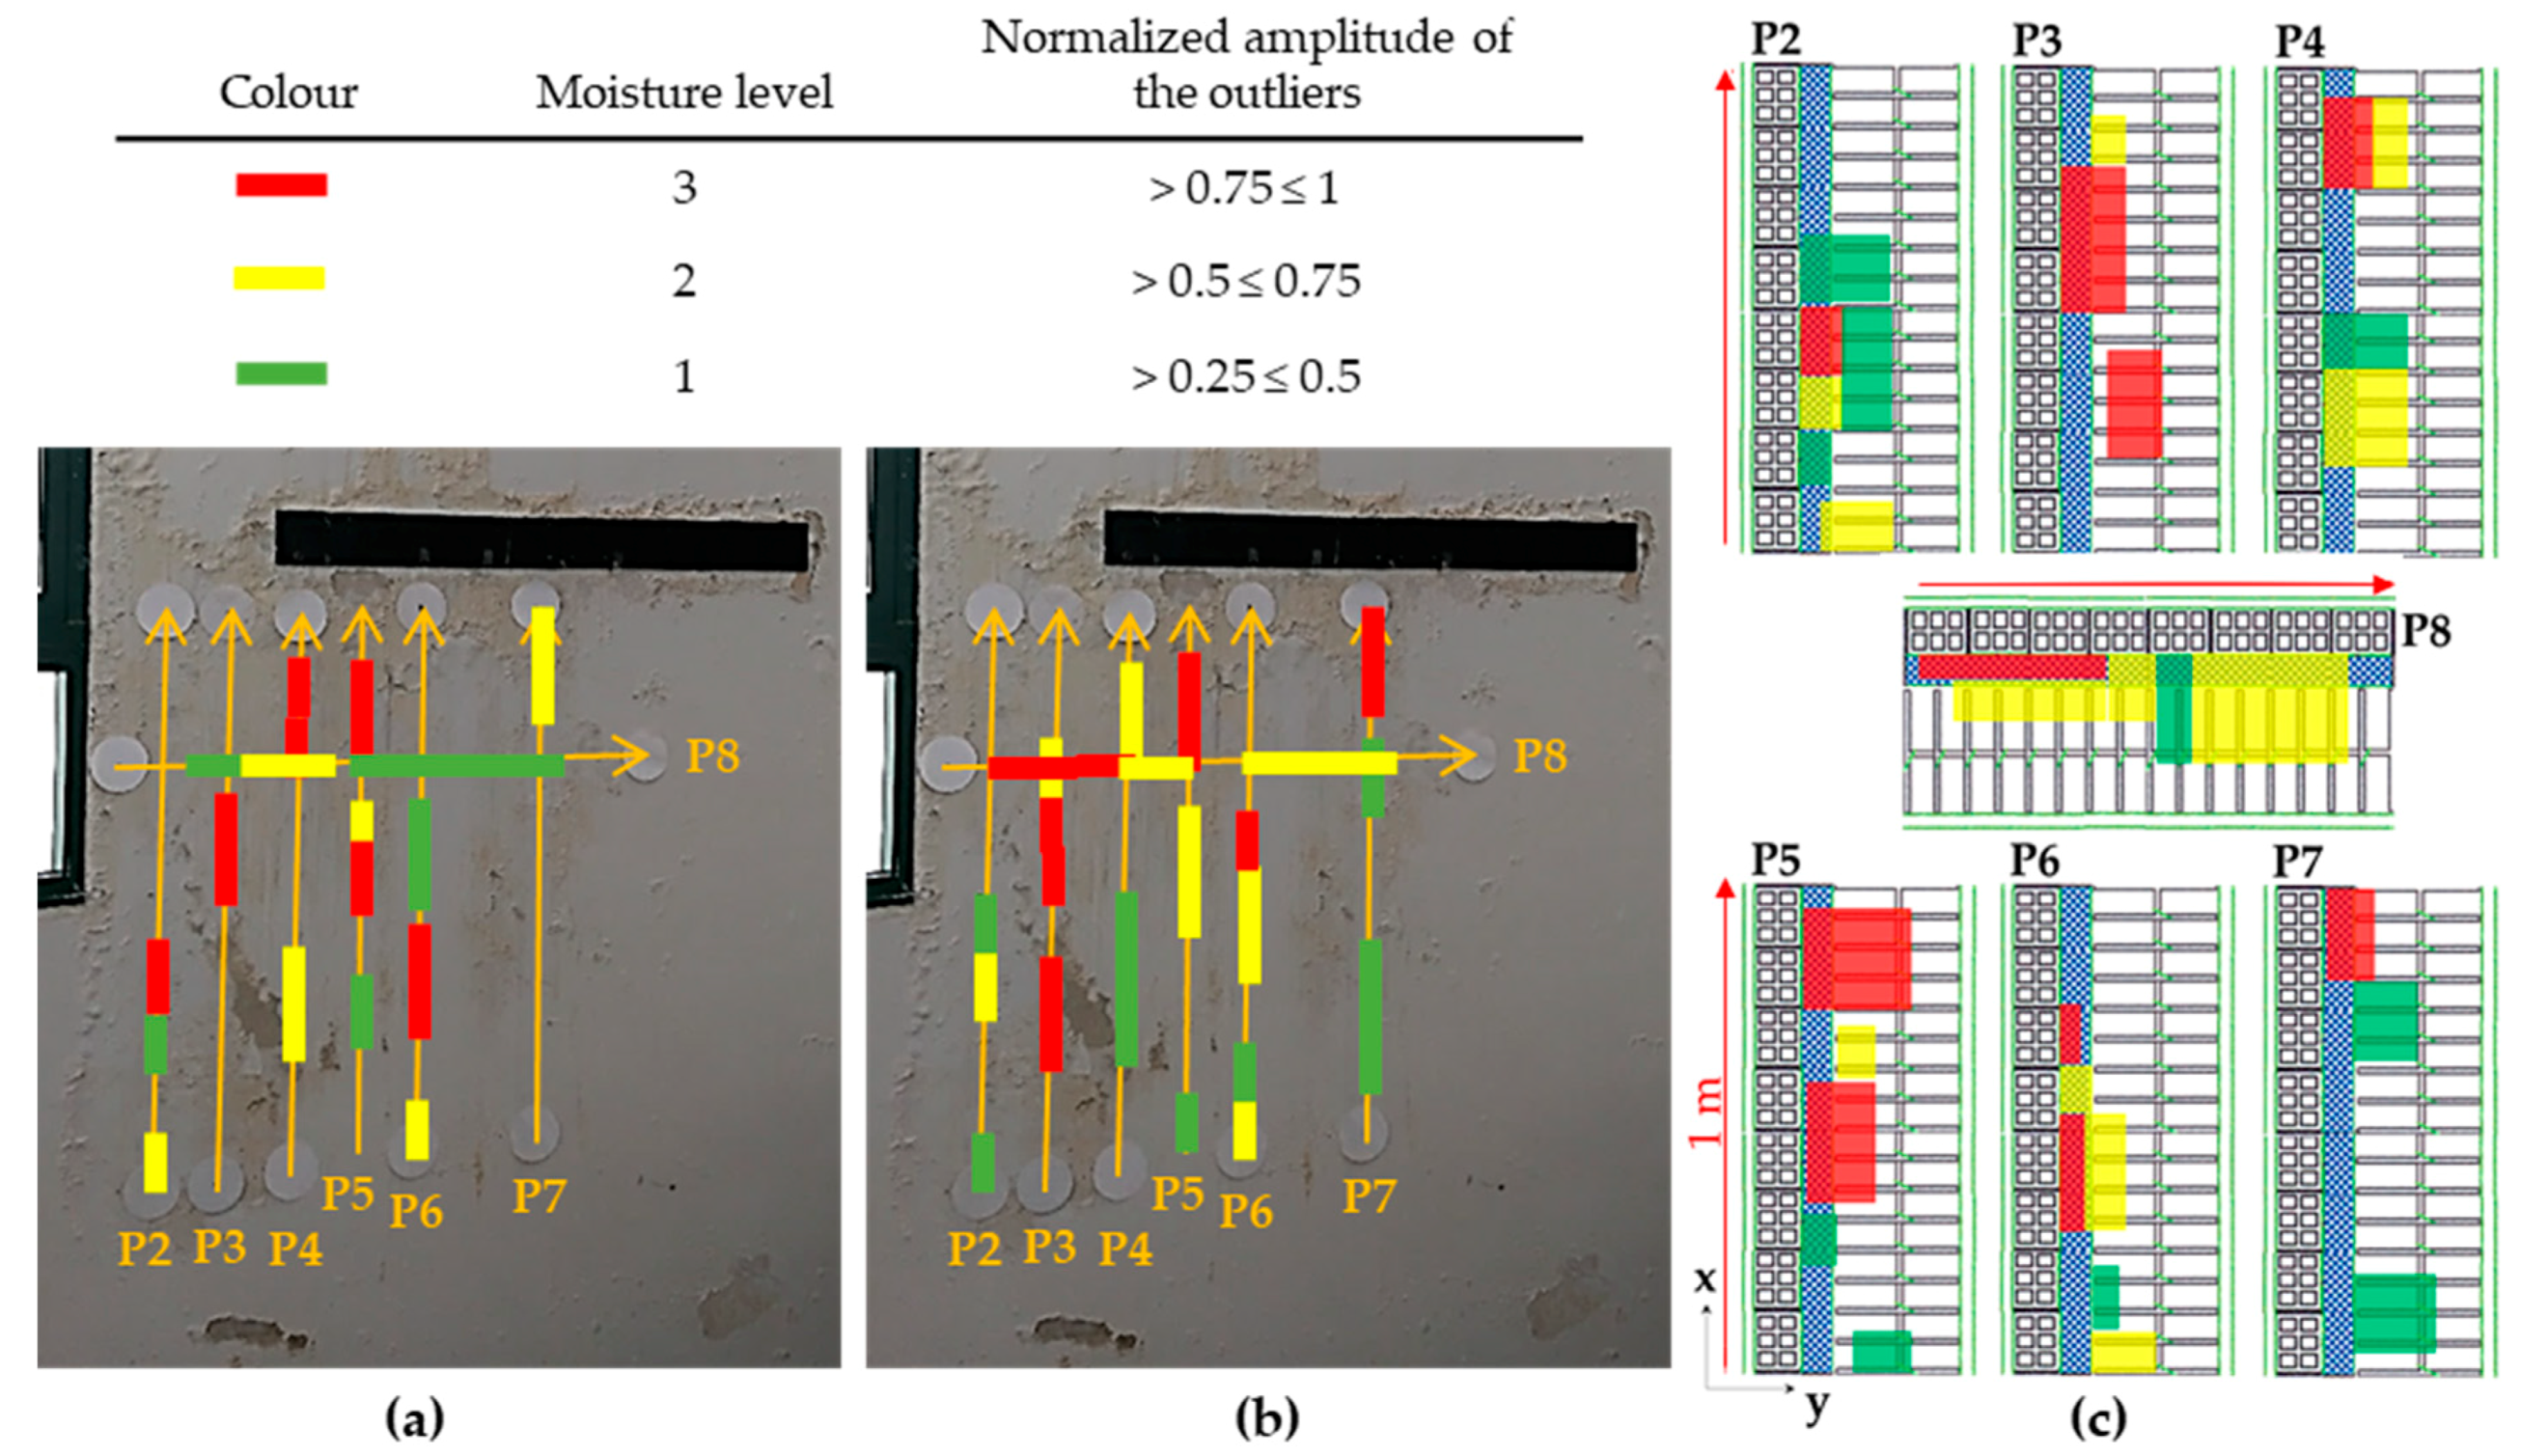
- The joints with the most visible detachment on the outside surface of Wall_2 (blue dashed line rectangles in Figure 28b) correspond to the ‘Upper Origin’ and ‘Lower Origin’ from the interior (Wall_2) with a slight difference in height (around 25 cm), being the joints above the interior detachment. Thus, the entry of water from the exterior to the interior can be deduced, which is in agreement with the porosity of the materials composing the wall, as seen in Figure 11c (from exterior to interior): ceramic bricks (porosity 33%), EPS (porosity 15%), and double-hollow bricks (porosity 45%) [71,72].
- 2
- By analysing the distribution of the degree of visible deterioration on the external surface of Wall_2, it is possible to confirm the circulation of water downwards by gravity and to the right (seen from the interior). The existence of two movements of water from different origins, being Profile 6 the border, is also confirmed.
4. Conclusions
- The superficial water distribution is determined from the analysis of the shape of the superficial moisture areas (delimited contours) and from the severity levels defined by IRT.
- The internal accumulation of water is estimated from the analysis of traces with stronger and prominent reflections (position and depth) in the radargrams (GPR), as well as from the severity levels defined by the normalised amplitude value of the radargram outliers.
- The relative water depth inside Wall_2. Moisture areas having similar levels of moisture severity with both IRT and GPR are interpreted as having lower water depth (depth region where both techniques show some overlapping in penetration).
- The displacement of moisture between the inside and the surface of Wall_2 (comparing the most severe moisture detected with IRT and GPR). With the support of photography from the outside surface of Wall_2, it was possible to estimate that water enters from the outside through two joints, rising slightly and moving to the right (seen from interior) due to a possible higher porosity in those zones. Furthermore, it has been understood that water also moves downwards due to the effect of gravity.
Author Contributions
Funding
Acknowledgments
Conflicts of Interest
References
- ISO 19345-1:2019(en), Petroleum and Natural Gas Industry—Pipeline Transportation Systems—Pipeline Integrity Management Specification—Part 1: Full-Life Cycle Integrity Management for Onshore Pipeline. Available online: https://www.iso.org/obp/ui#iso:std:iso:19345:-1:ed-1:v1:en:term:3.1.29 (accessed on 16 October 2020).
- ISO 11484:2019(en), Steel Products—Employer’s Qualification System for Non-Destructive Testing (NDT) Personnel. Available online: https://www.iso.org/obp/ui#iso:std:iso:11484:ed-3:v1:en:term:3.13 (accessed on 16 October 2020).
- ASTM E1316-20a Standard Terminology for Nondestructive Examinations. Available online: https://www.astm.org/Standards/E1316.htm (accessed on 16 October 2020).
- Moropoulou, A.; Labropoulos, K.C.; Delegou, E.T.; Karoglou, M.; Bakolas, A. Non-destructive techniques as a tool for the protection of built cultural heritage. Constr. Build. Mater. 2013, 48, 1222–1239. [Google Scholar] [CrossRef]
- Li, Q.; Ren, S. A real-time visual inspection system for discrete surface defects of rail heads. IEEE Trans. Instrum. Meas. 2012, 61, 2189–2199. [Google Scholar] [CrossRef]
- Rymarczyk, T.; Kłosowski, G.; Kozłowski, E. A Non-Destructive System Based on Electrical Tomography and Machine Learning to Analyze the Moisture of Buildings. Sensors 2018, 18, 2285. [Google Scholar] [CrossRef] [PubMed]
- Guimarães, A.S.; Delgado, J.M.P.Q.; Azevedo, A.C.; de Freitas, V.P. Interface influence on moisture transport in buildings. Constr. Build. Mater. 2018, 162, 480–488. [Google Scholar] [CrossRef]
- Ren, P.; Feng, C.; Janssen, H. Hygric properties of porous building materials (V): Comparison of different methods to determine moisture diffusivity. Build. Environ. 2019, 164, 106344. [Google Scholar] [CrossRef]
- Hoła, A.; Sadowski, Ł. A method of the neural identification of the moisture content in brick walls of historic buildings on the basis of non-destructive tests. Autom. Constr. 2019, 106, 102850. [Google Scholar] [CrossRef]
- Hoła, A.; Matkowski, Z.; Hoła, J. Analysis of the Moisture Content of Masonry Walls in Historical Buildings Using the Basement of a Medieval Town Hall as an Example. In Procedia Engineering; Elsevier Ltd.: Amsterdam, The Netherlands, 2017; Volume 172, pp. 363–368. [Google Scholar]
- Teng, K.; Kot, P.; Muradov, M.; Shaw, A.; Hashim, K.; Gkantou, M.; Al-Shamma’a, A. Embedded Smart Antenna for Non-Destructive Testing and Evaluation (NDT&E) of Moisture Content and Deterioration in Concrete. Sensors 2019, 19, 547. [Google Scholar] [CrossRef]
- Lerones, P.M.; Vélez, D.O.; Rojo, F.G.; Gómez-García-Bermejo, J.; Casanova, E.Z. Moisture detection in heritage buildings by 3D laser scanning. Stud. Conserv. 2016, 61, 46–54. [Google Scholar] [CrossRef]
- Suchocki, C.; Katzer, J.; Rapiński, J. Terrestrial laser scanner as a tool for assessment of saturation and moisture movement in building materials. Period. Polytech. Civ. Eng. 2018, 62, 694–699. [Google Scholar] [CrossRef]
- Ruiz Valero, L.; Flores Sasso, V.; Prieto Vicioso, E. In situ assessment of superficial moisture condition in façades of historic building using non-destructive techniques. Case Stud. Constr. Mater. 2019, 10, e00228. [Google Scholar] [CrossRef]
- Meola, C.; Di Maio, R.; Roberti, N.; Carlomagno, G.M. Application of infrared thermography and geophysical methods for defect detection in architectural structures. Eng. Fail. Anal. 2005, 12, 875–892. [Google Scholar] [CrossRef]
- ISO 10878:2013(en), Non-Destructive Testing—Infrared Thermography—Vocabulary. Available online: https://www.iso.org/obp/ui/#iso:std:iso:10878:ed-1:v1:en:term:1.65 (accessed on 16 October 2020).
- Garrido, I.; Lagüela, S.; Arias, P. Infrared Thermography’s Application to Infrastructure Inspections. Infrastructures 2018, 3, 35. [Google Scholar] [CrossRef]
- Garrido, I.; Lagüela, S.; Otero, R.; Arias, P. Thermographic methodologies used in infrastructure inspection: A review—Post-processing procedures. Appl. Energy 2020, 266, 114857. [Google Scholar] [CrossRef]
- ASTM D6432-11 Standard Guide for Using the Surface Ground Penetrating Radar Method for Subsurface Investigation. Available online: https://www.aenor.com/normas-y-libros/buscador-de-normas/astm?c=077344 (accessed on 16 October 2020).
- Solla, M.; Lagüela, S.; Fernández, N.; Garrido, I. Assessing rebar corrosion through the combination of nondestructive GPR and IRT methodologies. Remote Sens. 2019, 11, 1705. [Google Scholar] [CrossRef]
- Puente, I.; Solla, M.; Lagüela, S.; Sanjurjo-Pinto, J. Reconstructing the Roman Site “Aquis Querquennis” (Bande, Spain) from GPR, T-LiDAR and IRT Data Fusion. Remote Sens. 2018, 10, 379. [Google Scholar] [CrossRef]
- Kylili, A.; Fokaides, P.A.; Christou, P.; Kalogirou, S.A. Infrared thermography (IRT) applications for building diagnostics: A review. Appl. Energy 2014, 134, 531–549. [Google Scholar] [CrossRef]
- Kirimtat, A.; Krejcar, O. A review of infrared thermography for the investigation of building envelopes: Advances and prospects. Energy Build. 2018, 176, 390–406. [Google Scholar] [CrossRef]
- Balaras, C.A.; Argiriou, A.A. Infrared thermography for building diagnostics. Energy Build. 2002, 34, 171–183. [Google Scholar] [CrossRef]
- Lucchi, E. Applications of the infrared thermography in the energy audit of buildings: A review. Renew. Sustain. Energy Rev. 2018, 82, 3077–3090. [Google Scholar] [CrossRef]
- Nardi, I.; Lucchi, E.; de Rubeis, T.; Ambrosini, D. Quantification of heat energy losses through the building envelope: A state-of-the-art analysis with critical and comprehensive review on infrared thermography. Build. Environ. 2018, 146, 190–205. [Google Scholar] [CrossRef]
- Barreira, E.; Almeida, R.M.S.F.L.; Simões, M.; Rebelo, D. Quantitative Infrared Thermography to Evaluate the Humidification of Lightweight Concrete. Sensors 2020, 20, 1664. [Google Scholar] [CrossRef] [PubMed]
- Garrido, I.; Lagüela, S.; Sfarra, S.; Madruga, F.J.; Arias, P. Automatic detection of moistures in different construction materials from thermographic images. J. Therm. Anal. Calorim. 2019, 138, 1649–1668. [Google Scholar] [CrossRef]
- Edis, E.; Flores-Colen, I.; de Brito, J. Quasi-quantitative infrared thermographic detection of moisture variation in facades with adhered ceramic cladding using principal component analysis. Build. Environ. 2015, 94, 97–108. [Google Scholar] [CrossRef]
- Lucchi, E.; Dias Pereira, L.; Andreotti, M.; Malaguti, R.; Cennamo, D.; Calzolari, M.; Frighi, V. Development of a Compatible, Low Cost and High Accurate Conservation Remote Sensing Technology for the Hygrothermal Assessment of Historic Walls. Electronics 2019, 8, 643. [Google Scholar] [CrossRef]
- Andreotti, M.; Calzolari, M.; Davoli, P.; Dias Pereira, L.; Lucchi, E.; Malaguti, R. Design and Construction of a New Metering Hot Box for the In Situ Hygrothermal Measurement in Dynamic Conditions of Historic Masonries. Energies 2020, 13, 2950. [Google Scholar] [CrossRef]
- Agliata, R.; Bogaard, T.A.; Greco, R.; Mollo, L.; Slob, E.C.; Steele-Dunne, S.C. Non-invasive estimation of moisture content in tuff bricks by GPR. Constr. Build. Mater. 2018, 160, 698–706. [Google Scholar] [CrossRef]
- Koyan, P.; Tronicke, J.; Allroggen, N.; Kathage, A.; Willmes, M. Estimating moisture changes in concrete using GPR velocity analysis: Potential and limitations. In Proceedings of the 2018 17th International Conference on Ground Penetrating Radar (GPR), Rapperswil, Switzerland, 18–21 June 2018; Institute of Electrical and Electronics Engineers Inc.: New York, NY, USA, 2018. [Google Scholar]
- Evans, R. Sustainable assessment of structures and materials using ground penetrating radar (GPR). In Contemporary Trends in the Regenerative and Sustainable Built Environment: Technical and Managerial Aspects; Nottingham Trent University: Nottingham, UK, 2015; pp. 77–87. ISBN 9780992887803. [Google Scholar]
- Leucci, G.; Masini, N.; Persico, R. Timefrequency analysis of GPR data to investigate the damage of monumental buildings. J. Geophys. Eng. 2012, 9, S81. [Google Scholar] [CrossRef]
- De Coster, A.; Pérez Medina, J.L.; Nottebaere, M.; Alkhalifeh, K.; Neyt, X.; Vanderdonckt, J.; Lambot, S. Towards an improvement of GPR-based detection of pipes and leaks in water distribution networks. J. Appl. Geophys. 2019, 162, 138–151. [Google Scholar] [CrossRef]
- Barraca, N.; Almeida, M.; Varum, H.; Almeida, F.; Matias, M.S. A case study of the use of GPR for rehabilitation of a classified Art Deco building: The InovaDomus house. J. Appl. Geophys. 2016, 127, 1–13. [Google Scholar] [CrossRef]
- Barone, P.; Ferrara, C. Non-Invasive Moisture Detection for the Preservation of Cultural Heritage. Heritage 2018, 1, 163–170. [Google Scholar] [CrossRef]
- Leppälä, A.; Hamrouche, R.; Saarenketo, T. Nondestructive moisture mapping from basement walls with high-frequency GPR. In Proceedings of the 2018 17th International Conference on Ground Penetrating Radar (GPR), Rapperswil, Switzerland, 18–21 June 2018; Institute of Electrical and Electronics Engineers Inc.: New York, NY, USA. [Google Scholar]
- Ferrara, C.; Matteo Barone, P. Detecting Moisture Damage in Archaeology and Cultural Heritage: A Brief Introduction. Int. J. Archaeol. 2015, 3, 57–61. [Google Scholar] [CrossRef]
- Matera, L.; Persico, R.; Geraldi, E.; Sileo, M.; Piro, S. GPR and IRT tests in two historical buildings in Gravina in Puglia. Geosci. Instrum. Method. Data Syst. 2016, 5, 541–550. [Google Scholar] [CrossRef]
- Lai, W.L.; Poon, C.S. Applications of Nondestructive Evaluation Techniques in Concrete Inspection. HKIE Trans. Hong Kong Inst. Eng. 2012, 19, 34–41. [Google Scholar] [CrossRef]
- Martínez-Garrido, M.I.; Fort, R.; Gómez-Heras, M.; Valles-Iriso, J.; Varas-Muriel, M.J. A comprehensive study for moisture control in cultural heritage using non-destructive techniques. J. Appl. Geophys. 2018, 155, 36–52. [Google Scholar] [CrossRef]
- Moropoulou, A.; Apostolopoulou, M.; Moundoulas, P.; Karoglou, M.; Delegou, E.; Lampropoulos, K.; Gritsopoulou, M.; Bakolas, A. The combination of ndts for the diagnostic study of historical buildings: The case of kaisariani monastery. In Proceedings of the 5th International Conference on Computational Methods in Structural Dynamics and Earthquake Engineering (COMPDYN 2015), Crete Island, Greece, 25–27 May 2015; Institute of Structural Analysis and Antiseismic Research School of Civil Engineering National Technical University of Athens (NTUA) Greece: Athens, Greece, 2015; pp. 2321–2336. [Google Scholar]
- Nuzzo, L.; Calia, A.; Liberatore, D.; Masini, N.; Rizzo, E. Integration of ground-penetrating radar, ultrasonic tests and infrared thermography for the analysis of a precious medieval rose window. Adv. Geosci. 2010, 24, 69–82. [Google Scholar] [CrossRef]
- Piroddi, L.; Calcina, S.V.; Fiorino, D.R.; Grillo, S.; Trogu, A.; Vignoli, G. Geophysical and Remote Sensing Techniques for Evaluating Historical Stratigraphy and Assessing the Conservation Status of Defensive Structures Heritage: Preliminary Results from the Military Buildings at San Filippo Bastion, Cagliari, Italy; Springer: New York, NY, USA, 2020; pp. 944–959. [Google Scholar]
- To, R.A.V. Air-Coupled and Ground-Coupled Ground Penetrating Radar Techniques; Northeastern University: Boston, MA, USA, 2013. [Google Scholar]
- Aiello, G.; Marsella, E. Marine geophysics of the Naples Bay (Southern Tyrrhenian Sea, Italy): Principles, applications and emerging technologies. Geophys. Princ. Appl. Emerg. Technol. 2016, 1, 61–121. [Google Scholar]
- Garrido, I.; Lagüela, S.; Sfarra, S.; Arias, P. Development of Thermal Principles for the Automation of the Thermographic Monitoring of Cultural Heritage. Sensors 2020, 20, 3392. [Google Scholar] [CrossRef]
- Yehia, S.; Qaddoumi, N.; Farrag, S.; Hamzeh, L. Investigation of concrete mix variations and environmental conditions on defect detection ability using GPR. NDT E Int. 2014, 65, 35–46. [Google Scholar] [CrossRef]
- Gao, Y.; Tian, G.Y. Emissivity correction using spectrum correlation of infrared and visible images. Sens. Actuators A Phys. 2018, 270, 8–17. [Google Scholar] [CrossRef]
- Maierhofer, C. Nondestructive Evaluation of Concrete Infrastructure with Ground Penetrating Radar. J. Mater. Civ. Eng. 2003, 15, 287–297. [Google Scholar] [CrossRef]
- MD.E.1: Determination of Moisture Distribution and Level Using Radar in Masonry Built with Regular Units. Available online: https://www.rilem.net/images/publis/1768.pdf (accessed on 17 October 2020).
- Garrido, I.; Lagüela, S.; Otero, R.; Arias, P. Thermographic methodologies used in infrastructure inspection: A review—Data acquisition procedures. Infrared Phys. Technol. 2020, 111, 103481. [Google Scholar] [CrossRef]
- Plati, C.; Georgouli, K.; Loizos, A. Review of NDT assessment of road pavements using GPR. RILEM Bookseries 2012, 6, 855–860. [Google Scholar] [CrossRef]
- Tosti, F.; Gagliardi, V.; D’amico, F.; Alani, A.M. Transport infrastructure monitoring by data fusion of GPR and SAR imagery information. In Proceedings of the AIIT 2nd International Congress on Transport Infrastructure and Systems in a Changing World, Rome, Italy, 23–24 September 2019; Volume 45, pp. 771–778. [Google Scholar]
- González-Aguilera, D.; Rodriguez-Gonzalvez, P.; Armesto, J.; Lagüela, S. Novel approach to 3D thermography and energy efficiency evaluation. Energy Build. 2012, 54, 436–443. [Google Scholar] [CrossRef]
- Emissivity Coefficients Materials. Available online: https://www.engineeringtoolbox.com/emissivity-coefficients-d_447.html (accessed on 30 July 2020).
- Garrido, I.; Lagüela, S.; Sfarra, S.; Solla, M. Algorithms for the Automatic Detection and Characterization of Pathologies in Heritage Elements from Thermographic Images. In International Archives of the Photogrammetry, Remote Sensing and Spatial Information Sciences—ISPRS Archives; International Society for Photogrammetry and Remote Sensing: Hannover, Germany, 2019; Volume 42, pp. 497–501. [Google Scholar]
- de Oliveira, M.; Araujo, N.; da Silva, R.; da Silva, T.; Epaarachchi, J. Use of Savitzky–Golay Filter for Performances Improvement of SHM Systems Based on Neural Networks and Distributed PZT Sensors. Sensors 2018, 18, 152. [Google Scholar] [CrossRef]
- Haralick, R.M.; Sternberg, S.R.; Zhuang, X. Image Analysis Using Mathematical Morphology. IEEE Trans. Pattern Anal. Mach. Intell. 1987, PAMI-9, 532–550. [Google Scholar] [CrossRef]
- Riveiro, B.; Cubreiro, G.; Conde, B.; Cabaleiro, M.; Lindenbergh, R.; Soilán, M.; Caamaño, J.C. AUTOMATED CALIBRATION OF FEM MODELS USING LIDAR POINT CLOUDS. Int. Arch. Photogramm. Remote Sens. Spat. Inf. Sci. ISPRS Arch. 2018, 42, 969–974. [Google Scholar] [CrossRef]
- Infrared Emissivity Table | ThermoWorks. Available online: https://www.thermoworks.com/emissivity-table (accessed on 22 October 2020).
- Valores de Emisividad para Metales | Fluke Process Instruments. Available online: https://www.flukeprocessinstruments.com/es/service-and-support/knowledge-center/infrared-technology/emissivity-metals (accessed on 22 October 2020).
- Tavukçuoğlu, A.; Grinzato, E. Determination of critical moisture content in porous materials by ir thermography. Quant. Infrared Thermogr. J. 2006, 3, 231–245. [Google Scholar] [CrossRef]
- Grinzato, E.; Cadelano, G.; Bison, P. Moisture map by IR thermography. J. Mod. Opt. 2010, 57, 1770–1778. [Google Scholar] [CrossRef]
- Prego, F.J.; Solla, M.; Puente, I.; Arias, P. Efficient GPR data acquisition to detect underground pipes. NDT E Int. 2017, 91, 22–31. [Google Scholar] [CrossRef]
- Rasol, M.A.; Pérez-Gracia, V.; Solla, M.; Pais, J.C.; Fernandes, F.M.; Santos, C. An experimental and numerical approach to combine Ground Penetrating Radar and computational modeling for the identification of early cracking in cement concrete pavements. NDT E Int. 2020, 115, 102293. [Google Scholar] [CrossRef]
- ReflexW Manual. Available online: https://www.sandmeier-geo.de (accessed on 30 July 2020).
- Daniels, D.J. Ground Penetrating Radar. In Encyclopedia of RF and Microwave Engineering; John Wiley & Sons, Inc.: Hoboken, NJ, USA, 2005. [Google Scholar]
- Los materiales aislantes: La Porosidad—Reto KÖMMERLING. Available online: https://retokommerling.com/los-materiales-aislantes-la-porosidad (accessed on 28 October 2020).
- Meftah, R.; Van Stappen, J.; Berger, S.; Jacqus, G.; Laluet, J.Y.; Guering, P.H.; Van Hoorebeke, L.; Cnudde, V. X-ray computed tomography for characterization of expanded polystyrene (EPS) foam. Materials 2019, 12, 1944. [Google Scholar] [CrossRef] [PubMed]


| IRT Merits | GPR Merits | Common Merits |
|---|---|---|
|
|
| Model | NEC TH9260 |
| Sensor type | Uncooled focal plane array (μbolometer) |
| Thermal image/pixels | 640 (H) × 480 (V) |
| Resolution (°C) | 0.1 |
| Accuracy | ±2 °C or ±2% of reading, whichever is greater |
| Spectral ranges (μm) | 8 to14 |
| Filtering | 2300 MHz |
|---|---|
| Dewow | 0.5 ns |
| Gain function | Lineal: 1 Exponential: 1 |
| Subtracting average | 250 traces |
| Migration (Kirchhoff) | Velocity: 10.0 cm/ns (summation width: 5) |
| Profile | GPR Graphics Interpretation | |||
|---|---|---|---|---|
| (a) | (b) | (c) | Internal Moisture Interpretation | |
| Stronger Reflections in Trace-Ranges and Depth (ns): | Higher Spectrum in Trace-Ranges: | Value of Outliers: High (0.75–1), Medium (0.5–0.75) and Low (0.25–0.5) | ||
| P2 | TM = [0–10; <4.5 ns] and [20–45; <4.5 ns]; TE = [0–10; <4.5 ns] and [20–65; <4.5 ns] | TM = [0–10] and [20–45]; TE = [0–10] and [20–65] | High: TM = [30–45]. Medium: TM = [0–10]; TE = [25–45]. Low: TM = [15–30]; TE: [0–10] and [45–65] | High-severity moisture at the EPS layer with the TM mode. Areas with lower-severity level are also detected at the inner row of the ceramic bricks |
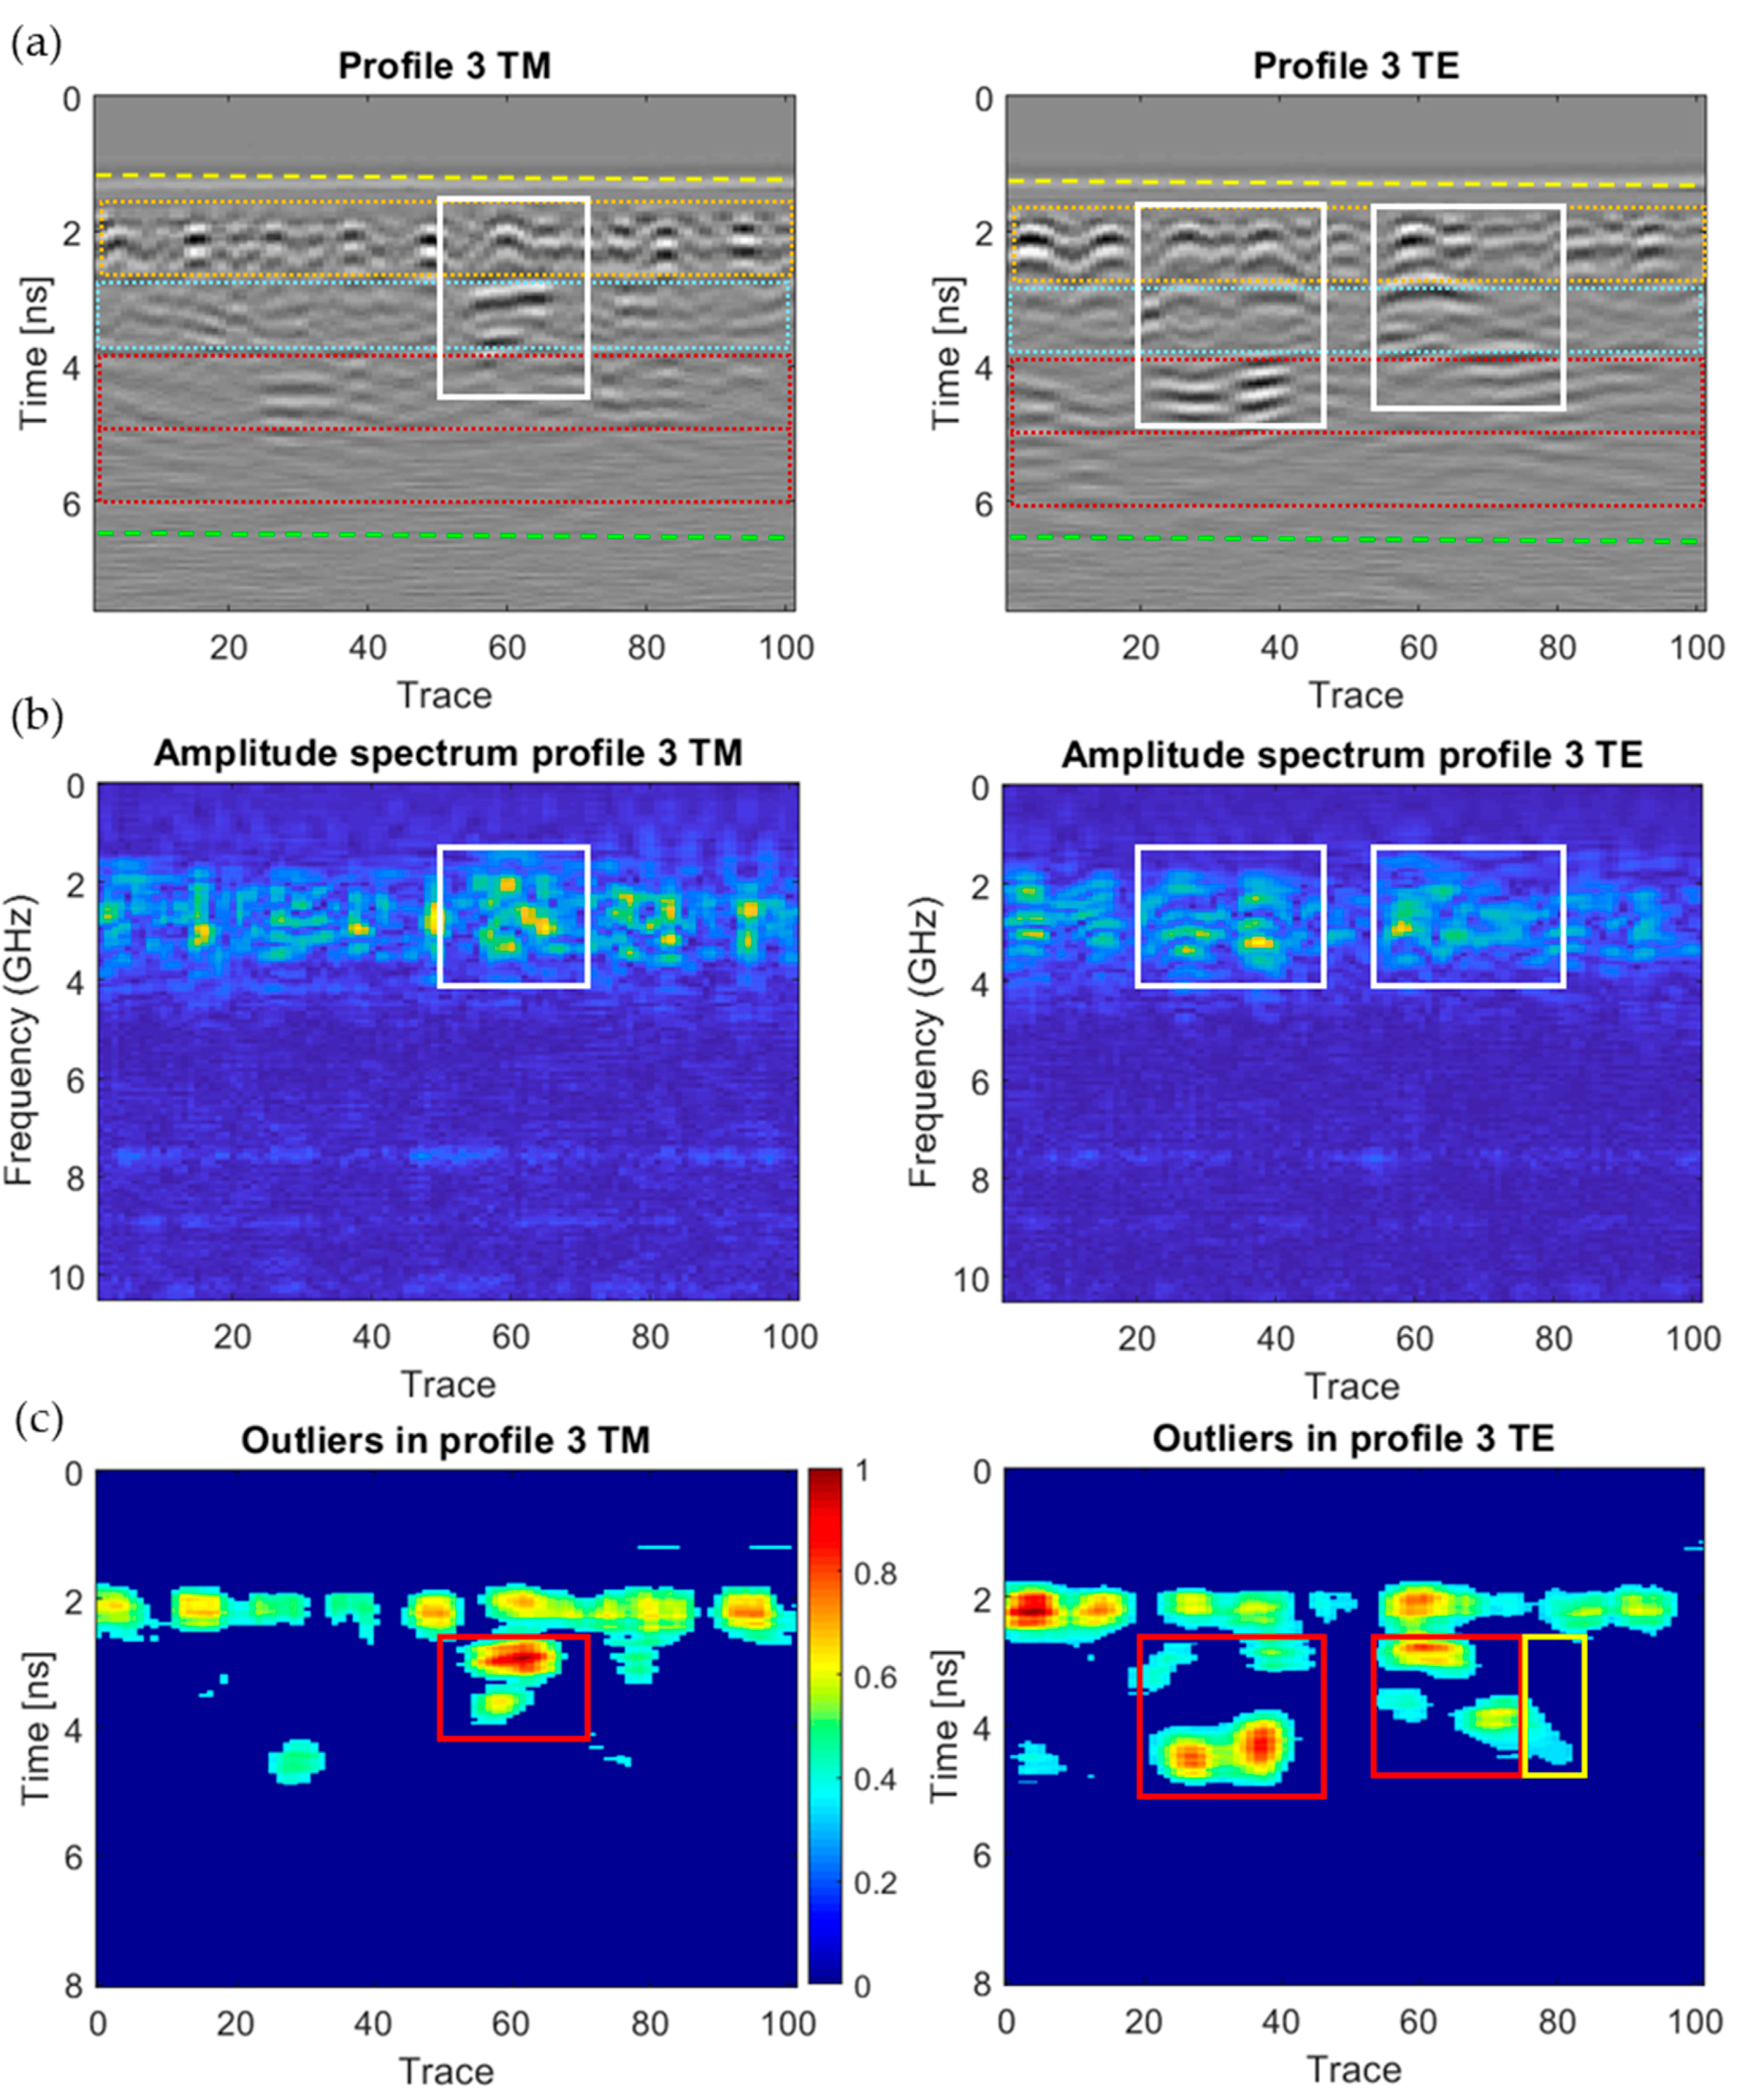
| P3 | TM = [50–70; <4 ns]; TE = [20–40; <5 ns] and [50–80; <4 ns] | TM = [50–70]; TE = [20–40] and [50–80] | High: TM = [50–70]; TE = [20–40] and [50–70]. Medium: TM = [70–80] | High-severity moisture: TM at the EPS layer; TE extended up to the inner row of the ceramic bricks |
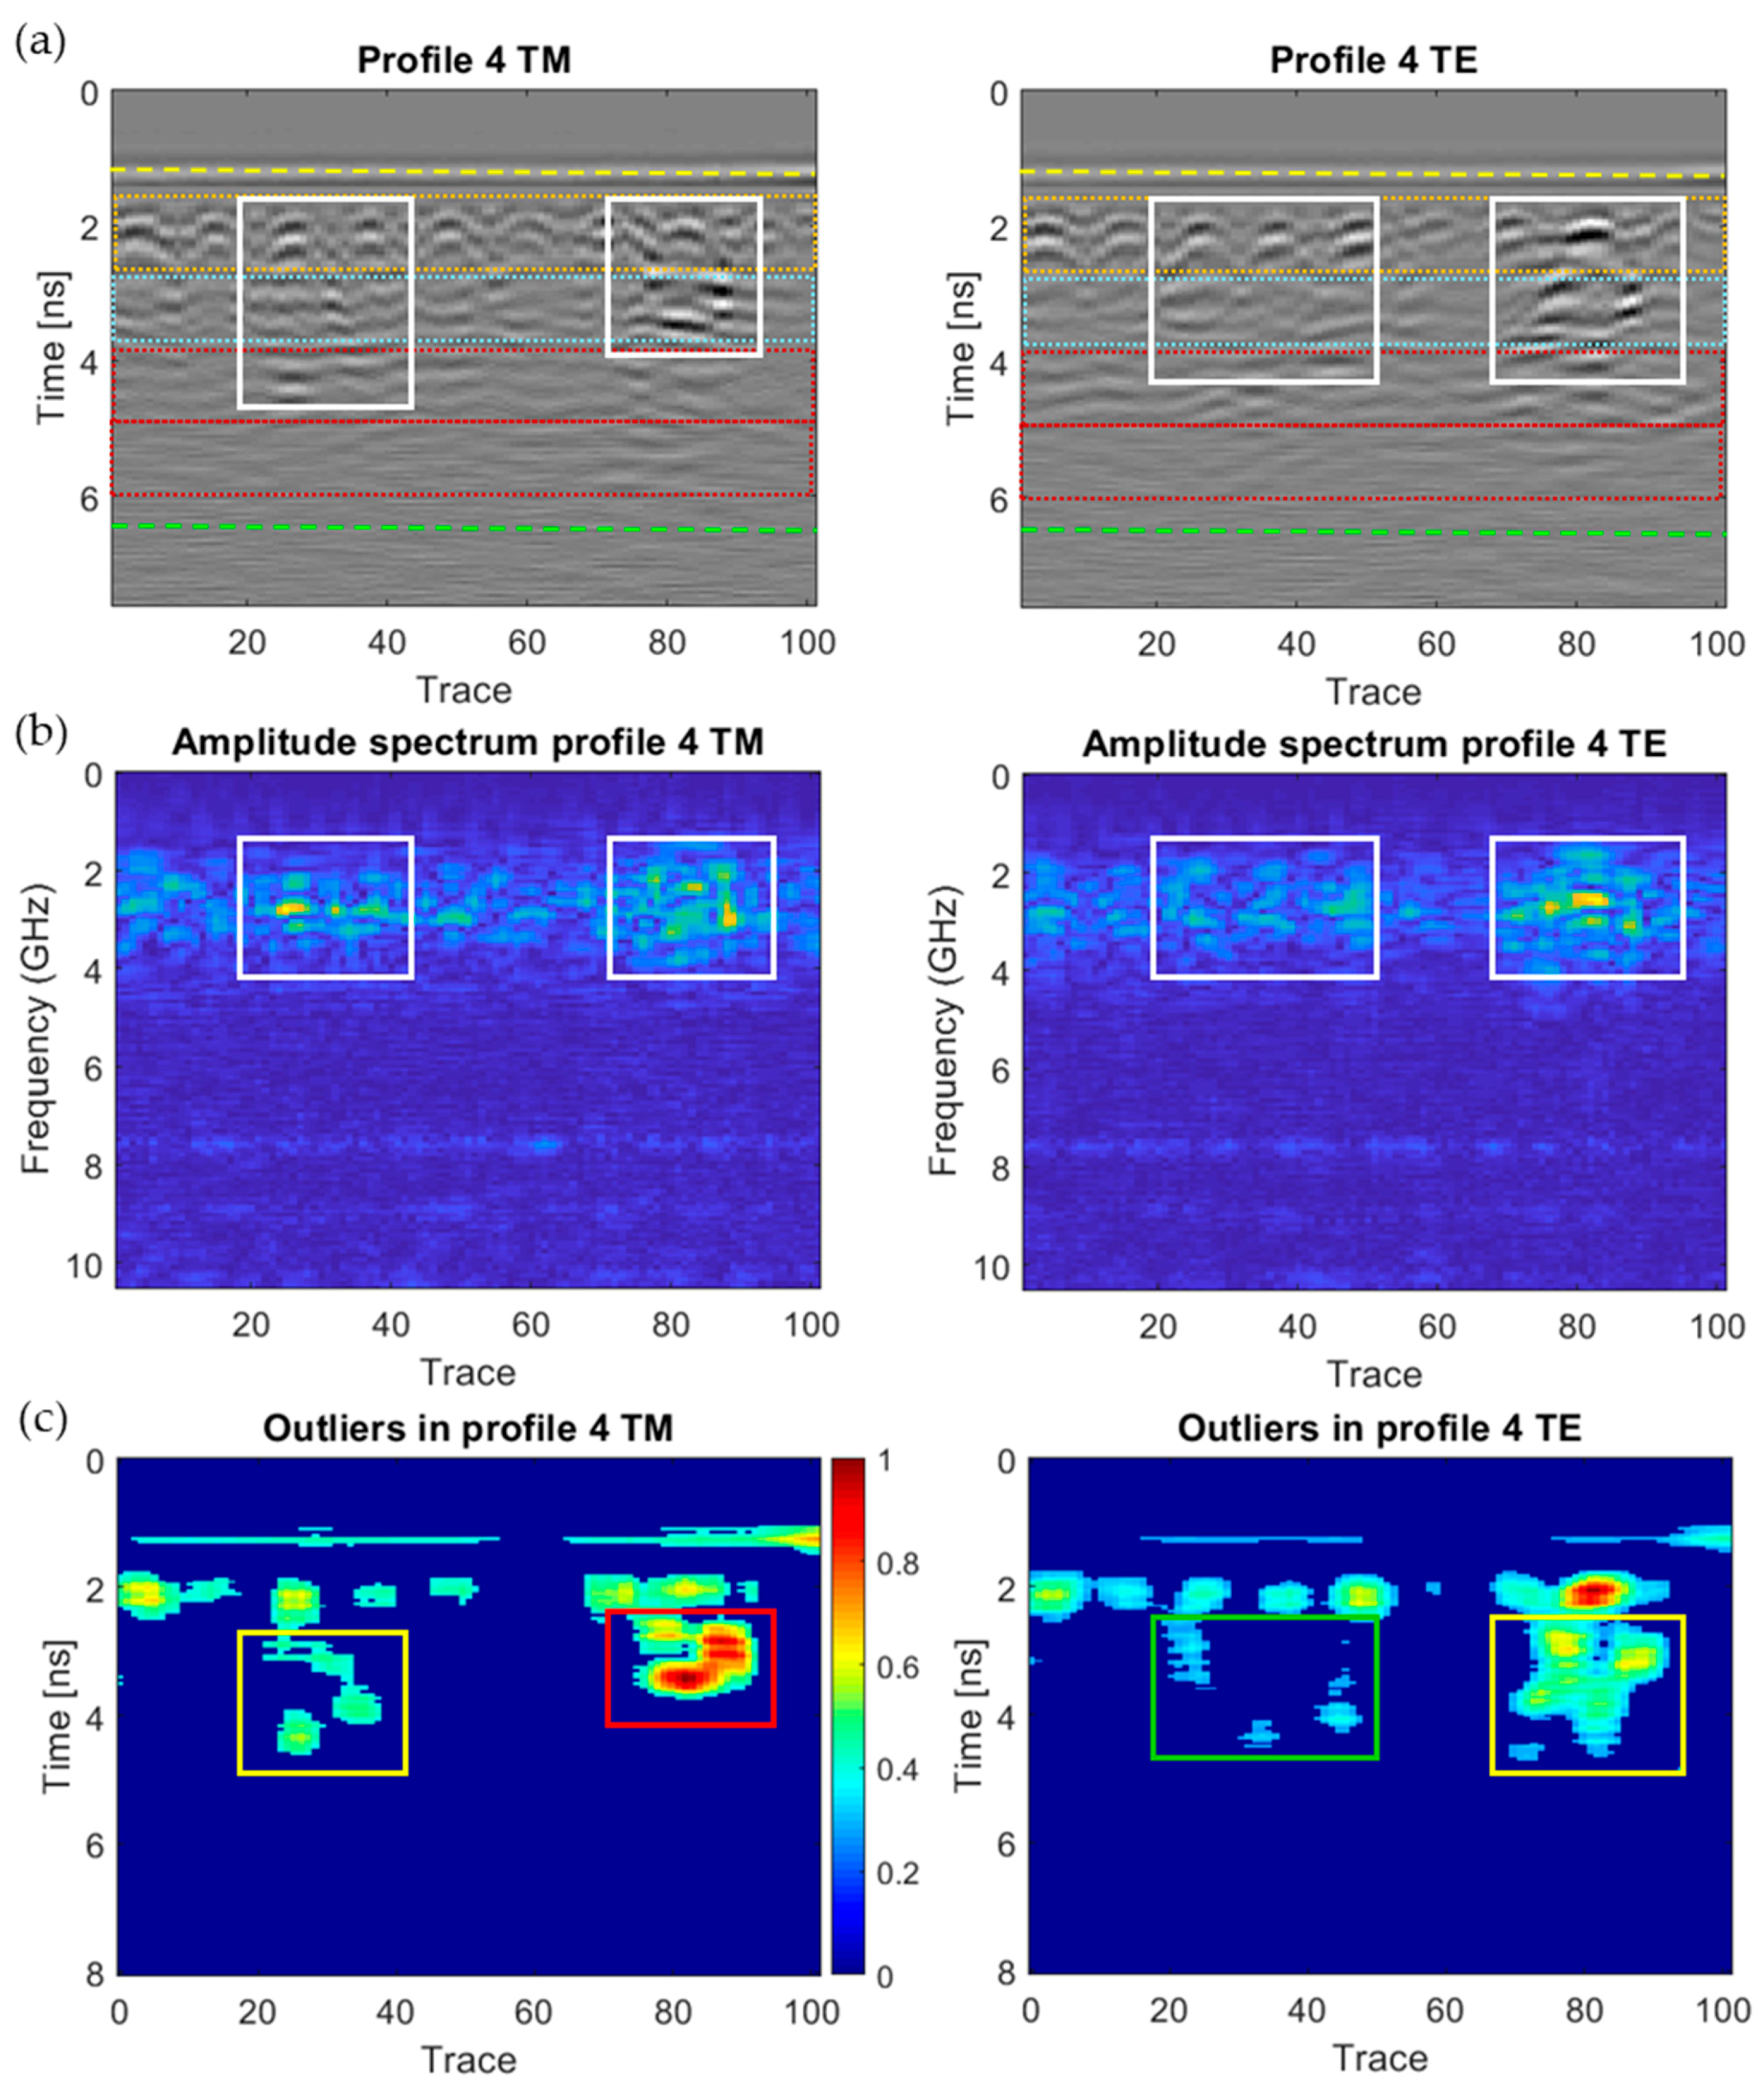
| P4 | TM = [20–40; <4.5 ns] and [70–90; <4 ns]; TE = [20–50; <4.5 ns] and [65–90; <4.5 ns] | TM = [20–40] and [70–90]; TE = [65–90] | High: TM = [70–90]. Medium: TM = [20–40]; TE = [70–90]. Low: TE = [20–50] | The most significant moisture (high values of outliers) is detected at the EPS layer |
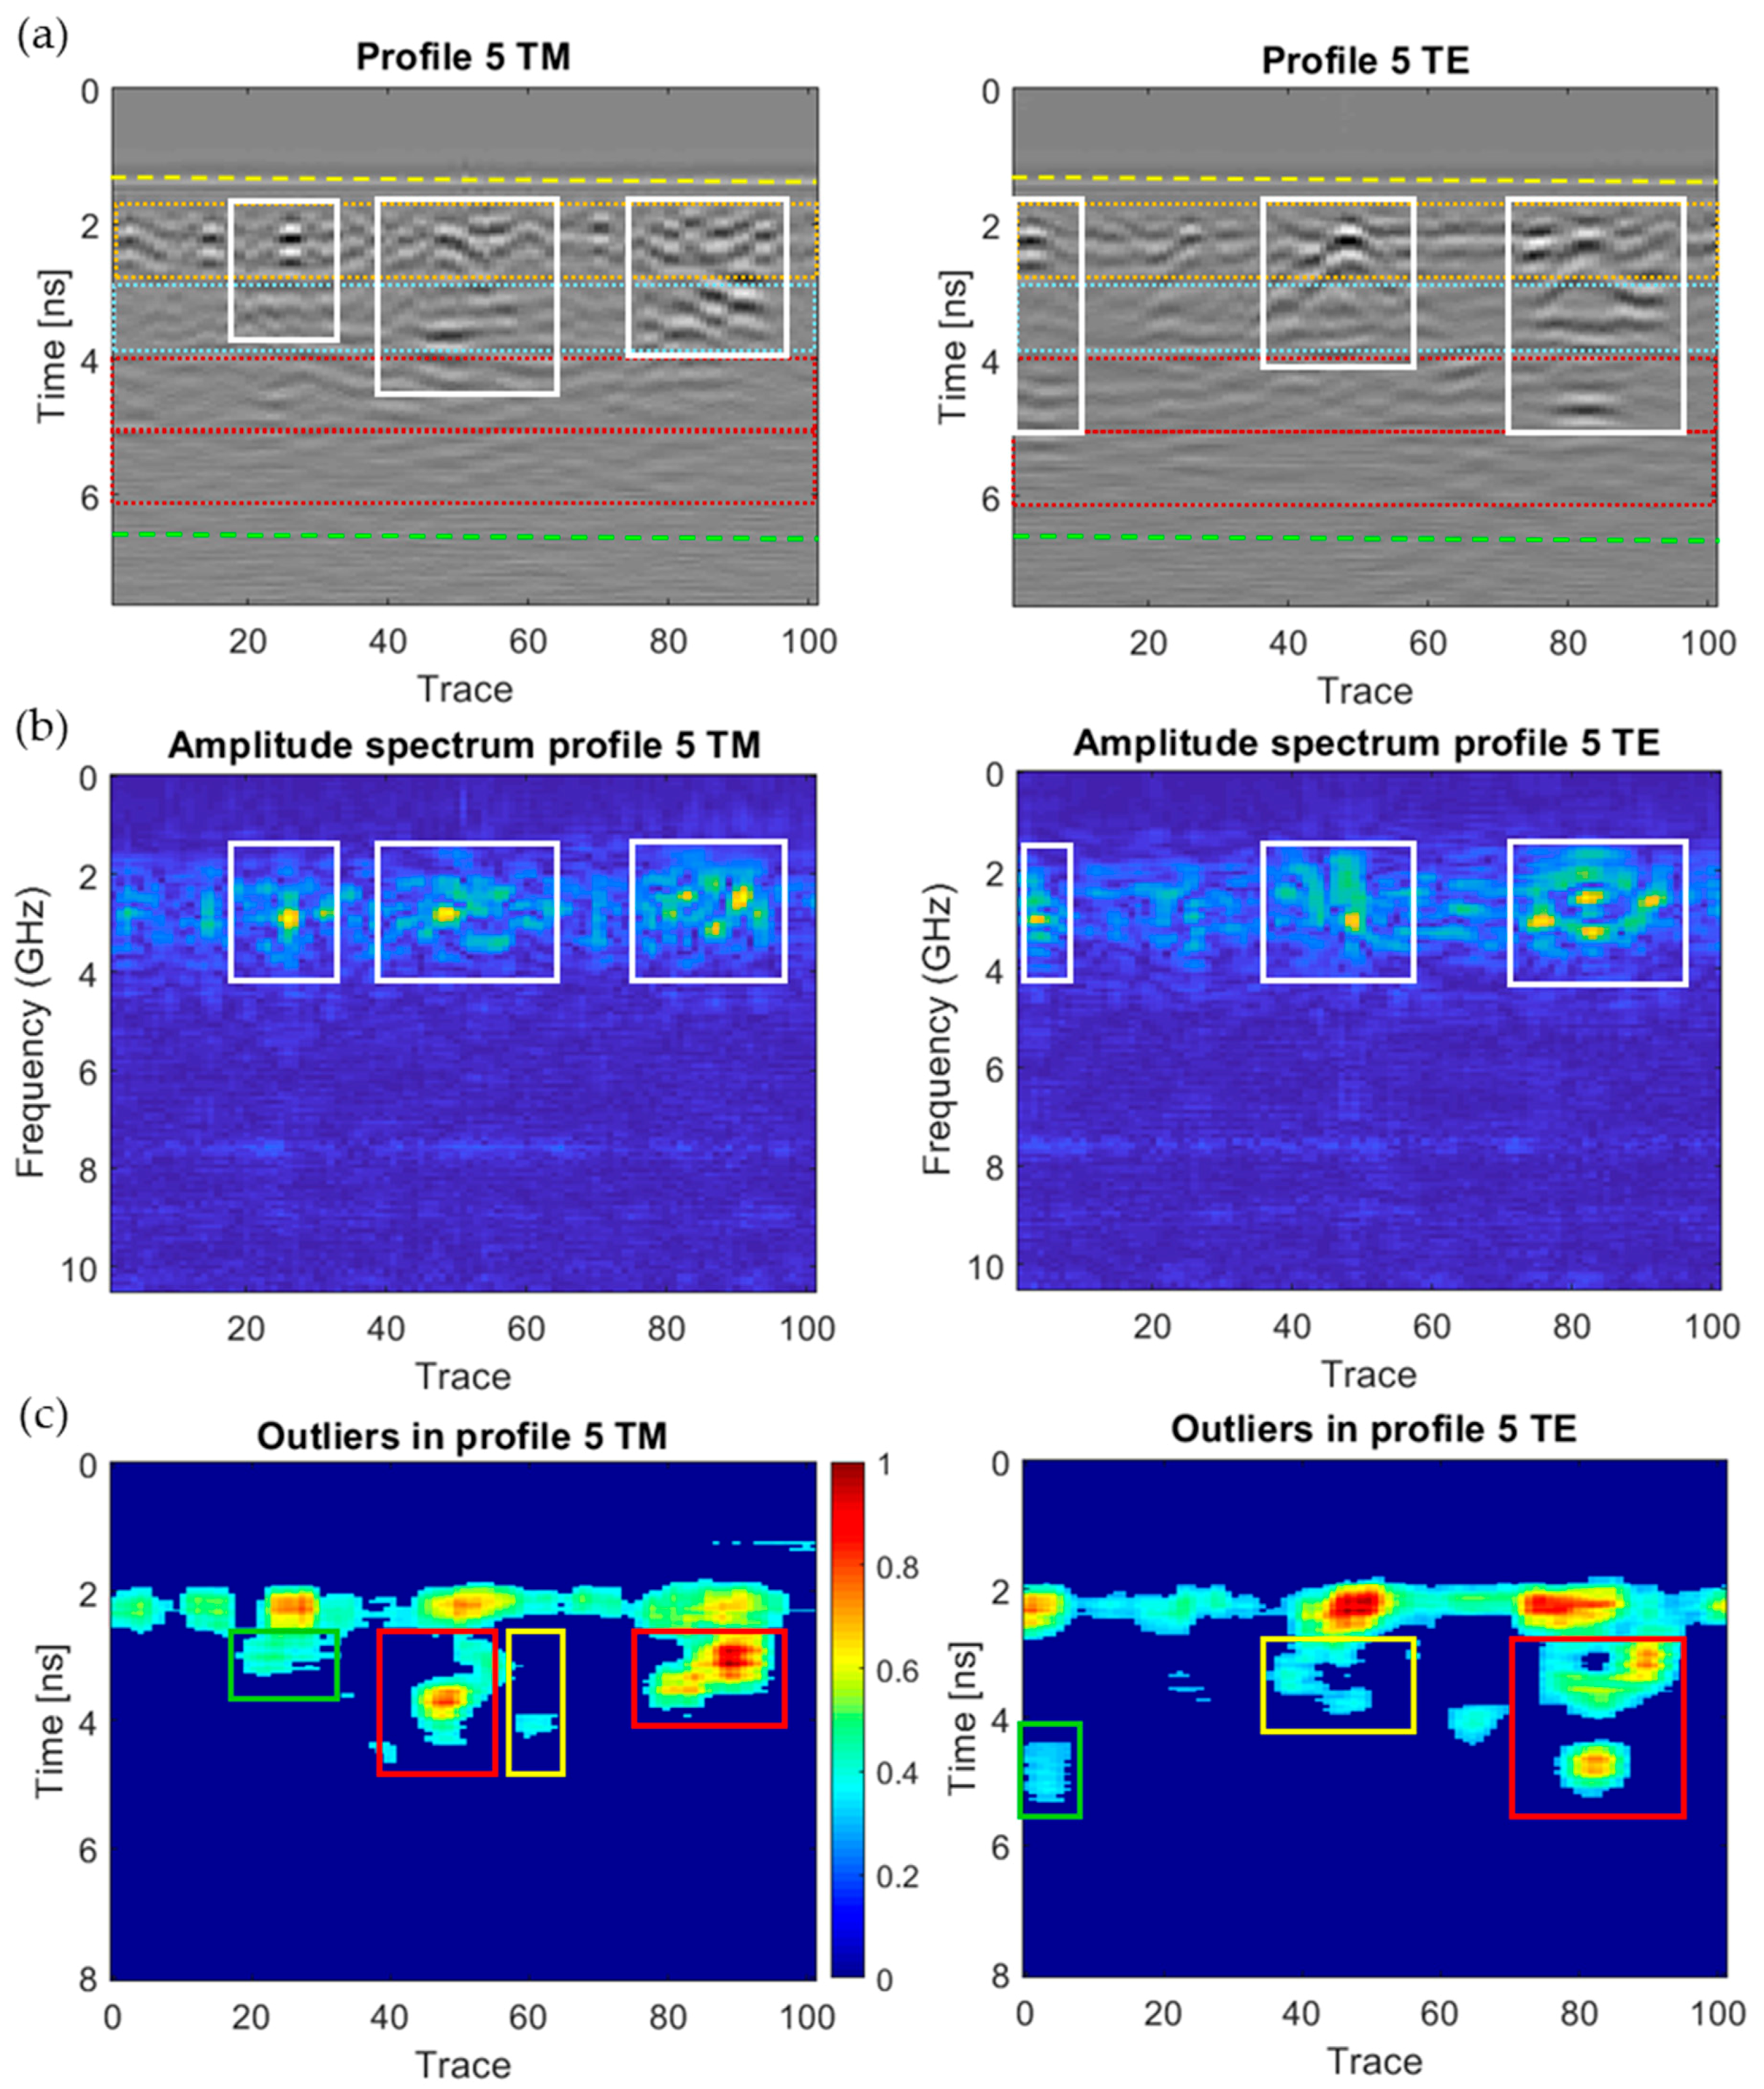
| P5 | TM = [20–30; <4 ns], [40–60; <4.5 ns] and [75–95; <4 ns]; TE = [0–10; <5 ns], [40–60; <4 ns] and [75–95; <5 ns] | TM = [20–30], [40–60] and [75–95]; TE = [0–10], [40–60] and [70–95] | High: TM = [40–55] and [75–95]; TE = [75–95]. Medium: TM = [55–65]; TE = [35–55]. Low: TM = [20–30]; TE = [0–10] | High-severity moisture: TM at the EPS layer; TE extended up to the inner row of the ceramic bricks |
| P6 | TM = [0–10; <4.5 ns], [30–50; <4.5 ns] and [55–75; <3.5 ns]; TE = [0–10; <5 ns], [10–25; <4.5 ns], [30–60; <4 ns] and [60–75; < 3.5 ns] | TM = [0–10], [30–50] and [55–75]; TE = [0–10] and [55–70] | High: TM = [35–50]; TE = [60–70]. Medium: TM = [0–10]; TE = [0–10] and [30–60]. Low: TM = [55–75]; TE = [10–20] | High-severity moisture at the EPS layer. TE allows also the detection of lower moisture at the inner row of ceramic bricks |
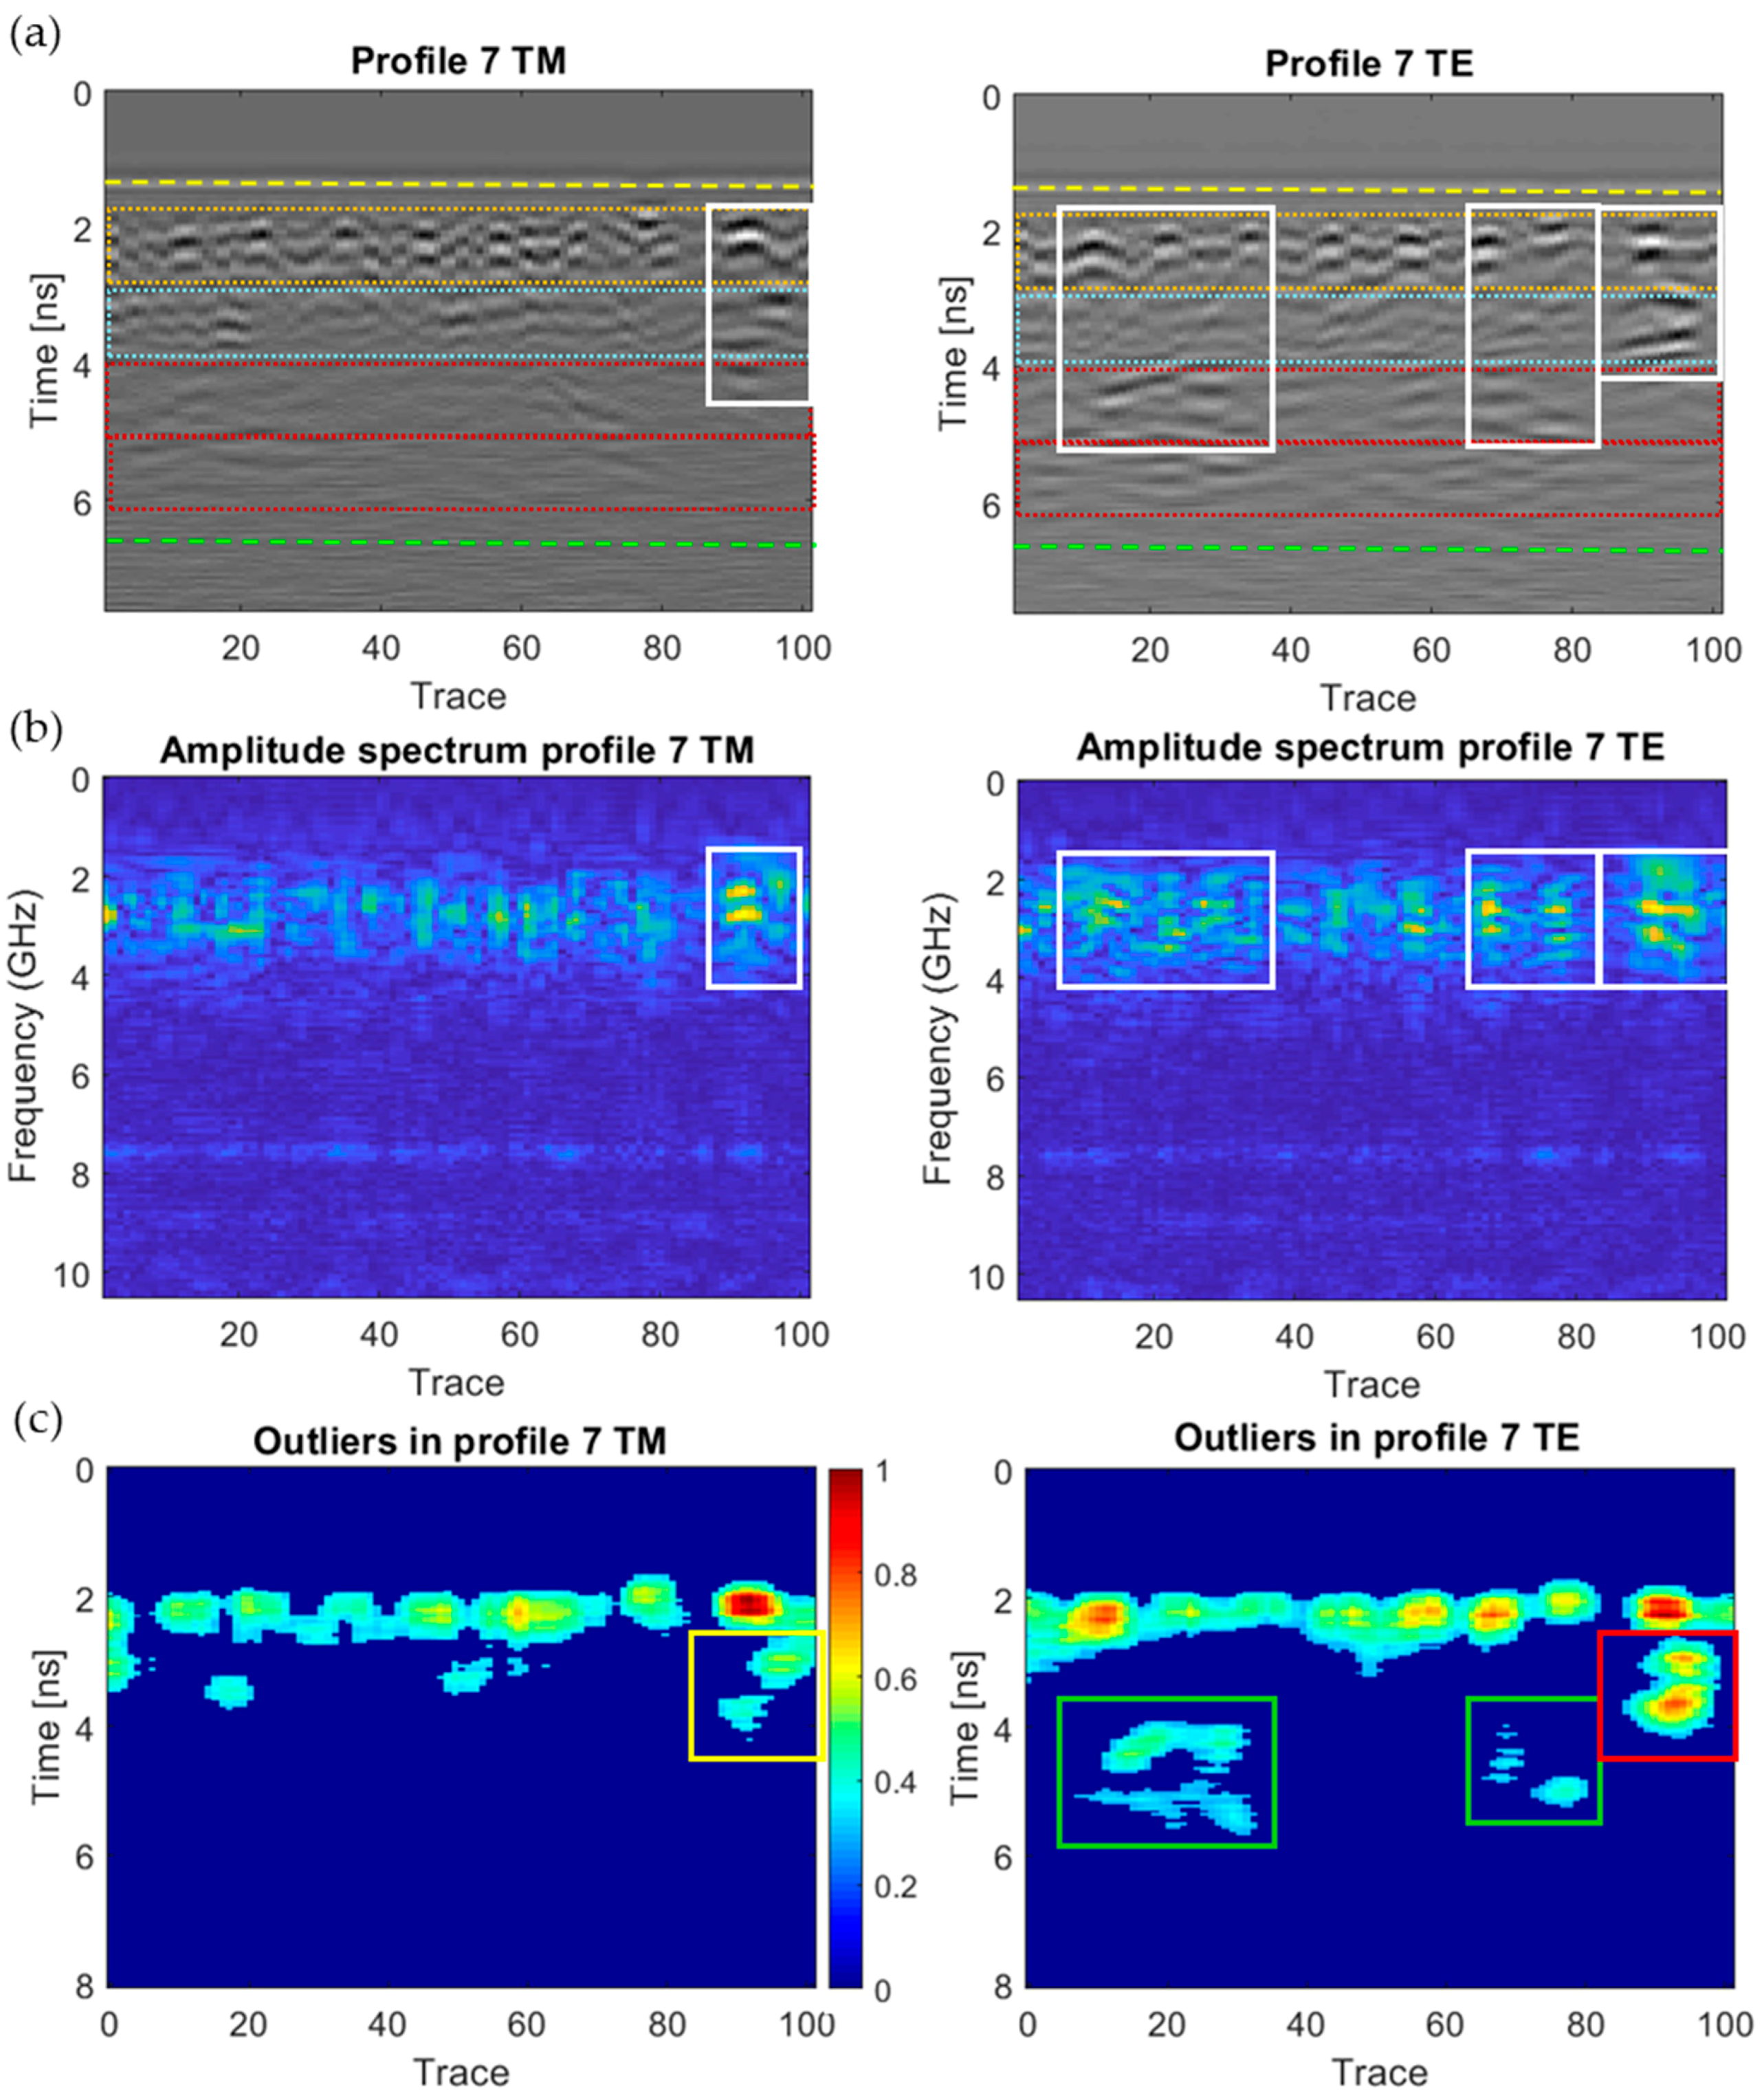
| P7 | TM = [85–100; <4.5 ns]; TE = [10–40; <5.5 ns], [65–85; <5 ns] and [85–100; <4.5 ns] | TM = [85–100]; TE = [10–40], [65–85], and [85–100] | High: TE = [85–100]. Medium: TM = [85–100]. Low: TE = [10–35] and [65–80] | High-severity moisture at the EPS layer with the TE configuration. TE also detects low level at the inner row of ceramic bricks |
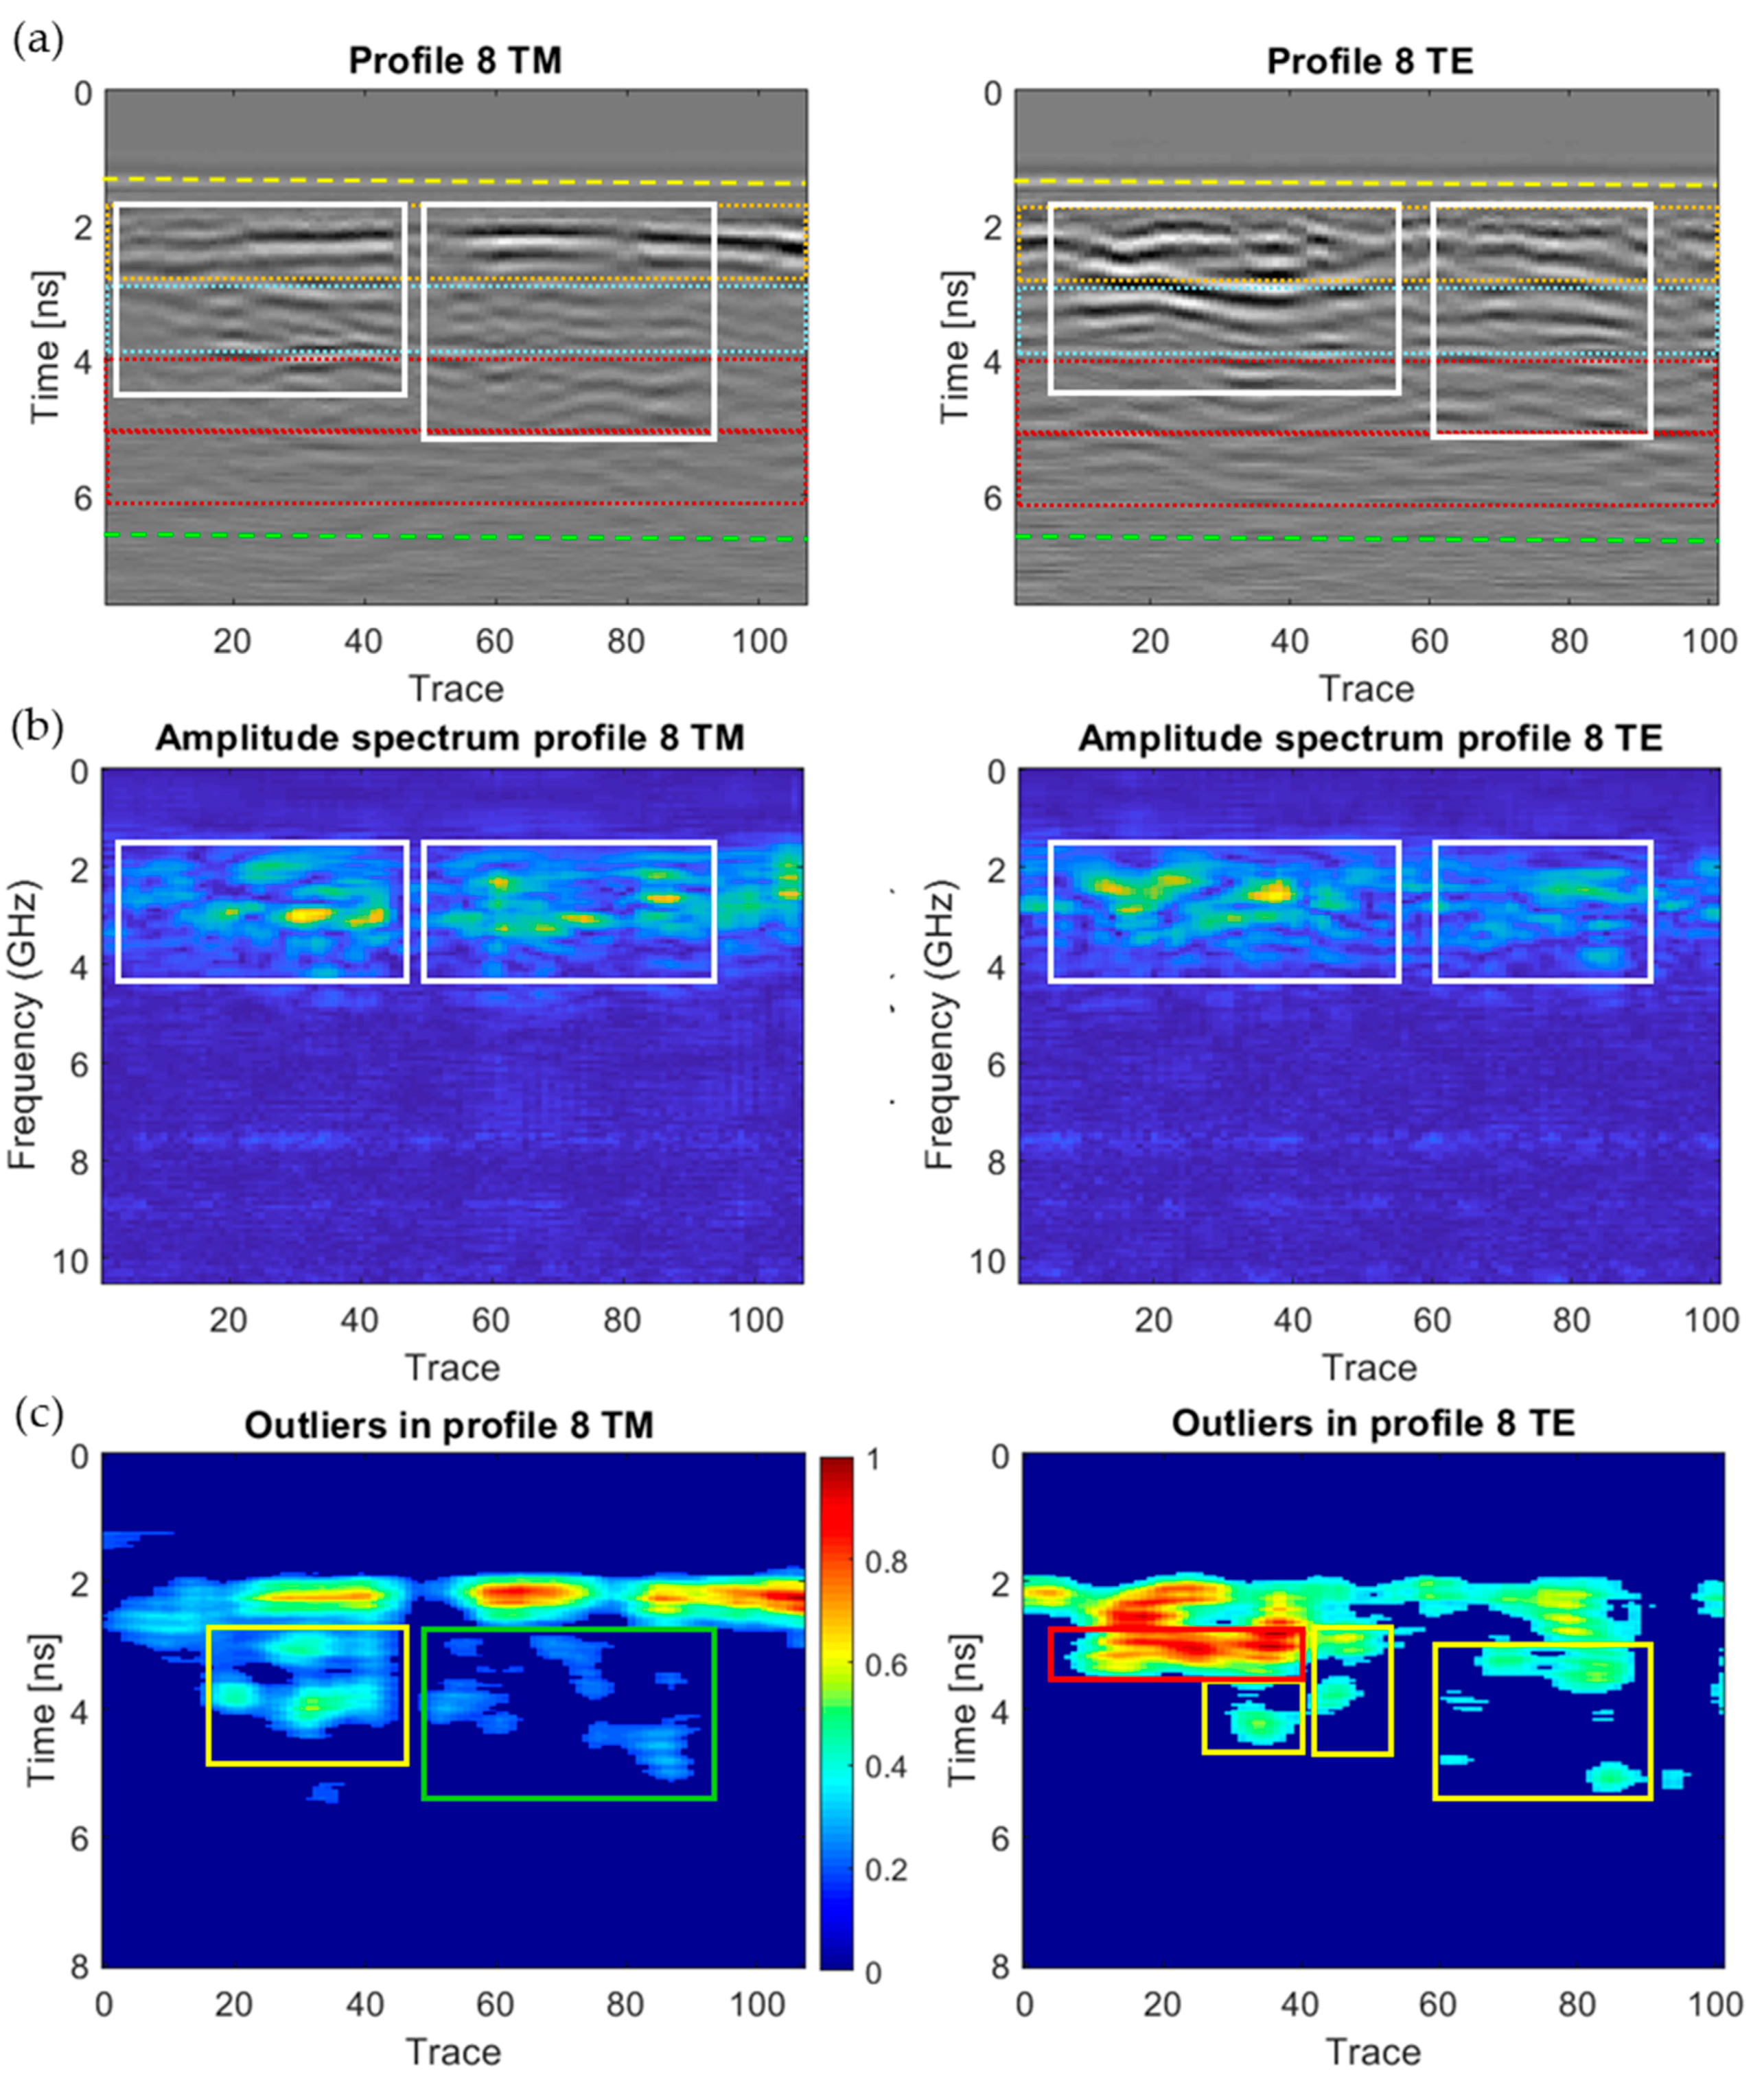
| P8 | TM = [0–45; <4.5 ns] and [50–90; <5 ns]; TE = [10–40; <3.5 ns]; [40–55; <4.5 ns] and [60–90; <5 ns] | TM = [0–45] and [50–90]; TE = [10–55] and [60–90] | High: TE = [10–40]. Medium: TM = [15–45]; TE = [40–50] and [60–90]. Low: TM = [50–90] | High-severity moisture at the EPS layer with the TE configuration |
| All profiles (Wall_2) | Attenuation at deeper layers (4 to 6.5 ns) | Moisture detection not allowed at the external row of ceramic bricks and render coat (from 5.5 to 6.5 ns) | ||
| Profile | GPR Results (Internal) | IRT Results (Superficial) | IRT-GPR Interpretation |
|---|---|---|---|
| 3 4 5 7 | High moisture at upper zones | High moisture at the central-upper zone for Profiles 3 and 4, decreasing in height and increasing in area towards Profile 5, being insignificant in Profile 7 | Water moves from the inside to the surface of Wall_2. The reason is that high moisture is detected at upper heights with GPR (internal) rather than with IRT (superficial), moving the water down by the effect of gravity (confirming the effect of gravity proposed in Section 3.1). |
| 2 | High moisture at the central-lower zone | High moisture at the central-upper zone | Considering the fact that Profile 2 is the only profile showing high moisture levels at upper heights with IRT (superficial) than with GPR (internal), the assumption of water moving from the surface to the inside of Wall_2 is discarded in this case. Then, it is proposed that the difference in height is due to a water ingress from the exterior at the ‘Lower Origin’, and with the water accumulating on the shallow surface rather than falling by gravity. Water leakage is discarded as there are no inner water supplies in Wall_2. Rising water by capillarity is also discarded due to the considerable height above the ground (the profile lines start 75 cm above the ground level) and the proper ventilation inside the room (keeping RH in a stable and adequate range). |
| 6 | High moisture at the central-lower zone | High moisture at the central-lower zone, and with the highest area together with Profile 5 | Profile 6 shows high internal moisture level at shallow depths with GPR (EPS layer) and the biggest superficial moisture area with IRT (similar behavior observed for Profile 5). Considering also that Profile 7 has a severe moisture level at higher depths (from the EPS layer to the double hollow bricks), and superficial moisture is barely observed, it is proposed that Profile 6 acts as a boundary between two different movements of water. Specifically, for Profile 2 to 6, the water comes from the ‘Lower Origin’, moving from the exterior to the interior by the effect of gravity, although it also rises slightly to the bottom of the rack due to the higher degree of porosity in that zone (according to the high moisture location in Profiles 3 to 5 and Figure 27a). Observing Figure 27a, it can be seen how water also moves to the right due to the higher degree of porosity in the lower right region of Wall_2, stopping its expansion after Profile 6. With respect to Profile 7, the internal and superficial moisture can be further associated with the downward and rightward water movement from the ‘Upper Origin’ thanks to the contours delimited by IRT. |
Publisher’s Note: MDPI stays neutral with regard to jurisdictional claims in published maps and institutional affiliations. |
© 2020 by the authors. Licensee MDPI, Basel, Switzerland. This article is an open access article distributed under the terms and conditions of the Creative Commons Attribution (CC BY) license (http://creativecommons.org/licenses/by/4.0/).
Share and Cite
Garrido, I.; Solla, M.; Lagüela, S.; Fernández, N. IRT and GPR Techniques for Moisture Detection and Characterisation in Buildings. Sensors 2020, 20, 6421. https://doi.org/10.3390/s20226421
Garrido I, Solla M, Lagüela S, Fernández N. IRT and GPR Techniques for Moisture Detection and Characterisation in Buildings. Sensors. 2020; 20(22):6421. https://doi.org/10.3390/s20226421
Chicago/Turabian StyleGarrido, Iván, Mercedes Solla, Susana Lagüela, and Norberto Fernández. 2020. "IRT and GPR Techniques for Moisture Detection and Characterisation in Buildings" Sensors 20, no. 22: 6421. https://doi.org/10.3390/s20226421
APA StyleGarrido, I., Solla, M., Lagüela, S., & Fernández, N. (2020). IRT and GPR Techniques for Moisture Detection and Characterisation in Buildings. Sensors, 20(22), 6421. https://doi.org/10.3390/s20226421