1. Introduction
Long period gratings (LPGs) inscribed in single mode fibers (SMF), with periods longer than 10 µm, promote the light coupling from the core guided mode to a specific cladding mode at the resonant wavelength [
1], leading to attenuation dips in the transmission spectrum. These attenuation dips depend on the grating period and on the refractive index modulation. LPGs have many applications in both optical communications [
2,
3,
4] and sensing [
5,
6,
7,
8] fields. In the sensing field, LPGs can be used as temperature, strain or refractive index sensors, furthermore, they can be made sensitive to chemical and biochemical parameters by coating with appropriate materials [
9,
10].
CO2 laser irradiation techniques have been used for fabrication of LPGs with good results. This technique does not require photosensitivity and can be used to fabricate LPGs in almost all types of fibers, including pure-silica core fibers and photonic crystal fibers (PCFs). Hence, compared to the UV irradiation technique, CO2 laser irradiation techniques are more flexible and have lower cost, maintaining the stability provided by the laser inscription techniques.
CO
2 laser inscribed LPGs are typically written using the point-by-point method. Segments of the fiber are periodically exposed to 10.6 µm wavelength radiation from a CO
2 laser, producing a localized fiber heating and a consequent refractive index change [
11]. Several CO
2 laser irradiation techniques to inscribe LPGs with antisymmetric and symmetric irradiation have been demonstrated and improved [
2,
11,
12,
13]. At the same time, studies on the physical mechanism involved in the refractive index change have been performed. The refractive index changes have been attributed to residual stress relaxation and/or glass densification [
2,
14,
15], nevertheless, the process was not clearly explained yet. Furthermore, some methods were already used to measure the produced refractive index change but reported results are not in agreement with each other [
15,
16,
17]. In fact, the refractive index change is an important parameter that defines LPG characteristics, which means accurate knowledge of this parameter is fundamental for LPGs modelling. Furthermore, LPG sensitivity to the surrounding medium is highly dependent on the coupled cladding mode [
5,
6,
7]. By choosing the right coupling mode and the right period it is possible to design LPG-based sensors that are highly sensitive or even insensitive to a certain parameter [
18]. In this way, LPGs modelling is fundamental for both sensor design and LPGs inscription planning.
Here, we report a detailed theoretical model, based on coupled mode theory, for CO
2 laser symmetrically irradiated LPGs in SMFs that permit the estimation of the refractive index change from the LPG transmission spectrum. We use an automated LPG inscribing technique recently proposed in [
13] that has the advantage of producing highly reproducible LPGs with a circularly symmetric refractive index change. The theoretical model takes into consideration the specifications of this inscription technique. The estimation of the refractive index change was done by fitting the simulation results to the wavelength resonances of the fabricated LPGs using a genetic algorithm (GA).
2. CO2 Laser Irradiation Inscription Method
The LPGs were inscribed using the technique proposed in [
13], which uses a commercial CO
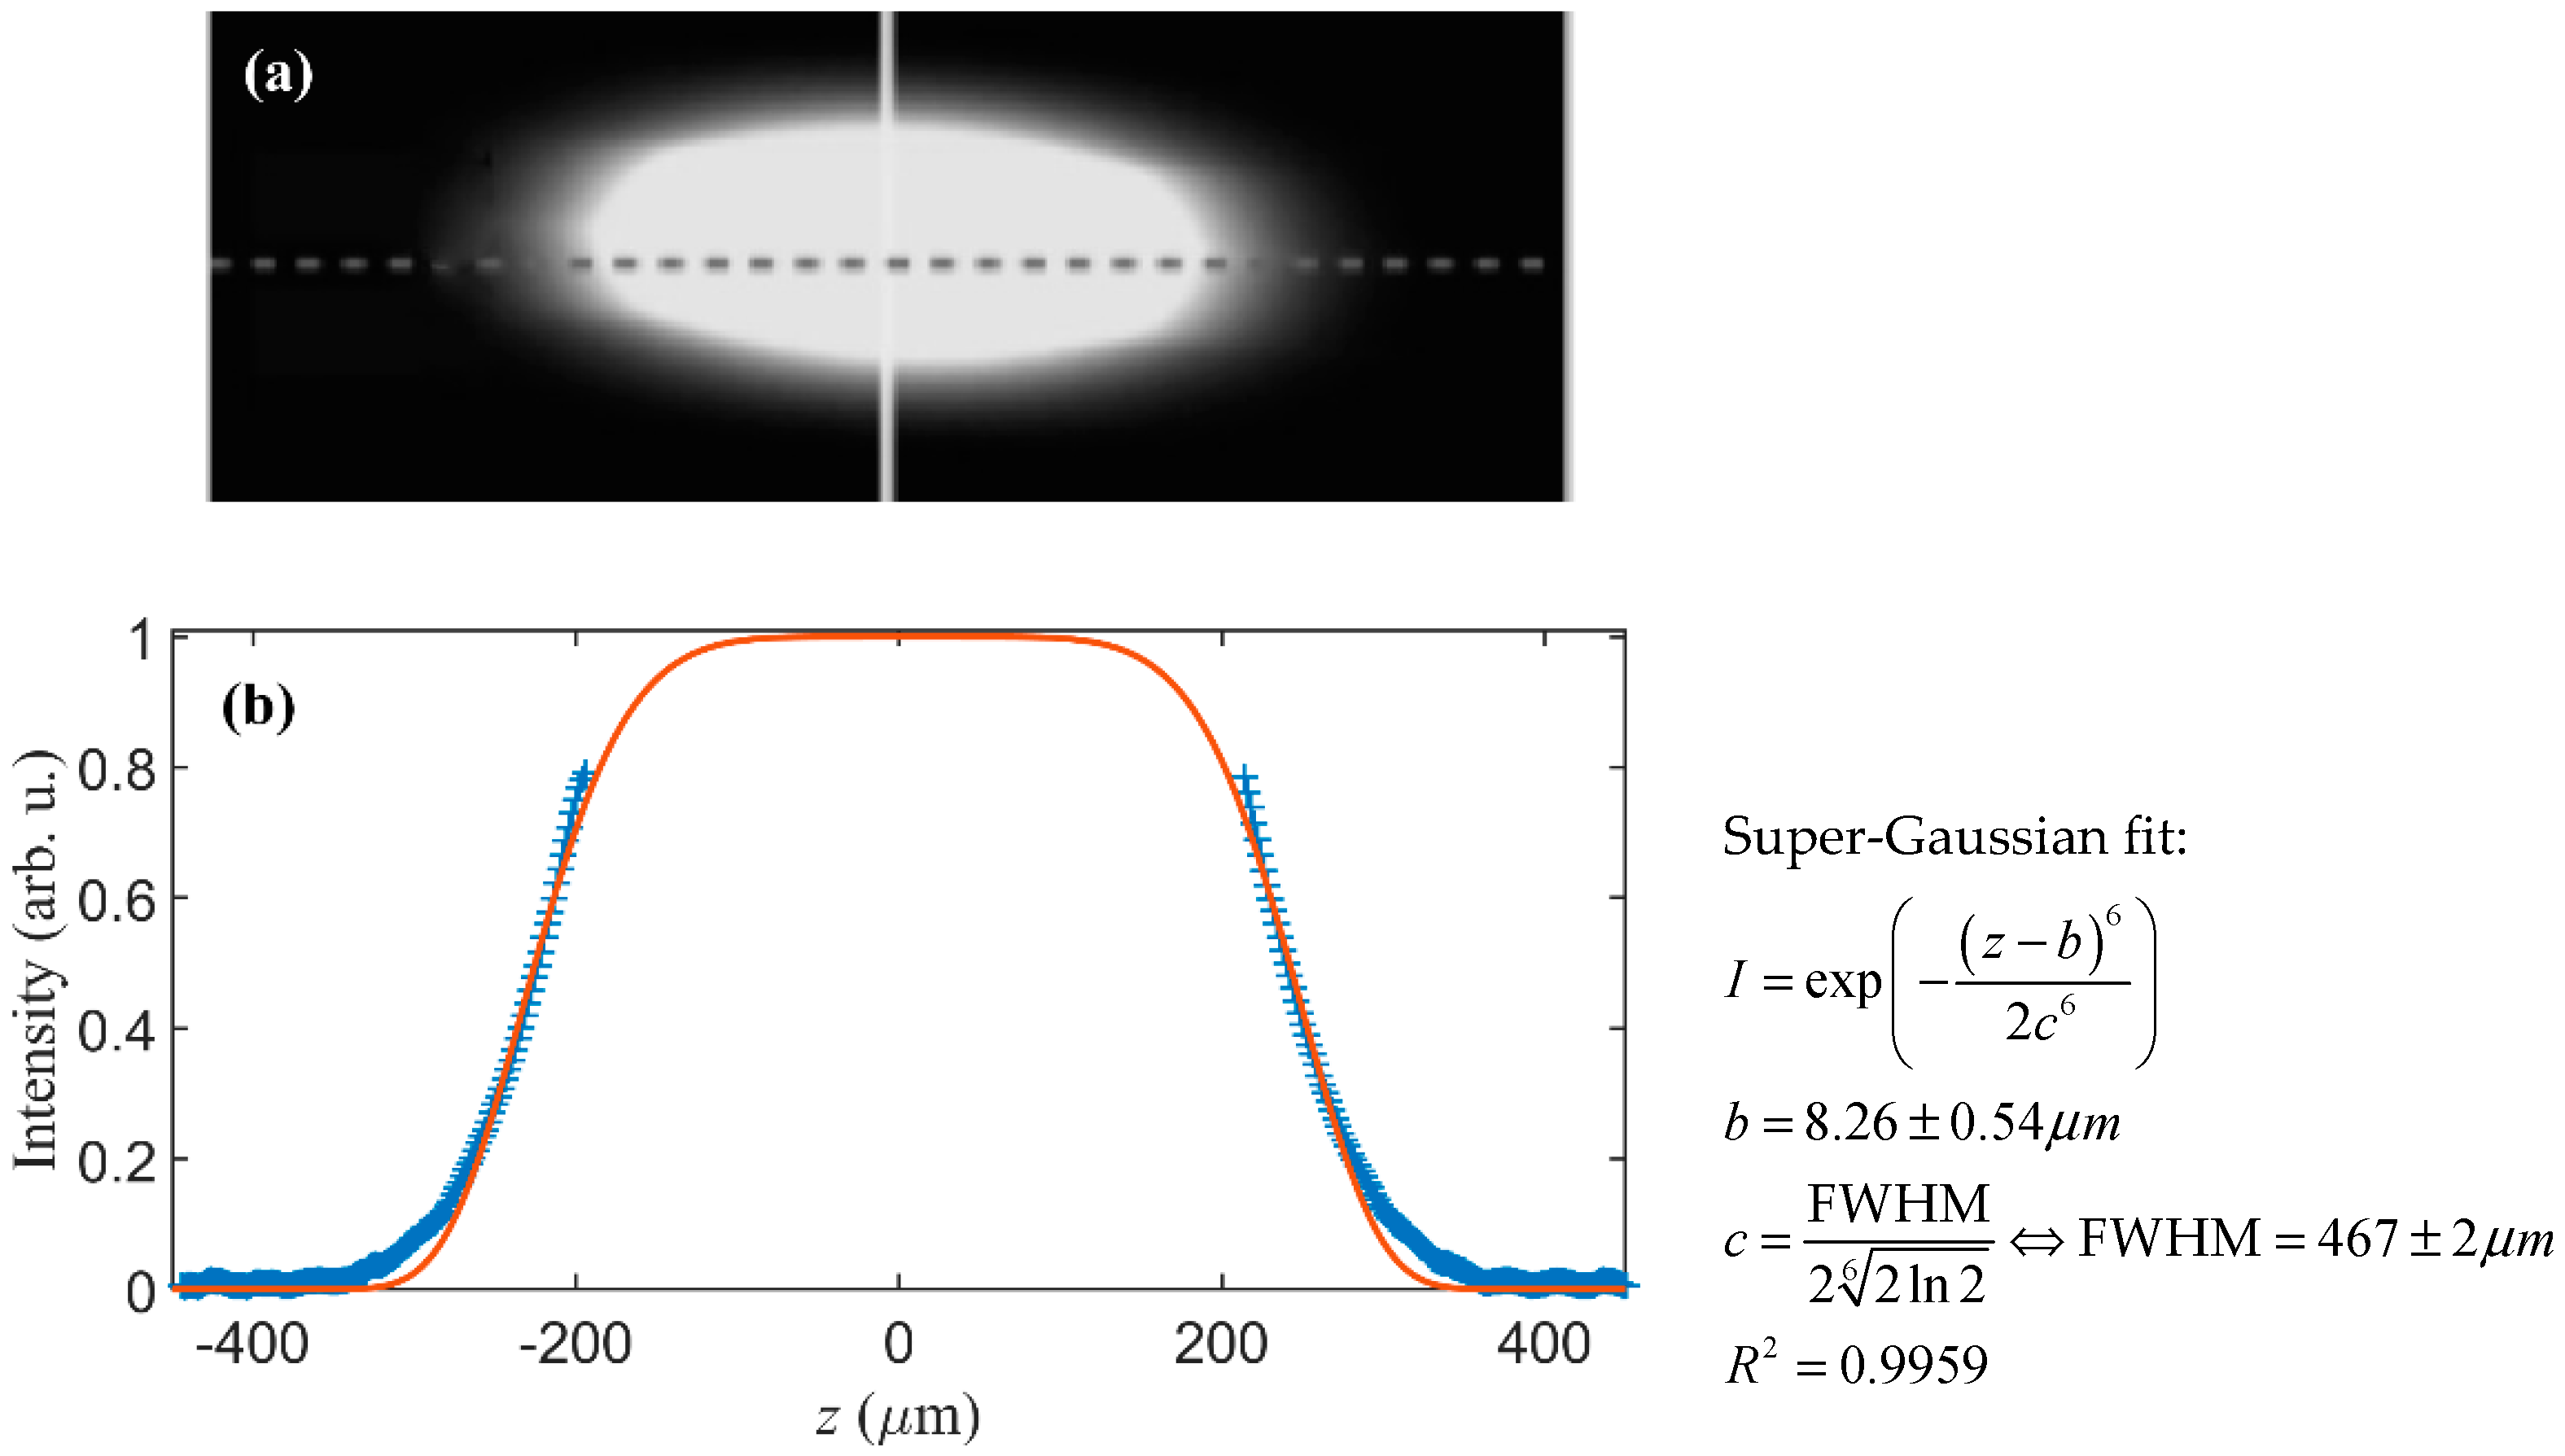
2 laser fiber processing system (LZM-100 LAZERMaster from AFL Fujikura, Chessington, Surrey, UK). This point-by-point technique allows for constant rotation of the fiber during irradiation, leading to a uniform exposure around the fiber that results in a circularly symmetric refractive index change. This system produces LPGs with highly reproducible characteristics; however, the period must be higher than 800 µm to avoid overlapping the irradiated areas. The laser induced heating profile—which is produced in the fiber by the LZM system—is displayed in
Figure 1. This profile was approximated by a super-Gaussian function of order
N = 6 and a full width at half maximum (FWHM) of 467 µm.
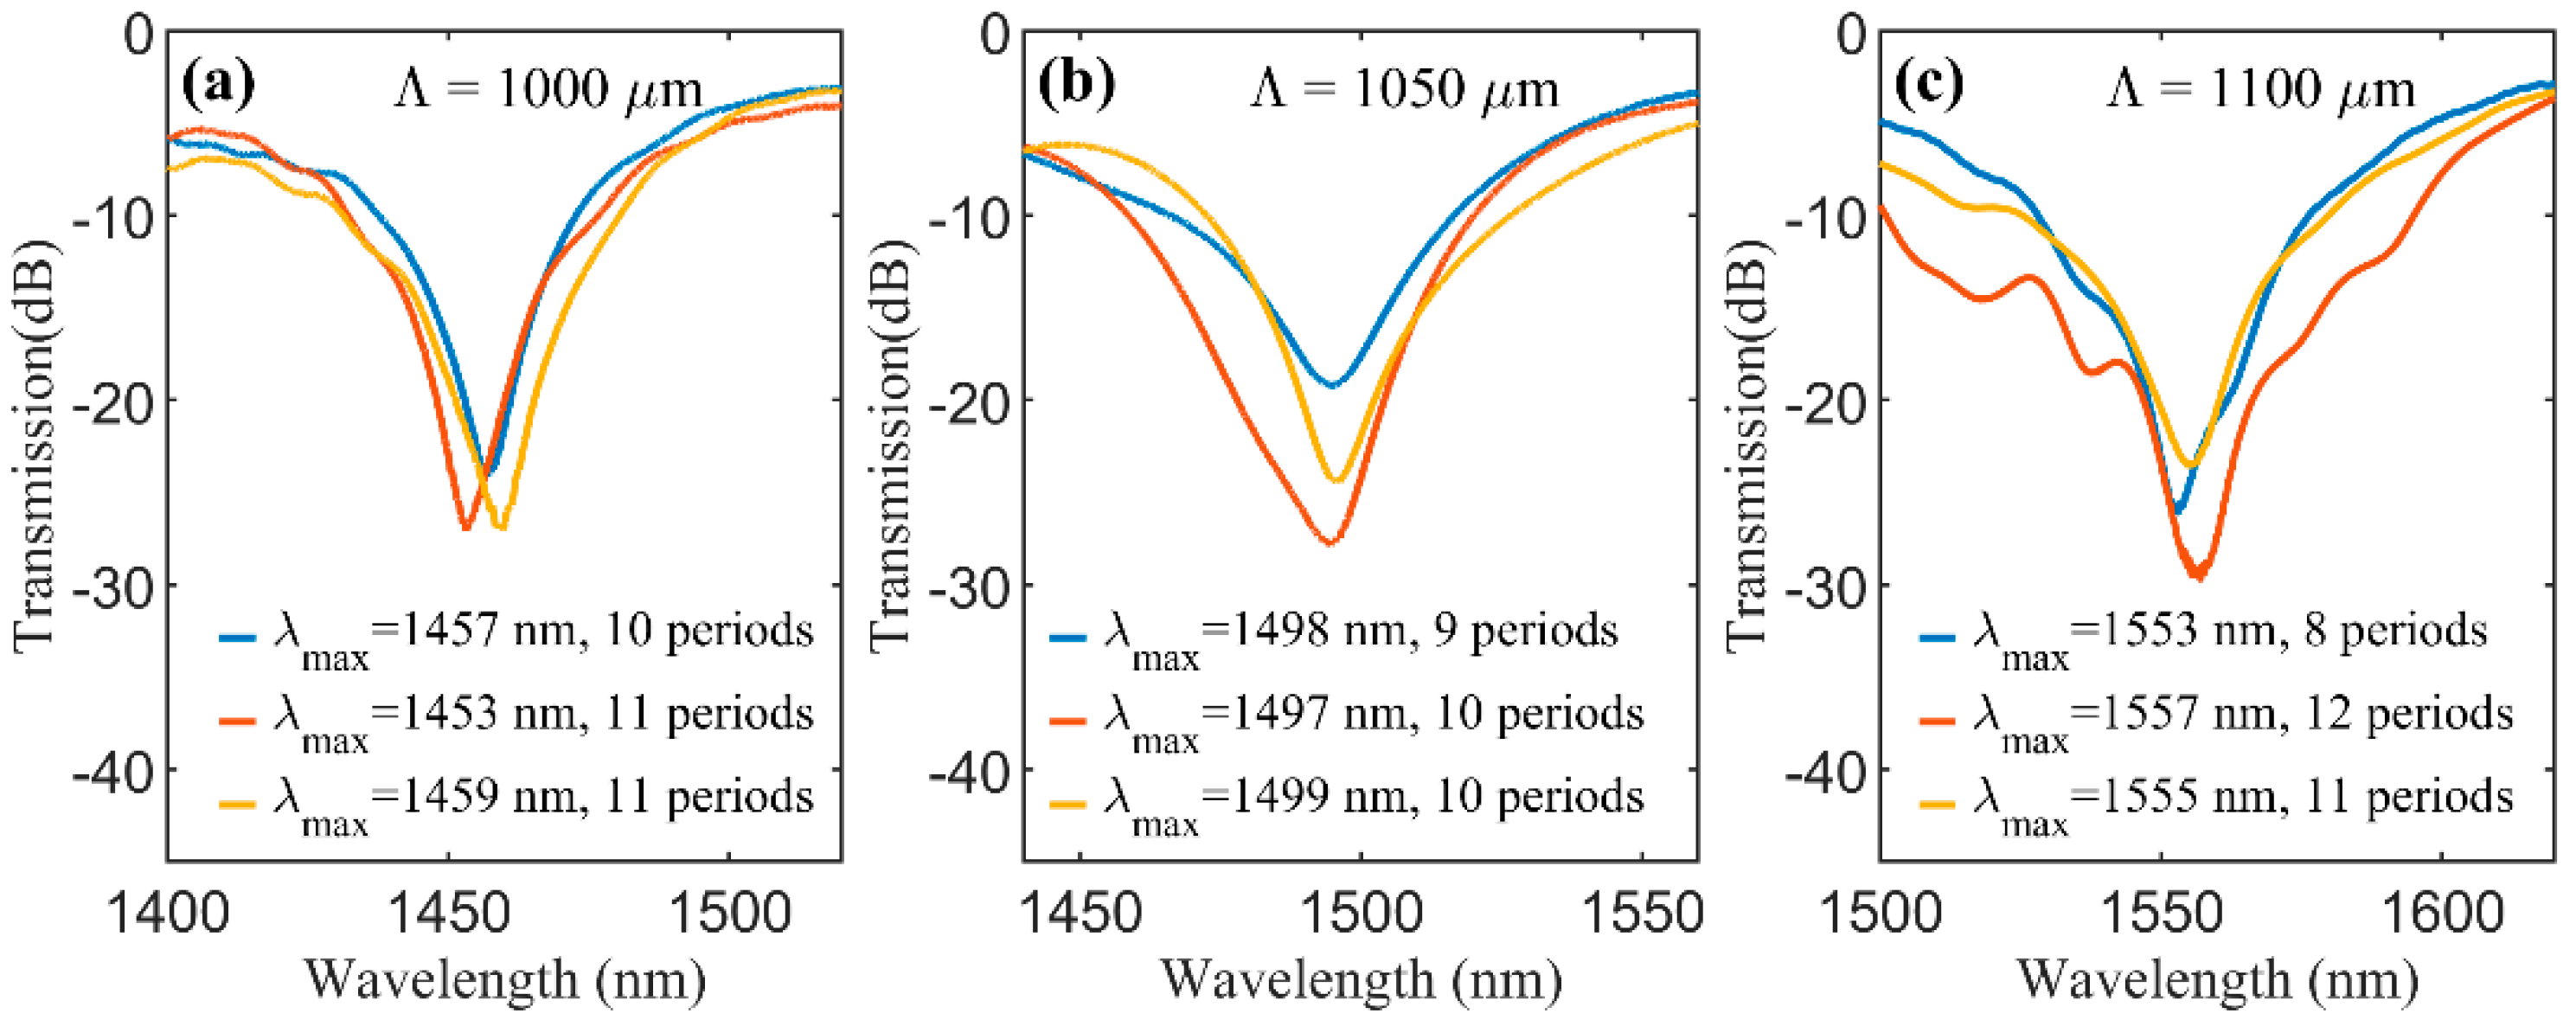
We have inscribed LPGs in step index SMFs with different periods (1000, 1050 and 1100 μm). The point-by-point technique allowed us to monitor the LPG spectrum after each irradiation pulse, in such a way that the optimum length of the LPG was easily determined, i.e., the length that provides the maximum attenuation dip, which corresponds to the maximum coupling. Hence, the LPGs were produced with an optimized LPG length. For each period, three LPGs were produced to confirm the reproducibility of this technique. The LPGs transmission spectra were measured with an optical spectrum analyzer (OSA) (Q8384 from Advantest, Tokyo, Japan) in combination with a broadband source (WL-SC400-2, Fianium, Southampton, UK). The spectra of the LPGs produced are displayed in
Figure 2.
All spectra have attenuation dips with heights higher than 20 dB. The dips are similar in each set, having a maximum difference of 6 nm (Λ = 1000 µm) for the resonant wavelength and a maximum difference of 5.95 dB (Λ = 1100 µm) for the height of the dip. Furthermore, LPGs with larger period present higher resonant wavelengths.
3. Theoretical Model
In the case of a SMF, the refractive index perturbation of the LPG promotes the coupling between the fundamental core mode (HE
11 or LP
01) and the cladding modes of the fiber. The coupling interaction between these forward propagating modes can be described by the coupled mode theory. The general coupled-mode equations that describe the evolution of the mode amplitudes along the LPG (
z) are written as [
1,
19]:
where
Ap and
Aq are the amplitudes of the mode field
p and
q, respectively. Δ
βqp is the difference of the propagation constants of the modes,
z is the propagation direction and
Kqp is the coupling coefficient between the modes
q and
p.
We assumed that the induced refractive index change has the same form as the fiber heating profile, i.e., the form of a super-Gaussian of degree
N as displayed in
Figure 1, and given by:
with
being the maximum value of the refractive index change,
bj the position of the super-Gaussian peaks separated by the LPG period, Λ, and:
The coupling coefficients can be defined as:
Since the CO
2 laser irradiation can induce refractive index changes in both the cladding and the core,
σqp is given by:
where
is the vacuum permittivity,
ω the angular frequency,
and
are the refractive indexes of the core and cladding, respectively,
and
are their maximum changes and
Eq and
Ep are the electric field of the modes
q and
p.
Considering the coupling between two modes, the coupled mode equations become:
where
. The super-Gaussian series can be defined by a Fourier series:
where the coefficients
are given by:
Considering only the terms of order −1, 0 and 1 of the Fourier series (7), and neglecting the terms on the right-hand side of the differential Equations (6) that have rapid oscillations in
z (synchronous approximation), yields:
Since
,
, and assuming the initial conditions
and
, the solution for the above system, written in terms of power, is
With these solutions, we may estimate the resonant wavelength given by
, i.e.,
where
.
The above solutions correspond to first order coupling. However, our experimental results and integration of (6) with
Y(
z) up to first order showed a reasonable coupling for a shorter wavelength, which we attributed to second order coupling, given by:
This coupling cannot be explained within the synchronous approximation and numerical tests which revealed that for large
δn it happens for reasonable LPG lengths, but for small
δn, it occurs for very large lengths which are experimentally unfeasible. Similar higher diffraction order has been reported in previous works [
20].
4. Results
We calculated the mode power evolution in the LPG for each wavelength and its full spectrum through full integration of system (1) considering one and several cladding modes, as indicated in each section, and the full super-Gaussians given in (2). To predict the relation between grating period and resonant wavelength we have used the expressions (11) and (12). We assumed a bare standard SMF on air composed by a cladding of pure silica with a radius of 62.5 µm and a core of GeO
2 doped silica with a concentration of 3% and a radius of
r = 4.1 µm. The cladding and core refractive indexes were calculated using the Sellmeier coefficients as in [
21], which are 1.4440 and 1.4485 at 1550 nm.
The electric field distribution (E) and the effective refractive indexes (
neff) were obtained using the software package Comsol Multiphysics
® with the Wave Optics module that solves the full vectorial Helmholtz equation. We calculated the fundamental core mode (LP
0,1) and 200 cladding modes, the ones with the highest effective refractive indexes. Among those modes, we selected ten modes with the same azimuthal symmetry of the core modes (HE
1,m), the correspondent effective refractive indexes at 1550 nm are in
Table 1. Note that in gratings with symmetric index changes like the ones that are being studied here, the coupling may only occur between modes with the same azimuthal symmetry [
1].
We made preliminary numerical tests considering a uniform refractive index change in the core or its symmetrical in the cladding. These tests yielded similar results in both cases. During all our numerical calculations, we have opted to consider only a uniform refractive index change in the cladding since, this should be closer to the actual change induced by our inscription method.
The system of differential Equations (1) was solved using a Runge–Kutta method. In order to calculate the spectral response of the LPGs, we repeated the integration for the same period but for several wavelengths, and for each wavelength the power at z = Lmax was considered, where Lmax is the length at which the power of the fundamental mode attains its minimum at the resonant wavelength.
4.1. Coupling between Cladding Modes
In [
1,
22] it was demonstrated that coupling between the different cladding modes is usually negligible, such that the transmission spectrum can be calculated by overlapping all the individually calculated spectra for each cladding mode. However, in those works the gratings were weak, i.e., the refractive index change was less than 1 × 10
−4. In the case of CO
2 laser inscribed LPGs, the refractive index change can reach higher values, with a value of ~10
−3 already having been reported [
16]. These high values increase the coupling coefficients to the point that the coupling between different cladding modes is not negligible. An example of this different behavior for small and large refractive index modulation is represented in
Figure 3. There, we present the mode power evolution at 1550 nm for
(
Figure 3a,b) and
(
Figure 3c,d), for LPGs whose period is given by (11) when considering HE
1,3. The results in
Figure 3a,c, were obtained by considering only one cladding mode, whereas the results in
Figure 3b,d were obtained by including multiple cladding modes, namely, the ten first azimuthally symmetrical cladding modes.
Figure 3a,b are identical, however, there is a clear difference between graphs in (c) and (d), showing coupling between the different cladding modes and the appearance of a second order resonance for the same period and same wavelength (associated with mode HE
1,6).
To verify the differences in the transmission spectra, we also determined them for
in both situations (one and ten cladding modes). The results are displayed in
Figure 4 and show that the resonant wavelength changes with the number of modes are considered in the simulation. Note that, in both cases, we have used LPG optimal lengths (7.8 mm which corresponds to 7 periods) which is the number of periods closer to the length at which core mode power reaches a minimum on the graphs in
Figure 3. These results reveal that Equation (11) is not very accurate for determining the resonant wavelength in cases of large refractive index changes, since we cannot consider only coupling between two modes but instead, we need to consider several modes to accurately model the LPGs. Nevertheless, it is good as a first approximation, as we show in sub
Section 4.3. There are thousands of modes supported by the cladding, thus it is not possible to consider all of them in the simulations. However, in
Figure 3d we can see that modes higher than the HE
1,7 do not couple significantly. In this way, hereafter we are considering the same 10 cladding modes simultaneously in all simulations.
Another aspect of the power evolution that is observable in the graphs of
Figure 3c,d is the step-like curves, which are not visible for lower refractive index changes. Each step corresponds to a period, the steady part corresponds to the region not irradiated, with zero refractive index change, and the part where the mode power changes corresponds to the irradiated region where the refractive index is changed.
4.2. Refractive Index Change Estimation
As mentioned above, accurate knowledge of the refractive index change enables the modelling of LPGs characteristics which is important to guide the fabrication process.
Here, we estimate the maximum refractive index change in the cladding, considering uniform refractive index change, using a genetic algorithm (GA) that fits the resonances of the fabricated LPGs to the numerically determined resonances using the model presented in
Section 3.
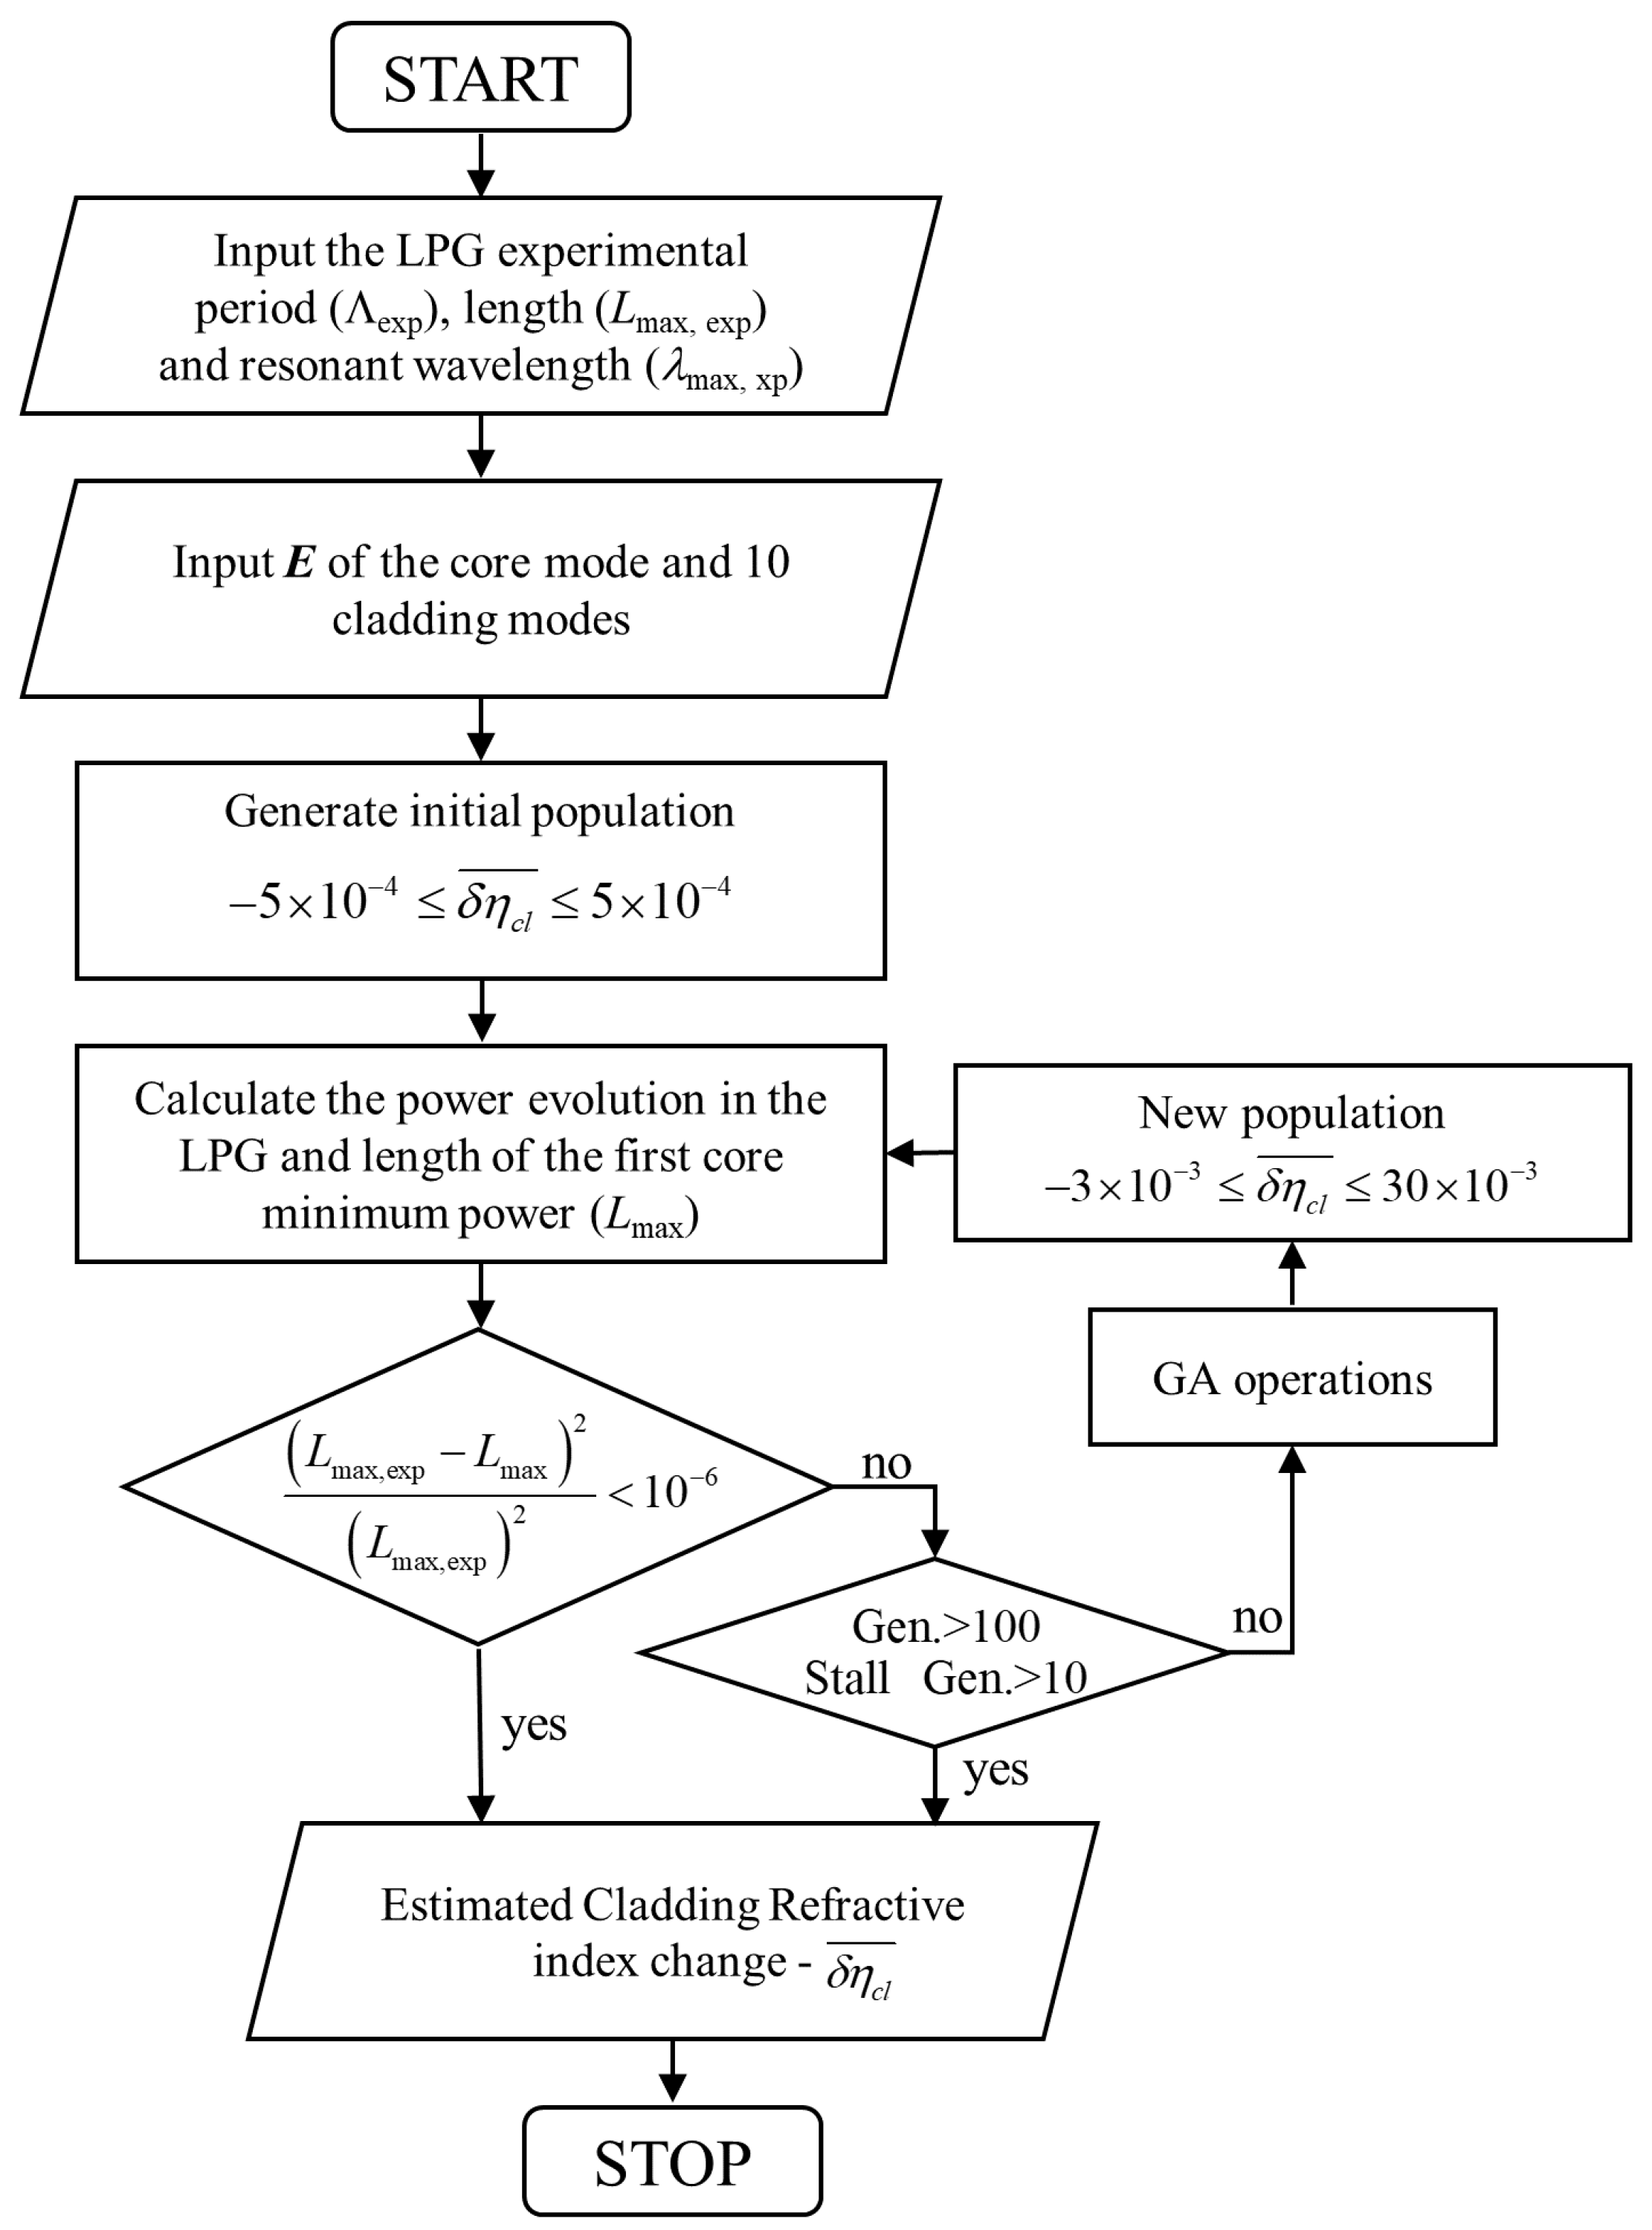
The GA was implemented in order to find the refractive index change for which the numerical optimal LPG length better approximates the experimental optimal LPG length in the resonant wavelength. For each LPG period, we have considered the averages of the resonant wavelengths and of the lengths of the three produced LPGs (
Figure 2). The algorithm flow chart is shown in
Figure 5 where we also show some of the GA conditions that have been used and were chosen after some preliminary tests. Within the GA routine, we solve the differential equations system (1) for the core mode and the first ten azimuthally symmetrical cladding modes and the full series of super-Gaussians given in (2), considering the experimental LPG periods and their resonant wavelengths. We then find the LPG length that corresponds to the first minimum of the core mode power and compare it with the experimental LPG length. We used a GA routine from Matlab and since the GA uses initial populations and selection methods that rely on random distributions, each run may produce slightly different results. For that reason, we ran it three times and the results are presented in
Table 2. We obtained similar refractive index changes for all three sets of experimental LPGs, and in all cases the coupling was mainly with the mode HE
1,3. Calculating the average of all the refractive index changes obtained with GA (see
Table 2), we estimate a value of 2.2 × 10
−3. Although this value is high, it is within the range of the reported values [
16].
4.3. First and Second Order Wavelength Resonances and Experimental Validation
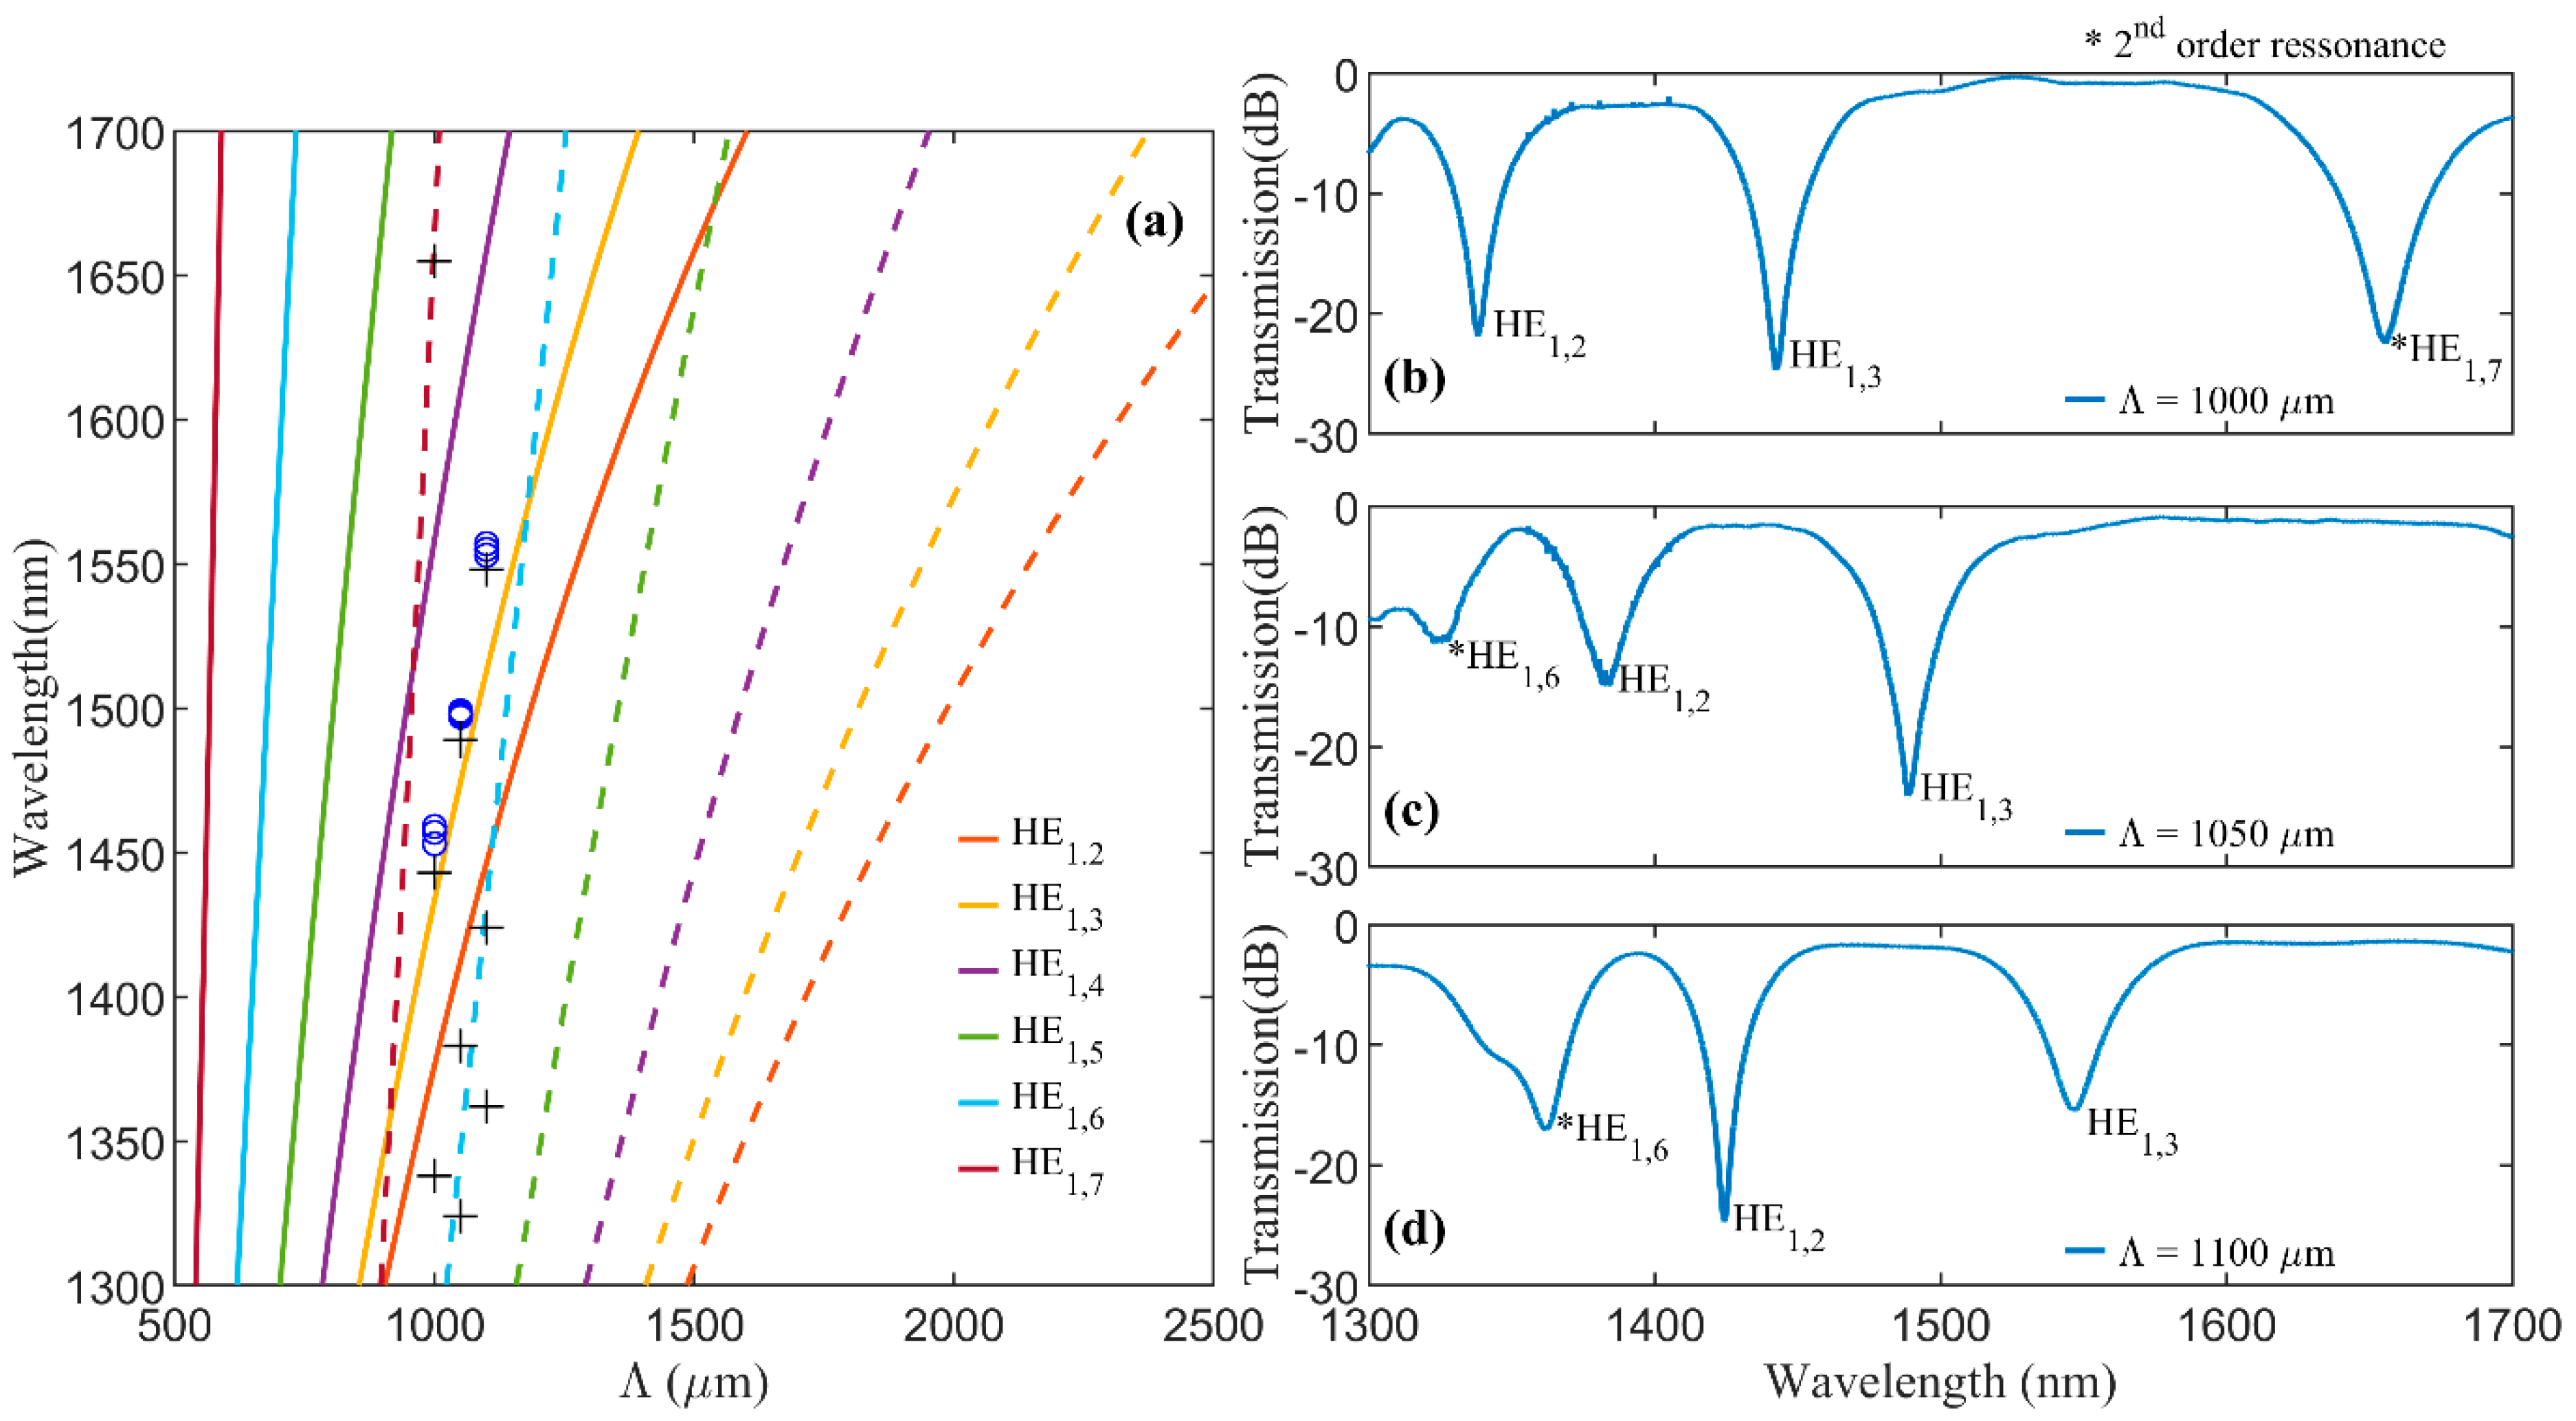
Using the estimated refractive index change and the expressions (11) and (12), we were able to estimate a relation between the LPG period and the first and second orders’ resonant wavelengths for a series of azimuthally symmetrical cladding modes (
Figure 6a). As expected, the resonant wavelengths of the fabricated LPGs (
Figure 2) are close to the HE
1,3 mode line. We verified that, considering the first order coupling, longer periods promote the coupling with lower-order modes while shorter periods promote the coupling to higher-order modes. Furthermore,
Figure 6a indicates that, assuming coupling with the same cladding mode, the resonant wavelength increases with increasing periods. The second order presents the same behavior but for much longer periods. In the points where the curves of the first order and second order resonances cross each order, coupling with the two modes that cross should occur with one mode in first order and the order one in second order, as shown in
Figure 3d. However, the maximum coupling of each mode/order may occur for different LPG lengths.
To validate the numerical analysis, we fabricated another set of LPGs and measured their transmission spectra for a wavelength range from 1300–1600 nm (
Figure 6b). The LPGs were fabricated with periods of 1000, 1050 and 1100 µm, as well as lengths chosen in order to show more dips. Besides the attenuation dips that correspond to the ones in
Figure 2, the spectra present additional dips. By comparing the transmission spectra of these LPGs with the expected resonant wavelengths of
Figure 6a, we identified the cladding modes that should be associated with each dip, verifying that some dips should correspond to first order and others to second order resonances.
The small difference between the experimental resonant wavelengths and the calculate ones is partly due to the use of (11) and (12), as explained in sub
Section 4.1. Nevertheless, these results show that our model together with the estimated refractive index change can provide a good first approximation of the LPGs behavior.
5. Conclusions
The mode power transfer in LPGs inscribed in SMFs by the CO2 laser irradiation technique was studied using a theoretical model, based on the coupled mode method. Taking into consideration the specifications of the inscription technique, the model assumes azimuthally symmetric refractive index changes, in the form of a train of super-Gaussian profiles with high maxima that mimics the circularly symmetric point-to-point laser irradiation profile. We started by demonstrating that for high refractive index changes the coupling between different cladding modes is not negligible. To fully explain the spectra of the produced LPGs, several cladding modes needed to be considered simultaneously. Nevertheless, we have used a two-mode coupling model within the synchronous approximation to obtain a simple relation that approximates the dependency of grating periods and resonant wavelengths. Using a genetic algorithm, we then developed a method to estimate the refractive index change. By fitting the wavelength resonances of several produced LPGs to numerically obtained ones using a multi-mode coupling model, we were able to estimate the refractive index change maximum to approximately 2.2 × 10⁻³. Using the estimated refractive index change, we predicted the resonant wavelengths for several cladding modes in a range of LPG periods. The experimental results were in good agreement with the predicted resonances. Furthermore, we numerically demonstrated the existence of a second order resonance that, for the same grating period, occurs at shorter wavelengths. These second order resonances were confirmed by the experimental results.
Author Contributions
Conceptualization, A.M.R. and M.F.; formal analysis, A.M.R., A.I.M. and M.F.; funding acquisition, A.M.R. and M.F.; investigation, A.I.M., T.A. and J.V.; methodology, A.I.M., T.A. and J.V.; software, A.I.M. and M.F.; supervision, A.M.R. and M.F.; writing—original draft, A.R.; writing—review & editing, M.F. All authors have read and agreed to the published version of the manuscript.
Funding
This work was supported by FEDER funds through the COMPETE 2020 Programme and National Funds through Fundação para a Ciência e a Tecnologia (FCT) under the projects MCTechs (POCI-01-0145-FEDER-029282), A. M. Rocha contract program 1337 and A. I. Machado grant BI/UI96/7887/2017.
Conflicts of Interest
The authors declare no conflict of interest.
References
- Erdogan, T. Fiber grating spectra. J. Lightwave Technol. 1997, 15, 1277–1294. [Google Scholar] [CrossRef]
- Wang, Y. Review of long period fiber gratings written by CO2 laser. J. Appl. Phys. 2010, 108, 081101. [Google Scholar] [CrossRef]
- Braiwish, M.I.; Bachim, B.L.; Gaylord, T.K. Prototype CO2 laser-induced long-period fiber grating variable optical attenuators and optical tunable filters. Appl. Opt. 2004, 43, 1789. [Google Scholar] [CrossRef] [PubMed]
- Vengsarkar, A.M.; Bergano, N.S.; Davidson, C.R.; Pedrazzani, J.R.; Judkins, J.B.; Lemaire, P.J. Long-period fiber-grating-based gain equalizers. Opt. Lett. 1996, 21, 336. [Google Scholar] [CrossRef]
- Shu, X.; Zhang, L.; Bennion, I. Sensitivity characteristics of long-period fiber gratings. J. Lightwave Technol. 2002, 20, 255–266. [Google Scholar] [CrossRef]
- Del Villar, I.; Fuentes, O.; Chiavaioli, F.; Corres, J.M.; Matias, I.R. Optimized strain long-period fiber grating (LPFG) sensors operating at the dispersion turning point. J. Lightwave Technol. 2018, 36, 2240–2247. [Google Scholar] [CrossRef]
- Smietana, M.; Bock, W.J.; Mikulic, P.; Chen, J. Increasing sensitivity of arc-induced long-period gratings—Pushing the fabrication technique toward its limits. Meas. Sci. Technol. 2010, 22, 015201. [Google Scholar] [CrossRef]
- James, S.; Tatam, R. Optical fibre long-period grating sensors: Characteristics and application. Meas. Sci. Technol. 2003, 14, R49–R61. [Google Scholar] [CrossRef]
- Esposito, F.; Zotti, A.; Ranjan, R.; Zuppolini, S.; Borriello, A.; Campopiano, S.; Zarrelli, M.; Iadicicco, A. Single-Ended Long Period Fiber Grating Coated with Polystyrene Thin Film for Butane Gas Sensing. J. Lightwave Technol. 2018, 36, 825–832. [Google Scholar] [CrossRef]
- Janczuk-Richter, M.; Gromadzka, B.; Richter, Ł.; Panasiuk, M.; Zimmer, K.; Mikulic, P.; Bock, W.J.; Maćkowski, S.; Śmietana, M.; Niedziółka Jönsson, J. Immunosensor Based on Long-Period Fiber Gratings for Detection of Viruses Causing Gastroenteritis. Sensors 2020, 20, 813. [Google Scholar] [CrossRef]
- Davis, D.D.; Gaylord, T.K.; Glytsis, E.N.; Mettler, S.C. CO2 laser-induced long-period fibre gratings: Spectral characteristics, cladding modes and polarisation independence. Electron. Lett. 1998, 34, 1416. [Google Scholar] [CrossRef]
- Zhong, X.; Wang, Y.; Liao, C.; Yin, G.; Zhou, J.; Wang, G.; Sun, B.; Tang, J. Long Period Fiber Gratings Inscribed With an Improved Two-Dimensional Scanning Technique. IEEE Photonics J. 2014, 6, 1–8. [Google Scholar] [CrossRef]
- Almeida, T.; Oliveira, R.; André, P.; Rocha, A.; Facão, M.; Nogueira, R. Automated technique to inscribe reproducible long-period gratings using a CO2 laser splicer. Opt. Lett. 2017, 42, 1994. [Google Scholar] [CrossRef] [PubMed]
- Kim, B.H.; Park, Y.; Ahn, T.-J.; Kim, D.Y.; Lee, B.H.; Chung, Y.; Paek, U.C.; Han, W.-T. Residual stress relaxation in the core of optical fiber by CO2 laser irradiation. Opt. Lett. 2001, 26, 1657. [Google Scholar] [CrossRef]
- Hutsel, M.R.; Gaylord, T.K. Residual-stress relaxation and densification in CO2-laser-induced long-period fiber gratings. Appl. Opt. 2012, 51, 6179–6187. [Google Scholar] [CrossRef]
- Hirose, T.; Saito, K.; Takada, K. Mid-infrared spectroscopic detection of refractive index in CO2 laser-written long-period fibre grating. Electron. Lett. 2008, 44, 1187–1188. [Google Scholar] [CrossRef]
- Li, Y.; Wei, T.; Montoya, J.A.; Saini, S.V.; Lan, X.; Tang, X.; Dong, J.; Xiao, H. Measurement of CO2-laser-irradiation-induced refractive index modulation in single-mode fiber toward long-period fiber grating design and fabrication. Appl. Opt. 2008, 47, 5296–5304. [Google Scholar] [CrossRef]
- Bhatia, V. Temperature-insensitive and strain-insensitive long-period grating sensors for smart structures. Opt. Eng. 1997, 36, 1872. [Google Scholar] [CrossRef]
- Yariv, A. Coupled-mode theory for guided-wave optics. IEEE J. Quantum Electron. 1973, 9, 919–933. [Google Scholar] [CrossRef]
- Shu, X.; Zhang, L.; Bennion, I. Fabrication and characterisation of ultra-long-period fibre gratings. Opt. Commun. 2002, 203, 277–281. [Google Scholar] [CrossRef]
- Fleming, J.W. Dispersion in GeO2-SiO2 glasses. Appl. Opt. 1984, 23, 4486–4493. [Google Scholar] [CrossRef] [PubMed]
- Rocha, A.M.; Almeida, T.; Nogueira, R.N.; Facão, M. Analysis of power transfer on multicore fibers with long-period gratings. Opt. Lett. 2015, 40, 292–295. [Google Scholar] [CrossRef] [PubMed]
| Publisher’s Note: MDPI stays neutral with regard to jurisdictional claims in published maps and institutional affiliations. |
© 2020 by the authors. Licensee MDPI, Basel, Switzerland. This article is an open access article distributed under the terms and conditions of the Creative Commons Attribution (CC BY) license (http://creativecommons.org/licenses/by/4.0/).


