Article

Determination of the Dielectric Properties of Storage Materials for Exhaust Gas Aftertreatment Using the Microwave Cavity Perturbation Method

1
Bayreuth Engine Research Center (BERC), Department of Functional Materials, University of Bayreuth, 95440 Bayreuth, Germany
2
Institute of Energy Research and Physical Technologies, Clausthal University of Technology, 38640 Goslar, Germany
*
Author to whom correspondence should be addressed.
Sensors 2020, 20(21), 6024; https://doi.org/10.3390/s20216024
Submission received: 2 October 2020 / Revised: 16 October 2020 / Accepted: 20 October 2020 / Published: 23 October 2020
(This article belongs to the Section Chemical Sensors)

Abstract

:
Recently, a laboratory setup for microwave-based characterization of powder samples at elevated temperatures and different gas atmospheres was presented. The setup is particularly interesting for operando investigations on typical materials for exhaust gas aftertreatment. By using the microwave cavity perturbation method, where the powder is placed inside a cavity resonator, the change of the resonant properties provides information about changes in the dielectric properties of the sample. However, determining the exact complex permittivity of the powder samples is not simple. Up to now, a simplified microwave cavity perturbation theory had been applied to estimate the bulk properties of the powders. In this study, an extended approach is presented which allows to determine the dielectric properties of the powder materials more correctly. It accounts for the electric field distribution in the resonator, the depolarization of the sample and the effect of the powder filling. The individual method combines findings from simulations and recognized analytical approaches and can be used for investigations on a wide range of materials and sample geometries. This work provides a more accurate evaluation of the dielectric powder properties and has the potential to enhance the understanding of the microwave behavior of storage materials for exhaust gas aftertreatment, especially with regard to the application of microwave-based catalyst state diagnosis.

1. Introduction

In order to meet the legal emission standards, customized automotive exhaust gas aftertreatment systems are required. They are still subject of research today. New concepts have been presented in recent years with the aim of further reduction of emissions. One of these technologies is the radio frequency (RF)-based state diagnosis of automotive catalytic converters and filter systems. Using the microwave cavity perturbation (MCP) method, the loading state of an exhaust gas aftertreatment components can be measured operando, i.e., during operation, without contacting electrodes [1,2,3]. In this method, the catalyst housing serves as a cavity resonator, in which standing electromagnetic waves are excited at discrete frequencies via coupling elements (also designated as antennas). The properties of these so-called resonant modes depend on the dielectric properties of the installed catalyst or filter and therefore change with the loading state of the exhaust gas aftertreatment component.
A number of studies have already shown that the method can be successfully applied to many common types of catalysts and particulate filters. In case of gasoline engines, the RF approach can be used to determine the oxygen storage state of three-way catalytic converters (TWC) [4,5,6,7,8]. For coated gasoline particulate filters, both the degree of oxidation and the soot load can be evaluated [9,10]. In addition, the system has already been successfully applied to diesel vehicles. The ammonia load of a SCR (selective catalytic reduction) catalyst [11,12,13], the nitrogen oxide (NOx) storage of a lean NOx trap [14,15], and the soot load of a diesel particulate filter (DPF) [16,17] can be evaluated with the RF system.
These microwave-based systems are particularly useful for real-world applications. In this configuration, the catalyst or filter component always fills the largest part of the resonator volume. This setup is therefore not suitable for determining the exact dielectric properties of exhaust gas aftertreatment components and materials due to the large perturbation inside the cavity resonator. In order to optimize the technical application and to learn more about the radio frequency characteristics of exhaust systems, a cylindrical microwave test bench was recently presented, which allows applying more defined conditions [18]. The laboratory setup was developed to investigate small samples, such as the pure storage component of a catalyst or a crushed catalyst, at typical operating conditions. With this setup, H-form and Cu-exchanged ZSM-5 powders for SCR applications could be characterized dielectrically in detail [19,20]. Recently, a study was published that deals with the RF response of ceria (CeO2), the oxygen storage component of the TWC [21]. The effect of Pt on the reducibility of CeO2 at low temperatures was also confirmed with the microwave technique.
The specially developed laboratory test setup enables a much more precise examination of powder samples for exhaust gas aftertreatment and provides fundamental knowledge about their RF characteristics. Nevertheless, the exact calculation of material properties for the investigated samples is not trivial, since some conditions of the classical microwave cavity perturbation theory (MCPT) are not completely met. Previous publications use a simplified approach and deliver at least basic statements about the relative change of the polarization ε1 and the dielectric loss ε2 during operation. However, exact values cannot be determined with this method.
In this study, an approach is presented that allows the exact calculation of the dielectric sample properties. In the first section, the existing resonator is briefly introduced, and the measurement method is evaluated according to the criteria of the simplified MCP theory. Subsequently, approaches to describe the essential effects in the resonator beyond the simplified MCPT are presented. The work combines accepted analytical ideas with results from electric field simulations of the existing setup. The focus of this work is on the consideration of the electric field distribution in the resonator as well as on the depolarization of the sample and the calculation of material properties from the effective bulk properties of the powder. The presented approach is verified with first measurements on a ceria sample by comparison with literature findings. Finally, the accuracy of the calculation method, alternative approaches and the transferability of the solution to other typical materials for exhaust aftertreatment are discussed.

2. Laboratory Setup, Simulation Model and MCP-Fundamentals

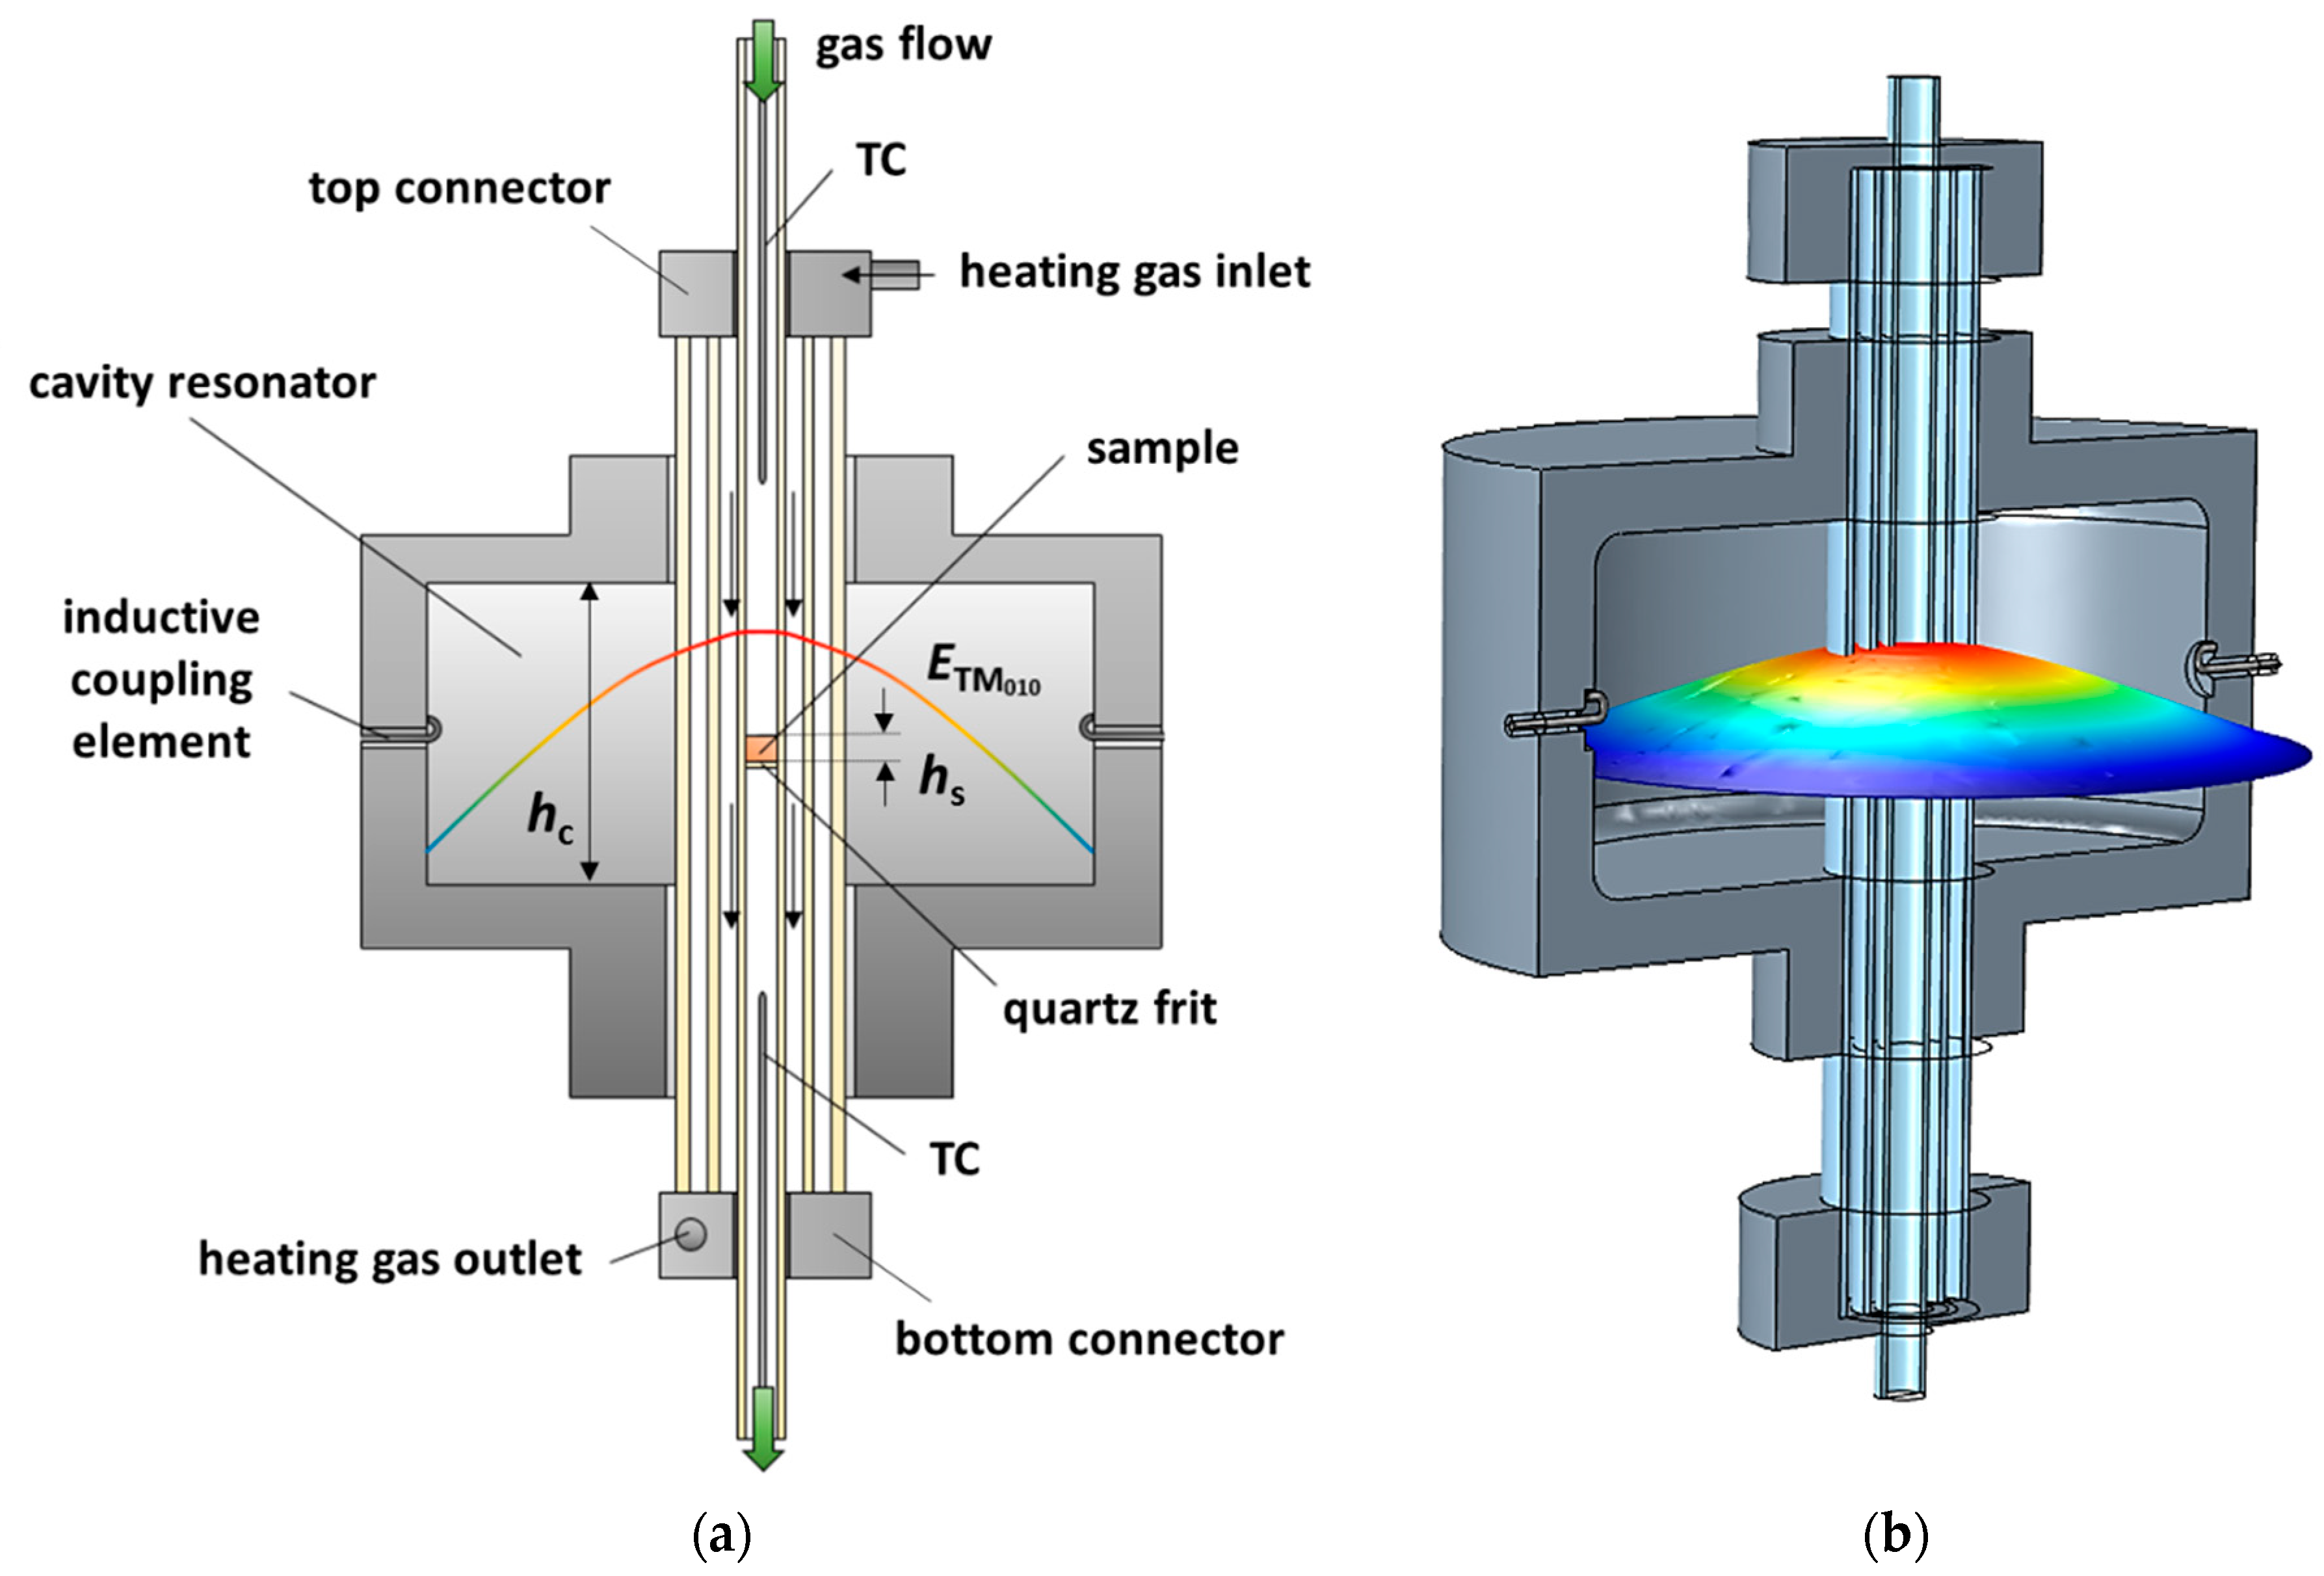
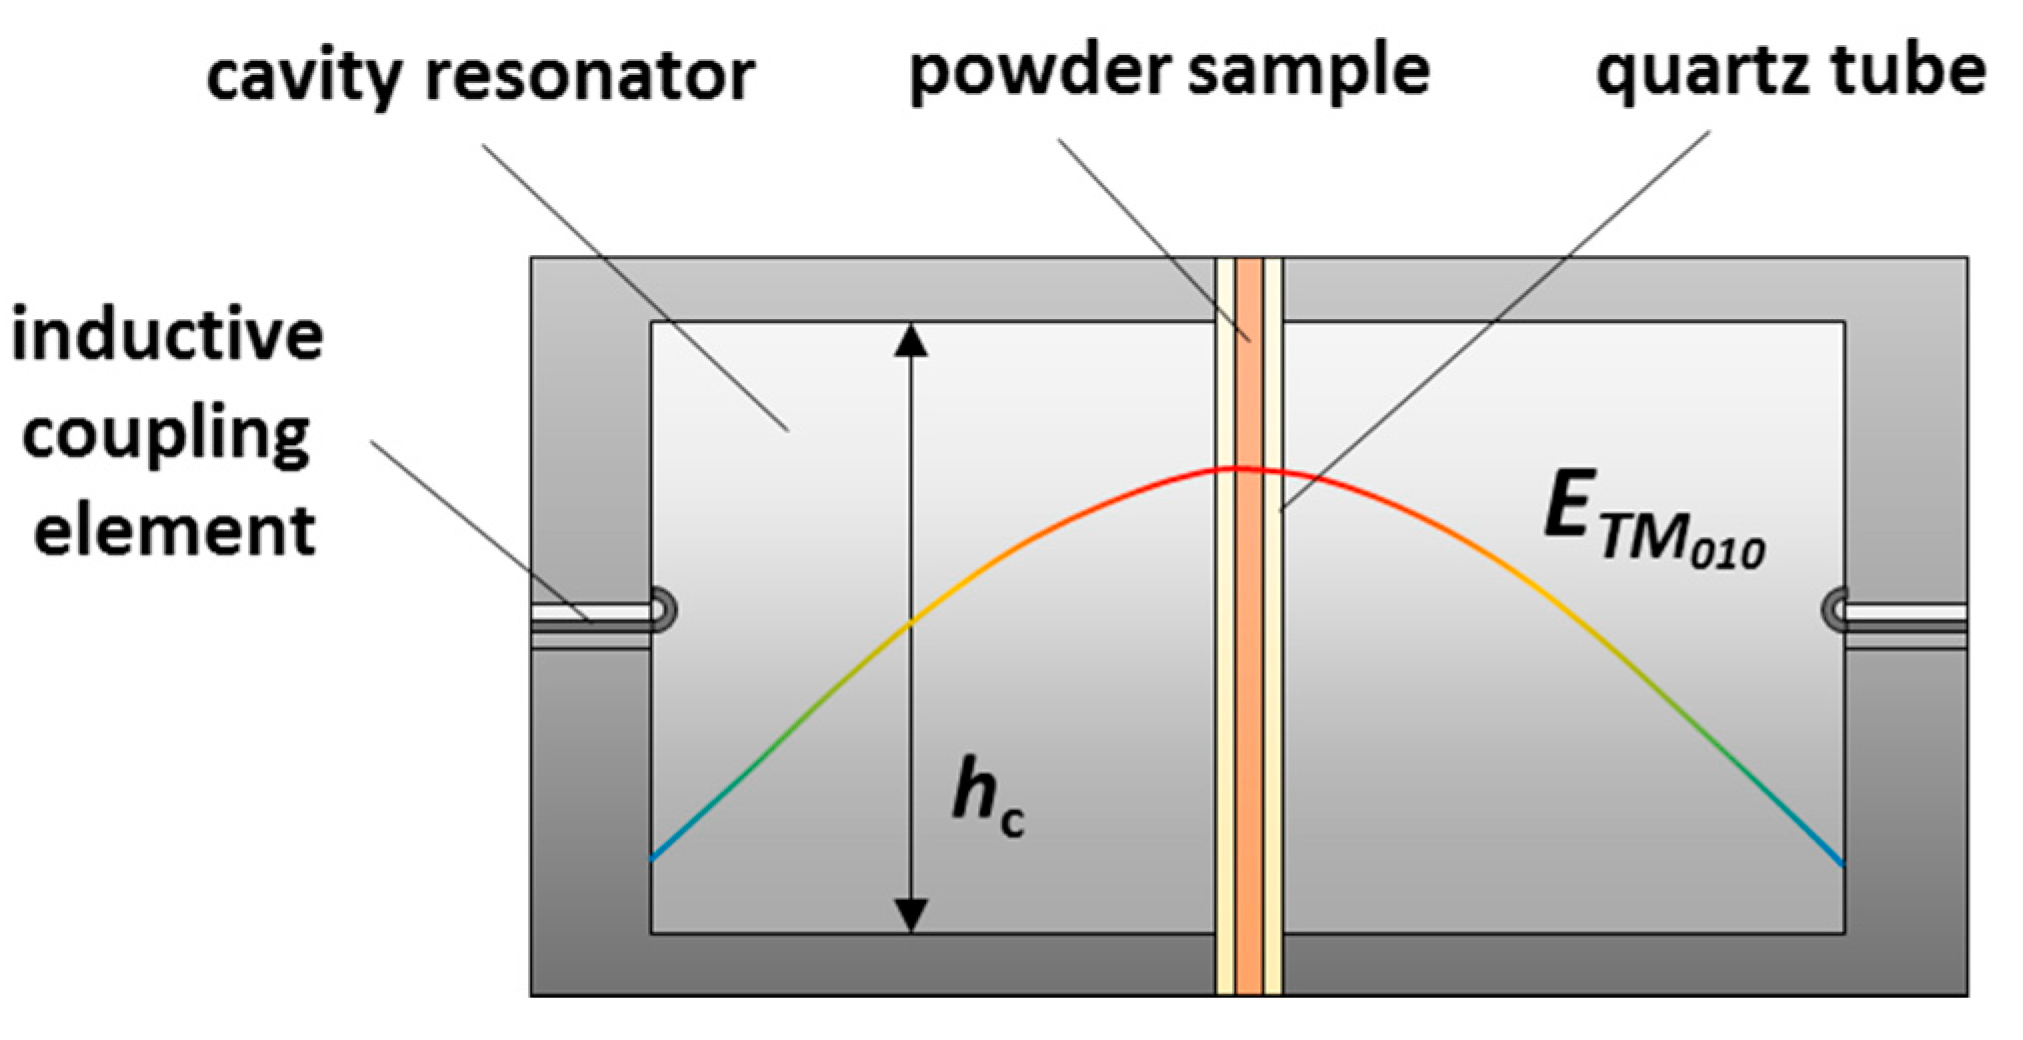
2.1. Resonator Setup

Figure 1a shows the schematic sectional view of the resonator geometry and Figure 1b demonstrates the three-dimensional simulation model. The cylindrical cavity resonator (Ø 184 mm, height hc 80 mm) is made of aluminum. Several quartz glass tubes are inserted along the resonator axis. The sample with a height hs is located in the center of the resonator cavity on a porous quartz glass frit in the inner tube (Ø 10 mm) and can be flushed vertically with different process gases. The inner sample tube is encased by a double tube (Ø 20 mm and Ø 38 mm). The space between the double tube is evacuated to minimize thermal losses. Around the inner sample tube, the sample is heated indirectly by flowing heating gas (hot air), which allows sample temperatures of up to 600 °C. To measure the sample temperature, the NiCr-Ni thermocouples (TC) are inserted into the sample tube from above and below the resonator. Thus, the sample temperature is determined by taking the arithmetic mean of both temperatures [18]. Additionally, the thermocouples penetrate the sample tube only so far that they do not affect the RF measurement. A circulated water cooling is used to maintain the room temperature of the aluminum resonator during the operation. Further details on the design (sealing system, temperature distribution, thermal considerations, etc.) and more technical specifications can be found in [18].
Electromagnetic energy provided by a vector network analyzer (Anritsu ShockLine MS46322b) is coupled inductively into the cavity resonator via two loop antennas. At certain frequencies, standing waves, so-called resonant modes, propagate within the resonator cavity. The resonator is designed to dielectrically characterize samples with the TM0n0 modes (fTM010 = 1.18 GHz, fTM020 = 2.62 GHz, fTM030 = 4.19 GHz). Usually, these modes have a constant E-field maximum along the resonator axis. The sample is, therefore, always located in the electric field maximum, the area with the highest RF sensitivity. The field distribution of the TM010 fundamental mode, which has exactly one field maximum along the resonator axis, is shown qualitatively in Figure 1a,b.
In the following, a comprehensive simulation model (COMSOL Multiphysics® 5.5), reflecting the detailed cavity resonator design is used as well (Figure 1b). Implemented are the resonator housing made of aluminum (conductivity σAl = 3.8 107 S/m), the quartz glass tubes (dielectric constant εr,quartz’ = 4.35, no losses), and antennas as well as the top and bottom connectors made of stainless steel (σSteel = 4.0⋅106 S/m). For air as the filling medium, a dielectric constant εr,air’ = 1 and magnetic constant µr,air’ = 1 were assumed. Calculations for the electrical field distributions were carried out by a modal analysis (eigenvalue problem).

2.2. Microwave Cavity Perturbation Theory

Using the MCP method, the dielectric properties of the sample are determined by means of the differential measurement between the empty and a sample-filled resonator. The sample has the complex permittivity ε [22,23]:
ε = ε j ε = ε r ε 0 j ( ε r ε 0 + σ ω ) ,
with the permittivity ε and the dielectric loss ε . The permittivity ε is the product of the more commonly used relative dielectric constant ε r of the sample and the permittivity of the vacuum ε0 = 8.854 ⋅ 10−12 As/(Vm). The dielectric losses ε include the (relative) losses ε r due to the sample polarization in the alternating electromagnetic field as well as the ohmic losses due to the electric conductivity σ. The ohmic loss is a function of the circular frequency ω = 2πf of the electromagnetic wave. The change in resonant properties of the cavity resonator due to the insertion of a sample can be derived from Maxwell’s equations. Generally, it has the from [22,23,24,25,26,27]:
( f 0 f S f 0 ) + j 2 ( 1 Q S 1 Q 0 )   = V C [ ( ε ε 0 ) E 1 E 0   + ( μ μ 0 ) H 1 H 0   ] d V V C ( ε 0 E 1 E 0   + μ 0 H 1 H 0   )   d V
with the cavity volume VC, the resonant frequencies f0 and fS, the (unloaded) quality factors Q0 and QS of the empty and filled resonator, the electric and magnetic fields E0 and H0 of the empty resonator, their complex conjugated fields E 0   , H 0   and the corresponding fields E1 and H1 of the filled resonator. For the volume outside of the sample the dielectric permittivity ε0 and the magnetic permeability µ0 of vacuum are assumed. In many cases this relation can be simplified. According to the classical MCP theory, the following correlation applies to the resonant properties of the TM0n0 modes of cylindrical resonators and the dielectric properties of an inserted sample, located in the central electric field maximum [22,23]:
Δ f f 0 = ( f 0 f S ) f 0   =   ( ε r 1 )   V S 2 V eff
Δ ( 1 Q )   =   1 Q S 1 Q 0   =   ε r   V S V eff
with the sample volume VS and effective volume Veff of the resonant mode (also denominated as mode volume). The mode volume considers the electric field distribution inside the cavity and corresponds to a kind of (inverse) “RF sensitivity” for the measurement method [22,23]. The smaller Veff, the higher is the change in the resonant parameters due to the insertion of a sample. The size of Veff for ideal cylindrical resonators can be calculated [22,23,25]:
V eff = J 1 2 ( p 0 n )   V res
with the Bessel function J1 of the 1st kind and 1st order and the n-th zero p0n of the Bessel function of the 1st kind and 0th order for the TM0n0 mode. In case of the TM010 mode Veff is 26.95% of Vres. In such cases, the dielectric properties of the sample can be calculated easily from the changes in the resonant properties. The validity of this approach is, however, subject to a number of basic pre-conditions that are particularly crucial for the investigation of powders for exhaust aftertreatment [22,23,24,25,26,27,28,29,30,31,32,33]:
  • The sample volume is small compared to the resonator volume.
  • The sample height and the resonator height are identical (hs = hc) or the sample has the shape of a thin rod at least.
  • The sample material is homogeneous and isotropic,
In addition to the listed pre-conditions, there are also other conditions that are not of interest for this study. Further approximations, for example, assume a sufficiently small change in resonant frequency [22]. Moreover, the approach according to the Equations (3) and (4) cannot be easily applied to high- and low-loss materials [33,34,35]. Nevertheless, we limit ourselves to the above-mentioned pre-conditions.

2.3. Evaluation for Investigations on Powders for Exhaust Gas Aftertreatment

The sample volume should be much smaller than the resonator volume for various reasons. Firstly, classical theory according to Equations (3)–(5) assumes that the electric field distribution in the resonator does not change with the insertion of the sample [22,23,24,25,30]. Since powder samples typically have a high porosity and can also be dosed flexibly in small amounts, it can be assumed, that the field disturbance caused by the introduction of the sample is negligible. Furthermore, the approach is only valid if the sample is located exactly in the electric field maximum [22,23,30]. For the presented resonator setup, the diameter of the sample is particularly critical. Especially for the higher TM0n0 modes, whose electric field maxima drop rapidly in radial direction, significant deviations are expected for a sample diameter of 10 mm. A better consideration of the electric field distribution inside the resonator can be achieved by a simulative approach.
Another more important aspect is that the MCP method is only applicable to the analysis of rod-shaped samples. These samples should fit through the cavity from the bottom to the top plane along the resonator axis or have at least the shape of a thin rod [24,25,31,32]. For powder samples it is conceivable to adapt the height of the filling hs to the height of the resonator. However, the perturbation of the electric field also increases with the amount of powder. Especially for samples with high permittivity or high dissipation factor (tanδ = ε / ε ), the accuracy of the method quickly diminishes [34,35]. This fact is particularly crucial for the investigation of storage materials for exhaust gas aftertreatment (such as zeolites, ceria), since their dielectric losses increase rapidly with adsorption or reduction, and with temperature as well [19,20,21,36,37].
Since the modification of the sample diameter is not an option in this case, to reduce the quantity of the sample is recommended. However, samples with a height hs less than the height of the cavity hC generate a depolarization field that counteracts the excitation field and weakens the net field inside the sample [24,25,32,38,39,40]. In the literature, various approaches to describe the depolarization effect have been established using different approximations for the resonator type (rectangular, cylindrical, split-ring) and sample dimensions [32,38,39,40]. In this study, a method is presented based on theories to account for depolarization in a cylindrical resonator using the TM0n0 modes for different cylindrical sample geometries.
Furthermore, the MCP method is only suitable for the investigation of homogeneous and isotropic materials—usually solid samples [22,23,24,25]. Instead, the bulk volume of a powder consists of the volume of the powder particles and the porosity fraction of the surrounding medium (air). For powders with sufficiently small particles, however, the distribution of particles and the surrounding air can be assumed to be homogeneous. In literature, the complex permittivity of powders is most commonly described by mixing models with an effective medium approach [41,42,43]. This study provides guidance for choosing a suitable model and uses a recognized mixing model to calculate the intrinsic permittivity of solid powder particles.
For the correct determination of the complex permittivity of powder samples for exhaust aftertreatment, the field distribution of the modes, the depolarization of the sample and also the bulk density of the powder must be taken into account. The individual effects are discussed in the following.

3. Extension of the Microwave Cavity Perturbation Theory

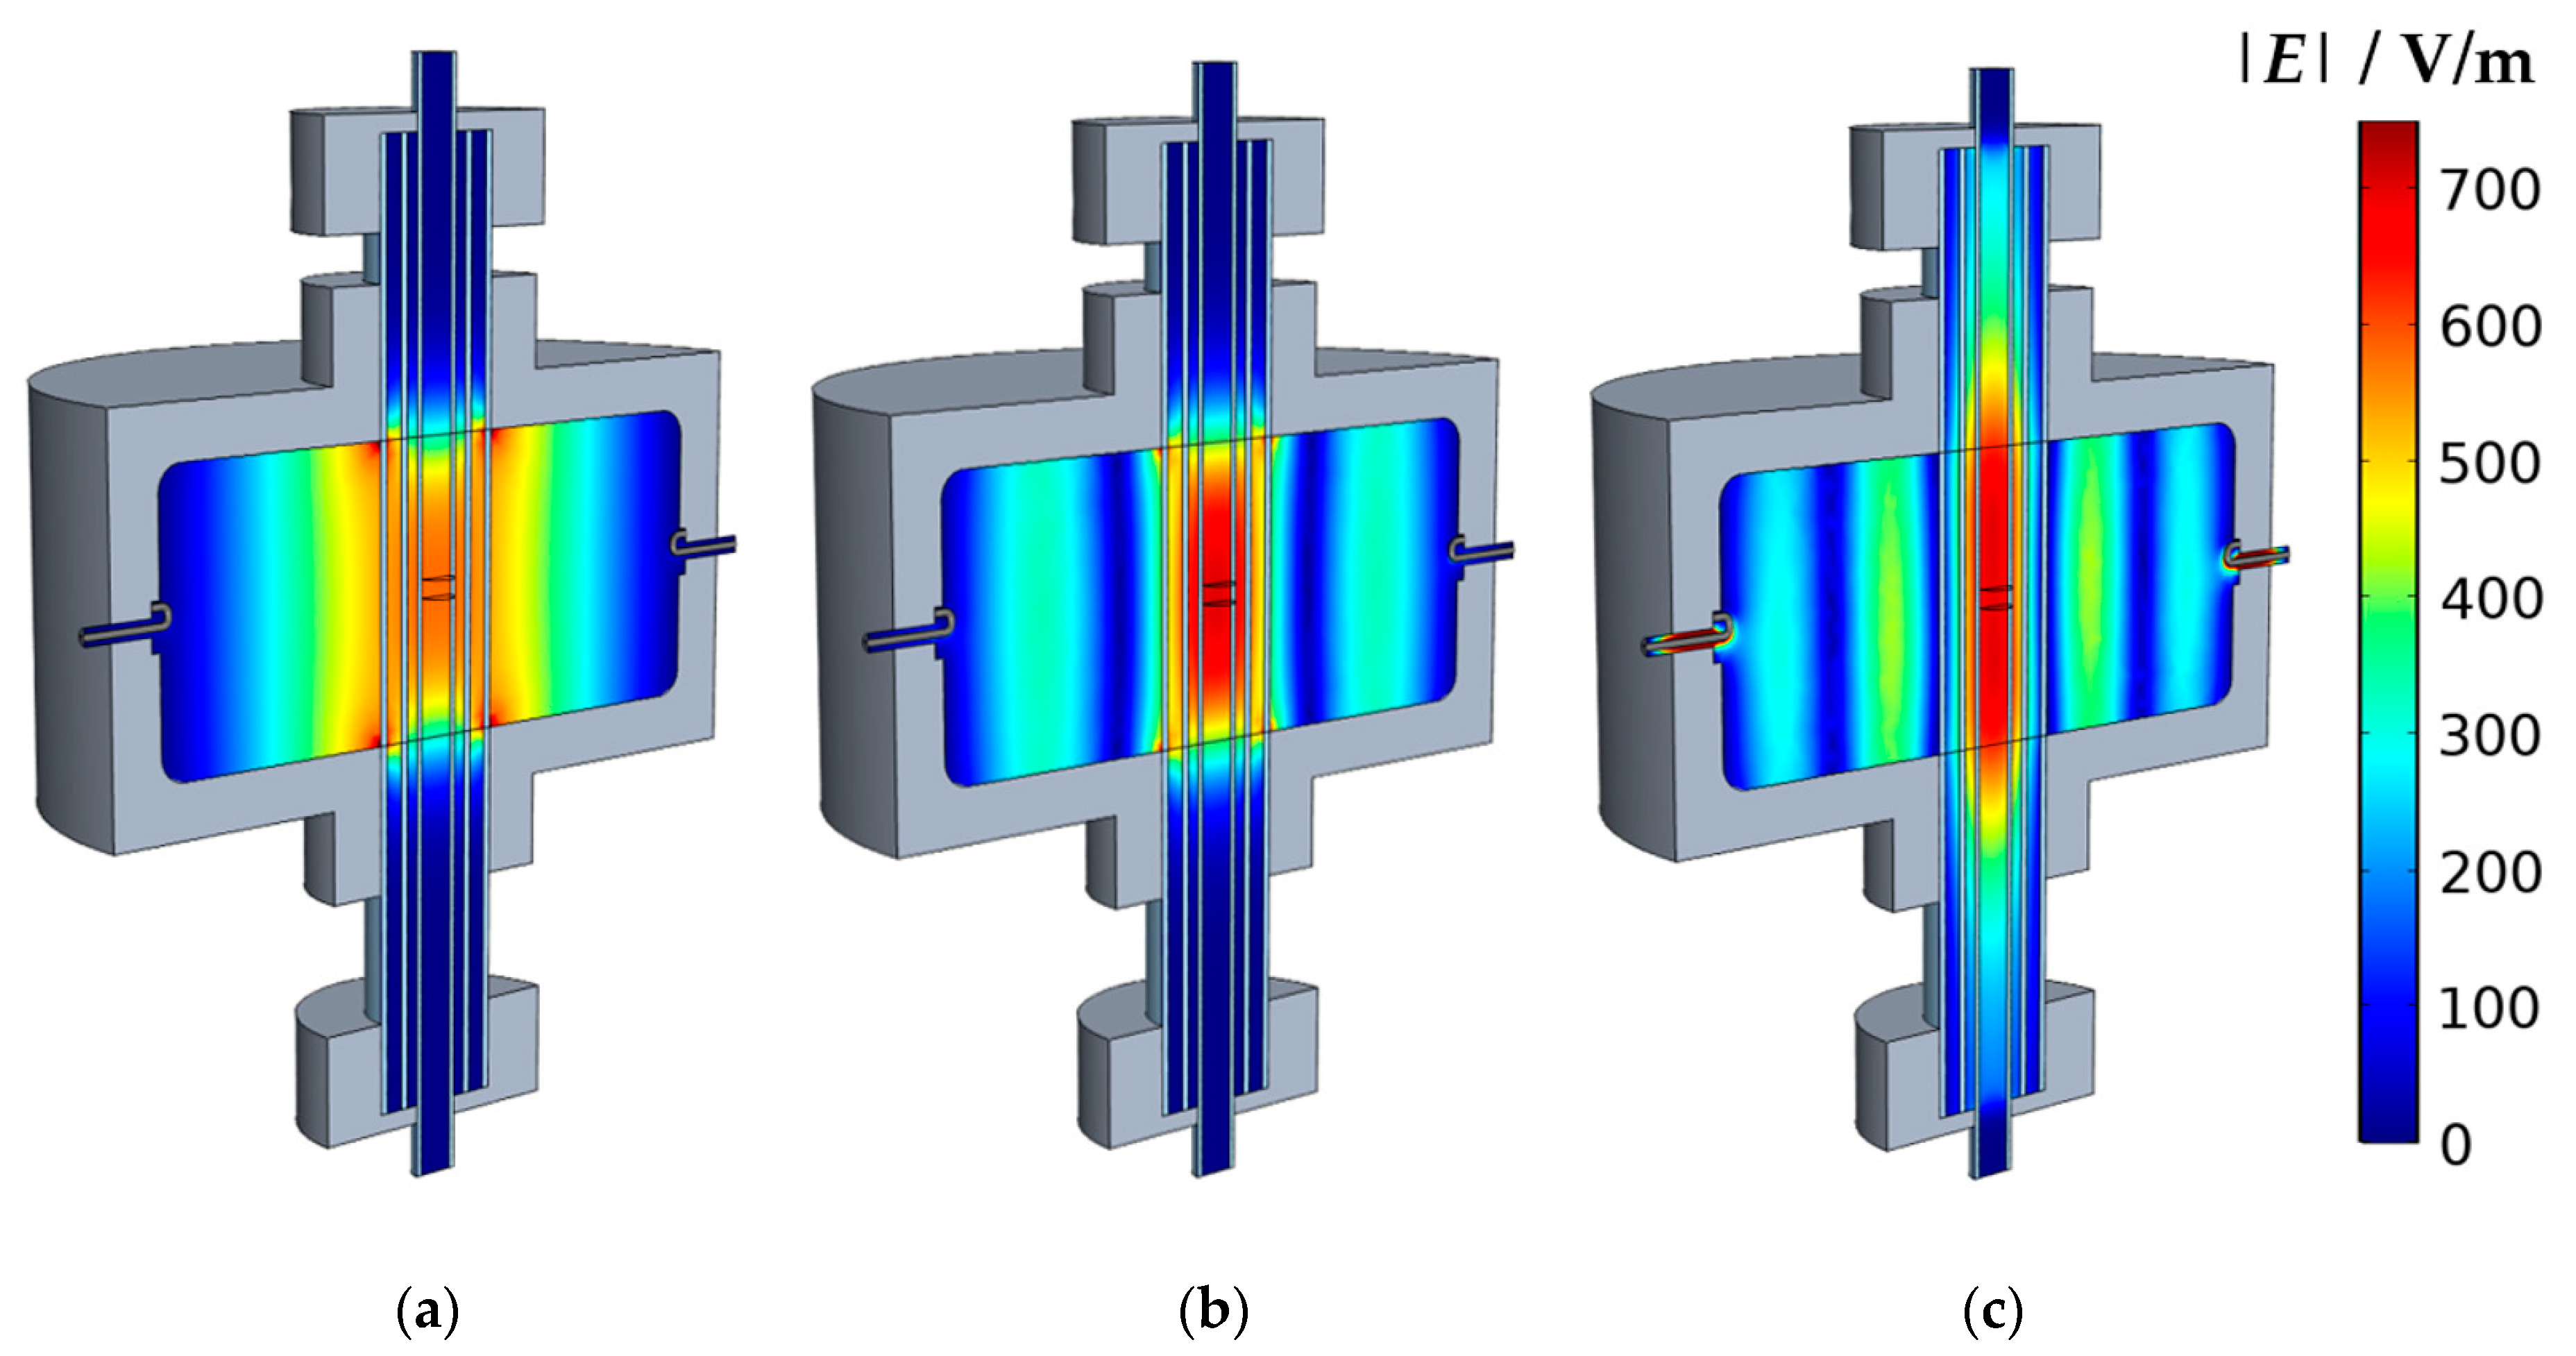
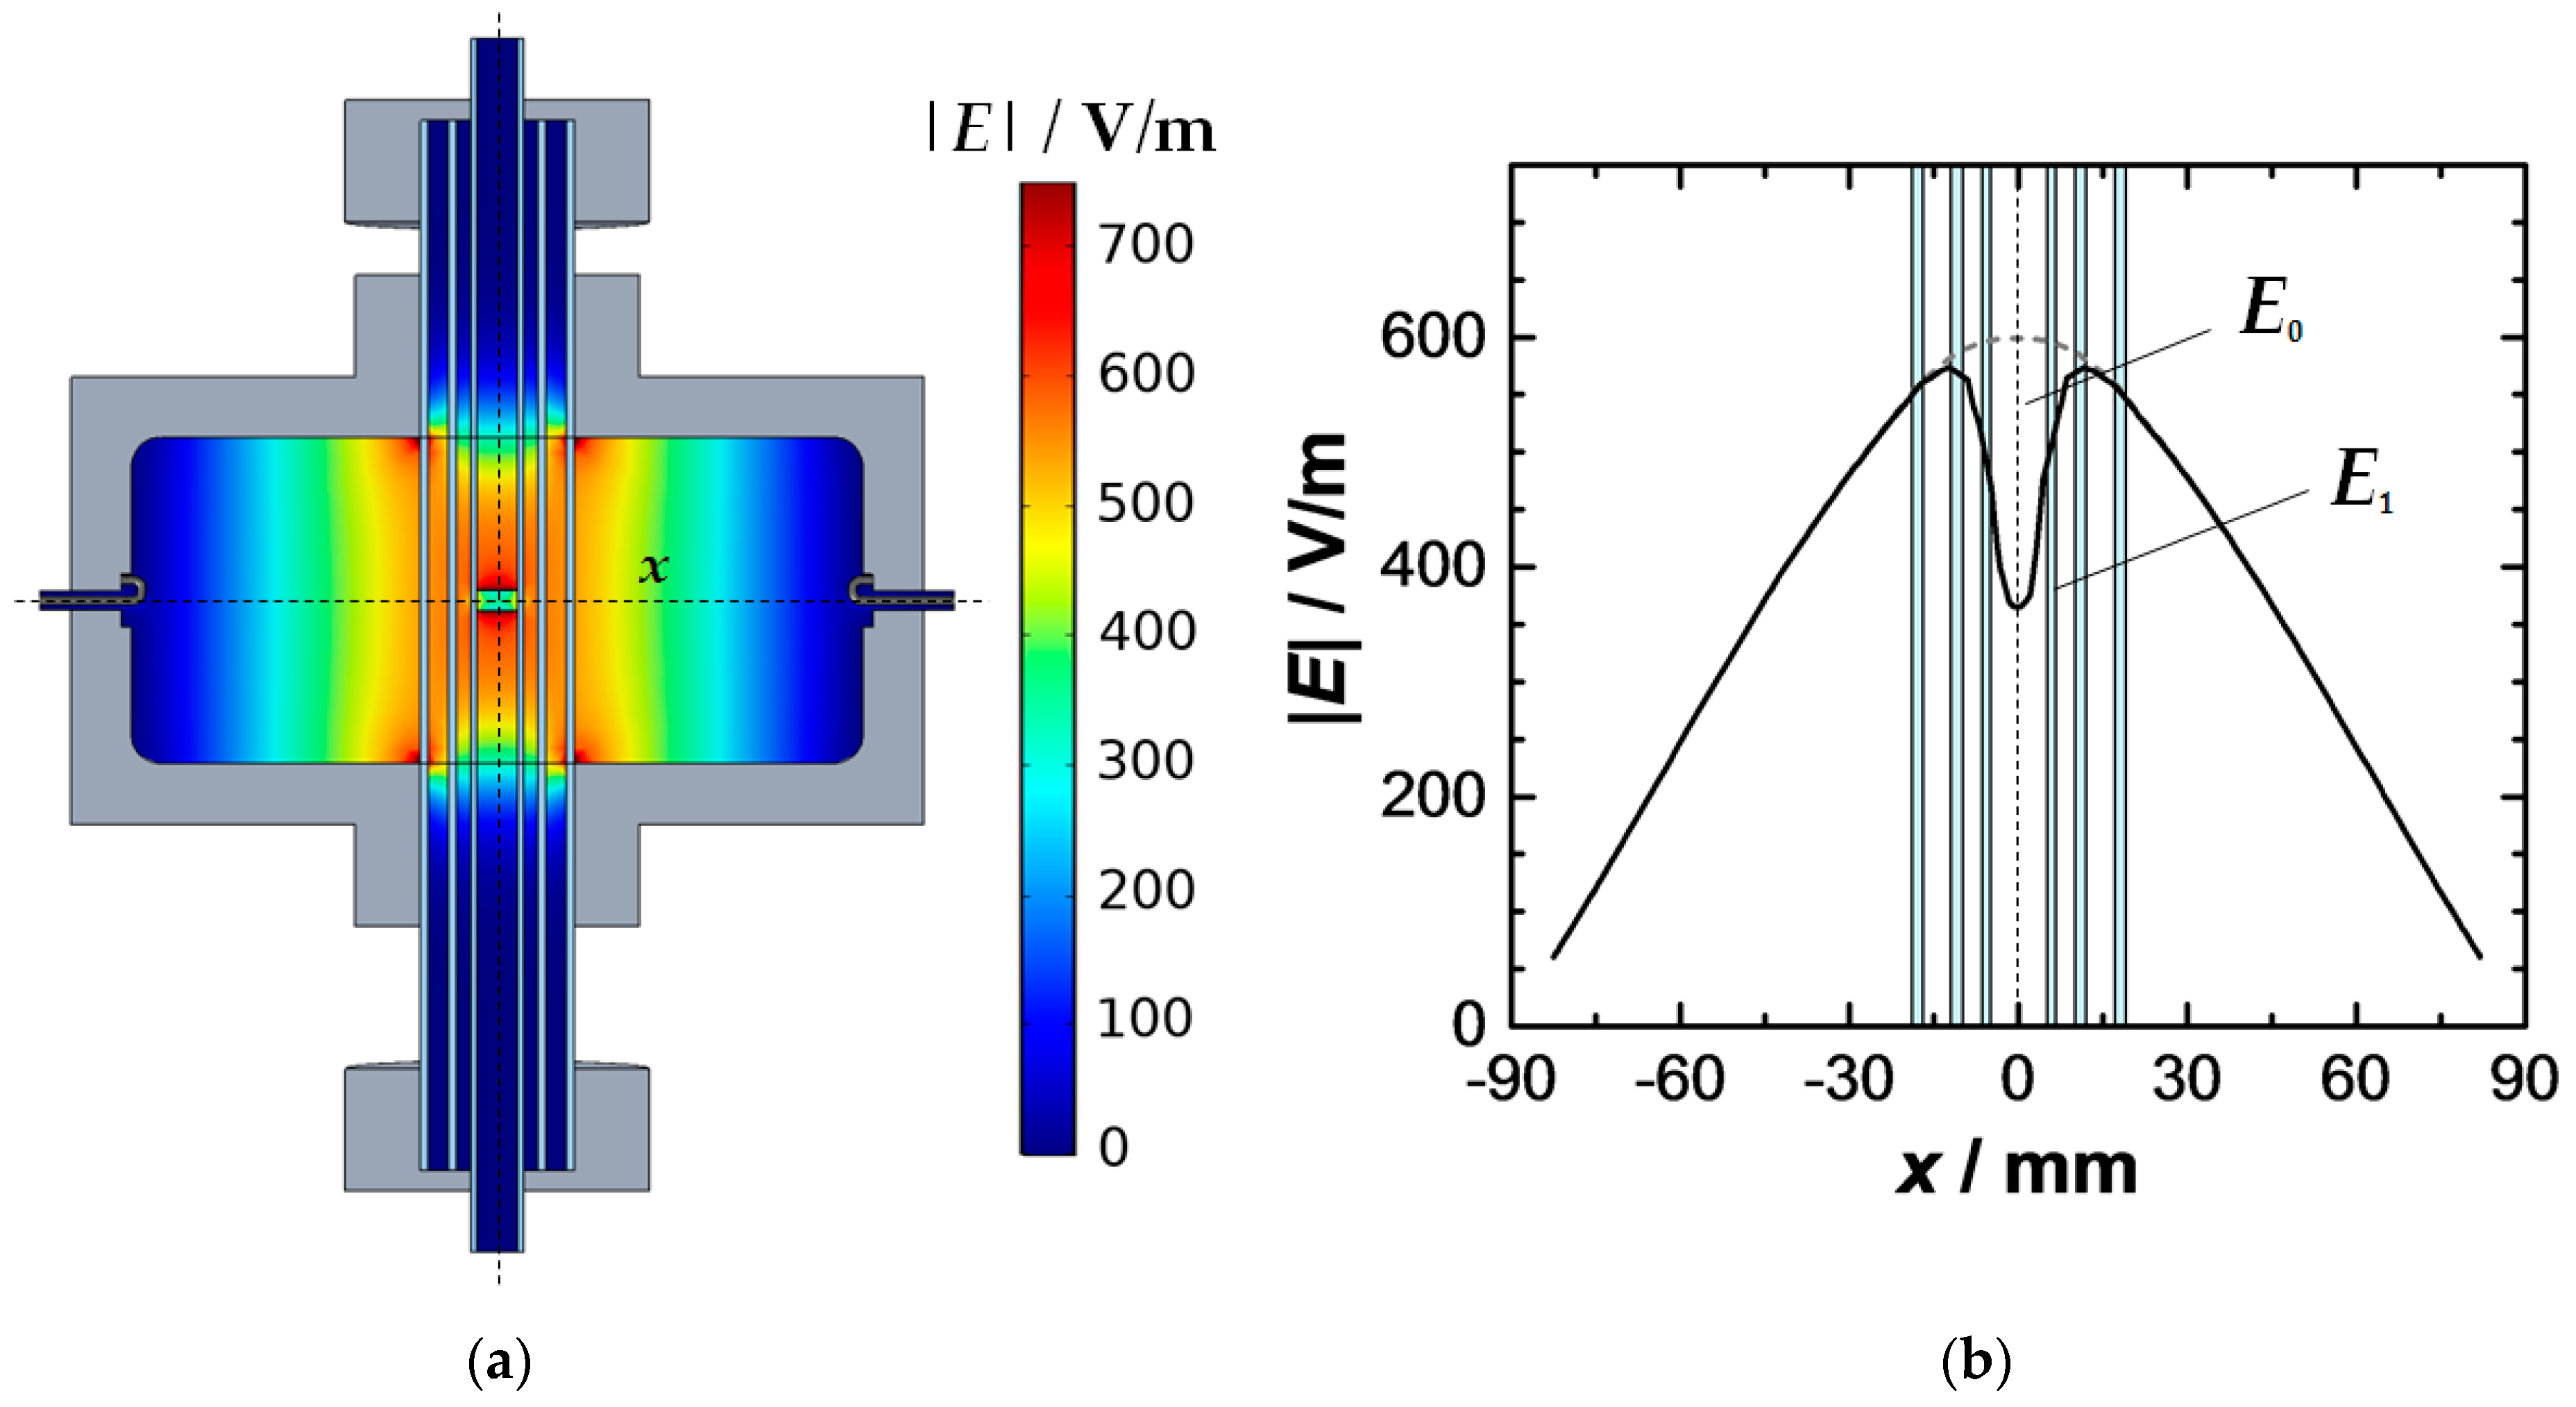
3.1. Electric Field Distribution Inside the Cavity Resonator

The exact determination of the modal volume Veff plays a central role for the correct evaluation of the properties of the introduced sample. The magnitude of Veff depends mainly on the field distribution inside the cavity and, thus, also on the resonant mode. Figure 2 shows the simulated field distributions |ETM0n0| of the (a) TM010, (b) TM020, and (c) TM030 modes. In the center of the resonator, the typical position and geometry of the sample is shown (hs = 5 mm), whose properties match those of the filling medium (air) in this case. As it can be expected for of the TM0n0 resonant modes, the electric field maximum is located along the resonator axis. While the TM010 has only one maximum in the center, the higher modes have ring-shaped secondary maxima around the central axis. The width of these maxima decreases with the increasing harmonic number.
Hence, the approximation that the entire sample is located exactly in the area of the maximum electric field is doubtful, especially for the higher modes, since the electric field already decreases significantly in radial direction within the sample. This effect leads to a reduction in the RF sensitivity, or to a higher Veff, respectively. Therefore, a significant deviation from the theoretical value (simplified approach) for ideal cylindrical resonators according to Equation (5) must be expected. Instead, a more precise value for Veff can be determined with an approach considering the electric field distribution [22,23]:
V eff = V s ( V s E 0 E 1 d V V c | E 0 | 2 d V ) - 1
Here, the sensitivity of the RF measurement is determined by the volume integrals of the electric E-field squares inside the sample and the resonator volume. For small powder samples with high porosity, E0 = E1 can be assumed, since its field perturbation is negligible. The calculated values for Veff inside the sample volume are shown in Table 1. For comparison, the values for the simplified approach for thin rod-shaped samples according to Equation (5) are also given. For the TM010 mode both results are obviously identical. The simplified approach may be used here, as the sample is well placed within the area of the maximum electric field (Figure 2a). The deviations between both methods (here <1%) could partially result from the accuracy of the model.
However, substantial deviations between both methods are observed for the TM020 and TM030 modes ((b) and (c)). Especially for the TM030, the simplified approach leads to significant other RF sensitivities, or Veff, respectively. The effect is correspondingly large for the derivation of the dielectric parameters. In the case of the relative permittivity ε r , the relative deviation Δεrel between the simplified approach and the method based on the integration of electric field squares can be expressed by considering Equation (3):
Δ ε rel = ε r ε r , th ε r =   ( ε r 1 ) ε r   ( 1 V eff , th V eff )
with the actual relative permittivity of the sample ε r , the actual modal volume V eff in the resonator determined by the simulation (Equation (6)), as well as the modal volume V eff , th (Equation (5)) and the determined dielectric constant ε r , th according to the simplified approach. Figure 3 shows the deviation Δεrel as a function of the dielectric constant ε r of the sample:
.
As expected, the error is negligible for the fundamental TM010 mode. For higher modes, the simplified calculation leads to significant errors. Already with smaller dielectric constants the deviations rapidly increase and rise (for ε r > 10) up to 15% in case of TM020 and exceed 40% for the TM030 mode. Hence, consideration of the real field distribution in the resonator is crucial for the correct determination of the dielectric properties in this case. For the investigation of a solid ceria sample (sintered pellet) with ε r = 23 [44,45,46] the approach of Equation (6) should be used. Nevertheless, even for powders whose effective dielectric constants are usually much smaller (depending on the bulk density of the powder), the error in the calculation using the simplified approach cannot be neglected. The extended approach provides a significant improvement for the evaluation of RF sensitivity when measuring a sample in the excitation field of the resonator.
At first sight, the dimension of Veff does not depend on the sample height, since the electric field along the resonator axis remains constant for the TM0n0 modes. However, the simulation (Figure 2) shows that the electric field of all modes decreases towards the two openings at the resonator bottom and top plane. For samples with a larger hs it is, therefore, expected that the modal volumes Veff will increasingly differ from the ideal theoretical value. For longer samples, the method using the E-field squares is therefore already recommended for the TM010 mode. For smaller sample heights, the result for the modal volume remains widely stable, because the electric field changes along the symmetry axis can be neglected. The results shown in Table 1 and Figure 3 are therefore valid for samples with similar heights (hs ≈ 5 mm).
For TM030 mode (Figure 2c), the magnitude of the electric field strength also decreases from the center along the resonator axis. Furthermore, it is noticeable that the propagation of the main maximum is not limited to the cylindrical resonant cavity, but parts of the electric field are excited outside of it along the quartz tubes. Here, an approach that considers the electric field distribution provides more precise values for the modal volume Veff. However, the accuracy of approaches for cylindrical resonators is questionable in this case.

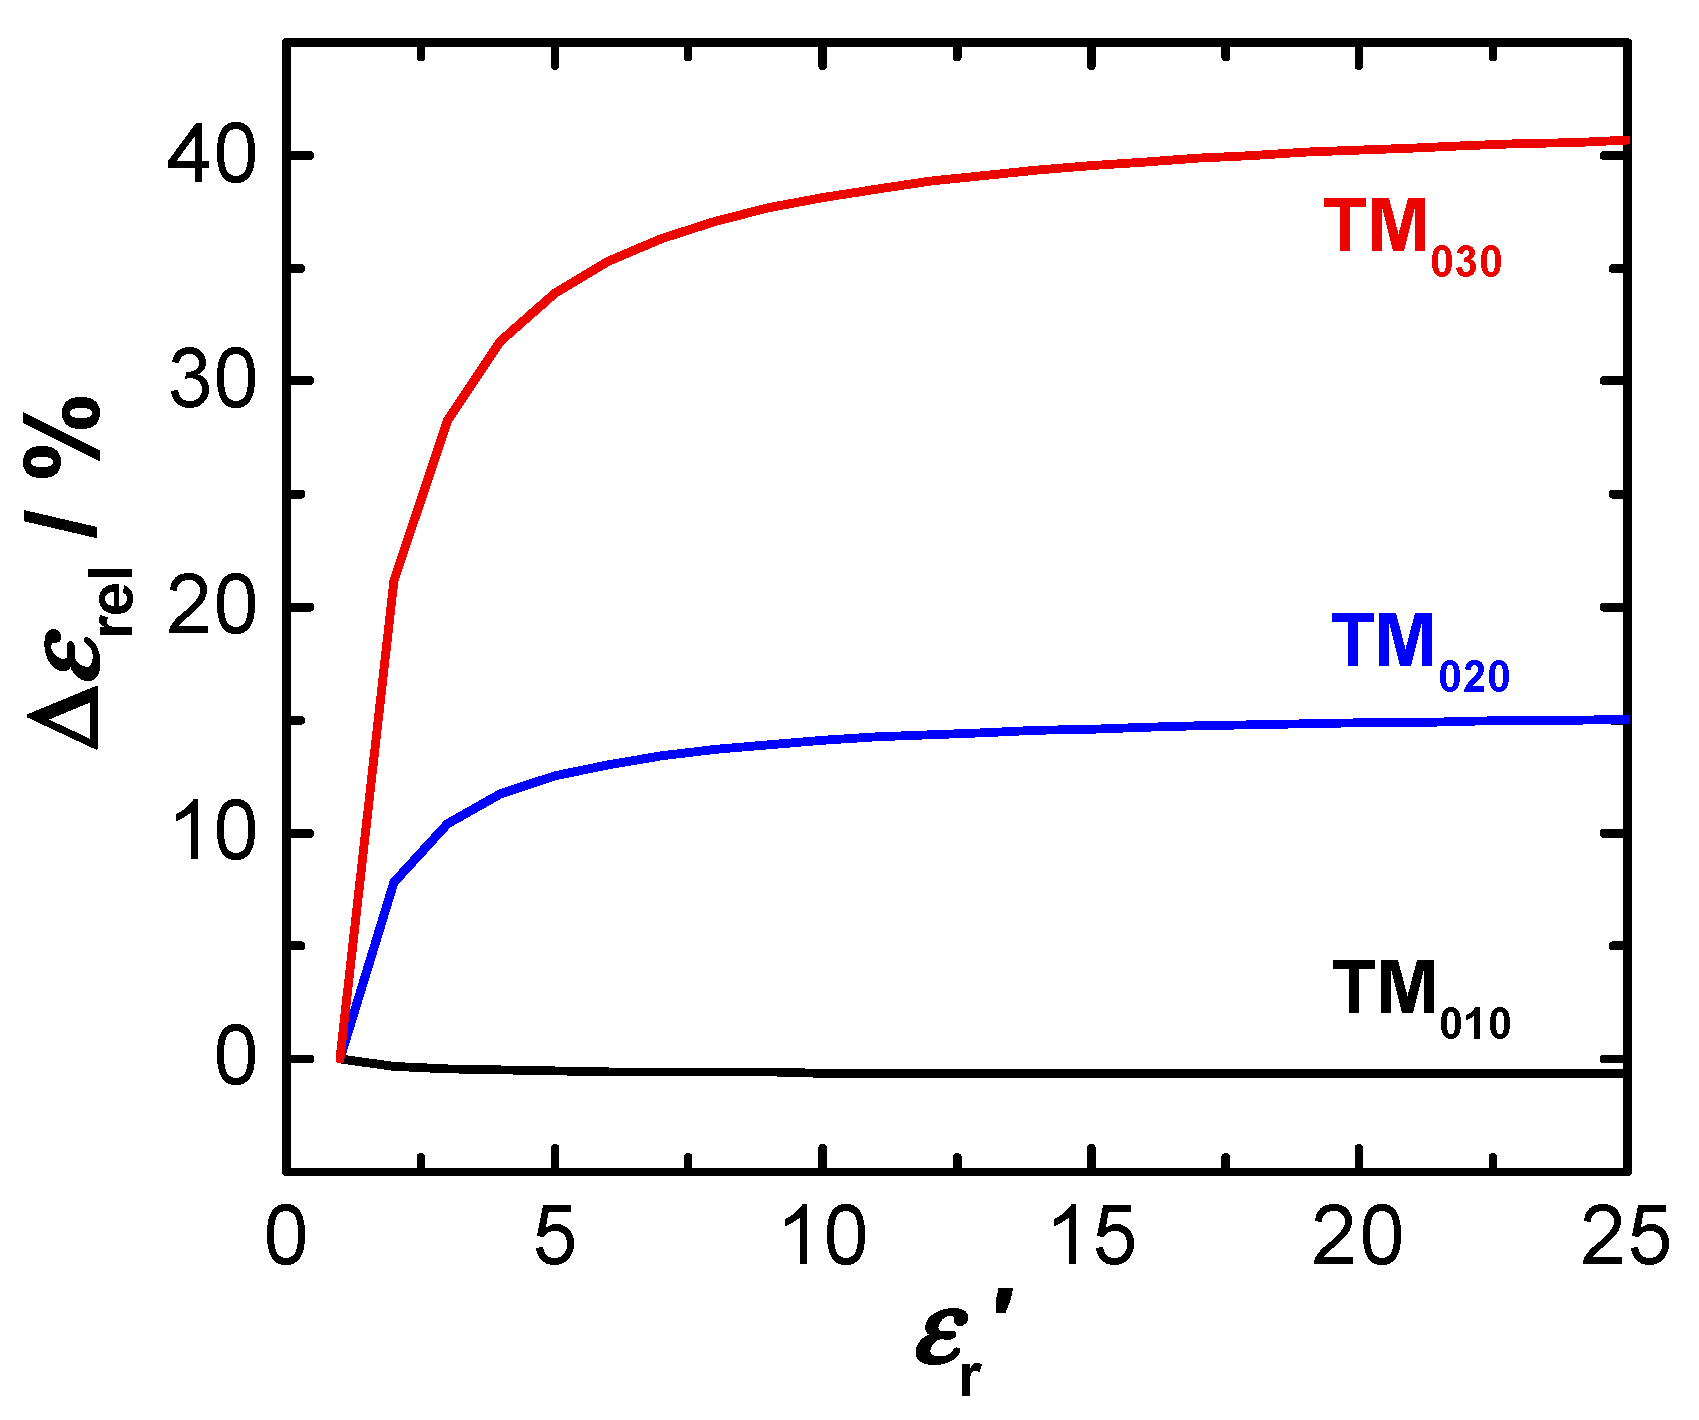
3.2. Depolarization Field of the Sample

For samples with hs < hc a depolarization effect is observed within their volume. The sample material causes a depolarization field against the excitation field of the resonator. It weakens the total electric field within the sample [24,25,32,38,39,40]. For cylindrical samples, the extent of the depolarization field increases with their diameter/height ratio. The effect is, thus, more significant for flat samples than for elongated [32,40,47]. In Figure 4 the effect of depolarization is demonstrated by a simulation. The weakening of the electric field within the sample volume (hs = 5 mm, ε r , eff = 2.59, ε r = 0) is clearly visible (Figure 4a). The chosen dielectric constant is typical for a loosely packed ceria powder, which will be investigated later to validate this study.
The electric field along the x-axis (dashed line in Figure 4a) is shown in Figure 4b. The comparison of the net field depolarized E1 (black) with the excitation field of the empty resonator E0 (grey dashed line) clearly shows the importance of the effect for the MCP method. Generally, the weakening of the electric field is also locally different. The depolarization is especially prominent in the vicinity of the upper and lower plane of the sample and decreases towards its center [40,47]. However, due to the small sample height, this local effect can hardly be observed for the selected sample shape. It should be noted that the permittivity of the sample also plays a role for the degree of depolarization. Materials with high dielectric constants yield a stronger depolarization field [40,47,48,49].
For the correct determination of the dielectric properties, a description of the sample depolarization and its effect on the RF measurement is essential. Equation (8) describes the general approach to consider the depolarization field in the sample volume [25,48]:
E 1 =   E 0 N P
with the electric (net) field within the sample E1, the excitation field E0 of the undisturbed resonator, the geometry-dependent depolarization factor N, and the polarization field P due to the introduction of the sample. The correlation between the polarization field P and a unidirectional excitation field E0 (here: z-axis) [38,46,49] is given by:
P = α   E 0 =   ( ε 1 ) E 0 1 + N z   ( ε 1 )
with the polarizability α and the depolarization factor Nz of the sample in z-direction. The depolarization factor N allows values between 0 and 1 and serves as a weighting factor for depolarization. Its magnitude depends on both the sample shape and the orientation of the sample in the excitation field. If the sample is polarized along all three spatial directions, the individual depolarization factors add up to a value of 1:
N x + N y + N z = 1
For a sphere, the depolarization factor is 1/3 in all directions, while a very flat sample has a value close to 1, when polarized along its short axis. An elongated sample would cause almost no depolarization when polarized along its long axis and would therefore have a depolarization factor close to 0. In order to describe the depolarization within the sample properly, a correct calculation of the depolarization factor is crucial. For the presented MCP method, the powder can well be considered as a cylindrical sample polarized along its symmetry axis. However, the calculation of the depolarization factor is not trivial for cylinders. A more common method uses spheroids as an approximation, for which closed solutions exist. The assumed spheroid and the inserted sample have identical volumes. For an oblate spheroid (axes a, b, c with b = c), polarized along the short axis, the depolarization factor can be calculated by [47,49]:
  N   =   m 2 m 2 1 m 2 ( m 2 1 ) 3 asin ( m 2 1 ) m
with the axis ratio m = c/a. Approaches also exist for prolate spheroids [47]. The method provides good approximations for N, especially for very flat and elongated geometries. If the height and diameter of the cylindrical sample are similar, larger deviations can still occur. In this case, a more accurate depolarization factor can be derived with a little correction for the sample polarizability [49]:
α cyl =   α sph + Δ α
with the polarizability αcyl of the cylindrical sample, the polarizability αsph of an ellipsoid with identical axial ratio and volume and the correction term for polarizability Δα. The correction term becomes small especially for very flat and very long samples. Values for Δα are, for example, tabulated in the numerical study [49]. However, the described method for determining the depolarization factor does not take into account conductive surfaces near the sample. For a sample inside the cavity, a change of the depolarization factor and, therefore, of the depolarization field is expected. Parkash et al. describe the effect on the depolarization factor of the sample using the mirror charge method [25]:
N e = N π h S 2 h c cot ( π h S 2 h c )
with the effective depolarization factor Ne, which still depends strongly on the sample shape and dimensions. In the resonator, however, it is also a function of the height ratio of sample hs and resonator hC. As mentioned above, the depolarization of the sample also affects the RF sensitivity. The approach according to Equation (8) must therefore be considered in (2). The correlation between the dielectric properties of the sample and the resonant properties of the TM0n0 modes of a cylindrical resonator (filling medium: ε0, µ0) with account for sample depolarization can be described by the following equations [25]:
ε r 1 = V c Δ f f 0 (   V S V C 2 V eff N e V C Δ f f 0   ) 1 4 N e V C   2 ( Δ 1 Q ) 2 ( V S V C 2 V eff N e V C Δ f f 0 ) 2 + 1 4 ( N e V C ) 2 ( Δ 1 Q ) 2
ε r =   1 2 V c ( Δ 1 Q ) ( V S V C 2 V eff N e V C Δ f f 0 ) 1 2 N e V C   2 Δ f f 0 ( Δ 1 Q ) ( V S V C 2 V eff N e V C Δ f f 0 ) 2 + 1 4 ( N e V C ) 2 ( Δ 1 Q ) 2
The equation is more comprehensive than the simplified correlation from Equations (3) and (4). The dielectric constant can no longer be determined solely from the change in the resonant frequency. The change of the quality factor must also be taken into account. The same applies to the dielectric loss of the sample. Parkash et al. have already shown that the sample properties for hs < hc can be determined much more precisely with the extended method.
To present the effect of the depolarization on the RF measurement in more detail, Equation (14) can be applied to the simulation model for the ceria powder. For this purpose, Table 2 shows the resonant properties of the filled and the empty resonator as well as the calculated effective depolarization factor and the derived dielectric constant of the sample. The resonant frequency and the quality factor of the empty resonator are provided by the simulation model shown in Figure 2. The resonant properties of the resonator with the depolarized ceria powder (hs = 5 mm, ε r , eff = 2.59) are determined with the model shown in Figure 4. For the sample geometry, an effective depolarization factor of 0.4354 is calculated, which meets the expectations for a slightly flat cylinder. For the modal volumes Veff of the TM0n0 modes the simulative results of Table 1 were used.
As Table 2 shows, the results for the dielectric constant of the powder according to Equation (14) ( ε r , eff = 2.52–2.66) are closer to the actual value ( ε r , eff = 2.59). The deviation for this sample is less than 3%. The depolarization factor of 0.4354 indicates that a significant field weakening occurs within the sample and the effect must be taken into account during the MCP measurement. If the calculation were conducted with Equation (3) without considering the depolarization, the dielectric constant would strongly deviate from the actual value ( ε r , eff = 1.91–1.97). In this case, the weakened net field within the sample were ignored, which consequently would reduce the signal amplitudes in the RF measurement. As a result, the dielectric constant of the sample would be interpreted as too low.
The investigation with the simulation model, thus, confirms that depolarization effects must be considered for a correct interpretation of the data, and the Equations (14) and (15) are suitable for a precise calculation of the dielectric material properties.

3.3. Bulk Properties of the Powder Samples

The most common theoretical approach to describe the complex permittivity of mixtures is a dielectric mixture model. The effective permittivity of mixtures is calculated from the partial volumes and permittivity of the individual components. In the literature, many other mixture models are reported, which can lead to very different results [41,42,43,50,51,52,53,54,55,56,57,58,59,60]. Whether a mixture model is suitable for the investigation on a certain material depends on the plausibility of the derived dielectric properties [41,42,43,53,54,55,56,57,58]. In contrast to the previous sections, a general approach that allows for the reliable calculation of the sample properties independent on the powder material can therefore not be given in this study. Instead, this report is limited to the investigation of a ceria powder, as this material is typical for applications in exhaust gas aftertreatment and will be used later to validate the presented method.
In the literature, a dielectric constant of ε r = 23 is reported for a solid ceria sample at room temperature under dry ambient conditions and frequencies in the microwave range [44,45,46]. Figure 5 shows the derived effective dielectric constant ε r , eff of a ceria powder according to various mixing models as a function of the volume fraction ν CeO 2 of the powder. The two Wiener boundaries (dashed lines) correspond to the theoretical maximum and minimum values for the effective dielectric constant and describe the powder with a parallel and series circuit of powder material and porosity fraction. As Figure 5 infers, a wide range of possible effective properties can be derived by frequently used dielectric mixture models (Lichtenecker, Maxwell–Garnett, etc.).
Farra et al., who also applied MCP, successfully used the dielectric mixing model according to Looyenga for calculation of the dielectric properties of ceria from the powder filling [61]. The Looyenga mixing model follows the common approach [43,53]:
( ε eff ) k = i n ν i ( ε i ) k
with the complex permittivity of the mixture εeff, the complex permittivity εi and the volume fraction νi of the i-th constituent and the number of constituents n. For Looyenga’s model the exponent k is 1/3 [53]. Since the effective medium approach according to Looyenga does not take into account the shape of the particles, the formula can be used especially well for homogeneous mixtures, such as powders in this case [53]. Other studies have also shown that compared to other mixing models, Looyenga’s model gives significantly better results for volume fractions <30%, which is typical for loose powder fillings, and for strongly dissipative particles, which could be important in the chemical reduction of ceria [54,55,56]. Theoretical reflections and findings of previous studies therefore indicate that the effective medium approach according to Looyenga might be suitable for investigations on ceria powders.
Whether Looyenga’s law also applies for this study, can be best clarified by a comparison between measurement results and findings from literature on known material states. Therefore, the ceria powder is investigated in a simplified resonator geometry at room temperature (Figure 6). Here, the ceria powder is located in a thin quartz glass tube (Øa 5 mm, Øi 3 mm) and fills the resonator (Ø 45 mm, hc = 40 mm) from the bottom to the top plane. To avoid water interferences, the sample was dried for 48 h at 120 °C. The volumetric proportion νCeO2 of ceria in the bulk is 20.6%. For the validation of a suitable mixture model, the TM010 mode is used, because of its superior reliability over the higher modes. For this resonator geometry, it occurs at around 2.5 GHz. The modal volume of the TM010 can be assumed to meet the theoretical value (26.95% of the cavity volume) in this case, since the diameter ratio between the sample and the cavity is even smaller than for the geometry of the original resonator presented in Figure 1. And since hs = hc, obviously, any sample depolarization is avoided, and the simplified approach according to Equations (3) and (4) is valid for the given configuration.
The results for the resonant frequencies and the effective dielectric constant ε r , eff of the powder and the ceria material are shown in Table 3. For the powder filling, ε r , eff = 2.59 was determined, which clearly indicates that the effective dielectric constant is significantly smaller than for solid ceria ( ε r = 23). When using Looyenga’s mixing model, a dielectric constant of 22.4 is calculated for ceria. Thus, the mixing model can be used to derive the dielectric properties, and previous studies are confirmed as well [61]. With other mixture models, the calculated properties strongly deviate from the expected values. For instance, Birchak’s or Lichtenecker’s mixing models, as listed in Table 3, provide significantly less accurate values for the dielectric constant. For other mixing rules, the deviations are even larger.
Even if Looyenga’s mixing rule provides useful results for ceria, a transfer to other materials is not easily possible. The plausibility of the mixture model must be re-checked in these cases. Zeolites and soot of exhaust gas aftertreatment systems are interesting for investigations by means of MCP as well. For these materials, other common mixture models such as those proposed by Kraszewski/Birchak [50], Bruggeman [52], Lichtenecker [57] or Maxwell–Garnett [59] could be more suitable. For the verification, however, an individual investigation is highly recommended.

4. Validation of the Measurement Method, Transferability and Alternative Approaches

The validation at the resonator is intended to ensure that the presented approach is suitable for determining both the dielectric constant and the dielectric loss of powder samples. In this study, a ceria powder sample (bulk density 20.6%) was investigated at room temperature and 600 °C, at which ceria acts as an oxygen storage material. This allows to investigate the oxidized and the reduced state (process gas: 21% oxygen (O2) in nitrogen (N2) and hydrogen-water mixture in N2 with pO2 ≈ 10−20 bar, respectively). Due to the formed free electrons in the reduced state and the thermally activated mobility due to the small-polaron conduction mechanism, the conductivity of the material is strongly increased. This behavior can be well described by the defect chemistry. Details on the defect chemistry of ceria and its effects on the electrical material properties, are provided in the literature [36,37], but is beyond the scope of this work. The results for the dielectric constant and the electrical conductivity according to the TM010, TM020, and TM030 signals are shown in Table 4a–c.
The calculation of the dielectric properties of the sample was carried out considering the field calibration (Section 3.1), the depolarization of the sample (Ne = 0.402) (Section 3.2), and the Looyenga mixing model (Section 3.3). The results for the measurement at room temperature are given in Table 4a. For the three modes, a dielectric constant of 22.6–23.8 was determined. The calculated properties are therefore consistent with findings from literature ( ε r = 23) [8,44,45,46]. However, the losses inside the material at room temperature are too low to be determined by the measurement method. To highlight the effects of the new approach on the MCP measurement, Table 4a also shows alternative calculations without considering the accurate electric field distribution or without considering the depolarization field. If the simplified approach according to Equation (5) is used for the field calibration, the dielectric constant can still be quite accurately determined with the TM010 mode ( ε r = 23.0). This finding is in line with the results from Section 3.1. However, for the higher modes, the RF sensitivity is assumed to be higher, yielding significantly underestimated dielectric constants ( ε r = 16.0 for the TM020 mode and ε r = 7.91 for the TM030 mode). This evidences that a precise consideration of the field distribution (Equation (6)) is essential for providing more accurate results for the higher modes. Similar observations can be reported if the depolarization of the sample is neglected (Ne = 0). In this case, the weakening of the net field within the sample is not considered, which effectively reduces the signal amplitudes in the RF measurement. Therefore, the determined dielectric constants are too low ( ε r = 11.2–11.5). Since depolarization depends mainly on the shape of the sample, the phenomenon affects all three modes equally. The additional calculations show obviously that the field distribution, the occurring depolarization and the powder filling are correctly considered and a successful determination of the dielectric properties of the sample is only possible if all three effects are combined in the calculation.
Furthermore, the data in Table 4b shows that the dielectric constant of ceria ( ε r = 17.6–22.8) remains nearly unaffected when heated to 600 °C. This observation agrees well with [8]. While almost identical values can be determined from the signals of TM010 and TM020 compared to the measurement at 25 °C, a slight decrease of the dielectric constant can be observed for the TM030 mode ( ε r = 23.8 at 25 °C, = 17.6 at 600 °C). This deviation can be explained by the properties of the TM030 mode, which shows a distinct stronger attenuation compared to the other two modes. This consequently leads to smaller quality factors (<1000) and restricts the precision of the measurement. The fact that the TM010 and TM020 modes are more reliable must, therefore, be attributed to the properties of the resonator itself and not to the presented approach. Due to the small signal amplitudes for oxidized ceria, reasonable conductivities can only be calculated from the TM010 and TM020 signals.
To determine the sample conductivity, it can be assumed, that the measured losses are purely from electrons and polarization losses can be neglected ( ε r = 0). Using the MCP method, an electrical conductivity of 1.58–1.79 · 10−5 S/cm can be determined for the oxidized ceria at 600 °C, which again corresponds well with values measured in the literature [36]. Thus, the approach also provides plausible values for the dielectric losses of ceria.
The measurements under reduced conditions (Table 4c) also show that the reduction of ceria causes an increased sample polarization and an increased conductivity, which is again well in line with previous literature [8,36,44,45,46,47]. The calculated conductivities are very similar for all modes (4.22–5.50 · 10−5 S/cm) and are close to the values reported in literature [36]. The conductivity can be determined even from the TM030, since the signal amplitudes are significantly higher due to the reduction of the sample. The results show that the presented method allows to successfully determine the dielectric properties of the ceria sample. The polarization and dielectric loss of the sample under typical operating conditions can be evaluated properly. The presented method now takes into account the field distribution in the resonator, the depolarization of the sample and the filling of the powder. The approach extends the application range of MCP measurements significantly and provides reliable information about the dielectric properties of the inserted sample.
However, the approaches are subject to some assumptions that have to be met. It was assumed for the electric field calibration of the resonator that the excitation field E0 does not change when the sample is introduced. For sufficiently small samples, the values for the field calibration (Veff) remain identical. However, for samples with a large volume Vs or a high (effective) dielectric constant, the disturbed field has to be taken into account. This could be necessary, for example, if the bulk densities or dielectric constants of the powder particles are significantly higher. Due to the low package density of powders, the assumption should be justified in most cases. For example, the measured dielectric constant ε r , eff for ceria was only 2.59 at a ceria volume fraction of 20.6%.
The calculation of an exact depolarization factor for the sample is much more difficult. On the one hand, the accuracy of approximation of the powder sample shape as an ideal cylinder will decreases with sample heights hs. On the other hand, errors in the estimated sample height lead to larger changes in the depolarization factor for smaller samples. In addition, Parkash et al. have already indicated that the approach according to Equations (14) and (15) can deliver inconsistent results in case of strong sample depolarization, or very flat samples, respectively [25]. In this study, the effect of the porous quartz frit on the sample depolarization was also neglected. Therefore, the height of the investigated material should preferably be as large as possible without violating other MCP conditions. Applying the method to very flat structures or materials (layers) is not recommended. It is also worth mentioning that the depolarization factor may also be determined by finite element simulation. However, this would require an individual simulation model for each investigated sample, because the simulation model must be specifically adapted to the shape and properties of the sample. An analytical approach can be implemented more quickly and also provides reasonably accurate results for the depolarization factor according to acknowledged methods. Venermo et al. quantified the deviation of their method for determining depolarization factors for cylindrical samples to be less than 1% [49]. From this perspective, the determination of the depolarization factor by simulations is also possible, but not more beneficial, since the cylindrical approximation of the sample geometry alone causes larger deviations. Alternatively, the sample depolarization can also be considered by insertion of a sample with known dielectric properties and geometry. Such calibration sample must have an identical shape as the powder sample in order to correctly determine the field weakening. However, for this method, a calibration measurement is required before each investigation, which only can be applied to the specific sample shape. An analytical approach is, hence, more flexible and can be easily adapted to the individual geometry of a sample.
However, the largest uncertainty in the evaluation of dielectric properties, likely, stems from the determination of the material properties from the effective parameters of the powder filling. Small deviations in the estimation of porosity or bulk density lead to a larger error propagation when using dielectric mixture models. In general, it can be expected that for powders with lower porosity more precise results can be obtained with the method, provided that the field disturbance by the introduction of the sample is not too large. Beyond that, the validity of a mixing model must always be checked for each material in advance using known material states under defined conditions (preferably with simple geometries).

5. Conclusions

In this study, a method was presented to determine the dielectric properties of powder samples using MCP. The approach allows to determine the dielectric constant and the dielectric loss of the storage material of a catalyst under typical operating conditions. Detailed reflections on the measurement method now allow to consider the electric field distribution in the resonator with a simulation model, the sample depolarization with an analytical approach and the bulk properties with a common dielectric mixing model. The method provides a significant extension to earlier publications [18,19,20,21], which served as a means of assessing the state of a typical catalyst materials (e.g., oxidized/reduced), but could not provide precise information about the electrical properties of the materials. The approach was successfully verified by measurements on a ceria powder under typical operating conditions. The method is well transferable to other materials, such as SCR and NOx storage materials or soot, with only a few modifications and, thus, has the potential to provide further important insights into microwave characteristics and the functioning of typical exhaust aftertreatment materials. The findings contribute to improving the microwave-based state diagnosis of automotive catalytic converters.

Author Contributions

C.S., S.W., V.M., G.H., I.K., H.F. and R.M. conceived and designed the methodology; C.S. performed the experiment and analyzed the data. All together evaluated and discussed the results and wrote the paper. All authors have read and agreed to the published version of the manuscript.

Funding

This research was funded by the Deutsche Forschungsgemeinschaft (DFG), DFG Grants MO 1060/29-1 and FR 1301/23-1. The publication fees were funded by the DFG and the University of Bayreuth in the funding program “Open Access Publishing”.

Conflicts of Interest

The authors declare no conflict of interest.

References

  1. Moos, R.; Wedemann, M.; Spörl, M.; Reiß, S.; Fischerauer, G. Direct Catalyst Monitoring by Electrical Means: An Overview on Promising Novel Principles. Top. Catal. 2009, 52, 2035–2040. [Google Scholar] [CrossRef]
  2. Birkhofer, T.; Hofmann, P.; Knezevic, A.; Moos, R.; Plog, C.; Schneider, R. Verfahren zur Erkennung des Zustands Eines Katalysators Mittels Mikrowellen. German Patent Specification DE10358495, 13 December 2003. [Google Scholar]
  3. Reiß, S.; Spörl, M.; Hagen, G.; Fischerauer, G.; Moos, R. Combination of Wirebound and Microwave Measurements for In-Situ Characterization of Automotive Three-Way Catalysts. IEEE Sens. J. 2011, 11, 434–438. [Google Scholar] [CrossRef]
  4. Moos, R.; Spörl, M.; Hagen, G.; Gollwitzer, A.; Wedemann, M.; Fischerauer, G. TWC: Lambda Control and OBD without Lambda Probe—An Initial Approach. SAE Tech. Pap. 2008. [Google Scholar] [CrossRef]
  5. Beulertz, G.; Votsmeier, M.; Moos, R. In operando Detection of Three-Way Catalyst Aging by a Microwave-Based Method: Initial Studies. Appl. Sci. 2015, 5, 174–186. [Google Scholar] [CrossRef]
  6. Reiß, S.; Wedemann, M.; Spörl, M.; Fischerauer, G.; Moos, R. Effects of H2O, CO2, CO, and Flow Rates on the RF-Based Monitoring of Three-Way Catalysts. Sens. Lett. 2011, 9, 316–320. [Google Scholar] [CrossRef]
  7. Beulertz, G.; Votsmeier, M.; Moos, R. Effect of Propene, Propane, and Methane on Conversion and Oxidation State of Three-Way Catalysts: A Microwave Cavity Perturbation Study. Appl. Catal. B 2015, 165, 369–377. [Google Scholar] [CrossRef]
  8. Steiner, C.; Malashchuk, V.; Kubinski, D.; Hagen, G.; Moos, R. Catalyst State Diagnosis of Three-Way Catalytic Converters Using Different Resonant Parameters—A Microwave Cavity Perturbation Study. Sensors 2019, 19, 3559. [Google Scholar] [CrossRef] [PubMed] [Green Version]
  9. Dietrich, M.; Jahn, C.; Lanzerath, P.; Moos, R. Microwave-Based Oxidation State and Soot Loading Determination on Gasoline Particulate Filters with Three-Way Catalyst Coating for Homogenously Operated Gasoline Engines. Sensors 2015, 15, 21971–21988. [Google Scholar] [CrossRef] [PubMed] [Green Version]
  10. Walter, S.; Schwanzer, P.; Hagen, G.; Haft, G.; Dietrich, M.; Rabl, H.-P.; Moos, R. Hochfrequenzsensorik zur direkten Beladungserkennung von Benzinpartikelfiltern. In Automobil-Sensorik 3; Tille, T., Ed.; Springer: Berlin, Germany, 2020; pp. 185–208. [Google Scholar]
  11. Reiß, S.; Schönauer, D.; Hagen, G.; Fischerauer, G.; Moos, R. Monitoring the Ammonia Loading of Zeolite-Based Ammonia SCR Catalysts by A Microwave Method. Chem. Eng. Technol. 2011, 34, 791–796. [Google Scholar] [CrossRef]
  12. Rauch, D.; Kubinski, D.; Simon, U.; Moos, R. Detection of the Ammonia Loading of a Cu Chabazite SCR Catalyst by a Radio Frequency-Based Method. Sens. Actuators B 2014, 205, 88–93. [Google Scholar] [CrossRef]
  13. Rauch, D.; Kubinski, D.; Cavataio, G.; Upadhyay, D.; Moos, R. Ammonia Loading Detection of Zeolite SCR Catalysts Using a Radio Frequency Based Method. SAE Int. J. Engines 2015, 8, 1126–1135. [Google Scholar] [CrossRef]
  14. Fremerey, P.; Reiß, S.; Geupel, A.; Fischerauer, G.; Moos, R. Determination of the NOx Loading of an Automotive Lean NOx Trap by Directly Monitoring the Electrical Properties of the Catalyst Material Itself. Sensors 2011, 11, 8261–8280. [Google Scholar] [CrossRef] [PubMed] [Green Version]
  15. Walter, S.; Ruwisch, L.; Göbel, U.; Hagen, G.; Moos, R. Radio Frequency-Based Determination of the Oxygen and the NOx Storage Level of NOx Storage Catalysts. Top. Catal. 2019, 62, 157–163. [Google Scholar] [CrossRef]
  16. Feulner, M.; Hagen, G.; Moos, R.; Piontkowski, A.; Müller, A.; Fischerauer, G.; Brüggemann, D. In-Operation Monitoring of the Soot Load of Diesel Particulate Filters: Initial Tests. Top. Catal. 2013, 56, 483–488. [Google Scholar] [CrossRef]
  17. Sappok, A.; Parks, J.; Prikhodko, V. Loading and Regeneration Analysis of a Diesel Particulate Filter with a Radio Frequency-Based Sensor. SAE Tech. Pap. 2010. [Google Scholar] [CrossRef]
  18. Dietrich, M.; Rauch, D.; Porch, A.; Moos, R. A laboratory Test Setup for in Situ Measurements of the Dielectric Properties of Catalyst Powder Samples under Reaction Conditions by Microwave Cavity Perturbation: Set Up and Initial Tests. Sensors 2014, 14, 16856–16868. [Google Scholar] [CrossRef] [Green Version]
  19. Rauch, D.; Dietrich, M.; Simons, T.; Simon, U.; Porch, A.; Moos, R. Microwave Cavity Perturbation Studies on H-form and Cu Ion-Exchanged SCR Catalyst Materials: Correlation of Ammonia Storage and Dielectric Properties. Top. Catal. 2017, 60, 243–249. [Google Scholar] [CrossRef]
  20. Dietrich, M.; Rauch, D.; Simon, U.; Porch, A.; Moos, R. Ammonia Storage Studies on H-ZSM-5 Zeolites by Microwave Cavity Perturbation: Correlation of dielectric Properties with Ammonia Storage. J. Sens. Sens. Syst. 2015, 4, 263–269. [Google Scholar] [CrossRef] [Green Version]
  21. Steiner, C.; Gänzler, A.M.; Zehentbauer, M.; Hagen, G.; Casapu, M.; Müller, S.; Grunwaldt, J.-D.; Moos, R. Oxidation State and Dielectric Properties of Ceria-Based Catalysts by Complementary Microwave Cavity Perturbation and X-Ray Absorption Spectroscopy Measurements. Top. Catal. 2019, 62, 227–236. [Google Scholar] [CrossRef]
  22. Chen, L.F.; Ong, C.K.; Neo, C.P.; Varadan, V.V.; Varadan, V.K. Microwave Electronics—Measurement and Materials; John Wiley & Sons: Hoboken, NJ, USA, 2004. [Google Scholar] [CrossRef]
  23. Pozar, D.M. Microwave Engineering, 4th ed.; John Wiley & Sons: Hoboken, NJ, USA, 2012. [Google Scholar]
  24. Kim, C.-K.; Minz, L.; Park, S.-O. Improved Measurement Method of Material Properties Using Continuous Cavity Perturbation Without Relocation. IEEE Trans. Instrum. Meas. 2020, 69, 5702–5716. [Google Scholar] [CrossRef]
  25. Parkash, A.; Vaid, J.K.; Mansingh, A. Measurement of Dielectric Parameters at Microwave Frequencies by Cavity Perturbation Technique. IEEE Trans. Microw. Theory Tech. 1979, 27, 791–795. [Google Scholar] [CrossRef]
  26. Waldron, R.A. Perturbation Theory of Resonant Cavities. Proc. IEEC Monogr. 1970, 107, 272–274. [Google Scholar] [CrossRef]
  27. Lin, M.; Afsar, M. A New Cavity Perturbation Technique for Accurate Measurement of Dielectric Parameters. In Proceedings of the 2006 IEEE MTT-S International Microwave Symposium Digest, San Francisco, CA, USA, 11–16 June 2006; pp. 1630–1633. [Google Scholar] [CrossRef]
  28. Lin, M.; Wang, Y.; Afsar, M.N. Precision Measurement of Complex Permittivity and Permeability by Microwave Cavity Perturbation Technique. In Proceedings of the 2005 Joint 30th International Conference on Infrared and Millimeter Waves and 13th International Conference on Terahertz Electronics, Williamsburg, VA, USA, 19–23 September 2005; pp. 62–63. [Google Scholar] [CrossRef]
  29. Yang, R.B.; Tsay, C.J.; Hung, D.S.; Liang, W.F.; Yao, Y.D.; Lin, C.K. Complex Permittivity and Permeability of Iron-Based Composite Absorbers Measured by Cavity Perturbation Method in X-Bandfrequency Range. J. Appl. Phys. 2009, 105. [Google Scholar] [CrossRef]
  30. Peng, Z.; Hwang, J.-Y.; Andriese, M. Maximum Sample Volume for Permittivity Measurements by Cavity Perturbation Technique. IEEE Trans. Instrum. Meas. 2014, 63, 450–455. [Google Scholar] [CrossRef]
  31. Verma, A.; Dube, D. Measurement of Dielectric Parameters of Small Samples at X-Band Frequencies by Cavity Perturbation Technique. IEEE Trans. Instrum. Meas. 2005, 54, 2120–2123. [Google Scholar] [CrossRef]
  32. Cuenca, J.A.; Klein, S.; Ruger, R.; Porch, A. Microwave Complex Permeability of Magnetite Using Non-Demagnetising and Demagnetising Cavity Modes. Proc. Eur. Microw. Conf. 2014, 44, 128–131. [Google Scholar] [CrossRef]
  33. Chen, L.; Ong, C.; Tan, B. Amendment of Cavity Perturbation Method for Permittivity Measurement of Extremely Low-Loss Dielectrics. IEEE Trans. Instrum. Meas. 1999, 48, 1031–1037. [Google Scholar] [CrossRef]
  34. Meng, B.; Booske, J.; Cooper, R. Extended Cavity Perturbation Technique to Determine the Complex Permittivity of Dielectric Materials. IEEE Trans. Microw. Theory Tech. 1995, 43, 2633–2636. [Google Scholar] [CrossRef] [Green Version]
  35. Orloff, N.D.; Obrzut, J.; Long, C.J.; Lam, T.; Kabos, P.; Novotny, D.R.; Booth, J.C.; Liddle, J.A. Dielectric Characterization by Microwave Cavity Perturbation Corrected for Nonuniform Fields. IEEE Trans. Microw. Theory Tech. 2014, 62, 2149–2159. [Google Scholar] [CrossRef]
  36. Tuller, H.L.; Nowick, A.S. Defect Structure and Electrical Properties of Nonstoichiometric CeO2 Single Crystals. J. Electrochem. Soc. 1979, 126, 209–217. [Google Scholar] [CrossRef]
  37. Xiong, Y.-P.; Kishimoto, H.; Yamaji, K.; Yoshinaga, M.; Horita, T.; Brito, M.E.; Yokokawa, H. Electronic Conductivity of Pure Ceria. Solid State Ion. 2011, 192, 476–479. [Google Scholar] [CrossRef]
  38. Rowe, D.J.; al-Malki, S.; Abduljabar, A.A.; Porch, A.; Barrow, D.A.; Allender, C.J. Improved Split-Ring Resonator for Microfluidic Sensing. IEEE Trans. Microw. Theory Tech. 2014, 62, 689–699. [Google Scholar] [CrossRef]
  39. Kobayashi, H.; Ogawa, S. Dielectric Constant and Conductivity Measurement of Powder Samples by the Cavity Peturbation Method. Jpn. J. Appl. Phys. 1971, 10, 345–350. [Google Scholar] [CrossRef]
  40. Subramanian, V.; Sivasubramanian, V.; Murthy, V.R.K.; Sobhanadri, J. Measurement of Complex Dielectric Permittivity of Partially Inserted Samples in a Cavity Perturbation Technique. Rev. Sci. Instrum. 1996, 67, 279–282. [Google Scholar] [CrossRef]
  41. Dube, D.C. Study of Landau-Lifshitz-Looyenga’s Formula for Dielectric Correlation between Powder and Bulk. J. Phys. D Appl. Phys. 1970, 3, 1648–1652. [Google Scholar] [CrossRef]
  42. Tuhkala, M.; Juuti, J.; Jantunen, H. An Indirectly Coupled Open-Ended Resonator Applied to Characterize Dielectric Properties of MgTiO3–CaTiO3 Powders. J. Appl. Phys. 2014, 115, 184101. [Google Scholar] [CrossRef]
  43. Cheng, E.M.; Malek, F.; Ahmed, M.; You, K.Y.; Lee, K.Y.; Nornikman, H. The Use of Dielectric Mixture Equations to Analyse the Dielectric Properties of a Mixture of Rubber Tire Dust and Rice Husk in a Microwave Absorber. Prog. Electromagn. Res. 2012, 129, 559–578. [Google Scholar] [CrossRef] [Green Version]
  44. Santha, N.I.; Sebastian, M.T.; Mohanan, P.; Alford, N.M.; Sarma, K.; Pullar, R.C.; Kamba, S.; Pashkin, A.; Samukhina, P.; Petzelt, J. Effect of Doping on the Dielectric Properties of Cerium Oxide on the Microwave and Far-Infrared Frequency Range. J. Am. Ceram. Soc. 2004, 87, 1233–1237. [Google Scholar] [CrossRef]
  45. Chiu, F.-C.; Lai, C.-M. Optical and Electrical Characterizations of Cerium Oxide Thin Films. J. Phys. D Appl. Phys. 2010, 43, 075104. [Google Scholar] [CrossRef]
  46. Yamamoto, T.; Momida, H.; Hamada, T.; Uda, T.; Ohno, T. First-Principles Study of Dielectric Properties of Cerium Oxide. Thin Solid Film. 2005, 486, 136–140. [Google Scholar] [CrossRef]
  47. Bozorth, R.M.; Chapin, D.M. Demagnetizing Factors of Rods. J. Appl. Phys. 1942, 13, 320–326. [Google Scholar] [CrossRef]
  48. Ogawa, T. Measurement of the Electrical Conductivity and Dielectric Constant without Contacting Electrodes. J. Appl. Phys. 1961, 32, 583–592. [Google Scholar] [CrossRef]
  49. Venermo, J.; Sihvola, S. Dielectric Polarizability of Circular Cylinder. J. Electrost. 2005, 63, 101–117. [Google Scholar] [CrossRef]
  50. Birchak, J.R.; Gardner, L.G.; Hipp, J.W.; Victor, J.M. High Dielectric Constant Microwave Probes for Sensing Soil Moisture. Proc. IEEE 1974, 62, 93–98. [Google Scholar] [CrossRef]
  51. Jusoh, M.A.; Abbas, Z.; Hassan, J.; Azmi, B.Z.; Ahmad, A.F. A Simple Procedure to Determine Complex Permittivity of Moist Materials Using Standard Commercial Coaxial Sensor. Meas. Sci. Rev. 2011, 11, 19–22. [Google Scholar] [CrossRef] [Green Version]
  52. Goncharenko, A. Generalizations of the Bruggeman Equation and a Concept of Shape-Distributed Particle Composites. Phys. Rev. 2003, 68, 041108. [Google Scholar] [CrossRef]
  53. Looyenga, H. Dielectric Constants of Heterogeneous Mixtures. Physica 1965, 31, 401–406. [Google Scholar] [CrossRef]
  54. Marquardt, P.; Nimtz, G. Size-Governed Electromagnetic Absorption by Metal Particles. Phys. Rev. B 1989, 40, 7996. [Google Scholar] [CrossRef]
  55. Marquardt, P. Quantum-size affected conductivity of mesoscopic metal particles. Phys. Lett. A 1987, 123, 365–368. [Google Scholar] [CrossRef]
  56. Marquardt, P.; Nimtz, G. Critical Dielectric Behavior of Micellar Water below the Cloud point of a Water-Oil Microemulsion. Phys. Rev. Lett. 1986, 57, 1036. [Google Scholar] [CrossRef]
  57. Lichtenecker, K.; Rother, K. Die Herleitung des Logarithmischen Mischungsgesetzes aus Allgemeinen Prinzipien der Stationären Strömung. Phys. Z. 1931, 32, 255–260. [Google Scholar]
  58. Sihvola, A. Mixing Rules with Complex Dielectric Coefficients. Subsurf. Sens. Technol. Appl. 2000, 1, 393–415. [Google Scholar] [CrossRef]
  59. Maxwell Garnett, J.C. Colors in Metal Glasses and Metal Films and in Metallic Solutions. Trans. R. Soc. 1905, 53, 385–420. [Google Scholar] [CrossRef] [Green Version]
  60. Wiener, O. Zur Theorie der Refraktionskonstanten. Math.-Phys. Kl. 1910, 62, 256–277. [Google Scholar]
  61. Farra, R.; Garcia-Melchor, M.; Eichelbaum, M.; Hashagen, M.; Frandsen, W.; Allan, J.; Girgsdies, F.; Szentmiklosi, L.; Lopez, N.; Teschner, D. Promoted Ceria: A Structural, Catalytic, and Computational Study. ACS Catal. 2013, 3, 2256–2268. [Google Scholar] [CrossRef]
Figure 1. Illustration of the resonator setup for MCP measurements with the electric field (qualitatively) of the TM010 mode: (a) schematic sectional view of the setup; (b) simulation model in COMSOL Multiphysics® 5.5.
Sensors 20 06024 g001
Figure 2. Simulated electric field inside the empty resonator (sectional view): (a) TM010; (b) TM020; (c) TM030.
Sensors 20 06024 g002
Figure 3. Relative deviation Δεrel between both methods for the calculation of the dielectric constant as a function of the dielectric constant of the sample ε r
Sensors 20 06024 g003
Figure 4. Depolarization of a ceria powder ( ε r , eff = 2.59) in the excitation field of the resonator: (a) electric field distribution (sectional view) in the resonator and within the sample; (b) electric field along the x-axis with pronounced weakening at the location of the sample (x = 0).
Sensors 20 06024 g004
Figure 5. Effective dielectric constant of ceria powder, ε r , eff , as it depends on volume fraction ν CeO 2 of ceria, according to some dielectric mixing models from literature.
Sensors 20 06024 g005
Figure 6. Setup for the characterization of the dielectric properties of ceria powder at room temperature.
Sensors 20 06024 g006
Table 1. Comparison of the modal volumes of the TM010, TM020, and TM030 modes of the resonator.
ModeTM010TM020TM030
Veff/VC (simulation)26.78%13.73%12.84%
Veff, th/VC (simplified approach)26.95%11.58%7.37%
Table 2. Calculated dielectric constant of a ceria powder from simulation data with and without consideration of depolarization.
Modefs/GHzf0/GHzQSQ0Ne ε r , eff (Equation (14)) ε r , eff (Equation (13))
TM0101.1795631.17997319,78719,7810.4352.661.97
TM0202.6241862.62589830,18330,8180.4352.561.93
TM0304.2371194.24002825,82126,6280.4352.521.91
Table 3. Results of the investigation of the ceria powder sample in the simplified resonator geometry.
fs/GHzf0/GHz ε r , eff ε r (Looyenga) ε r (Birchak) ε r (Lichtenecker)
2.4708822.4786752.5922.415.7101
Table 4. Results for the dielectric properties of the ceria sample inside the resonator cavity: (a) measured at 25 °C and 21% O2; (b) at 600 °C and 21% O2; (c) at 600 °C and pO2 = 10−20 bar. The derived values for the material permittivity are highlighted. Please note the lower permittivity for higher modes when applying simplifications. The permittivity for the TM030 mode in (b) is written in brackets, due to its uncertainty.
(a) Conditions: 25 °C, pO2 = 0.21 barLiterature: ε r = 23 [44,45,46]
Modefs/GHzf0/GHzQSQ0NeVeff/VC ε r σ/(S/cm)
TM0101.1806241.18087013,89013,9300.40226.78%22.6--
TM0202.6299372.6310251301512,7560.40213.73%23.6--
TM0304.2003894.203252893.34898.650.40212.84%23.8--
For comparison: Calculation with simplified electric field calibration (Veff):
TM0101.1806241.18087013,89013,9300.40226.95%23.0--
TM0202.6299372.6310251301512,7560.40211.58%16.0--
TM0304.2003894.203252893.34898.650.4027.37%7.91--
For comparison: Calculation without considering depolarization (Ne = 0):
TM0101.1806241.18087013,89013930026.78%11.2--
TM0202.6299372.63102513,01512756013.73%11.5--
TM0304.2003894.203252893.34898.65012.84%11.5--
 
(b) Conditions: 600 °C, pO2 = 0.21 barLiterature: ε r = 23 [8,43,44,45,46], σ = 3.9 10−5 S/cm [36]
Modefs/GHzf0/GHzQSQ0NeVeff/VC ε r σ/(S/cm)
TM0101.1790821.17932812,327128260.40226.78%22.71.79·10−5
TM0202.6253542.6264259572.3103410.40213.73%22.81.58·10−5
TM0304.1928084.194524943.231210.10.40212.84%<17.6>--
(c) Conditions: 600 °C, pO2 = 10−20 barLiterature: σ = 2.0 10−2 S/cm [36]
Modefs/GHzf0/GHzQSQ0NeVeff/VC ε r σ/(S/cm)
TM0101.1789671.1793413441.612,8780.40226.78%42.84.22 10−2
TM0202.6250342.6264732488.310,3350.40213.73%39.05.50 10−2
TM0304.1929564.194998806.221210.80.40212.84%23.55.48 10−2
Publisher’s Note: MDPI stays neutral with regard to jurisdictional claims in published maps and institutional affiliations.

