A Pattern-Recognition-Based Ensemble Data Imputation Framework for Sensors from Building Energy Systems


Abstract
1. Introduction
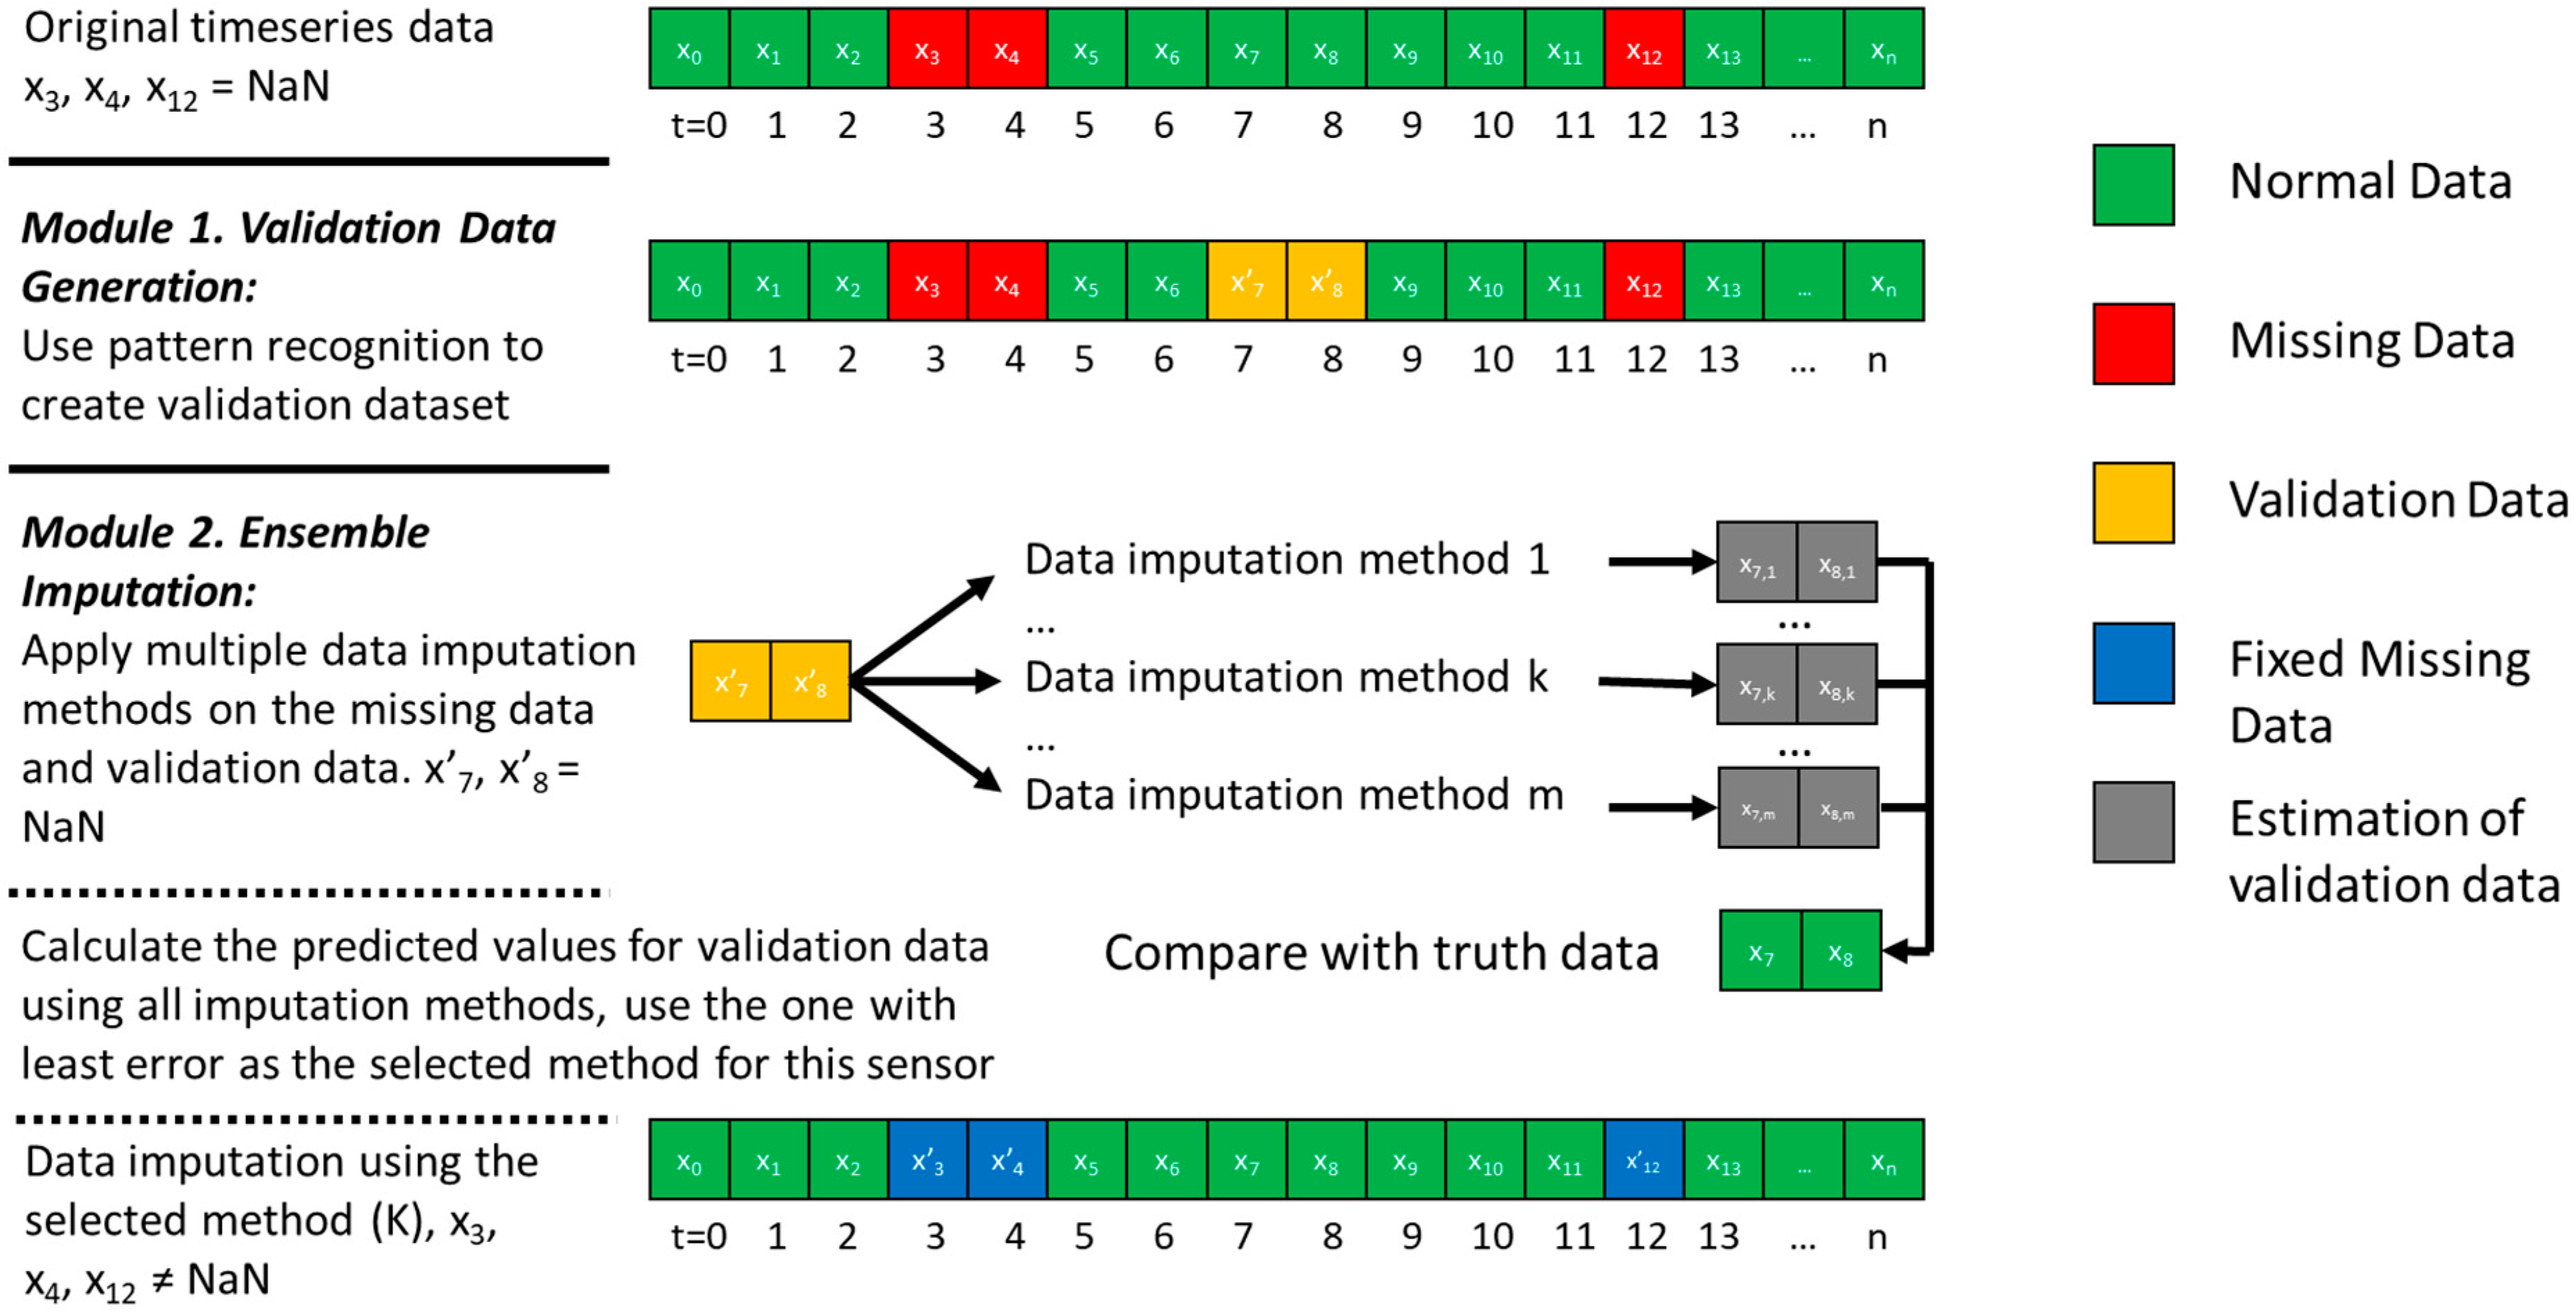
2. Pattern-Recognition-Based Ensemble Data Imputation Framework
2.1. Module 1. Validation Data Generation
2.2. Module 2. Ensemble Imputation Method
3. Real-Building Case Study
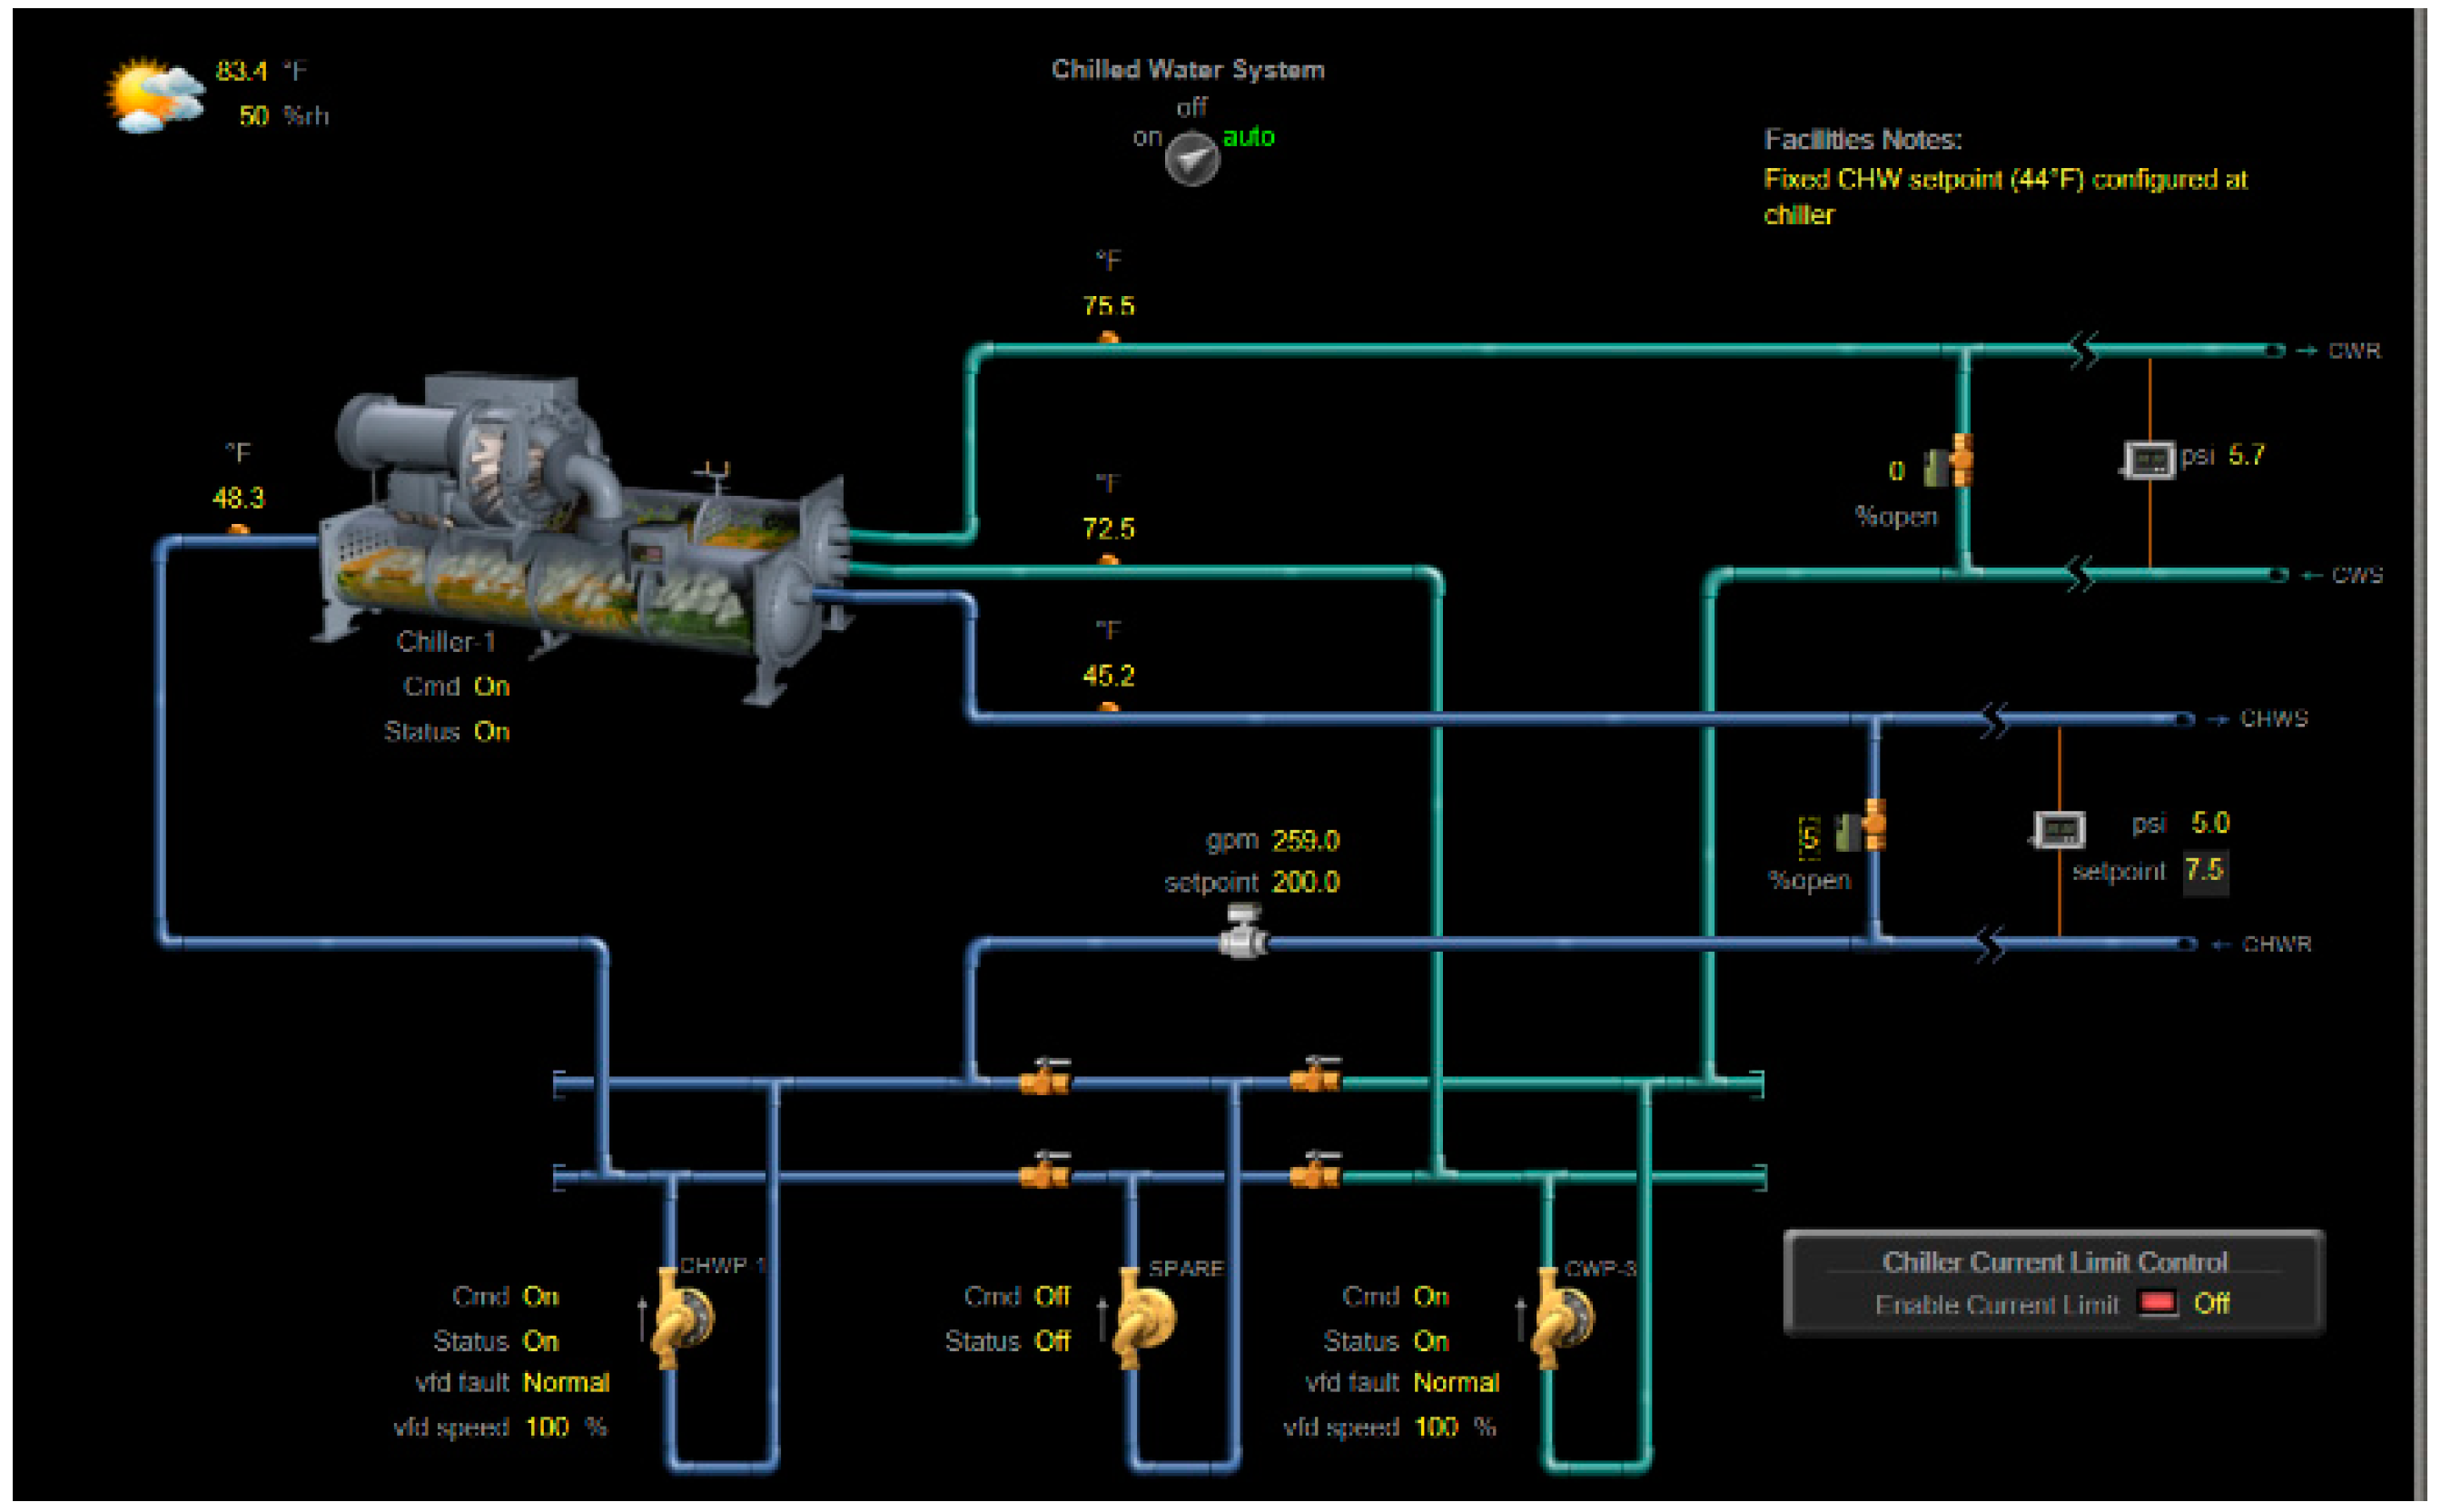
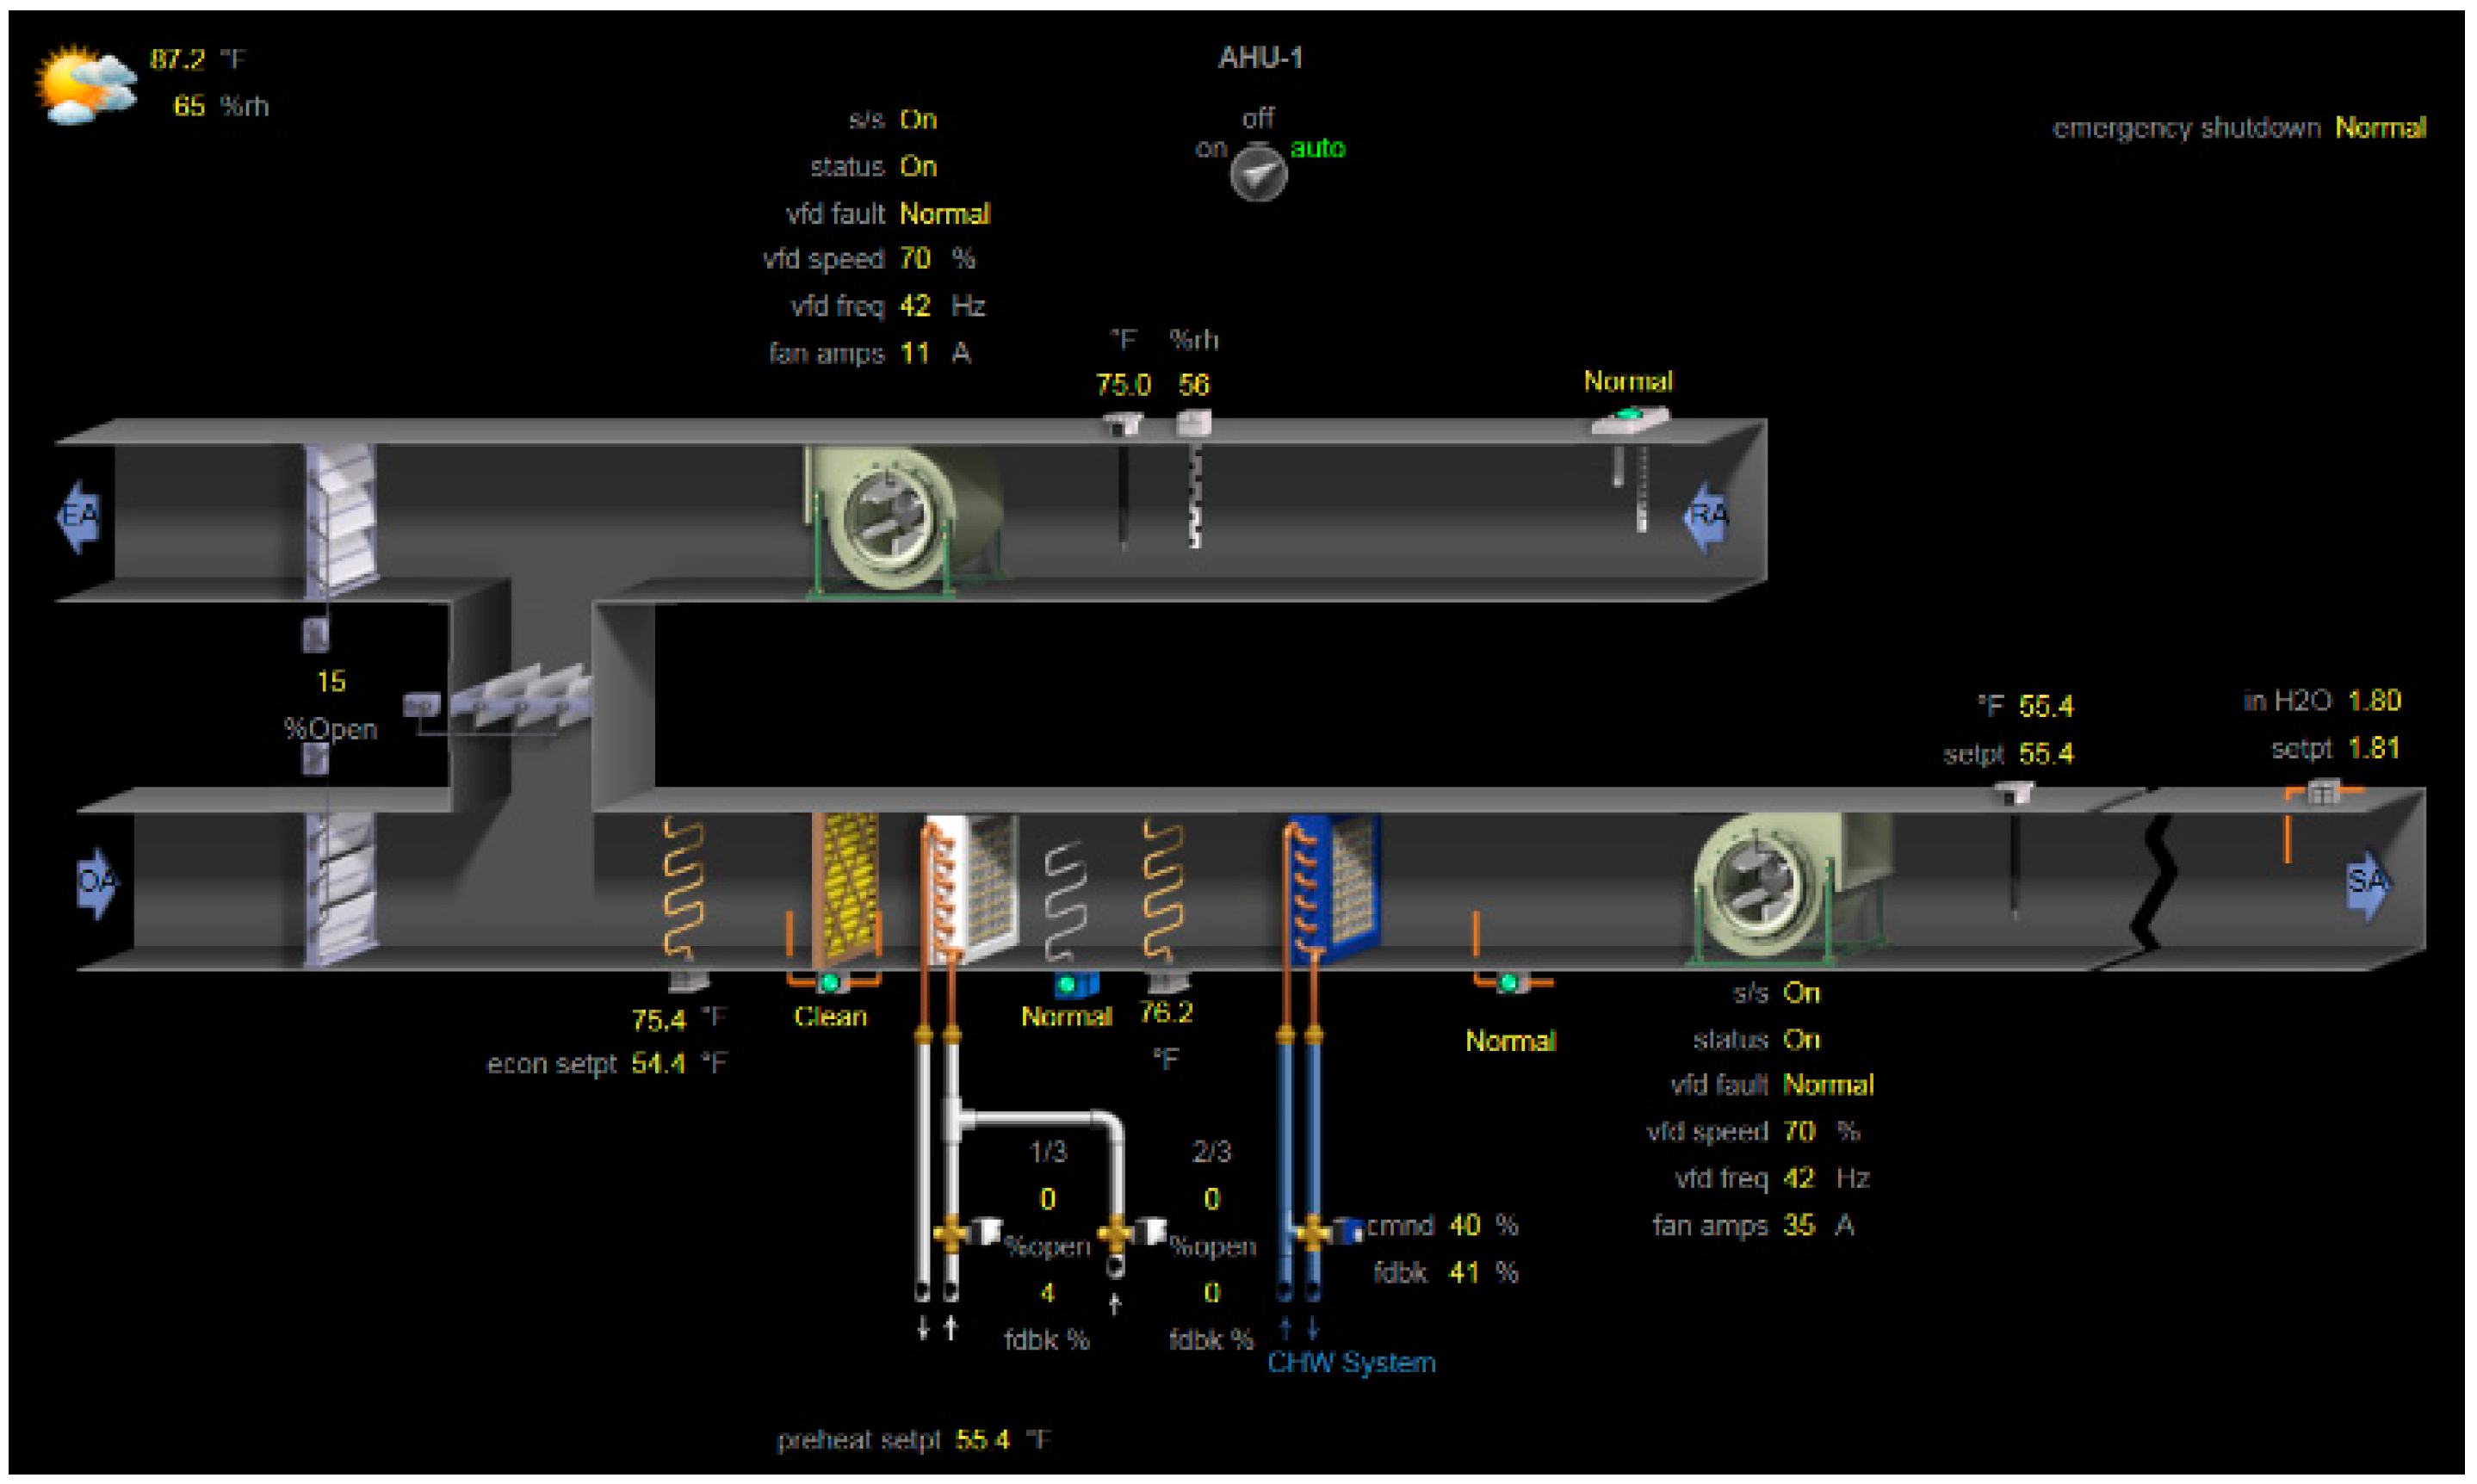
3.1. Sensors from a Real Campus Building
3.2. Missing Data Description of Selected Sensors
3.3. Create Validation Dataset
3.4. Pool of Data Imputation Methods
4. Results and Discussion
- The listed imputation methods have vastly different performance (imputation accuracy). In terms of sensor average, the best imputation method, the developed ensemble method can outperform the worst (bfill) method by 70.0%. The developed ensemble method can increase the accuracy of imputation by 57.1% on average compared with single imputation method. It can also increase the accuracy of imputation by the best single imputation method (ANN in this case) by 18.2%. The results show the effectiveness of improving imputation accuracy and indicate the necessity of the pool-based ensemble imputation methods developed in the framework.
- The performance of single imputation methods differs from sensor to sensor. Here, single imputation methods refer to all imputation methods that are not the ensemble imputation method. Some single imputation methods can have high accuracy for one sensor but will loses accuracy when used for another. For example, ANN outperforms other single imputation methods on average, but it is worse than pchip when imputing the sensor “vv-1-b-1/air_flow/flow_input”. Moreover, the best single imputation method selected is different from sensor to sensor.
- The difficulty of sensor prediction is different from sensor to sensor. The fan sensor “ct_control/ct_fan_status/trend_log” has a relatively low testing accuracy with all the imputation methods in the pool, while sensors such as “chws_control/chws_temp” can be easily imputed even with the simplest imputation methods.
- To further analyze the single imputation method performance in terms of sensor types, the machine-learning-based imputation method is most suitable for the energy meter, and piecewise-spline imputation methods are suitable for some temperature sensors and some pressure sensors. Although the above conclusion may be biased to the specific building and sensors, the result indicates the importance of ensemble method to automatically customize the selection of imputation method based on different sensor types and missing data characteristics.
- To further analyze the result in terms of the five imputation types, machine-learning-based imputation generally has the best overall performance. Besides, machine-learning methods have even better performance improvement, especially when there are large holes in the missing data, such as the sensor “chws_control/cw_vlv_fdbk”. However, the ensemble method can still always select the best performance among all candidate single imputation methods.
5. Conclusions
Funding
Conflicts of Interest
Appendix A


| Location | Equipment Name | Equipment Function |
|---|---|---|
| Basement | VV-1-B-1 | VAV box for basement room 1 |
| VV-1-B-2 AMD-33 | VAV box for basement room 2 | |
| HX-1 | Heat water exchange for hot water | |
| HX-2 | Heat water exchange for VAV reheat | |
| Chilled water system | Provide chilled water for AHU_1 2 3 | |
| AHU_1 | AHU_1 meets thermal load in basement | |
| First floor | VV-1-1-1 to 12 | VAV boxes for the first floor (served by AHU_1) |
| AC-1-1 | Air control panel | |
| Second floor | VV-2-2-1 to 11 | VAV boxes for the second floor (served by AHU_2) |
| Third floor | VV-2-3-1 to 10 | VAV boxes for the third floor (served by AHU_2) |
| AC-3-1 | Air control panel | |
| Fourth floor | VV-2-4-1 to 10 | VAV boxes for the fourth floor (served by AHU_2) |
| Fifth floor | VV-2-5-1 to 10 | VAV boxes for the fifth floor (served by AHU_2) |
| Sixth floor | VV-2-6-1 to 10 | VAV boxes for the sixth floor (served by AHU_2) |
| AC-6-1 | Air control panel | |
| Seventh floor laboratory | SV-3-1 to 2 & Hood EV-3-1 to 2 | VAV boxes for the seventh-floor lab (served by AHU_3) |
| SV-3-3 to 6 & Hood EV 3-3 to 6 | VAV boxes for the seventh-floor lab (served by AHU_3) | |
| Lab exhaust system | Lab air exhaust system | |
| Seventh floor | VV-2-7-1 to 9 | VAV boxes for the seventh-floor lab (served by AHU_2) |
| Penthouse | Cooling tower | Cooling tower |
| AHU_2 | AHU_2 | |
| AHU_3 | AHU_3 | |
| Generator temperature control | Generator temperature control | |
| OA conditions | Outside air condition (temperature humidity and enthalpy) | |
| EF-1 | Exhaust fan | |
| UH-1 | Unit heating (for equipment anti-freezing) |


References
- EIA. Monthly Energy Review—June 2020; US Energy Information Administration: Washington, DC, USA, 2020. Available online: https://www.eia.gov/totalenergy/data/monthly/ (accessed on 1 July 2020).
- Zhang, L.; Wen, J. A systematic feature selection procedure for short-term data-driven building energy forecasting model development. Energy Build. 2019, 183, 428–442. [Google Scholar] [CrossRef]
- Gruenwald, L.; Chok, H.; Aboukhamis, M. Using data mining to estimate missing sensor data. In Proceedings of the Seventh IEEE International Conference on Data Mining Workshops (ICDMW 2007), Omaha, NE, USA, 28–31 October 2007. [Google Scholar]
- Cabrera, D.F.M.; Zareipour, H. Data association mining for identifying lighting energy waste patterns in educational institutes. Energy Build. 2013, 62, 210–216. [Google Scholar] [CrossRef]
- Efron, B. Missing data, imputation, and the bootstrap. J. Am. Stat. Assoc. 1994, 89, 463–475. [Google Scholar] [CrossRef]
- Pigott, T.D. A review of methods for missing data. Educ. Res. Eval. 2001, 7, 353–383. [Google Scholar] [CrossRef]
- Harel, O.; Zhou, X.H. Multiple imputation: Review of theory, implementation and software. Stat. Med. 2007, 26, 3057–3077. [Google Scholar] [CrossRef] [PubMed]
- Ibrahim, J.G.; Chen, M.-H.; Lipsitz, S.R.; Herring, A.H. Missing-data methods for generalized linear models: A comparative review. J. Am. Stat. Assoc. 2005, 100, 332–346. [Google Scholar] [CrossRef]
- Ekwevugbe, T.; Brown, N.; Pakka, V. Realt-time building occupancy sensing for supporting demand driven hvac operations. In Proceedings of the International Conference for Enhanced Building Operations (ICEBO), Montréal, QC, Canada, 8–11 October 2013. [Google Scholar]
- Xiao, F.; Fan, C. Data mining in building automation system for improving building operational performance. Energy Build. 2014, 75, 109–118. [Google Scholar] [CrossRef]
- Rahman, A.; Srikumar, V.; Smith, A.D. Predicting electricity consumption for commercial and residential buildings using deep recurrent neural networks. Appl. Energy 2018, 212, 372–385. [Google Scholar] [CrossRef]
- Peppanen, J.; Zhang, X.; Grijalva, S.; Reno, M.J. Handling bad or missing smart meter data through advanced data imputation. In Proceedings of the 2016 IEEE Power & Energy Society Innovative Smart Grid Technologies Conference (ISGT), Minneapolis, MN, USA, 6–9 September 2016. [Google Scholar]
- Ma, J.; Cheng, J.C.P.; Jiang, F.; Chen, W.; Wang, M.; Zhai, C. A bi-directional missing data imputation scheme based on LSTM and transfer learning for building energy data. Energy Build. 2020, 216, 109941. [Google Scholar] [CrossRef]
- Inman, D.; Elmore, R.; Bush, B. A case study to examine the imputation of missing data to improve clustering analysis of building electrical demand. Build. Serv. Eng. Res. Technol. 2015, 36, 628–637. [Google Scholar] [CrossRef]
- Schachinger, D.; Gaida, S.; Kastner, W.; Petrushevski, F.; Reinthaler, C.; Sipetic, M.; Zucker, G. An advanced data analytics framework for energy efficiency in buildings. In Proceedings of the 2016 IEEE 21st International Conference on Emerging Technologies and Factory Automation (ETFA), Berlin, Germany, 6–9 September 2016. [Google Scholar]
- Habib, U.; Zucker, G.; Blochle, M.; Judex, F.; Haase, J. Outliers detection method using clustering in buildings data. In Proceedings of the IECON 2015-41st Annual Conference of the IEEE Industrial Electronics Society, Yokohama, Japan, 9–12 November 2015. [Google Scholar]
- Xia, J.; Hong, T.; Shen, Q.; Feng, W.; Yang, L.; Im, P.; Lu, A.; Bhandari, M. Comparison of building energy use data between the United States and China. Energy Build. 2014, 78, 165–175. [Google Scholar] [CrossRef]
- Garnier, A.; Eynard, J.; Caussanel, M.; Grieu, S. Missing data estimation for energy resources management in tertiary buildings. In Proceedings of the CCCA12, Marseilles, France, 6–8 December 2012. [Google Scholar]
- Bradley, J.V. Distribution-Free Statistical Tests, 1st ed.; Prentice-Hall: Ann Arbor, MI, USA, 1968. [Google Scholar]


| No. | Equipment | Sensor Type | Original Sensor Name from BAS | Sensor Description |
|---|---|---|---|---|
| 1 | Chiller | Energy meter | peco_meter/elec_usage_chiller | Chiller electricity consumption |
| 2 | Flow meter | chws_control/chw_flow | Chilled water flow rate | |
| 3 | Thermometer | chws_control/chws_temp | Chilled water supply temperature | |
| 4 | Differential pressure sensors | chws_control/delta_press | Chilled water supply and return pressure difference | |
| 5 | Cooling tower | Differential pressure sensors | chws_control/cw_delta_press | Cooling water supply and return pressure difference |
| 6 | Thermometer | chws_control/cwr_temp | Cooling water return temperature | |
| 7 | Valve position | chws_control/cw_vlv_fdbk | Cooling water valve feedback | |
| 8 | Fan status | ct_control/ct_fan_status/trend_log | Cooling tower fan status | |
| 9 | AHU | Thermometer | ahu1/ra_temp/trend_log | AHU 1 return air temperature |
| 10 | Valve position | ahu1/econ | AHU 1 economizer valve position | |
| 11 | Valve position | ahu1/chw_valve | AHU1 cooling coil valve position | |
| 12 | Humidity sensor | ahu1/ra_humidity | AHU1 return air humidity | |
| 13 | Ampere meter | ahu1/sfan_amps | AHU 1 supply air fan ampere | |
| 14 | Valve position | ahu1/htg_stm_vlv_1_3 | AHU 1 steam valve position | |
| 15 | Differential pressure sensors | ahu1/stat_press | AHU 1 supply air static pressure | |
| 16 | Thermometer | ahu1/pht_temp | AHU 1 preheat coil water temperature | |
| 17 | VAV | Flow meter | vv-1-b-1/air_flow/flow_input | VAV 1 air flow rate |
| 18 | Thermometer | vv-1-b-1/da_temp/trend_log | VAV 1 discharge air temperature |
| No | Sensor Name | Number of Missing Data | Maximum Hole Size |
|---|---|---|---|
| 1 | peco_meter/elec_usage_chiller | 466 | 2 |
| 2 | chws_control/chw_flow | 512 | 2 |
| 3 | chws_control/chws_temp | 439 | 1 |
| 4 | chws_control/delta_press | 505 | 2 |
| 5 | chws_control/cw_delta_press | 236 | 2 |
| 6 | chws_control/cwr_temp | 446 | 1 |
| 7 | chws_control/cw_vlv_fdbk | 531 | 3 |
| 8 | ct_control/ct_fan_status/trend_log | 426 | 1 |
| 9 | ahu1/ra_temp/trend_log | 466 | 1 |
| 10 | ahu1/econ | 269 | 2 |
| 11 | ahu1/chw_valve | 315 | 3 |
| 12 | ahu1/ra_humidity | 446 | 2 |
| 13 | ahu1/sfan_amps | 334 | 2 |
| 14 | ahu1/htg_stm_vlv_1_3 | 118 | 2 |
| 15 | ahu1/stat_press | 118 | 1 |
| 16 | ahu1/pht_temp | 236 | 2 |
| 17 | vv-1-b-1/air_flow/flow_input | 216 | 3 |
| 18 | vv-1-b-1/da_temp/trend_log | 571 | 1 |
| Sensor Name | Hour | Day | Weekday Indicator | Month | Average |
|---|---|---|---|---|---|
| peco_meter/elec_usage_chiller | 2.30 | 1.17 | 2.06 | 2.18 | 1.93 |
| chws_control/chw_flow | 2.26 | 0.79 | 2.01 | 2.15 | 1.80 |
| chws_control/chws_temp | 2.09 | 0.22 | 1.86 | 1.96 | 1.53 |
| chws_control/delta_press | 2.24 | 0.71 | 1.99 | 2.12 | 1.77 |
| chws_control/cw_delta_press | 1.53 | 0.57 | 1.26 | 1.35 | 1.18 |
| chws_control/cwr_temp | 2.11 | 0.27 | 1.80 | 1.97 | 1.54 |
| chws_control/cw_vlv_fdbk | 2.15 | 0.68 | 1.88 | 2.02 | 1.69 |
| ct_control/ct_fan_status/trend_log | 2.06 | 0.18 | 1.78 | 1.92 | 1.49 |
| ahu1/ra_temp/trend_log | 2.15 | 0.25 | 1.82 | 2.02 | 1.56 |
| ahu1/econ | 1.63 | 0.60 | 1.35 | 1.46 | 1.26 |
| ahu1/chw_valve | 1.77 | 0.82 | 1.41 | 1.61 | 1.40 |
| ahu1/ra_humidity | 2.11 | 0.68 | 1.83 | 1.99 | 1.65 |
| ahu1/sfan_amps | 1.82 | 0.55 | 1.43 | 1.67 | 1.37 |
| ahu1/htg_stm_vlv_1_3 | 1.08 | 0.36 | 0.61 | 0.86 | 0.73 |
| ahu1/stat_press | 1.08 | 0.01 | 0.59 | 0.82 | 0.62 |
| ahu1/pht_temp | 1.53 | 0.56 | 1.17 | 1.35 | 1.15 |
| vv-1-b-1/air_flow/flow_input | 1.46 | 0.70 | 1.18 | 1.27 | 1.15 |
| vv-1-b-1/da_temp/trend_log | 2.39 | 0.39 | 2.14 | 2.27 | 1.79 |
| Average | 1.85 | 0.49 | 1.54 | 1.70 | 1.39 |
| No. | Category | Abbreviation | Definition and Description | Library or Reference |
|---|---|---|---|---|
| 1 | Simple | bfill | use next valid observation to fill gap | pandas.DataFrame.fillna |
| 2 | Simple | ffill | use last valid observation to fill gap | pandas.DataFrame.fillna |
| 3 | Simple | nearest | Use the nearest available value | scipy.interpolate.interp1d |
| 4 | Linear | linear | Linear interpolation | pandas.DataFrame.interpolate |
| 5 | Nonlinear | quadratic | Interpolation of second order | scipy.interpolate.interp1d |
| 6 | Nonlinear | cubic | Interpolation of third order | scipy.interpolate.interp1d |
| 7 | Spline | piecewise_polynomial | Piecewise polynomial curve specified by points and derivatives | scipy.interpolate.PiecewisePolynomial |
| 8 | Spline | from_derivatives | Piecewise polynomial in the Bernstein basis | scipy.interpolate.BPoly.from_derivatives |
| 9 | Spline | pchip | Piecewise Cubic Hermite Interpolating Polynomial | scipy.interpolate.PchipInterpolator |
| 10 | Spline | akima | Akima spline interpolation | scipy.interpolate.Akima1DInterpolator |
| 11 | Machine learning | ANN | Use Multi-layer Perceptron to predict the missing value based on weather and time | sklearn.neural_network.MLPRegressor |
| Sensors\Imputation Methods | bfill | ffill | ANN | Linear | Nearest | Quadratic | Cubic | pp * | Fd * | pchip | akima | Avg * | Ensemble |
|---|---|---|---|---|---|---|---|---|---|---|---|---|---|
| peco_meter/elec_usage_chiller | 0.03 | 0.04 | 0.02 | 0.02 | 0.03 | 0.04 | 0.04 | 0.02 | 0.02 | 0.02 | 0.02 | 0.03 | 0.02 |
| chws_control/chw_flow | 0.43 | 0.33 | 0.14 | 0.23 | 0.27 | 0.26 | 0.27 | 0.23 | 0.23 | 0.23 | 0.24 | 0.26 | 0.14 |
| chws_control/chws_temp | 0.03 | 0.03 | 0.01 | 0.02 | 0.03 | 0.02 | 0.02 | 0.02 | 0.02 | 0.02 | 0.02 | 0.02 | 0.01 |
| chws_control/delta_press | 0.83 | 0.50 | 0.30 | 0.37 | 0.48 | 0.26 | 0.27 | 0.37 | 0.37 | 0.29 | 0.30 | 0.39 | 0.26 |
| chws_control/cw_delta_press | 0.07 | 0.14 | 0.02 | 0.05 | 0.04 | 0.04 | 0.05 | 0.05 | 0.05 | 0.04 | 0.04 | 0.05 | 0.02 |
| chws_control/cwr_temp | 0.01 | 0.01 | 0.01 | 0.01 | 0.01 | 0.02 | 0.02 | 0.01 | 0.01 | 0.01 | 0.01 | 0.01 | 0.01 |
| chws_control/cw_vlv_fdbk | 0.49 | 0.49 | 0.16 | 0.44 | 0.49 | 0.66 | 0.68 | 0.44 | 0.44 | 0.45 | 0.47 | 0.47 | 0.16 |
| ct_control/ct_fan_status/trend_log | 1.94 | 1.82 | 0.53 | 1.58 | 1.87 | 2.03 | 2.08 | 1.58 | 1.58 | 1.62 | 1.65 | 1.66 | 0.53 |
| ahu1/ra_temp/trend_log | 0.01 | 0.01 | 0.01 | 0.00 | 0.01 | 0.00 | 0.00 | 0.00 | 0.00 | 0.00 | 0.00 | 0.01 | 0.00 |
| ahu1/econ | 0.47 | 0.09 | 0.16 | 0.16 | 0.07 | 0.16 | 0.18 | 0.16 | 0.16 | 0.13 | 0.13 | 0.17 | 0.07 |
| ahu1/chw_valve | 0.26 | 0.28 | 0.11 | 0.12 | 0.06 | 0.19 | 0.20 | 0.12 | 0.12 | 0.09 | 0.09 | 0.15 | 0.06 |
| ahu1/ra_humidity | 0.04 | 0.04 | 0.02 | 0.02 | 0.03 | 0.02 | 0.02 | 0.02 | 0.02 | 0.02 | 0.02 | 0.03 | 0.02 |
| ahu1/sfan_amps | 0.13 | 0.16 | 0.09 | 0.08 | 0.09 | 0.08 | 0.08 | 0.08 | 0.08 | 0.08 | 0.08 | 0.09 | 0.08 |
| ahu1/htg_stm_vlv_1_3 | 0.16 | 0.10 | 0.06 | 0.10 | 0.08 | 0.10 | 0.12 | 0.10 | 0.10 | 0.09 | 0.10 | 0.10 | 0.06 |
| ahu1/stat_press | 0.06 | 0.13 | 0.09 | 0.06 | 0.13 | 0.16 | 0.17 | 0.06 | 0.06 | 0.07 | 0.07 | 0.10 | 0.06 |
| ahu1/pht_temp | 0.03 | 0.01 | 0.02 | 0.01 | 0.00 | 0.01 | 0.02 | 0.01 | 0.01 | 0.01 | 0.01 | 0.01 | 0.00 |
| vv-1-b-1/air_flow/flow_input | 0.44 | 0.52 | 0.26 | 0.23 | 0.43 | 0.23 | 0.25 | 0.23 | 0.23 | 0.21 | 0.25 | 0.30 | 0.21 |
| vv-1-b-1/da_temp/trend_log | 0.01 | 0.01 | 0.01 | 0.01 | 0.01 | 0.01 | 0.01 | 0.01 | 0.01 | 0.01 | 0.01 | 0.01 | 0.01 |
| Avg * | 0.30 | 0.26 | 0.11 | 0.19 | 0.23 | 0.24 | 0.25 | 0.19 | 0.19 | 0.19 | 0.19 | 0.21 | 0.09 |
Publisher’s Note: MDPI stays neutral with regard to jurisdictional claims in published maps and institutional affiliations. |
© 2020 by the author. Licensee MDPI, Basel, Switzerland. This article is an open access article distributed under the terms and conditions of the Creative Commons Attribution (CC BY) license (http://creativecommons.org/licenses/by/4.0/).
Share and Cite
Zhang, L. A Pattern-Recognition-Based Ensemble Data Imputation Framework for Sensors from Building Energy Systems. Sensors 2020, 20, 5947. https://doi.org/10.3390/s20205947
Zhang L. A Pattern-Recognition-Based Ensemble Data Imputation Framework for Sensors from Building Energy Systems. Sensors. 2020; 20(20):5947. https://doi.org/10.3390/s20205947
Chicago/Turabian StyleZhang, Liang. 2020. "A Pattern-Recognition-Based Ensemble Data Imputation Framework for Sensors from Building Energy Systems" Sensors 20, no. 20: 5947. https://doi.org/10.3390/s20205947
APA StyleZhang, L. (2020). A Pattern-Recognition-Based Ensemble Data Imputation Framework for Sensors from Building Energy Systems. Sensors, 20(20), 5947. https://doi.org/10.3390/s20205947