A Cyber-Physical-Human System for One-to-Many UAS Operations: Cognitive Load Analysis †


 ,
,  ,
,
Abstract
1. Introduction
1.1. Background on Mental Worklaod (MWL) and MWL Measurements
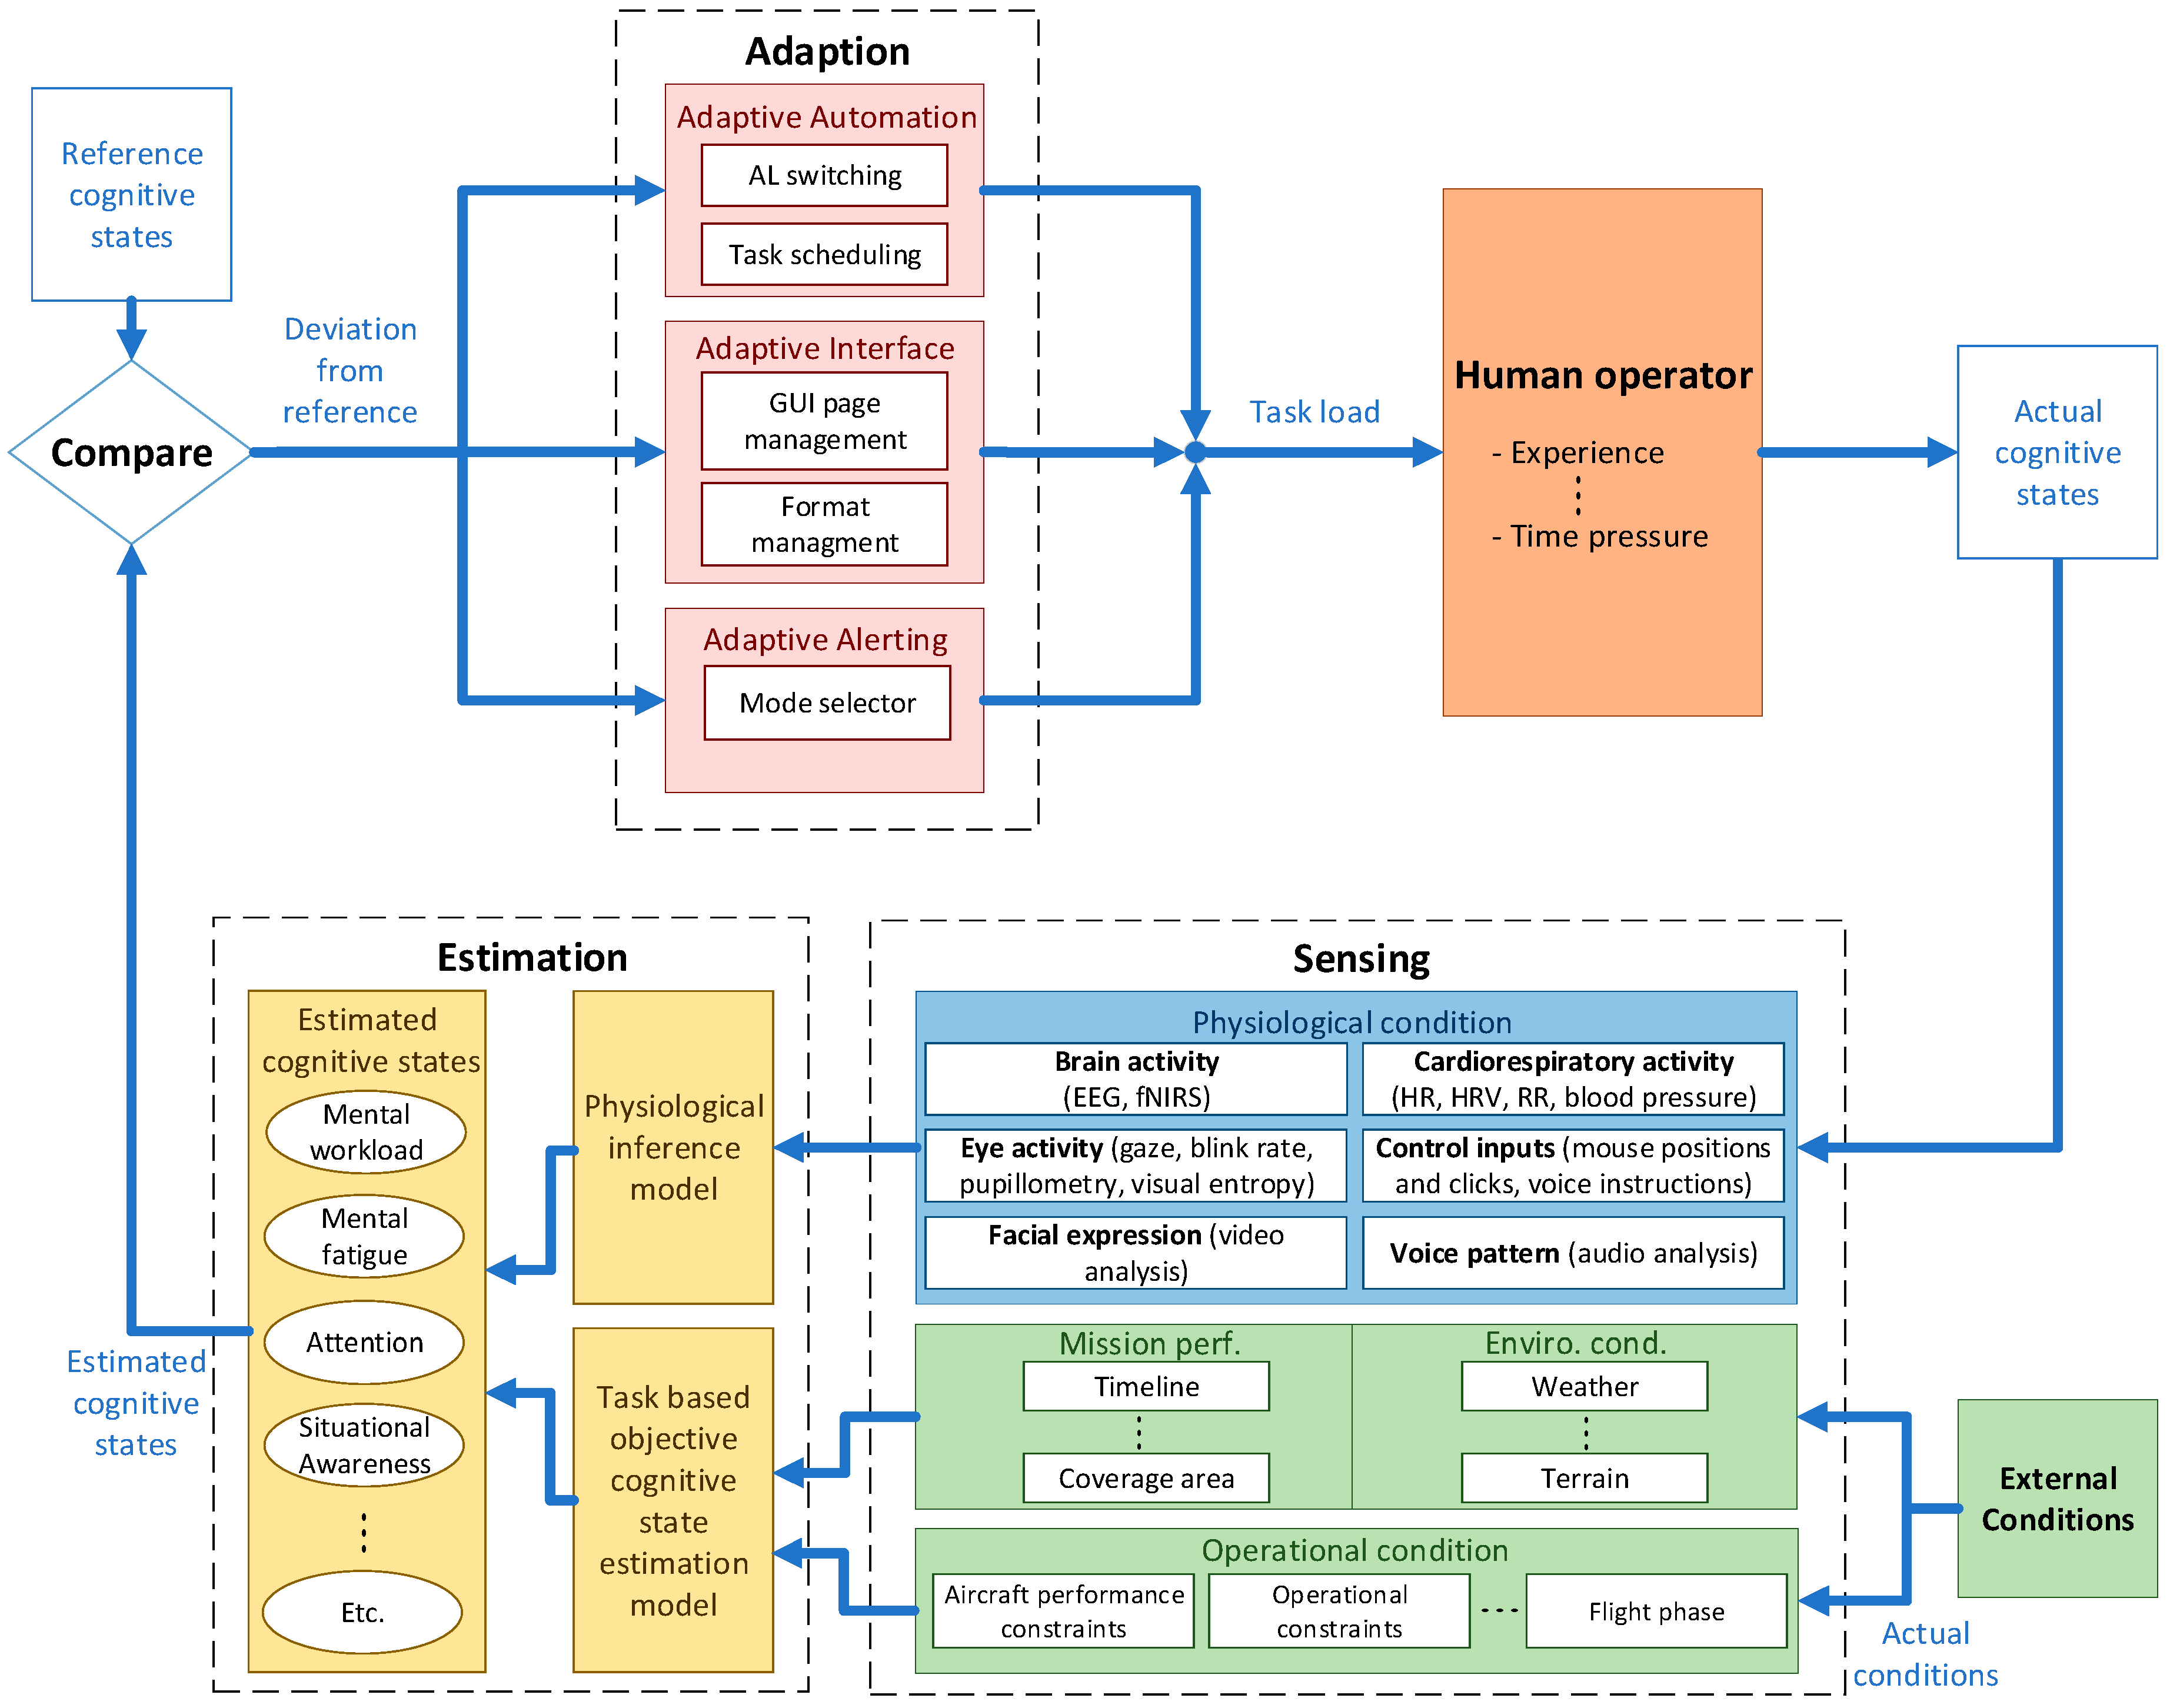
1.2. Cognitive Human Machine System (CHMS) and Design Considerations
2. One-to-Many UAS Test Case
2.1. Participants
2.2. Experimental Procedure
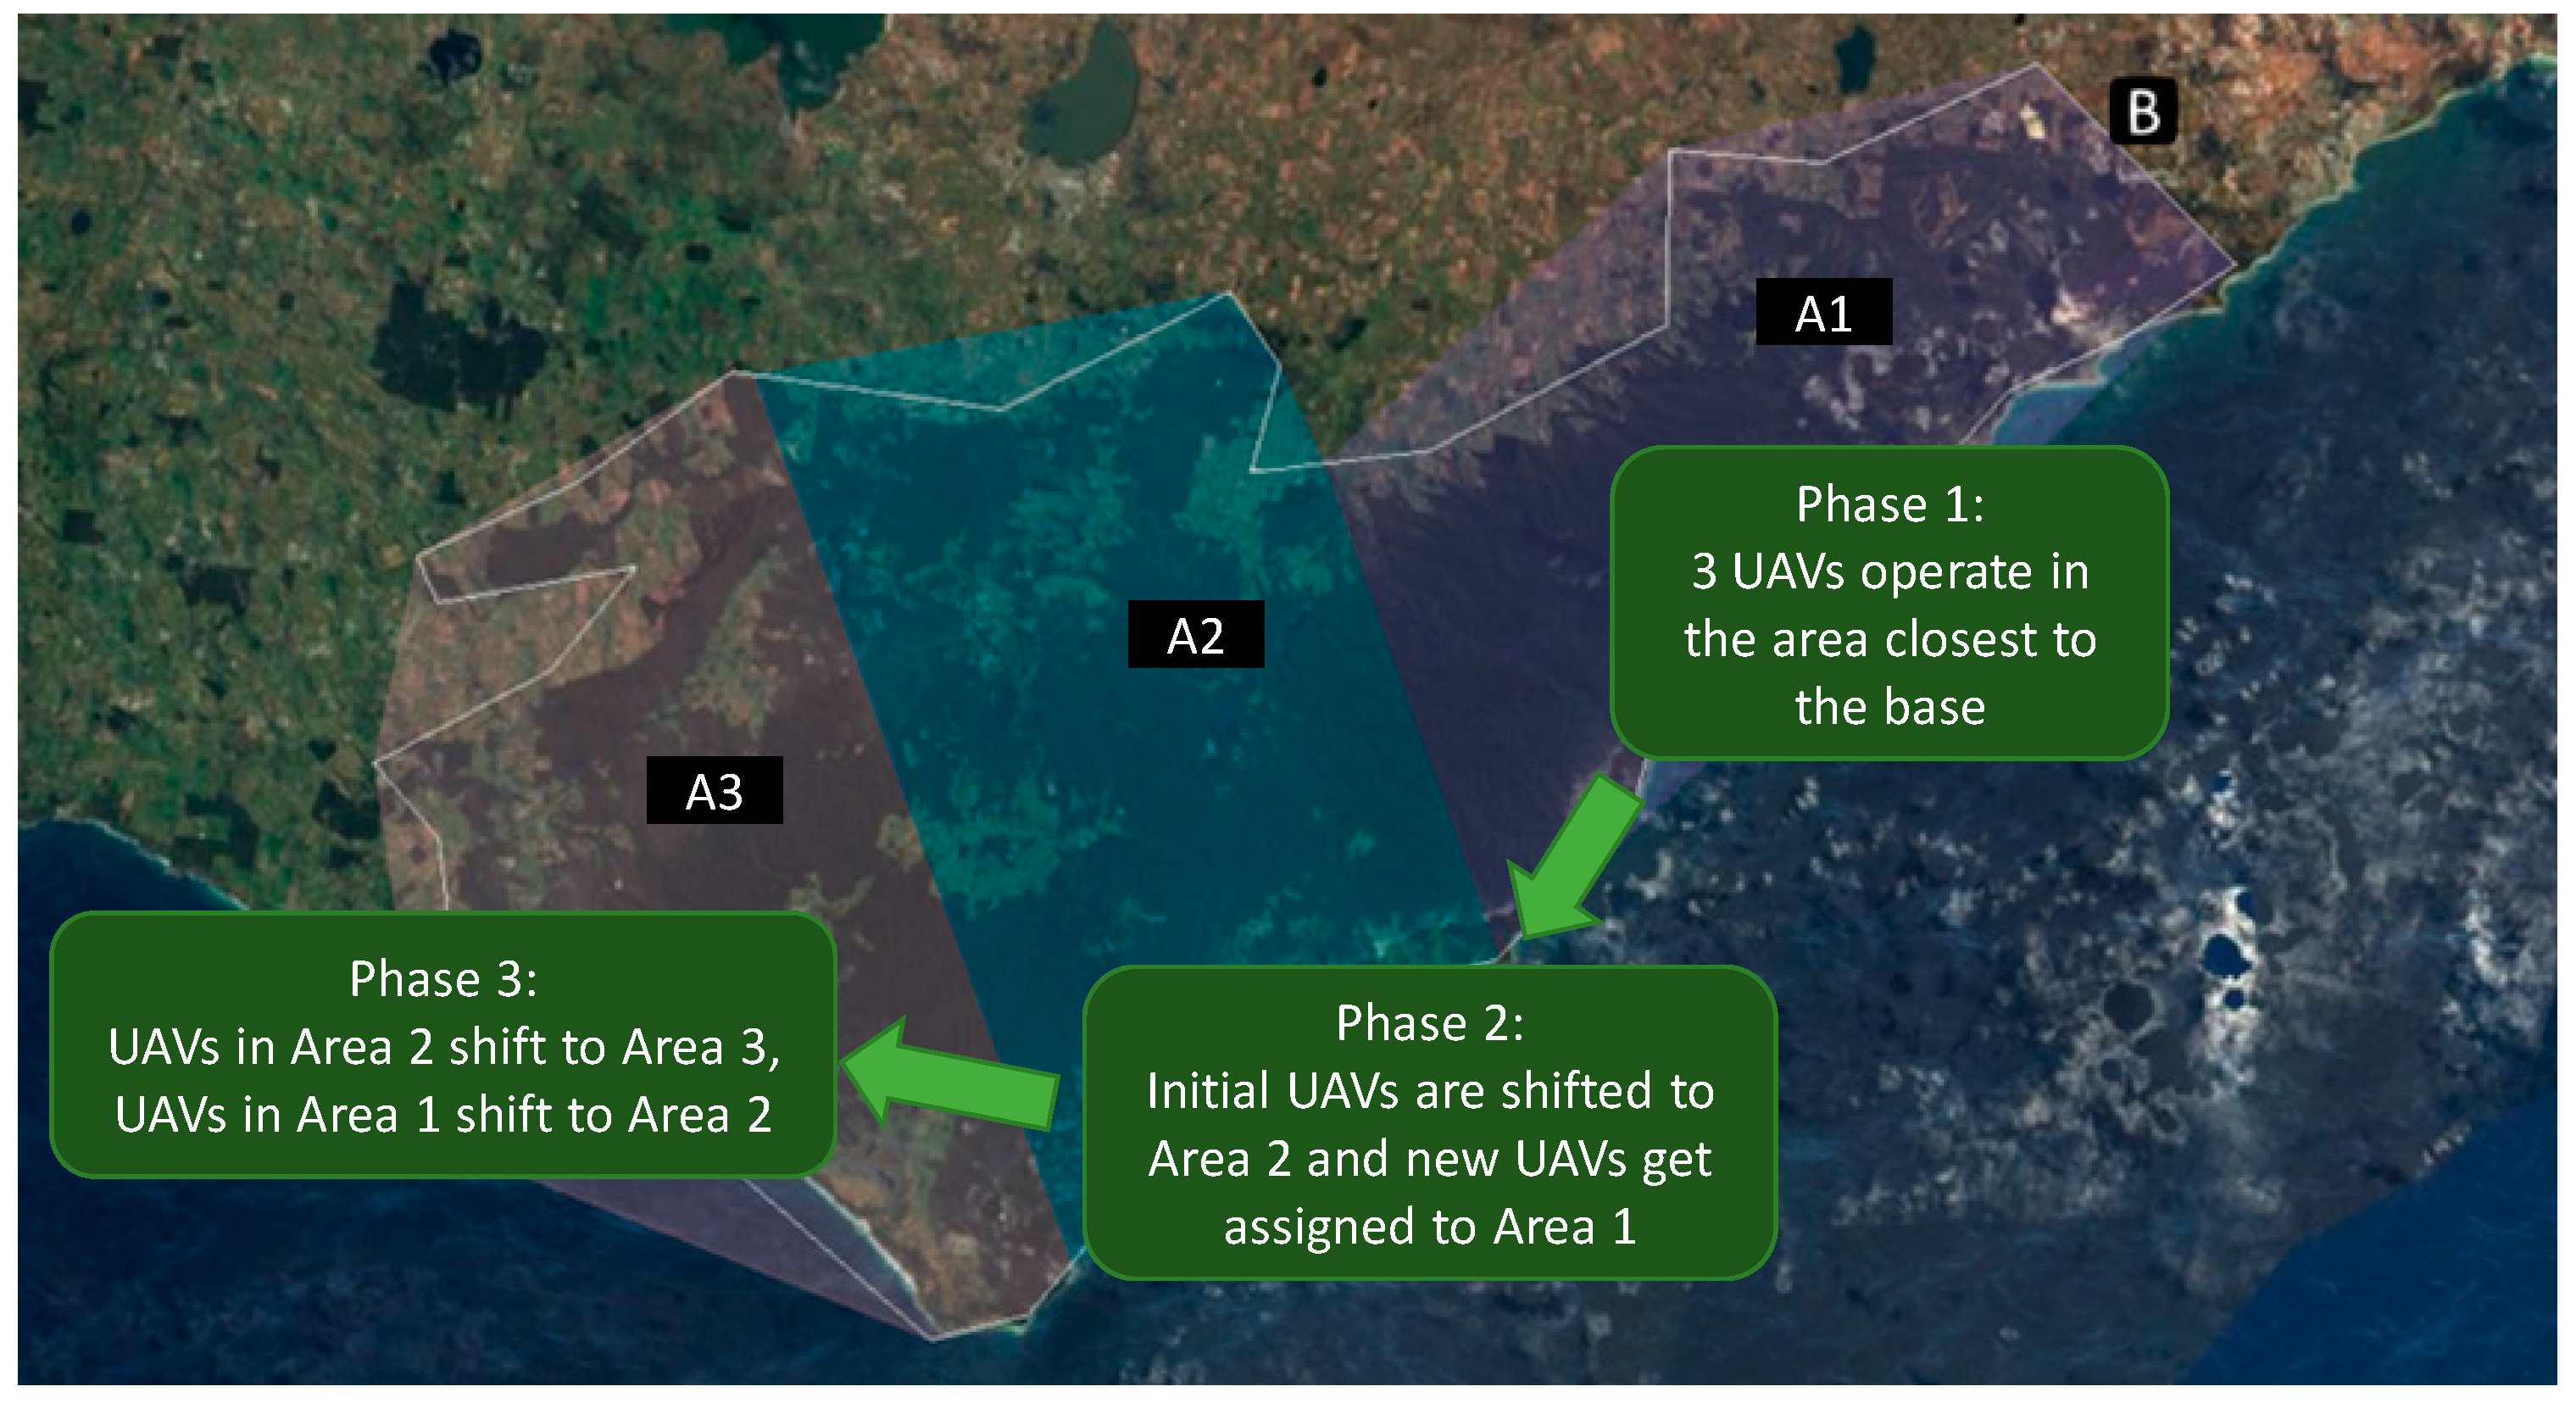
2.3. Mission Concept
Secondary Task Index
2.4. Equipment and Measurement Methods
2.4.1. Eye Tracker Equipment and Data Processing
2.4.2. EEG Equipment and Data Processing
2.4.3. Controller Input Processing
2.5. Data Analysis
2.5.1. ANOVA Analysis
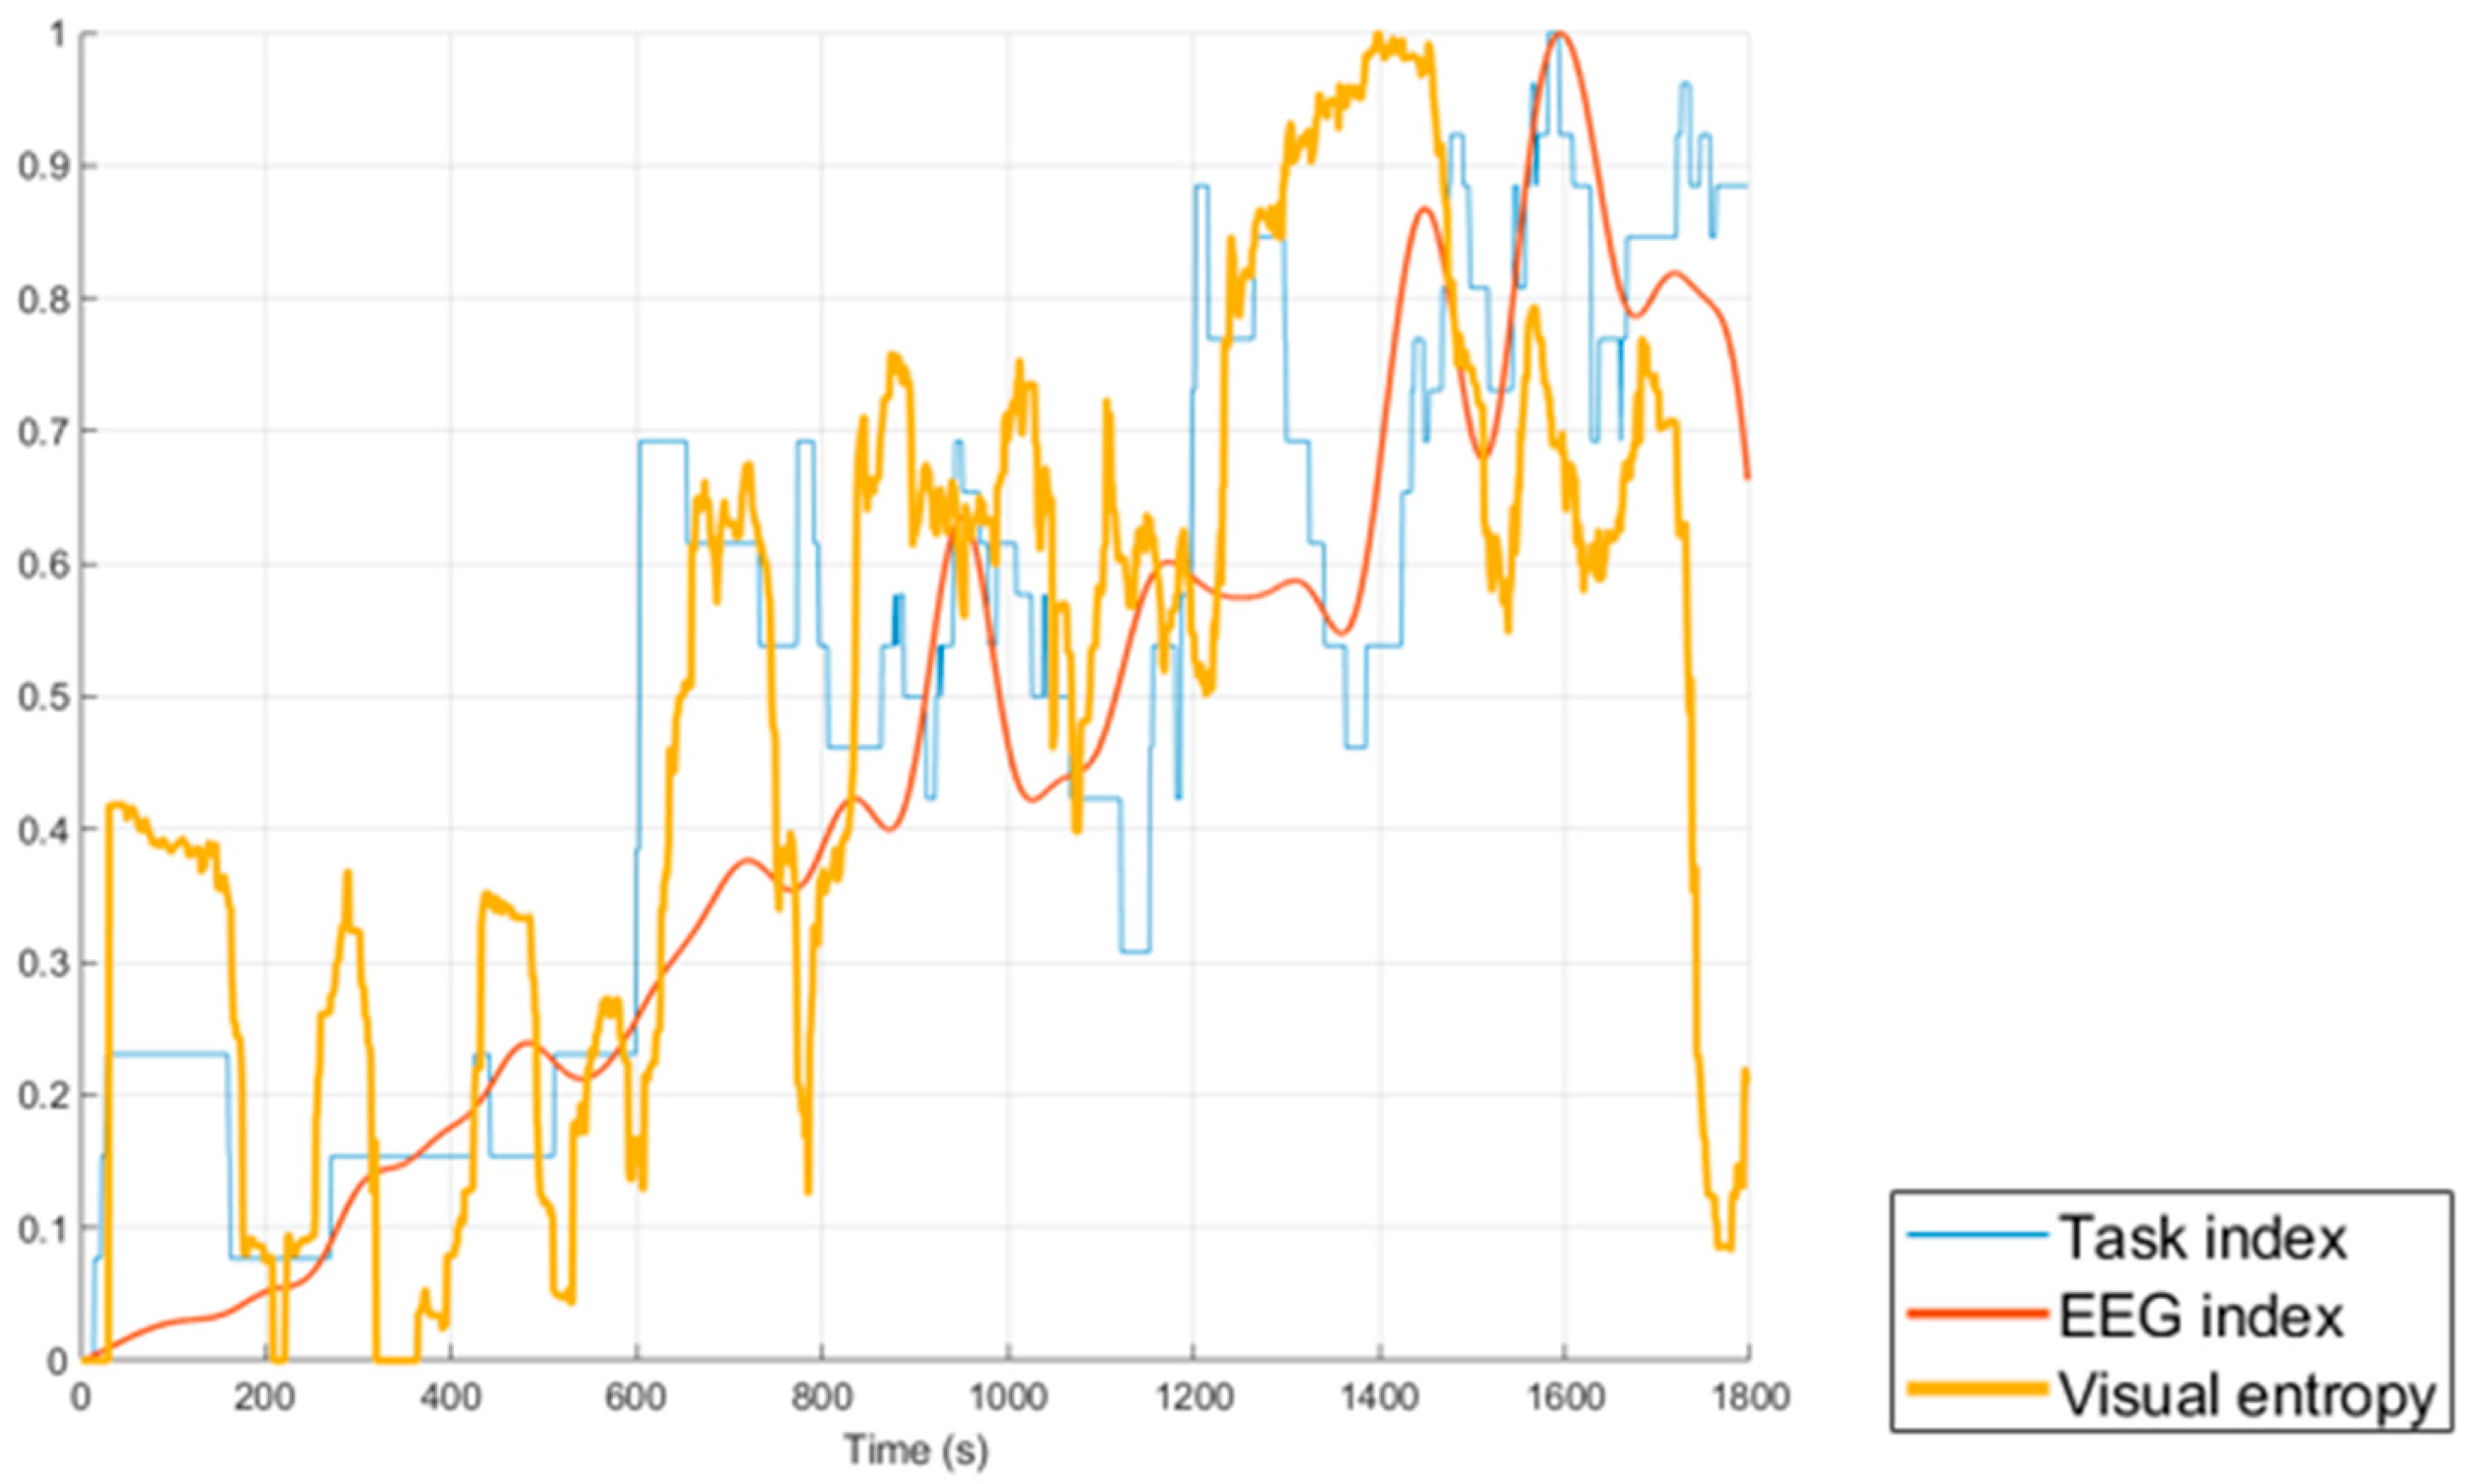
2.5.2. Correlation between Features
3. Results
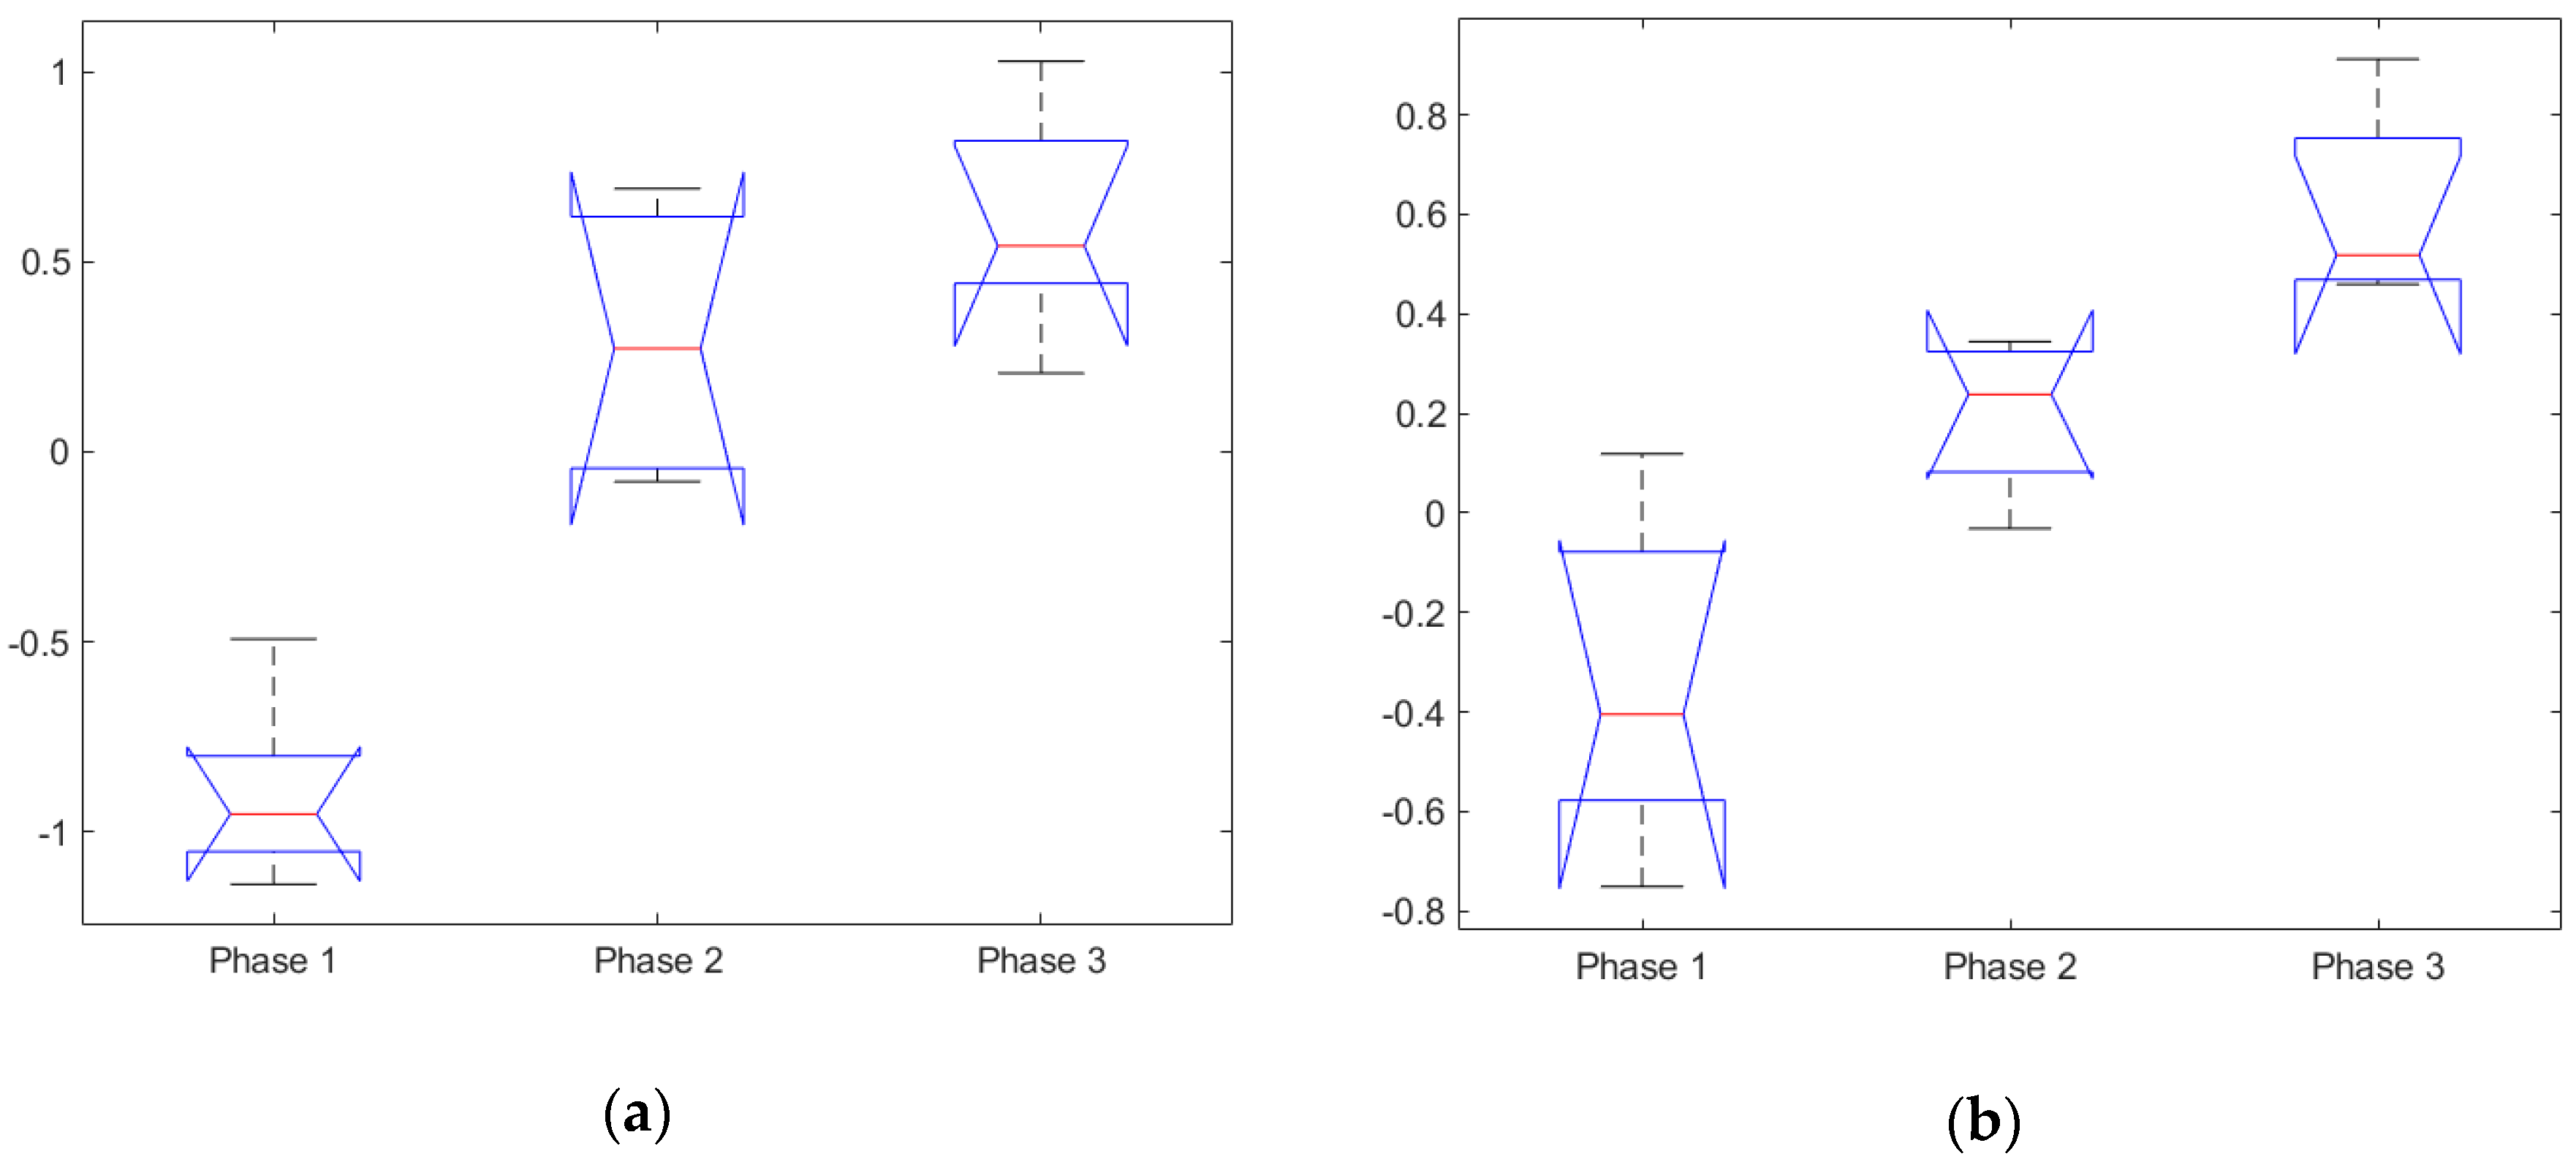
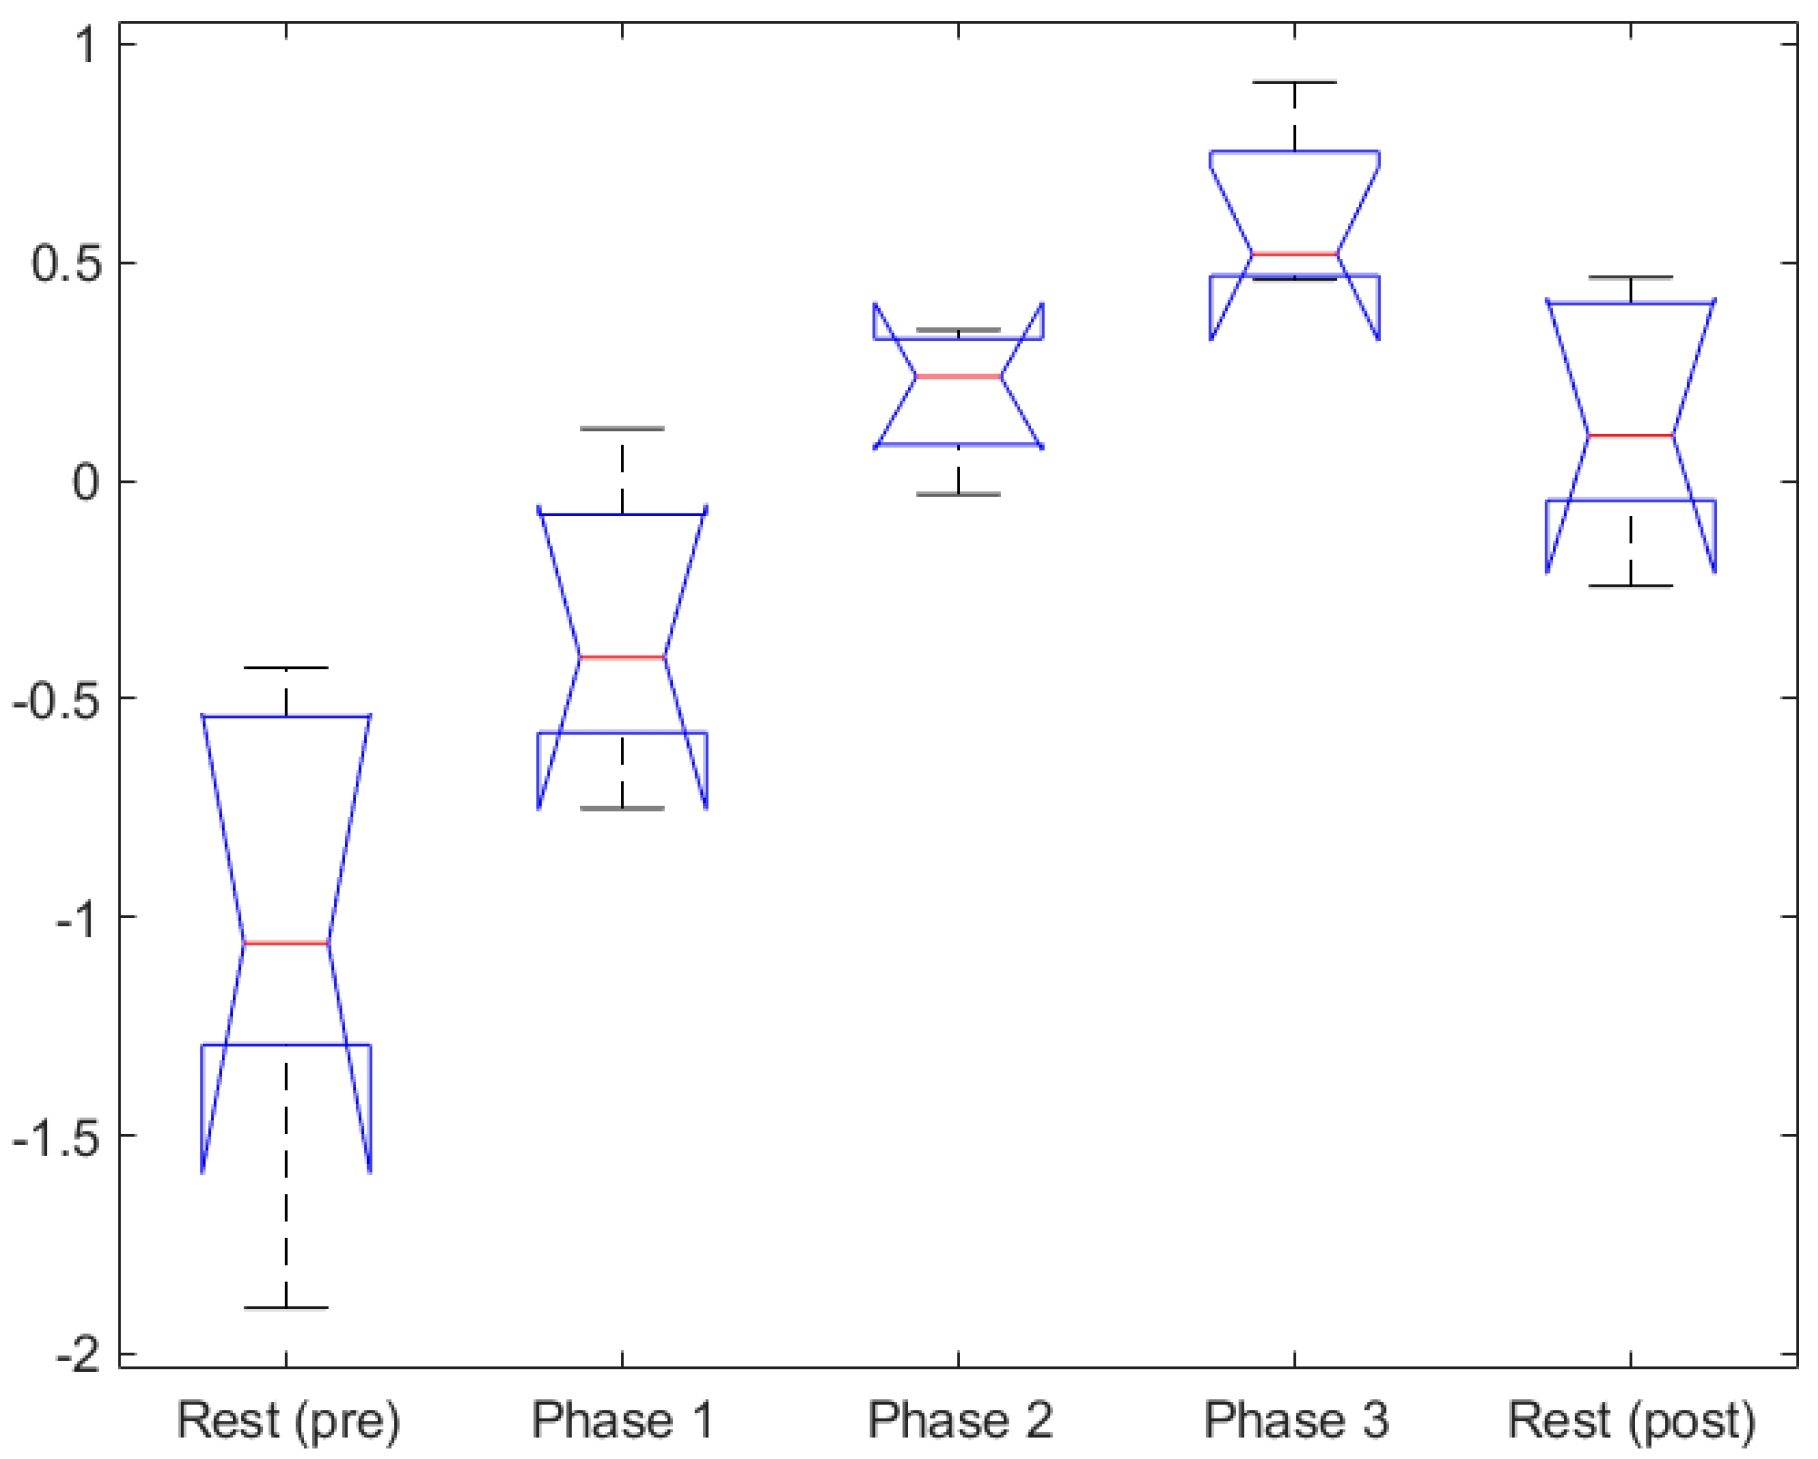
3.1. ANOVA Analysis
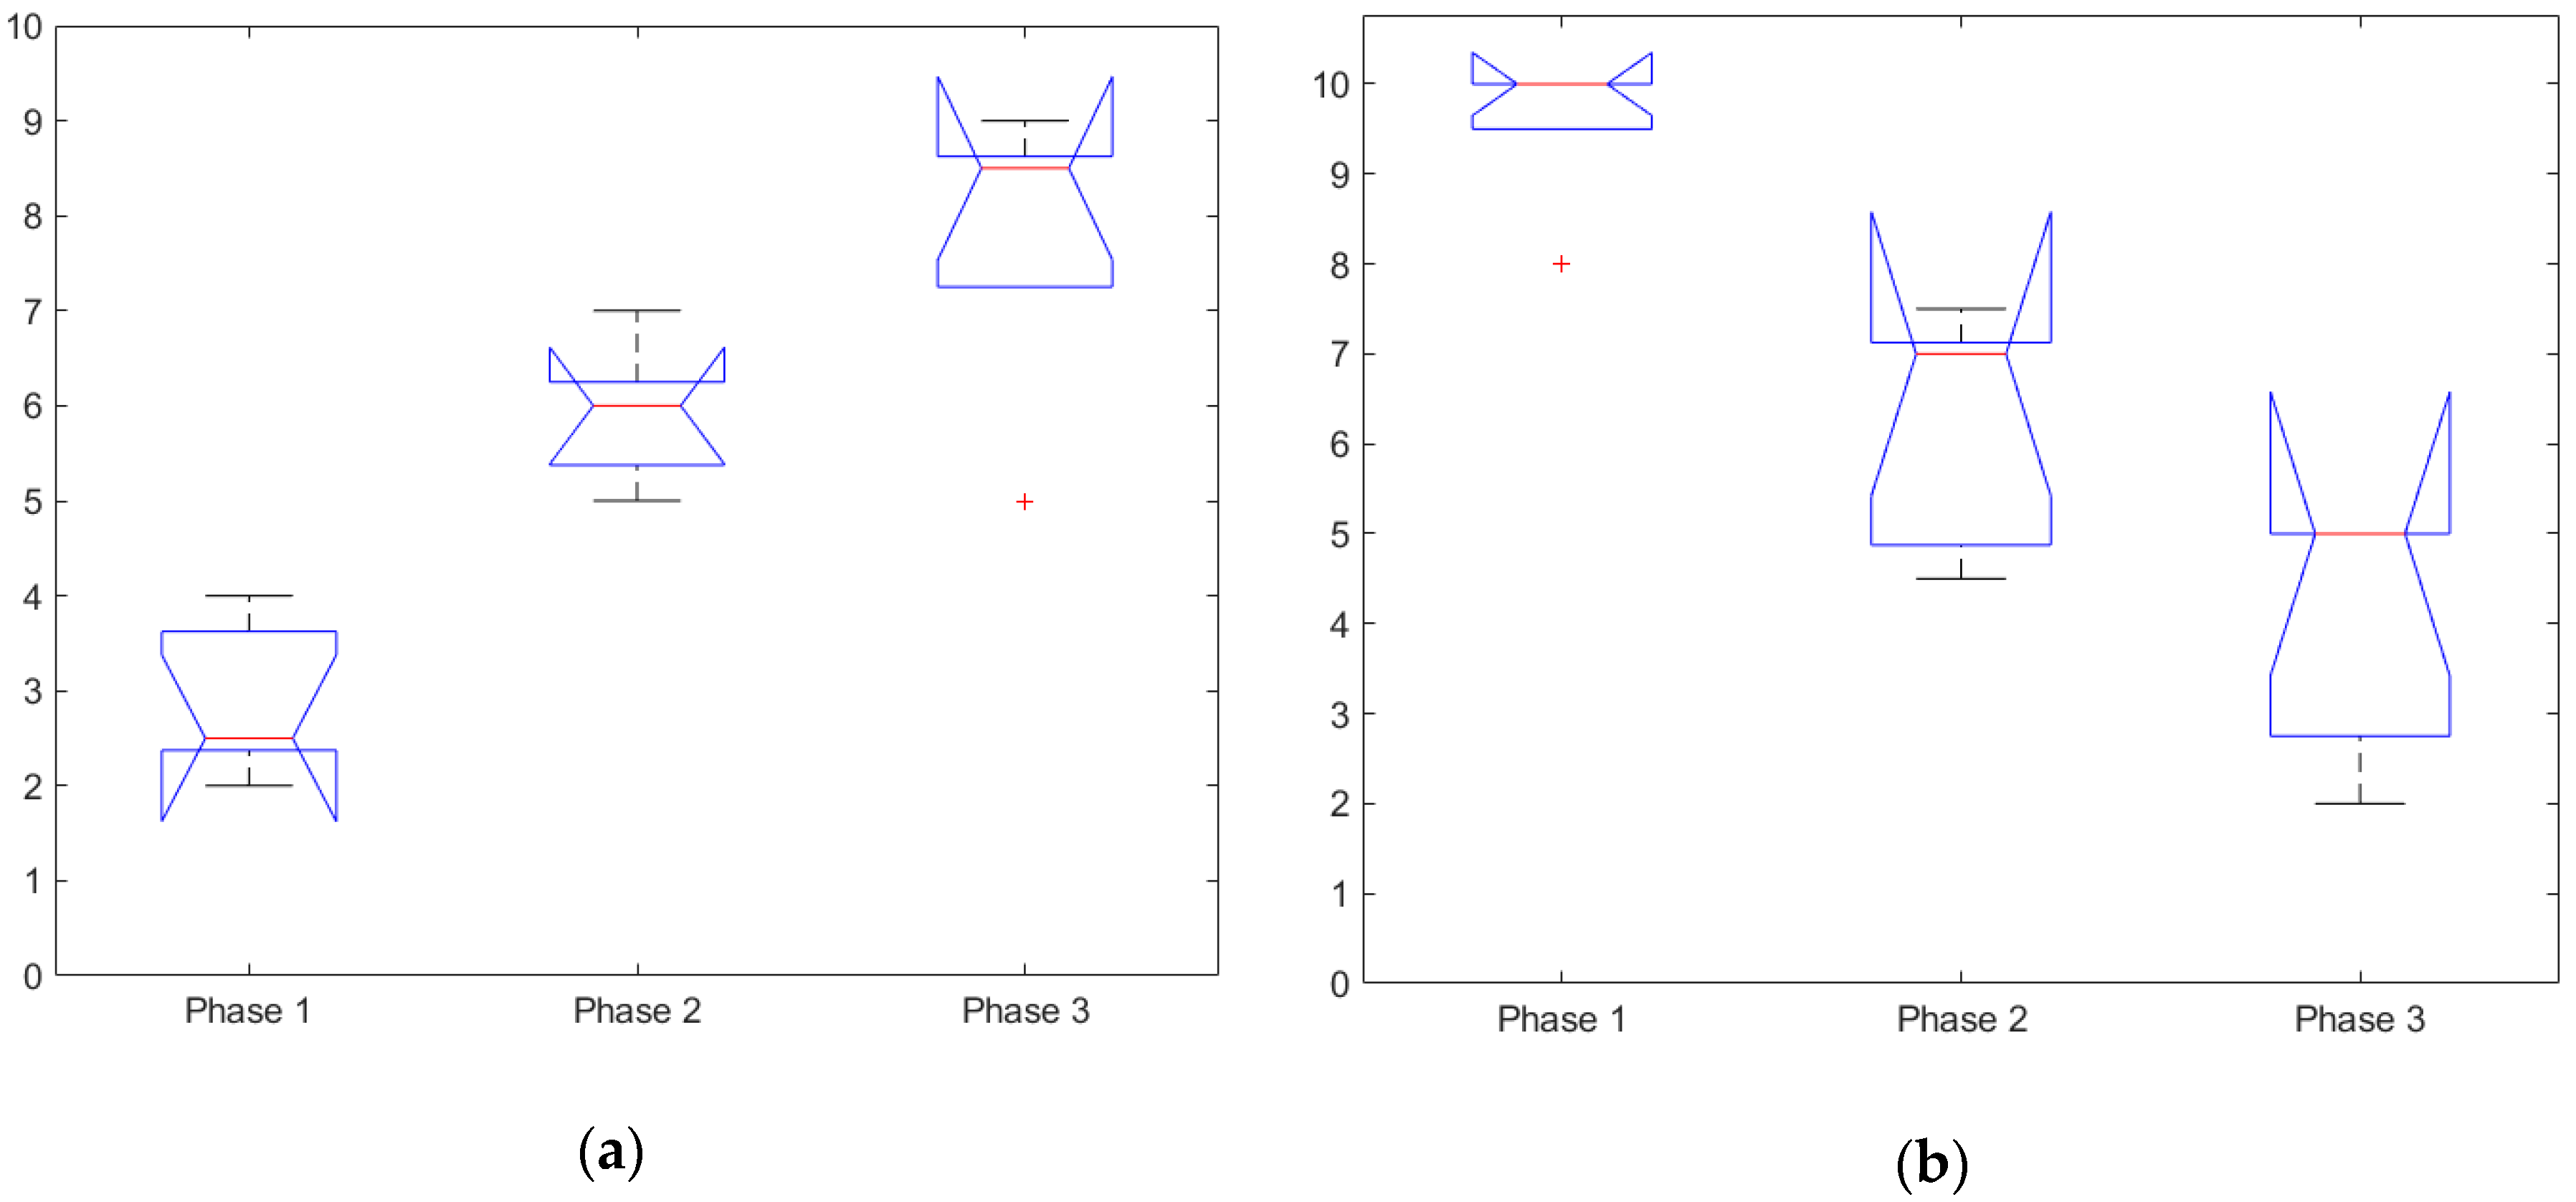
3.1.1. Subjective Rating
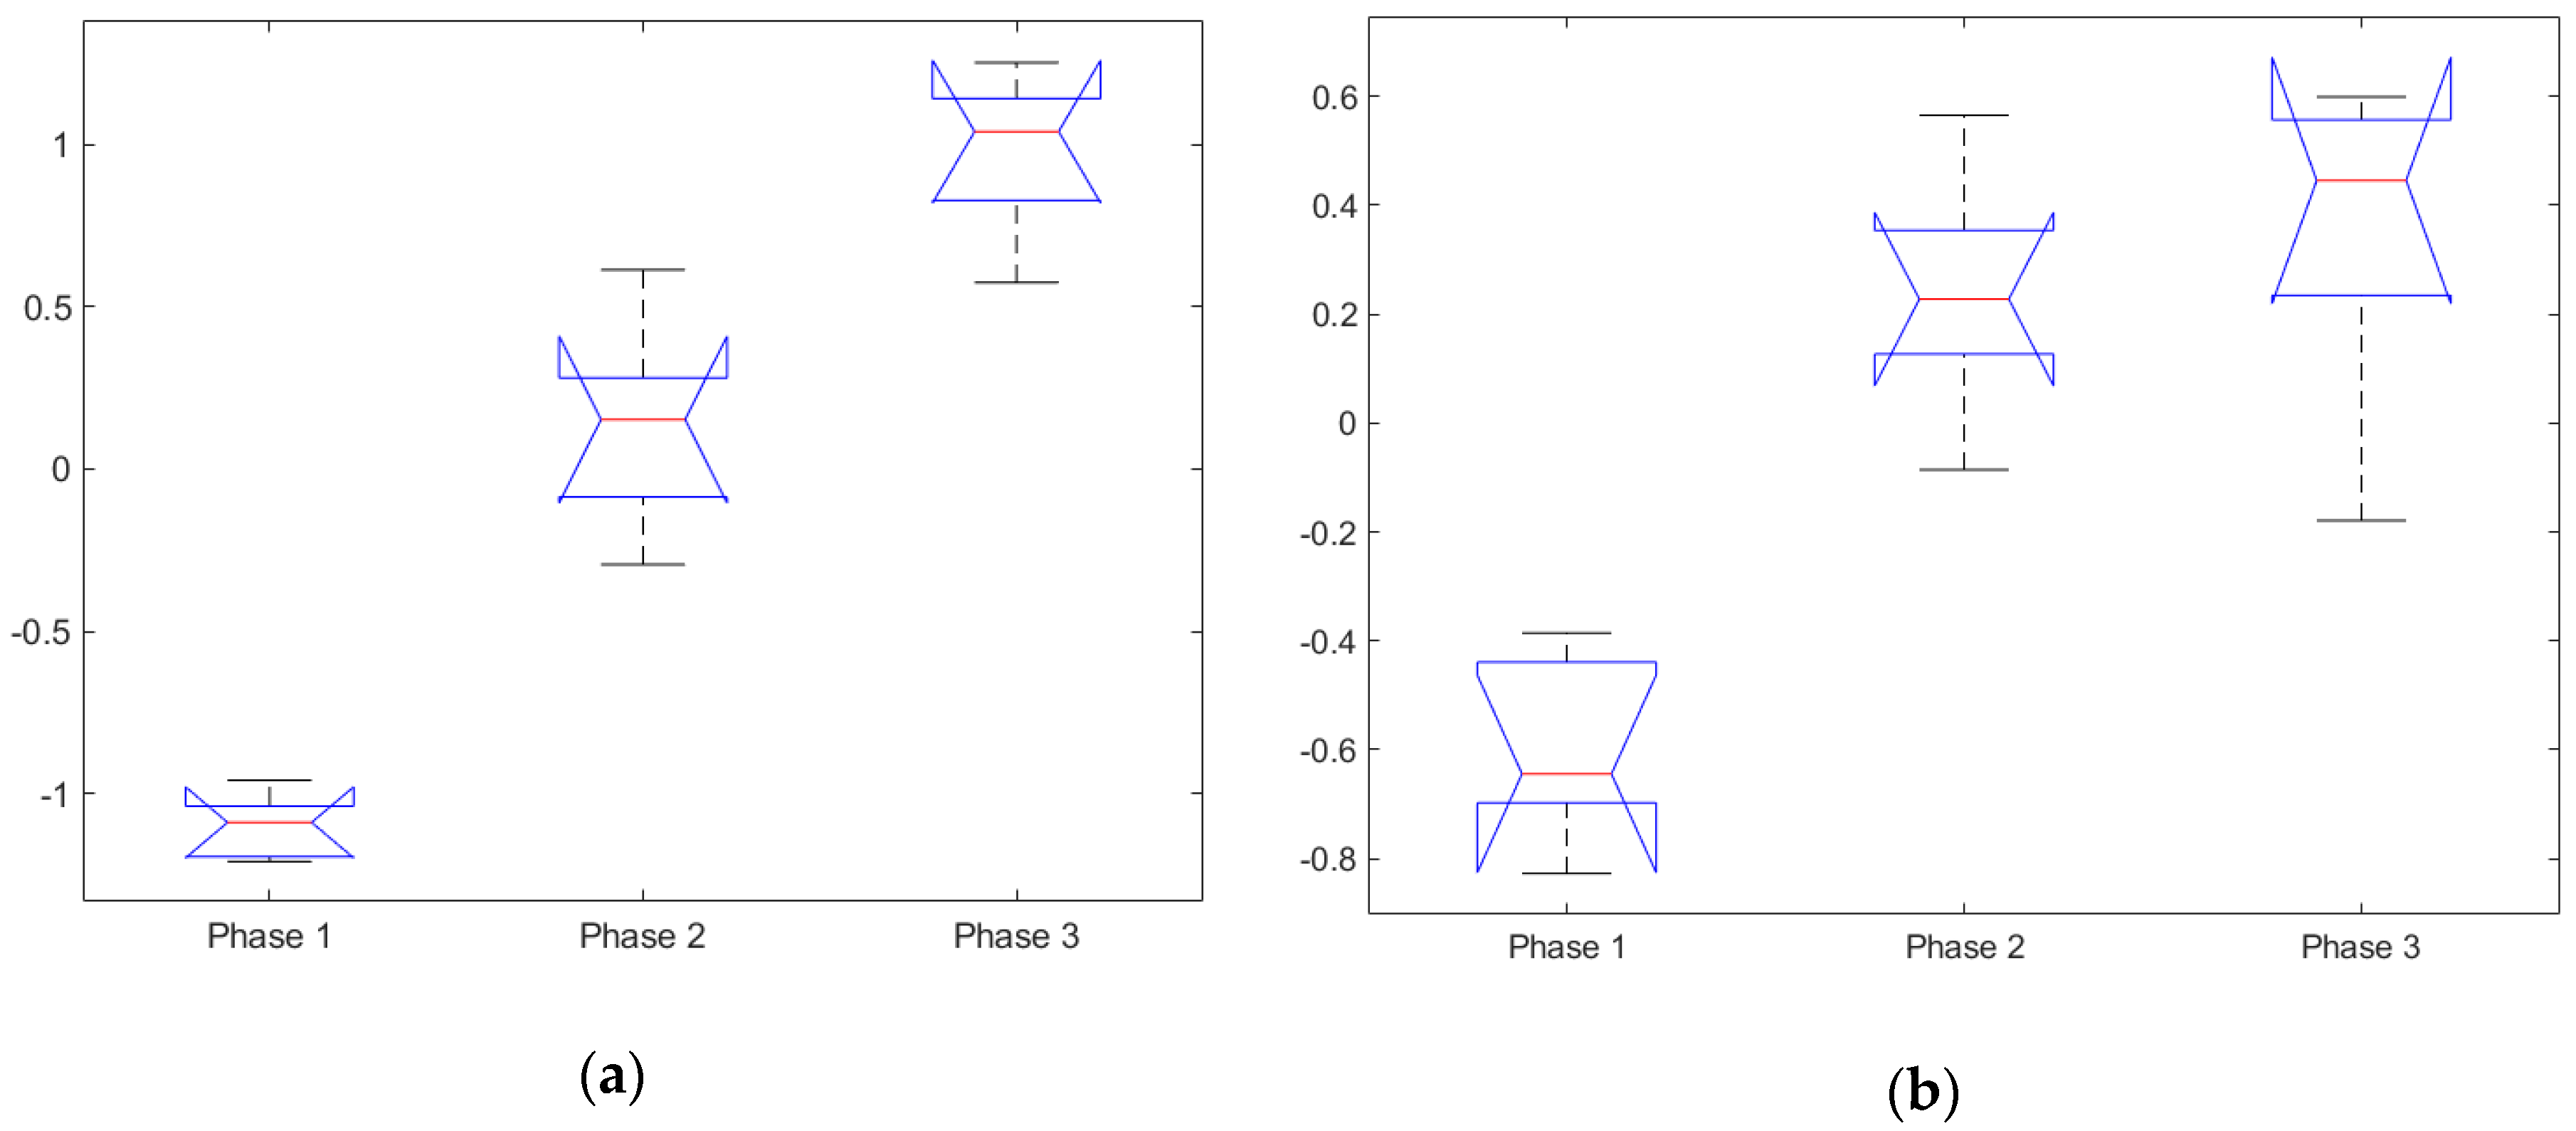
3.1.2. Task Index and Controller Input
3.1.3. Physiological Measures
3.2. Correlation Between Features
4. Discussion
5. Conclusions
Author Contributions
Funding
Conflicts of Interest
References
- Lim, Y.; Gardi, A.G.M.; Sabatini, R.; Ramasamy, S.; Kistan, T.; Ezer, N.; Vince, J.; Bolia, R. Avionics Human-Machine Interfaces and Interactions for Manned and Unmanned Aircraft. Prog. Aerosp. Sci. 2018, 102, 1–46. [Google Scholar] [CrossRef]
- Brown, J.P.; Royal Melbourne Institute of Technology, Australia. The Effect of Automation on Human Factors in Aviation. J. Instrum. Autom. Syst. 2017, 3, 31–46. [Google Scholar] [CrossRef]
- Pongsakornsathien, N.; Lim, Y.; Gardi, A.; Hilton, S.; Planke, L.; Sabatini, R.; Kistan, T.; Ezer, N. Ezer Sensor Networks for Aerospace Human-Machine Systems. Sensors 2019, 19, 3465. [Google Scholar] [CrossRef] [PubMed]
- Lim, Y.; Ramasamy, S.; Gardi, A.; Kistan, T.; Sabatini, R. Cognitive Human-Machine Interfaces and Interactions for Unmanned Aircraft. J. Intell. Robot. Syst. 2017, 91, 755–774. [Google Scholar] [CrossRef]
- Liu, J.; Gardi, A.G.M.; Ramasamy, S.; Lim, Y.; Sabatini, R. Cognitive pilot-aircraft interface for single-pilot operations. Knowl. Based Syst. 2016, 112, 37–53. [Google Scholar] [CrossRef]
- Alicia, T.; Taylor, G.; Turpin, T.; Surana, A. Removing the Bottleneck: Utilizing Autonomy to Manage Multiple UAS Sensors from Inside a Cockpit; SPIE: Bellingham, WA, USA, 2018; Volume 10640. [Google Scholar]
- Lim, Y.; Bassien-Capsa, V.; Ramasamy, S.; Liu, J.; Sabatini, R. Commercial airline single-pilot operations: System design and pathways to certification. IEEE Aerosp. Electron. Syst. Mag. 2017, 32, 4–21. [Google Scholar] [CrossRef]
- Taylor, G.; Purman, B.; Schermerhorn, P.; Garcia-Sampedro, G.; Hubal, R.; Crabtree, K.; Rowe, A.; Spriggs, S. Multi-Modal Interaction for UAS Control; SPIE: Bellingham, WA, USA, 2015; Volume 9468. [Google Scholar]
- Urigüen, J.A.; García-Zapirain, B. EEG artifact removal—State-of-the-art and guidelines. J. Neural Eng. 2015, 12, 31001. [Google Scholar] [CrossRef]
- Kar, A.; Corcoran, P. A Review and Analysis of Eye-Gaze Estimation Systems, Algorithms and Performance Evaluation Methods in Consumer Platforms. IEEE Access 2017, 5, 16495–16519. [Google Scholar] [CrossRef]
- Lim, Y.; Gardi, A.; Pongsakornsathien, N.; Sabatini, R.; Ezer, N.; Kistan, T. Experimental characterisation of eye-tracking sensors for adaptive human-machine systems. Measurement 2019, 140, 151–160. [Google Scholar] [CrossRef]
- McKendrick, R.; Feest, B.; Harwood, A.; Falcone, B. Theories and methods for labeling cognitive workload: Classification and transfer learning. Front. Hum. Neurosci. 2019, 13, 295. [Google Scholar] [CrossRef]
- Aghajani, H.; Garbey, M.; Omurtag, A. Measuring mental workload with EEG+fNIRS. Front. Hum. Neurosci. 2017, 11, 359. [Google Scholar] [CrossRef]
- Aricò, P.; Borghini, G.; Di Flumeri, G.; Colosimo, A.; Bonelli, S.; Golfetti, A.; Pozzi, S.; Imbert, J.-P.; Granger, G.; Benhacene, R.; et al. Adaptive automation triggered by eeg-based mental workload index: A passive brain-computer interface application in realistic air traffic control environment. Front. Hum. Neurosci. 2016, 10, 539. [Google Scholar] [CrossRef] [PubMed]
- Baldwin, C.L.; Penaranda, B.N. Adaptive training using an artificial neural network and eeg metrics for within-and cross-task workload classification. NeuroImage 2012, 59, 48–56. [Google Scholar] [CrossRef] [PubMed]
- Dorneich, M.C.; Whitlow, S.D.; Mathan, S.; May Ververs, P.; Erdogmus, D.; Adami, A.; Pavel, M.; Lan, T. Supporting real-time cognitive state classification on a mobile individual. J. Cogn. Eng. Decis. Mak. 2007, 1, 240–270. [Google Scholar] [CrossRef]
- Gateau, T.; Durantin, G.; Lancelot, F.; Scannella, S.; Dehais, F. Real-time state estimation in a flight simulator using fnirs. PLoS ONE 2015, 10, e0121279. [Google Scholar] [CrossRef] [PubMed]
- Yuksel, B.F.; Oleson, K.B.; Harrison, L.; Peck, E.M.; Afergan, D.; Chang, R.; Jacob, R.J. Learn Piano with Bach: An Adaptive Learning Interface that Adjusts Task Difficulty Based on Brain State. In Proceedings of the 2016 CHI Conference on Human Factors in Computing Systems, San Jose, CA, USA, 7–12 May 2016; ACM: New York, NY, USA; pp. 5372–5384. [Google Scholar]
- Tao, D.; Tan, H.; Wang, H.; Zhang, X.; Qu, X.; Zhang, T. A systematic review of physiological measures of mental workload. Int. J. Environ. Res. Public Health 2019, 16, 2716. [Google Scholar] [CrossRef]
- Charles, R.L.; Nixon, J. Measuring mental workload using physiological measures: A systematic review. Appl. Ergon. 2019, 74, 221–232. [Google Scholar] [CrossRef]
- Young, M.S.; Brookhuis, K.A.; Wickens, C.D.; Hancock, P.A. State of science: Mental workload in ergonomics. Ergonomics 2015, 58, 1–17. [Google Scholar] [CrossRef]
- Babiloni, F. Mental Workload Monitoring: New Perspectives from Neuroscience. In Human Mental Workload: Models and Applications; Longo, L., Leva, M.C., Eds.; Springer International Publishing: New York, NY, USA, 2019; pp. 3–19. [Google Scholar]
- Parasuraman, R.; Sheridan, T.B.; Wickens, C.D. Situation awareness, mental workload, and trust in automation: Viable, empirically supported cognitive engineering constructs. J. Cogn. Eng. Decis. Mak. 2008, 2, 140–160. [Google Scholar] [CrossRef]
- Lean, Y.; Shan, F. Brief review on physiological and biochemical evaluations of human mental workload. Hum. Factors Ergon. Manuf. 2012, 22, 177–187. [Google Scholar] [CrossRef]
- Hilburn, B. Cognitive complexity in air traffic control: A literature review. In EEC Note; Tech. Rep. 04/04; Eurocontrol: Brussels, Belgium, 2004. [Google Scholar]
- Westman, M.; Eden, D. The inverted-u relationship between stress and performance: A field study. Work Stress 1996, 10, 165–173. [Google Scholar] [CrossRef]
- Hart, S.G.; Staveland, L.E. Development of nasa-tlx (task load index): Results of empirical and theoretical research. In Advances in Psychology; Hancock, P.A., Meshkati, N., Eds.; Elsevier: Amsterdam, North-Holland, The Netherlands, 1988; Volume 52, pp. 139–183. [Google Scholar]
- Hulbert, T. A Comparison of the “Nasa-Tlx” and “Isa” Subjective Workload Rating Techniques—Internal Report; Civil Aviation Authority Air Traffic Control Evaluation Unit: Bournemouth, UK, 1989. [Google Scholar]
- Peterson, D.A.; Kozhokar, D. Peak-End Effects for Subjective Mental Workload Ratings. In Proceedings of the Human Factors and Ergonomics Society Annual Meeting, Austin, TX, USA, 9–13 October 2017; pp. 2052–2056. [Google Scholar]
- De Waard, D. The Measurement of Drivers’ Mental Workload. Ph.D. Thesis, Groningen University, Groningen, The Netherlands, 1996. [Google Scholar]
- Council, N.R. Human Factors in the Design of Tactical Display Systems for the Individual Soldier; The National Academies Press: Washington, DC, USA, 1995; p. 96. [Google Scholar]
- Brunken, R.; Plass, J.L.; Leutner, D. Direct measurement of cognitive load in multimedia learning. Educ. Psychol. 2003, 38, 53–61. [Google Scholar] [CrossRef]
- Kartali, A.; Janković, M.M.; Gligorijević, I.; Mijović, P.; Mijović, B.; Leva, M.C. Real-time mental workload estimation using eeg. In Human Mental Workload: Models and Applications; Longo, L., Leva, M.C., Eds.; Springer International Publishing: Cham, Switzerland, 2019; pp. 20–34. [Google Scholar]
- Noback, C.R.; Strominger, N.L.; Demarest, R.J.; Ruggiero, D.A. The Human Nervous System: Structure and Function, 6th ed.; Humana Press: Totowa, NJ, USA, 2005; p. 475. [Google Scholar]
- Hsu, B.-W.; Wang, M.-J.J.; Chen, C.-Y.; Chen, F. Effective indices for monitoring mental workload while performing multiple tasks 1. Percept. Mot. Skills 2015, 121, 94–117. [Google Scholar] [CrossRef] [PubMed]
- van Erp, J.B.; Veltman, H.J.; Grootjen, M. Brain-based indices for user system symbiosis. In Brain-Computer Interfaces; Springer: Berlin, Germany, 2010; pp. 201–219. [Google Scholar]
- Puma, S.; Matton, N.; Paubel, P.-V.; Raufaste, É.; El-Yagoubi, R. Using theta and alpha band power to assess cognitive workload in multitasking environments. Int. J. Psychophysiol. 2018, 123, 111–120. [Google Scholar] [CrossRef] [PubMed]
- Smith, M.E.; Gevins, A.; Brown, H.; Karnik, A.; Du, R. Monitoring task loading with multivariate eeg measures during complex forms of human-computer interaction. Hum. Factors 2001, 43, 366–380. [Google Scholar] [CrossRef]
- Klimesch, W. Eeg alpha and theta oscillations reflect cognitive and memory performance: A review and analysis. Brain Res. Rev. 1999, 29, 169–195. [Google Scholar] [CrossRef]
- Gevins, A. High-resolution eeg mapping of cortical activation related to working memory: Effects of task difficulty, type of processing, and practice. Cereb. Cortex 1997, 7, 374–385. [Google Scholar] [CrossRef]
- Gevins, A.; Smith, M.E.; Leong, H.; McEvoy, L.; Whitfield, S.; Du, R.; Rush, G. Monitoring working memory load during computer-based tasks with eeg pattern recognition methods. Hum. Factors 1998, 40, 79–91. [Google Scholar] [CrossRef]
- Antonenko, P.D. The Effect of Leads on Cognitive Load and Learning in a Conceptually Rich Hypertext Environment. Ph.D. Thesis, Iowa State University, Ames, IA, USA, 2007. [Google Scholar]
- Mikhail, M.; El-Ayat, K.; Coan, J.A.; Allen, J.J. Using minimal number of electrodes for emotion detection using brain signals produced from a new elicitation technique. Int. J. Auton. Adapt. Commun. Syst. 2013, 6, 80–97. [Google Scholar] [CrossRef]
- Holmqvist, K.; Nyström, M.; Andersson, R.; Dewhurst, R.; Jarodzka, H.; Van de Weijer, J. Eye Tracking: A Comprehensive Guide to Methods and Measures; Oxford University Press: Oxford, UK, 2011. [Google Scholar]
- Gilland, J. Driving, Eye-Tracking and Visual Entropy: Exploration of Age and Task Effects. Ph.D. Thesis, The University of South Dakota, Vermillion, SD, USA, 2008. [Google Scholar]
- Scanella, S.; Peysakhovich, V.; Ehrig, F.; Dehais, F. Can Flight Phase be Inferred Using Eye Movements? Evidence from Real Flight Conditions. In Proceedings of the 18th European Conference on Eye Movements, Vienna, Austria, 16–21 August 2015. [Google Scholar]
- Gardi, A.; Pongsakornsathien, N.; Planke, L.; Lim, Y.; Kistan, T.; Sabatini, R. Development of a Cognitive Hmi for Air Traffic Management Systems—Report no. 4: Chmi2 System-Level Implementation and Verification in a Representative Simulation Environment; RMIT/SENG/CPS/003-2019; RMIT University and THALES Australia: Bundoora, VIC, Australia, 2019. [Google Scholar]
- Pongsakornsathien, N.; Gardi, A.; Sabatini, R.; Kistan, T.; Ezer, N. Human-machine interactions in very-low-level uas operations and traffic management. In Proceedings of the IEEE/AIAA 39th Digital Avionics Systems Conference, DASC2020, Piscataway, NJ, USA, 11–15 October 2020. [Google Scholar]
- Zander, T.O.; Kothe, C. Towards passive brain-computer interfaces: Applying brain-computer interface technology to human-machine systems in general. J. Neural Eng. 2011, 8, 025005. [Google Scholar] [CrossRef]
- Lim, Y.; Ranasinghe, K.; Gardi, A.; Ezer, N.; Sabatini, R. Human-machine interfaces and interactions for multi uas operations. In Proceedings of the 31st Congress of the International Council of the Aeronautical Sciences (ICAS 2018), Belo Horizonte, Brazil, 9–14 September 2018; pp. 9–14. [Google Scholar]
- Lim, Y.; Samreeloy, T.; Chantaraviwat, C.; Ezer, N.; Gardi, A.; Sabatini, R. Cognitive human-machine interfaces and interactions for multi-uav operations. In Proceedings of the Australian International Aerospace Congress (AIAC18), Melbourne, Australia, 24–28 February 2019. [Google Scholar]


| 1. PRIMARY: Detect the Presence of Wildfire and Track the Spread of Detected Fires | ||||
|---|---|---|---|---|
| 1.1 Wildfires are initialized at the start of the scenario, and spot fires may also be created during the mission. The fires propagate through the AOR based on environmental conditions. | 1.2 While the UAVs are not equipped to fight the wildfires, authorities have requested for constant visual coverage to be maintained on the fire front (i.e., the segment of the map where a fire is still burning). | |||
| 2. SECONDARY: | ||||
| 2.1 Maximize sensor coverage of the search area | 2.2 Maintain a serviceable level of navigation and communication (comm) performance | 2.3 Maintain a serviceable level of fuel | ||
| a. Sensor coverage over the AOR is tracked in terms of revisit time: | b. Three measures are used: | a. Navigation performance: | b. Communication performance: | a. UAVs with low fuel need to be sent back to base for refueling |
| i. Excellent revisit time means below 20 min ii. Adequate revisit time means between 20 to 30 min iii. Poor revisit time means more than 30 min. Implies that the area was not covered by the sensor at all. | i. Coverage of the active sensor (i.e., revisit time of the lidar) ii. Coverage of the passive sensor (i.e., revisit time of the IR camera) iii. Coverage of both sensors (i.e., revisit times of the lidar or IR camera) | i. Excellent navigation accuracy is below 10 m ii. Adequate navigation accuracy is between 10 and 25 m iii. Poor navigation accuracy is above 25m | i. Excellent comm strength is considered above 70% ii. Adequate comm strength is considered between 50% and 70% iii. Poor comm strength is considered below 50% | |
| Pending Secondary Tasks | Penalty |
|---|---|
| Poor navigation performance (accuracy above 25 m) | +1 |
| Adequate navigation performance (accuracy between 10 and 25 m) | +0.5 |
| Excellent navigation performance (accuracy below 10 m) | +0 |
| Poor communication performance (comm strength below 50%) | +1 |
| Adequate communication performance (comm strength between 50% and 70%) | +0.5 |
| Excellent communication performance (comm above 70%) | +0 |
| Critically low fuel (fuel needed to return to base less than 1.5× of fuel on board) | +1 |
| Low fuel (fuel needed to return to base between 1.5× and 2× of fuel on board) | +0.5 |
| Adequate fuel (fuel needed to return to base more than 2× of fuel on board) | +0 |
| Autopilot mode in hold | +1 |
| Autopilot mode off | +0 |
| UAV not assigned into a team | +1 |
| UAV is assigned into a team | +0 |
| UAV does not have any sensors active | +1 |
| UAV does have sensors active | +0 |
| F Value | p Value | |
|---|---|---|
| Subjective MWL rating | 24.09 | 6.283 × 10⁻⁵ |
| Subjective SA rating | 25.82 | 4.497 × 10⁻⁵ |
| Task index | 88.47 | 6.563 × 10⁻⁸ |
| Controller input | 22.1 | 9.472 × 10⁻⁵ |
| EEG index phase 1–5 | 16.44 | 4.115 × 10⁻⁶ |
| EEG index phase 1–3 | 19.57 | 0.0002 |
| Visual entropy | 34.54 | 1.051 × 10⁻⁵ |
| Participant 1 | Participant 2 | Participant 3 | Participant 4 | Participant 5 | |
|---|---|---|---|---|---|
| Task-EEG | 0.354 | 0.662 | 0.567 | 0.677 | 0.878 |
| Task-V.ent. | 0.441 | 0.799 | 0.761 | 0.606 | 0.631 |
| Task-Fused | 0.479 | 0.845 | 0.757 | 0.724 | 0.824 |
| EEG-V.ent. | 0.411 | 0.578 | 0.572 | 0.570 | 0.673 |
| EEG Index | Visual Entropy | Task Index | Control Input | Fused Phys. | Fused Other | |
|---|---|---|---|---|---|---|
| EEG index | 1 | 0.561 ± 0.09 | 0.628 ± 0.19 | 0.037 ± 0.34 | N/A | 0.464 ± 0.24 |
| Visual entropy | 1 | 0.648 ± 0.14 | 0.167 ± 0.42 | N/A | 0.546 ± 0.13 | |
| Task index | 1 | 0.205 ± 0.38 | 0.726 ± 0.14 | N/A | ||
| Control input | 1 | 0.135 ± 0.39 | N/A | |||
| Fused phys. | 1 | 0.541 ± 0.21 | ||||
| Fused other | 1 |
© 2020 by the authors. Licensee MDPI, Basel, Switzerland. This article is an open access article distributed under the terms and conditions of the Creative Commons Attribution (CC BY) license (http://creativecommons.org/licenses/by/4.0/).
Share and Cite
Planke, L.J.; Lim, Y.; Gardi, A.; Sabatini, R.; Kistan, T.; Ezer, N. A Cyber-Physical-Human System for One-to-Many UAS Operations: Cognitive Load Analysis. Sensors 2020, 20, 5467. https://doi.org/10.3390/s20195467
Planke LJ, Lim Y, Gardi A, Sabatini R, Kistan T, Ezer N. A Cyber-Physical-Human System for One-to-Many UAS Operations: Cognitive Load Analysis. Sensors. 2020; 20(19):5467. https://doi.org/10.3390/s20195467
Chicago/Turabian StylePlanke, Lars J., Yixiang Lim, Alessandro Gardi, Roberto Sabatini, Trevor Kistan, and Neta Ezer. 2020. "A Cyber-Physical-Human System for One-to-Many UAS Operations: Cognitive Load Analysis" Sensors 20, no. 19: 5467. https://doi.org/10.3390/s20195467
APA StylePlanke, L. J., Lim, Y., Gardi, A., Sabatini, R., Kistan, T., & Ezer, N. (2020). A Cyber-Physical-Human System for One-to-Many UAS Operations: Cognitive Load Analysis. Sensors, 20(19), 5467. https://doi.org/10.3390/s20195467