Sensing Systems for Respiration Monitoring: A Technical Systematic Review


Abstract

1. Introduction
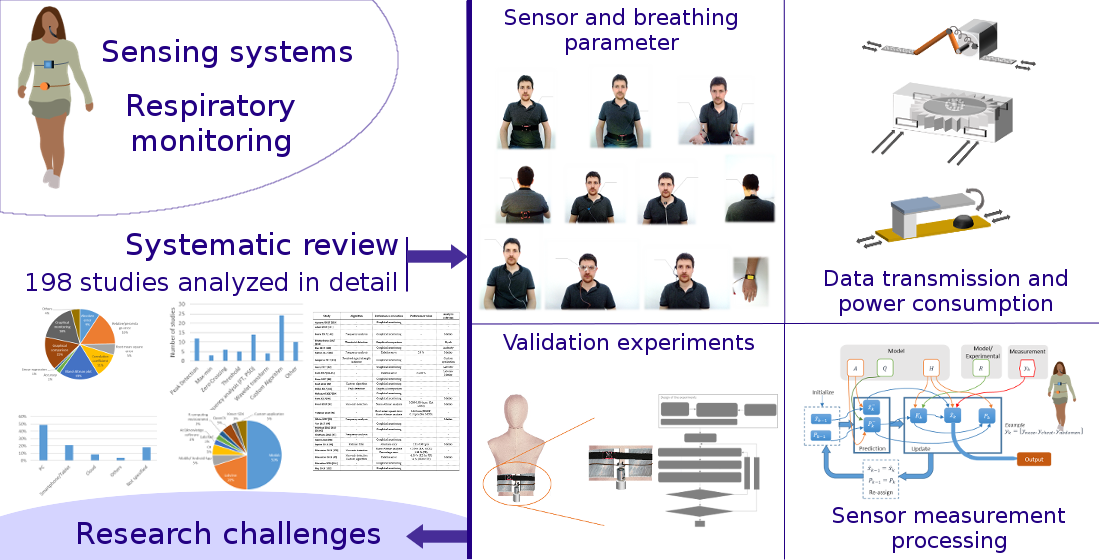
- This review is not exclusively focused on sensor metrological properties or operating principles. Instead, this paper also reviews all the different aspects involved in the design and development of a respiration sensing system: communication protocols, processing stations, energy autonomy and power consumption, general system setups, sensor location and size, breathing parameters, validation methods, details of the test experiments, processing algorithms, software used for analysis, and performance evaluation. To the best of our knowledge, this is the first review paper that analyzes all these aspects in breathing sensors.
- This paper does not focus exclusively on RR. In addition, sensors that measure other breathing parameters are also surveyed.
- Unlike previous reviews, this survey is systematic. Studies on respiration sensors were obtained using objective selection criteria. They were then subjected to detailed analysis.
2. Materials and Methods
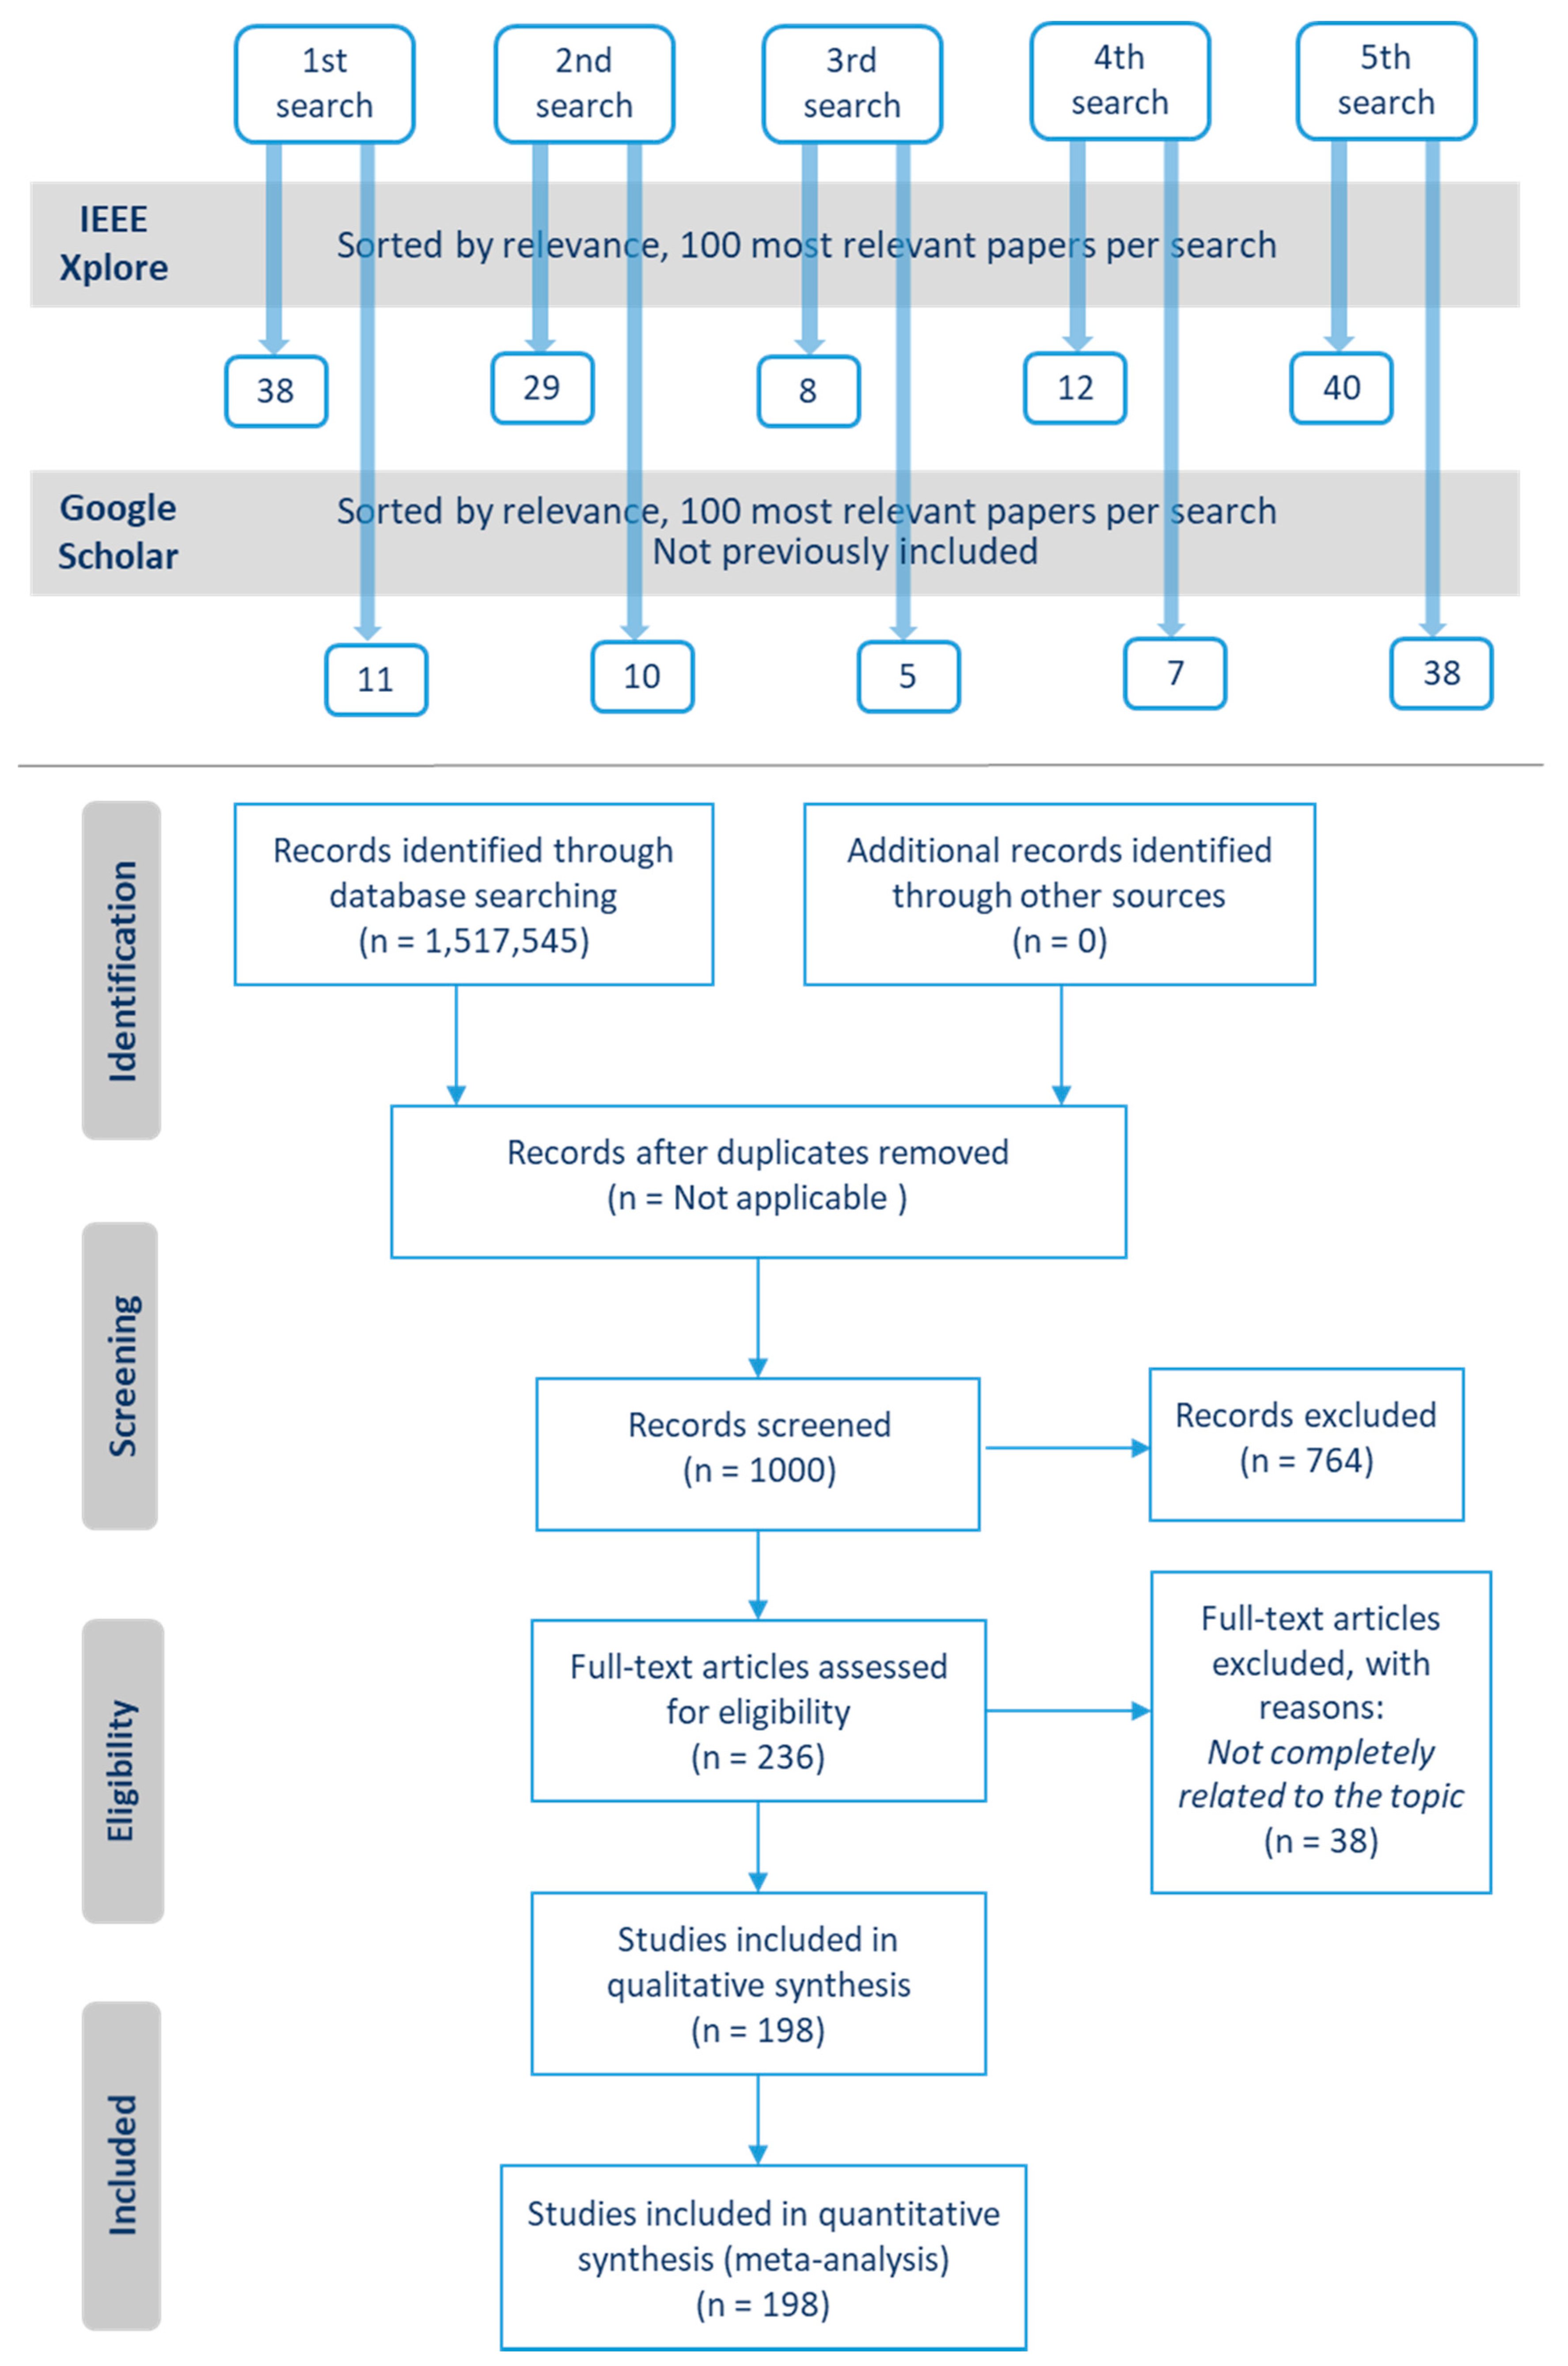
2.1. Search and Selection Procedure
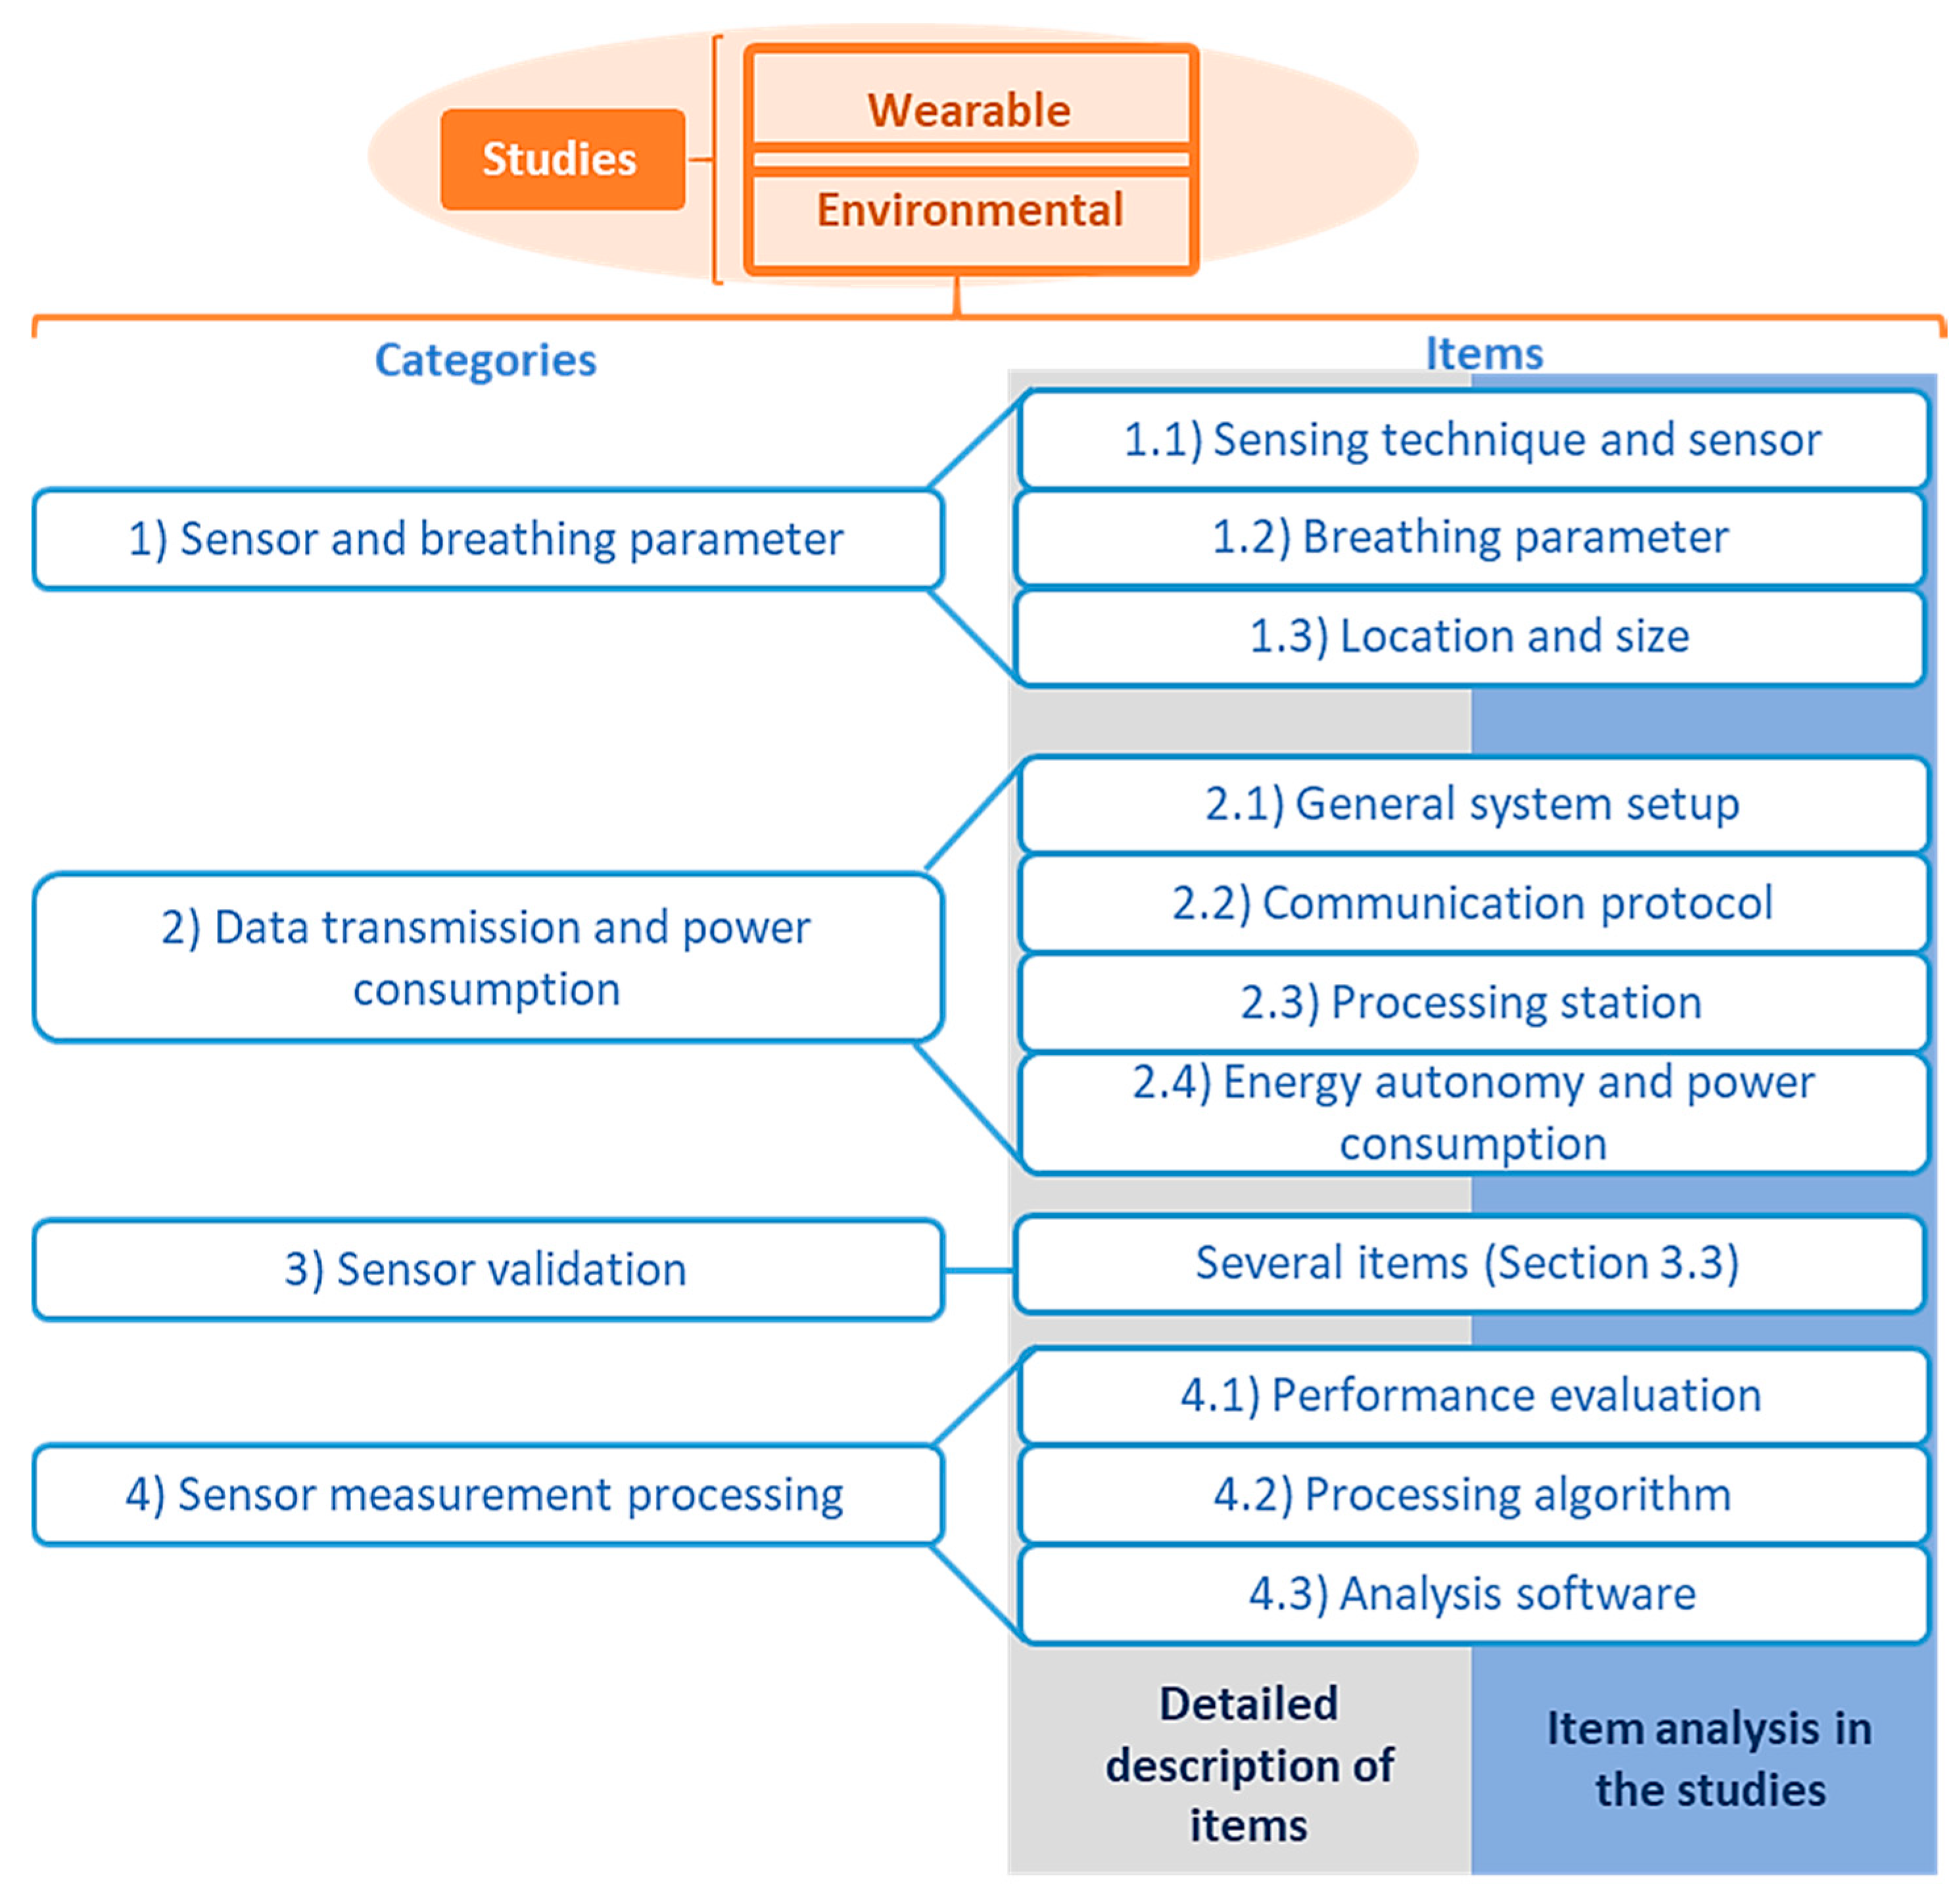
2.2. Organization of the Results
3. Results
3.1. Sensor and Breathing Parameter
3.1.1. Items of Analysis
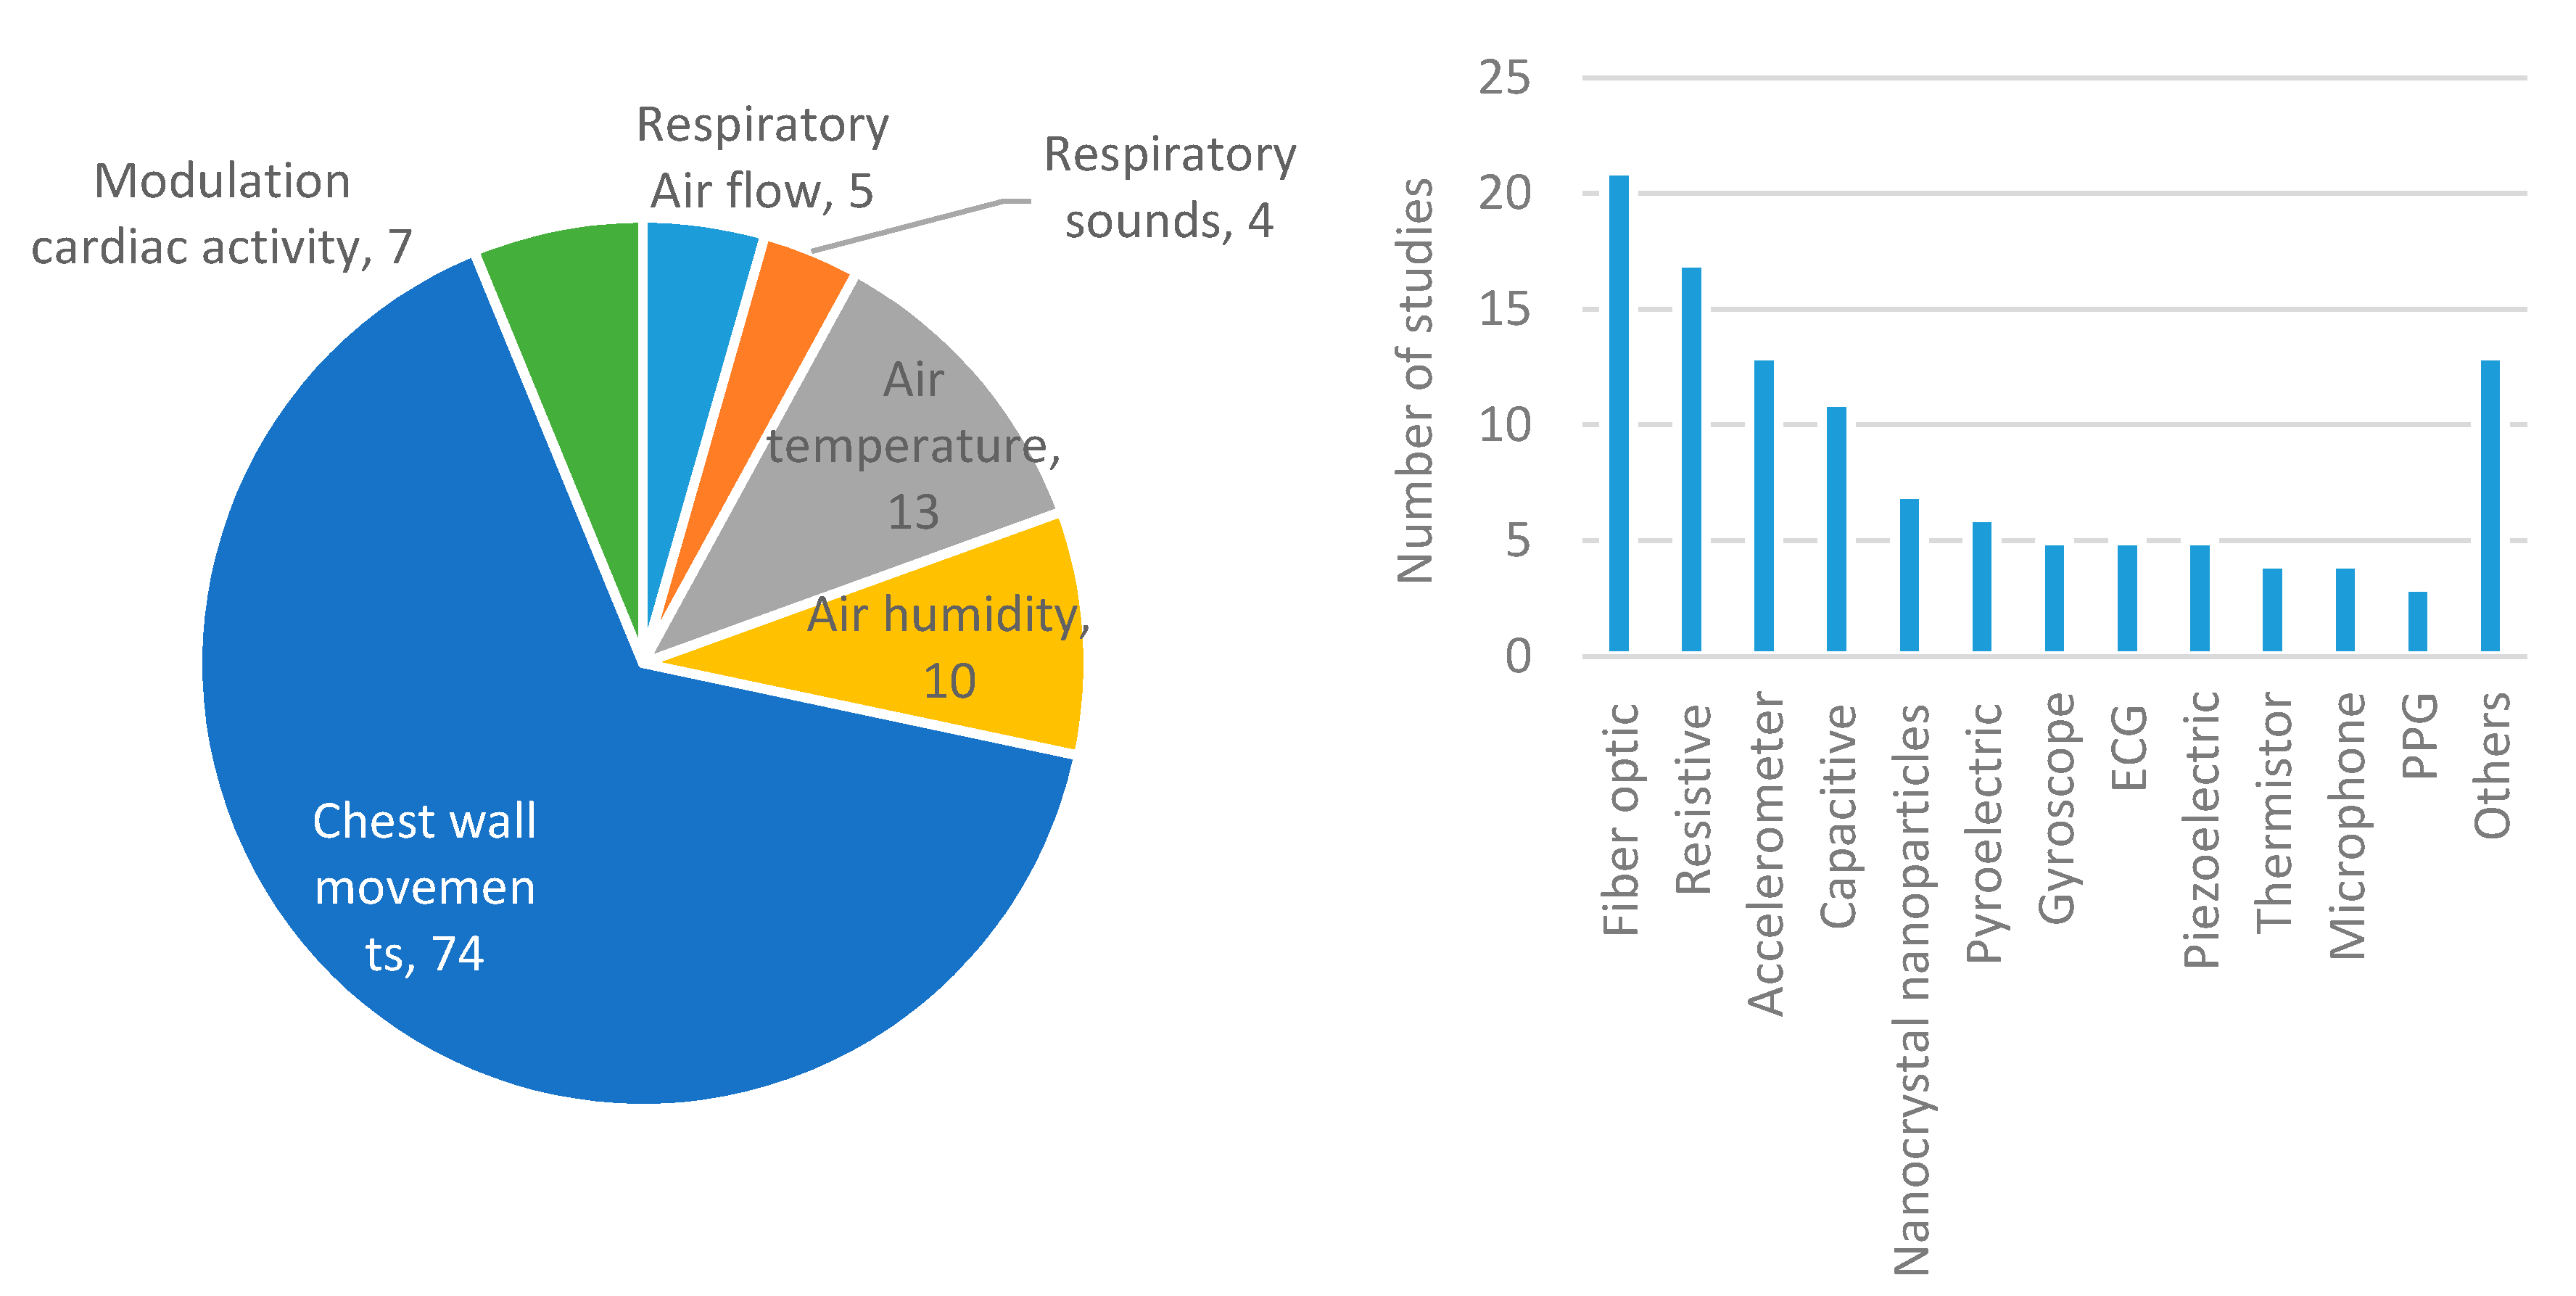
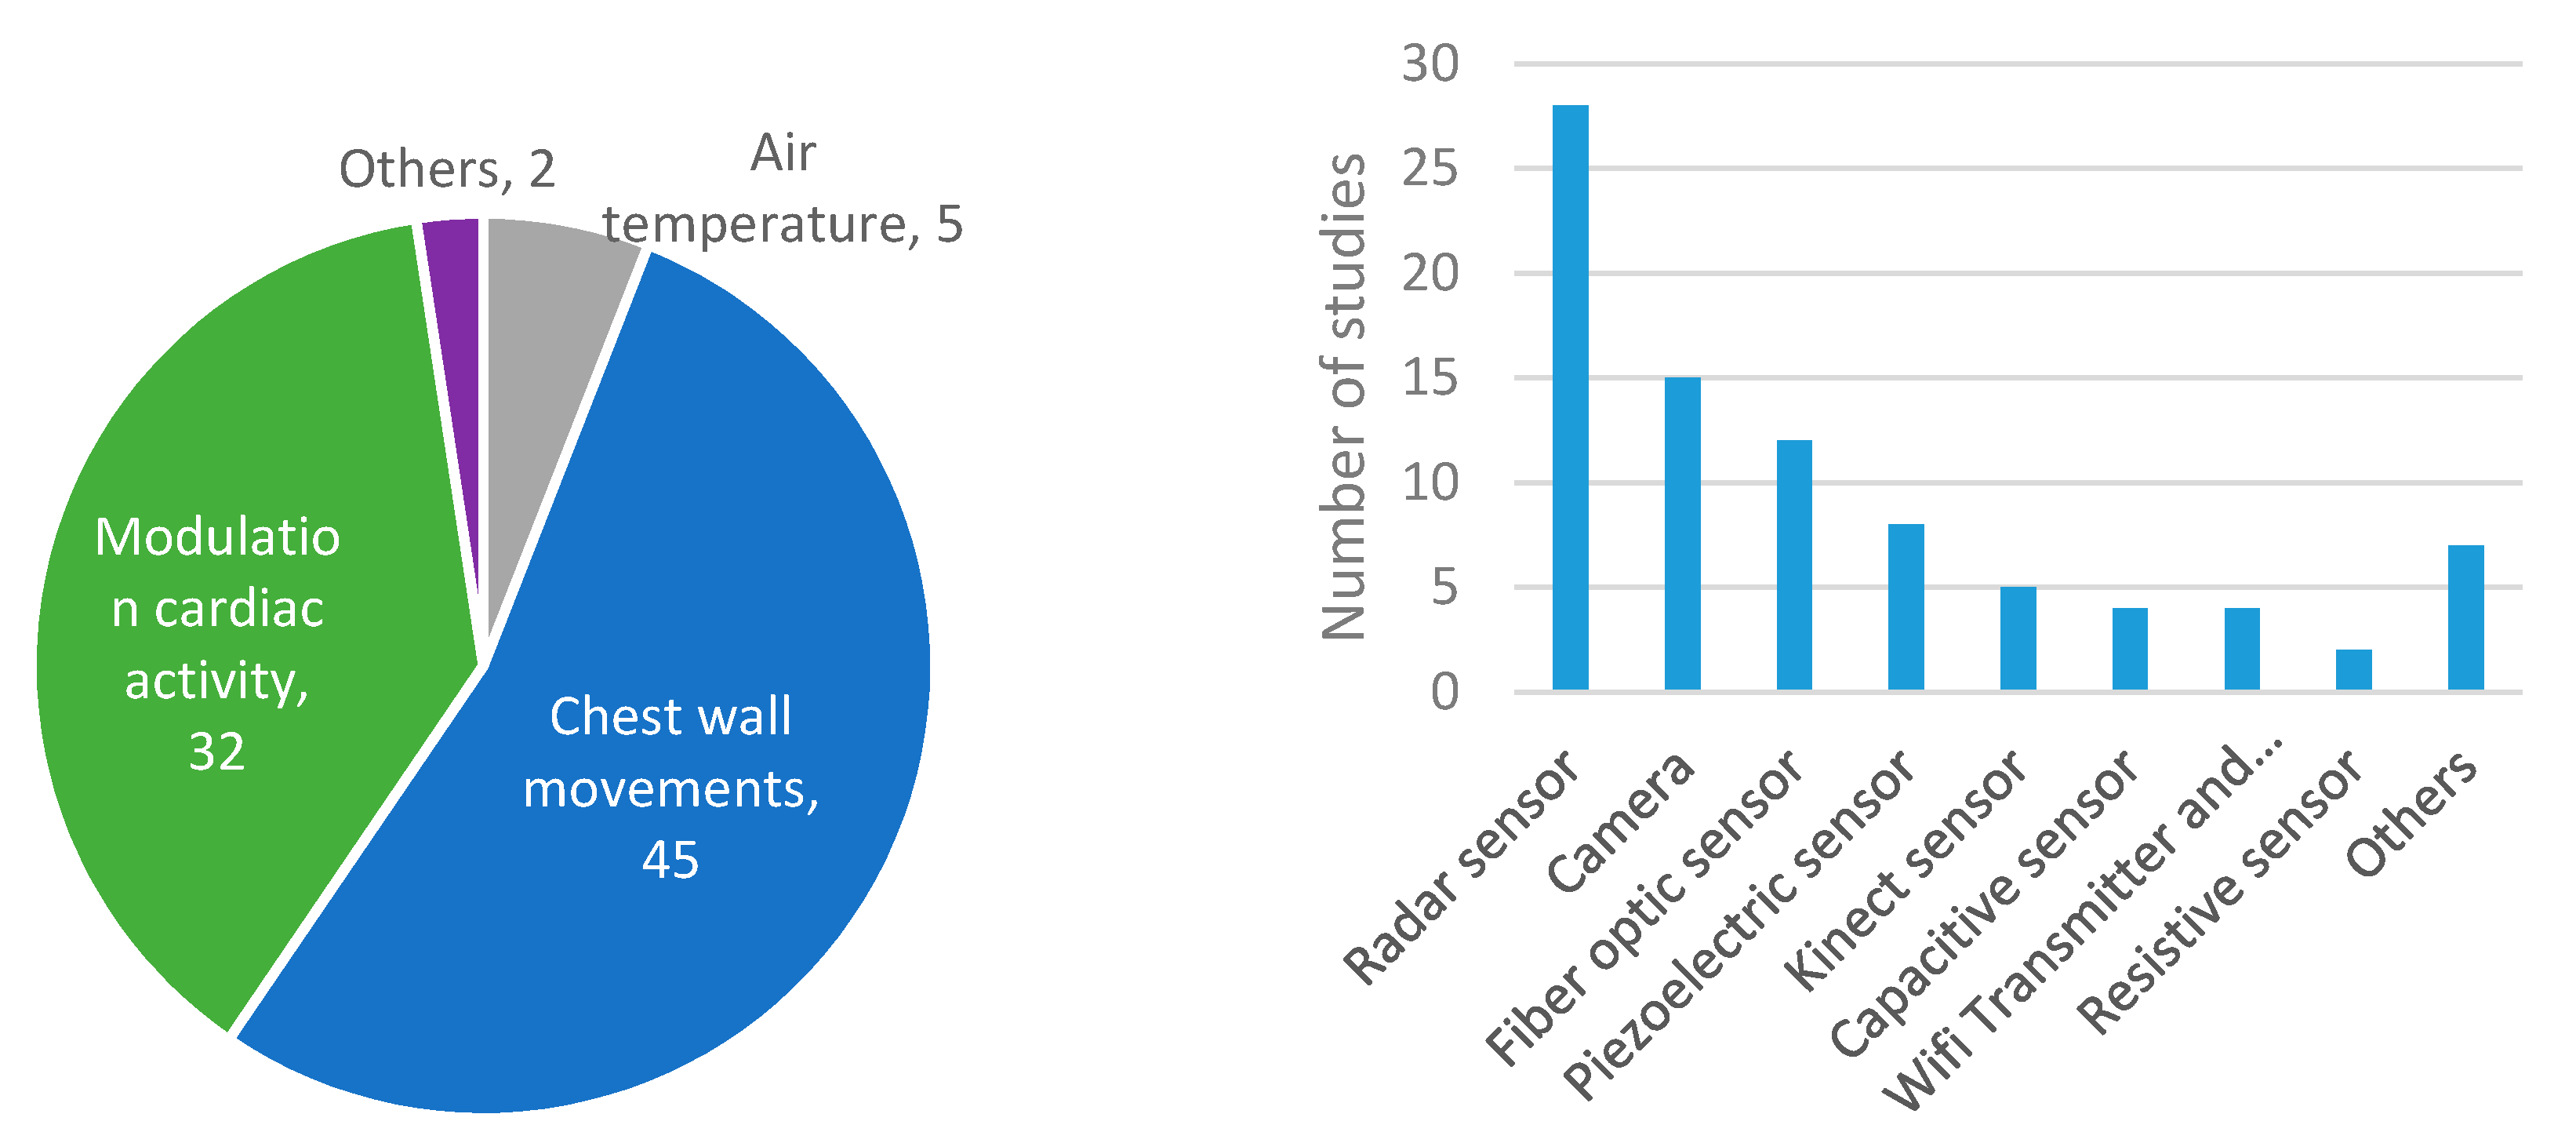
Sensing Technique and Sensor
- Technique based on measurements of respiratory airflow. Possible sensors are differential flowmeters, turbine flowmeters, hot wire anemometers, photoelectric sensors, and fiber optic sensors.
- Technique based on measurements of respiratory sounds. Possible sensors are microphones.
- Technique based on measurements of air temperature. Possible sensors are thermistors, thermocouples, pyroelectric sensors, fiber optic sensors, infrared sensors, and cameras.
- Technique based on measurements of air humidity. Possible sensors are capacitive sensors, resistive sensors, nanocrystal and nanoparticles sensors, impedance sensors, and fiber optic sensors.
- Technique based on measurements of chest wall movements. Three different types of measurement were identified in this technique:
- ○
- Strain measurements: Possible sensors are resistive sensors, capacitive sensors, inductive sensor, fiber optic sensors, piezoelectric sensors, pyroelectric sensors, and triboelectric nanogenerator.
- ○
- Impedance measurements: Possible sensors are transthoracic impedance sensors.
- ○
- Movement measurements: Possible sensors are accelerometers, gyroscopes and magnetometers, frequency shift sensors, DC (direct current) generators, ultrasonic proximity sensors, cameras, optical sensors, inductive sensors, and Kinect sensors.
- Technique based on measurements of modulation cardiac activity. Possible sensors are ECG sensors (for biopotential measurements), PPG sensors (for light intensity measurements), radar sensors, and Wi-Fi transmitters and receivers.
Breathing Parameters
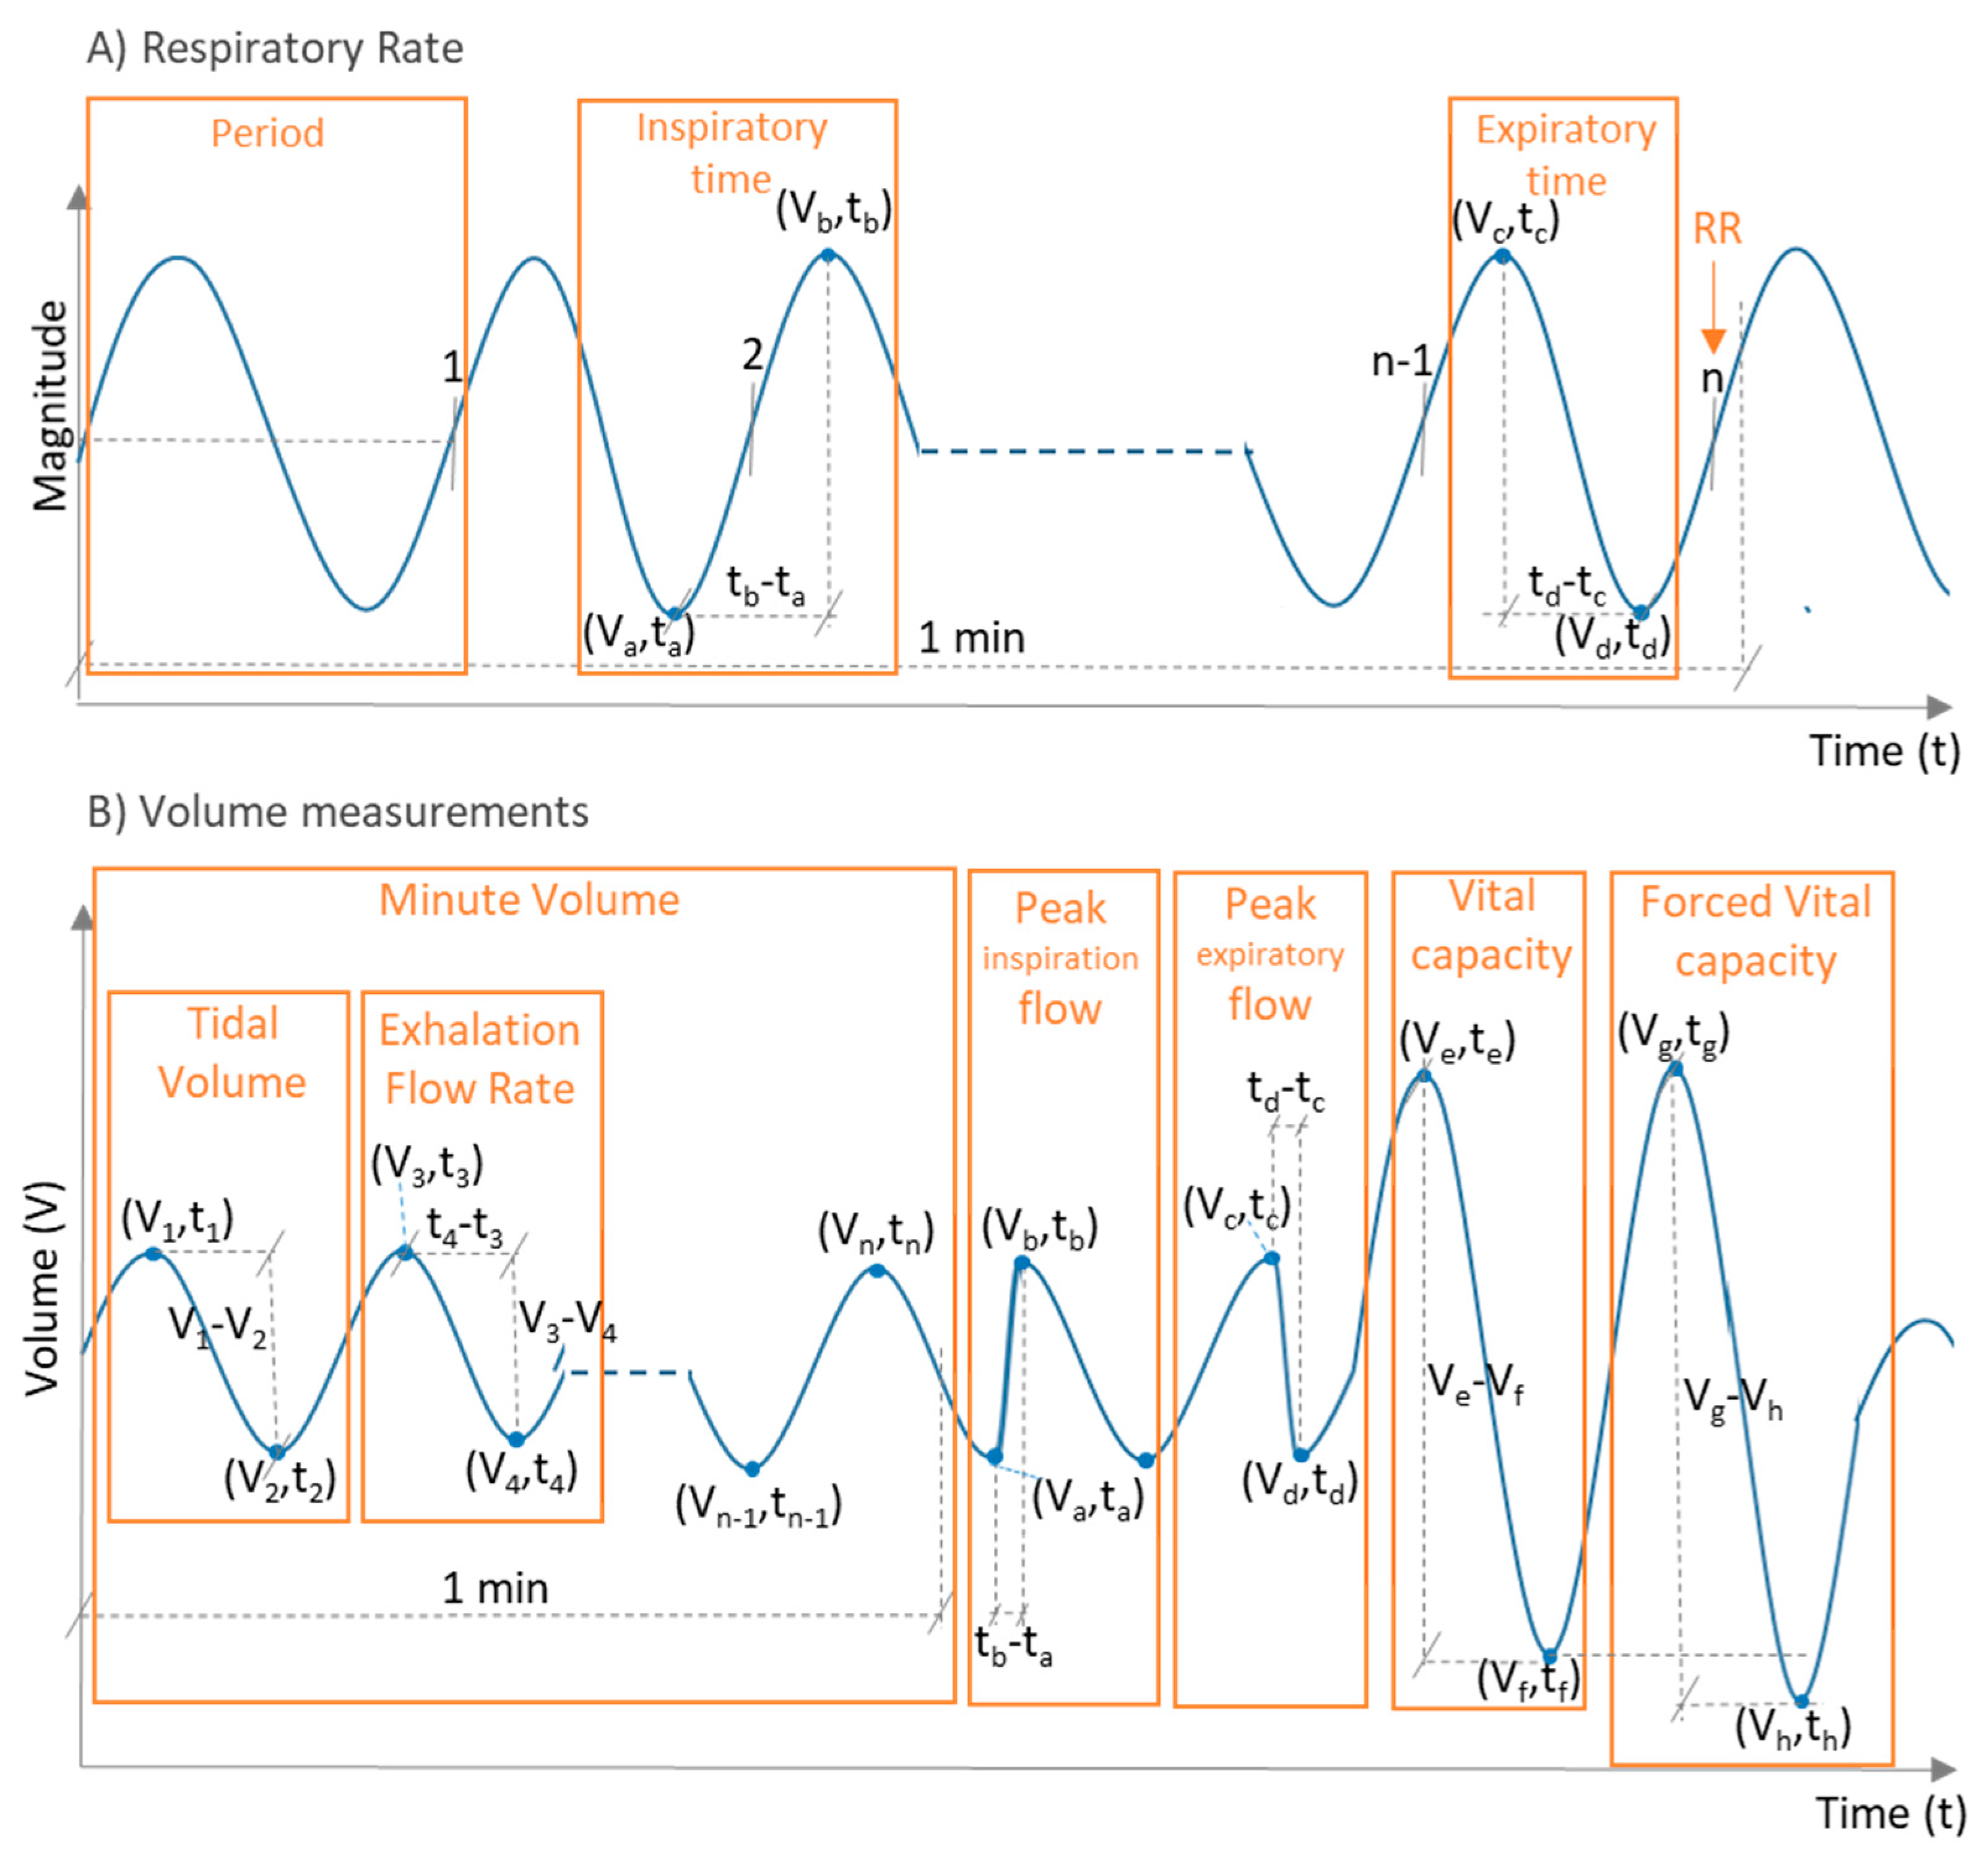
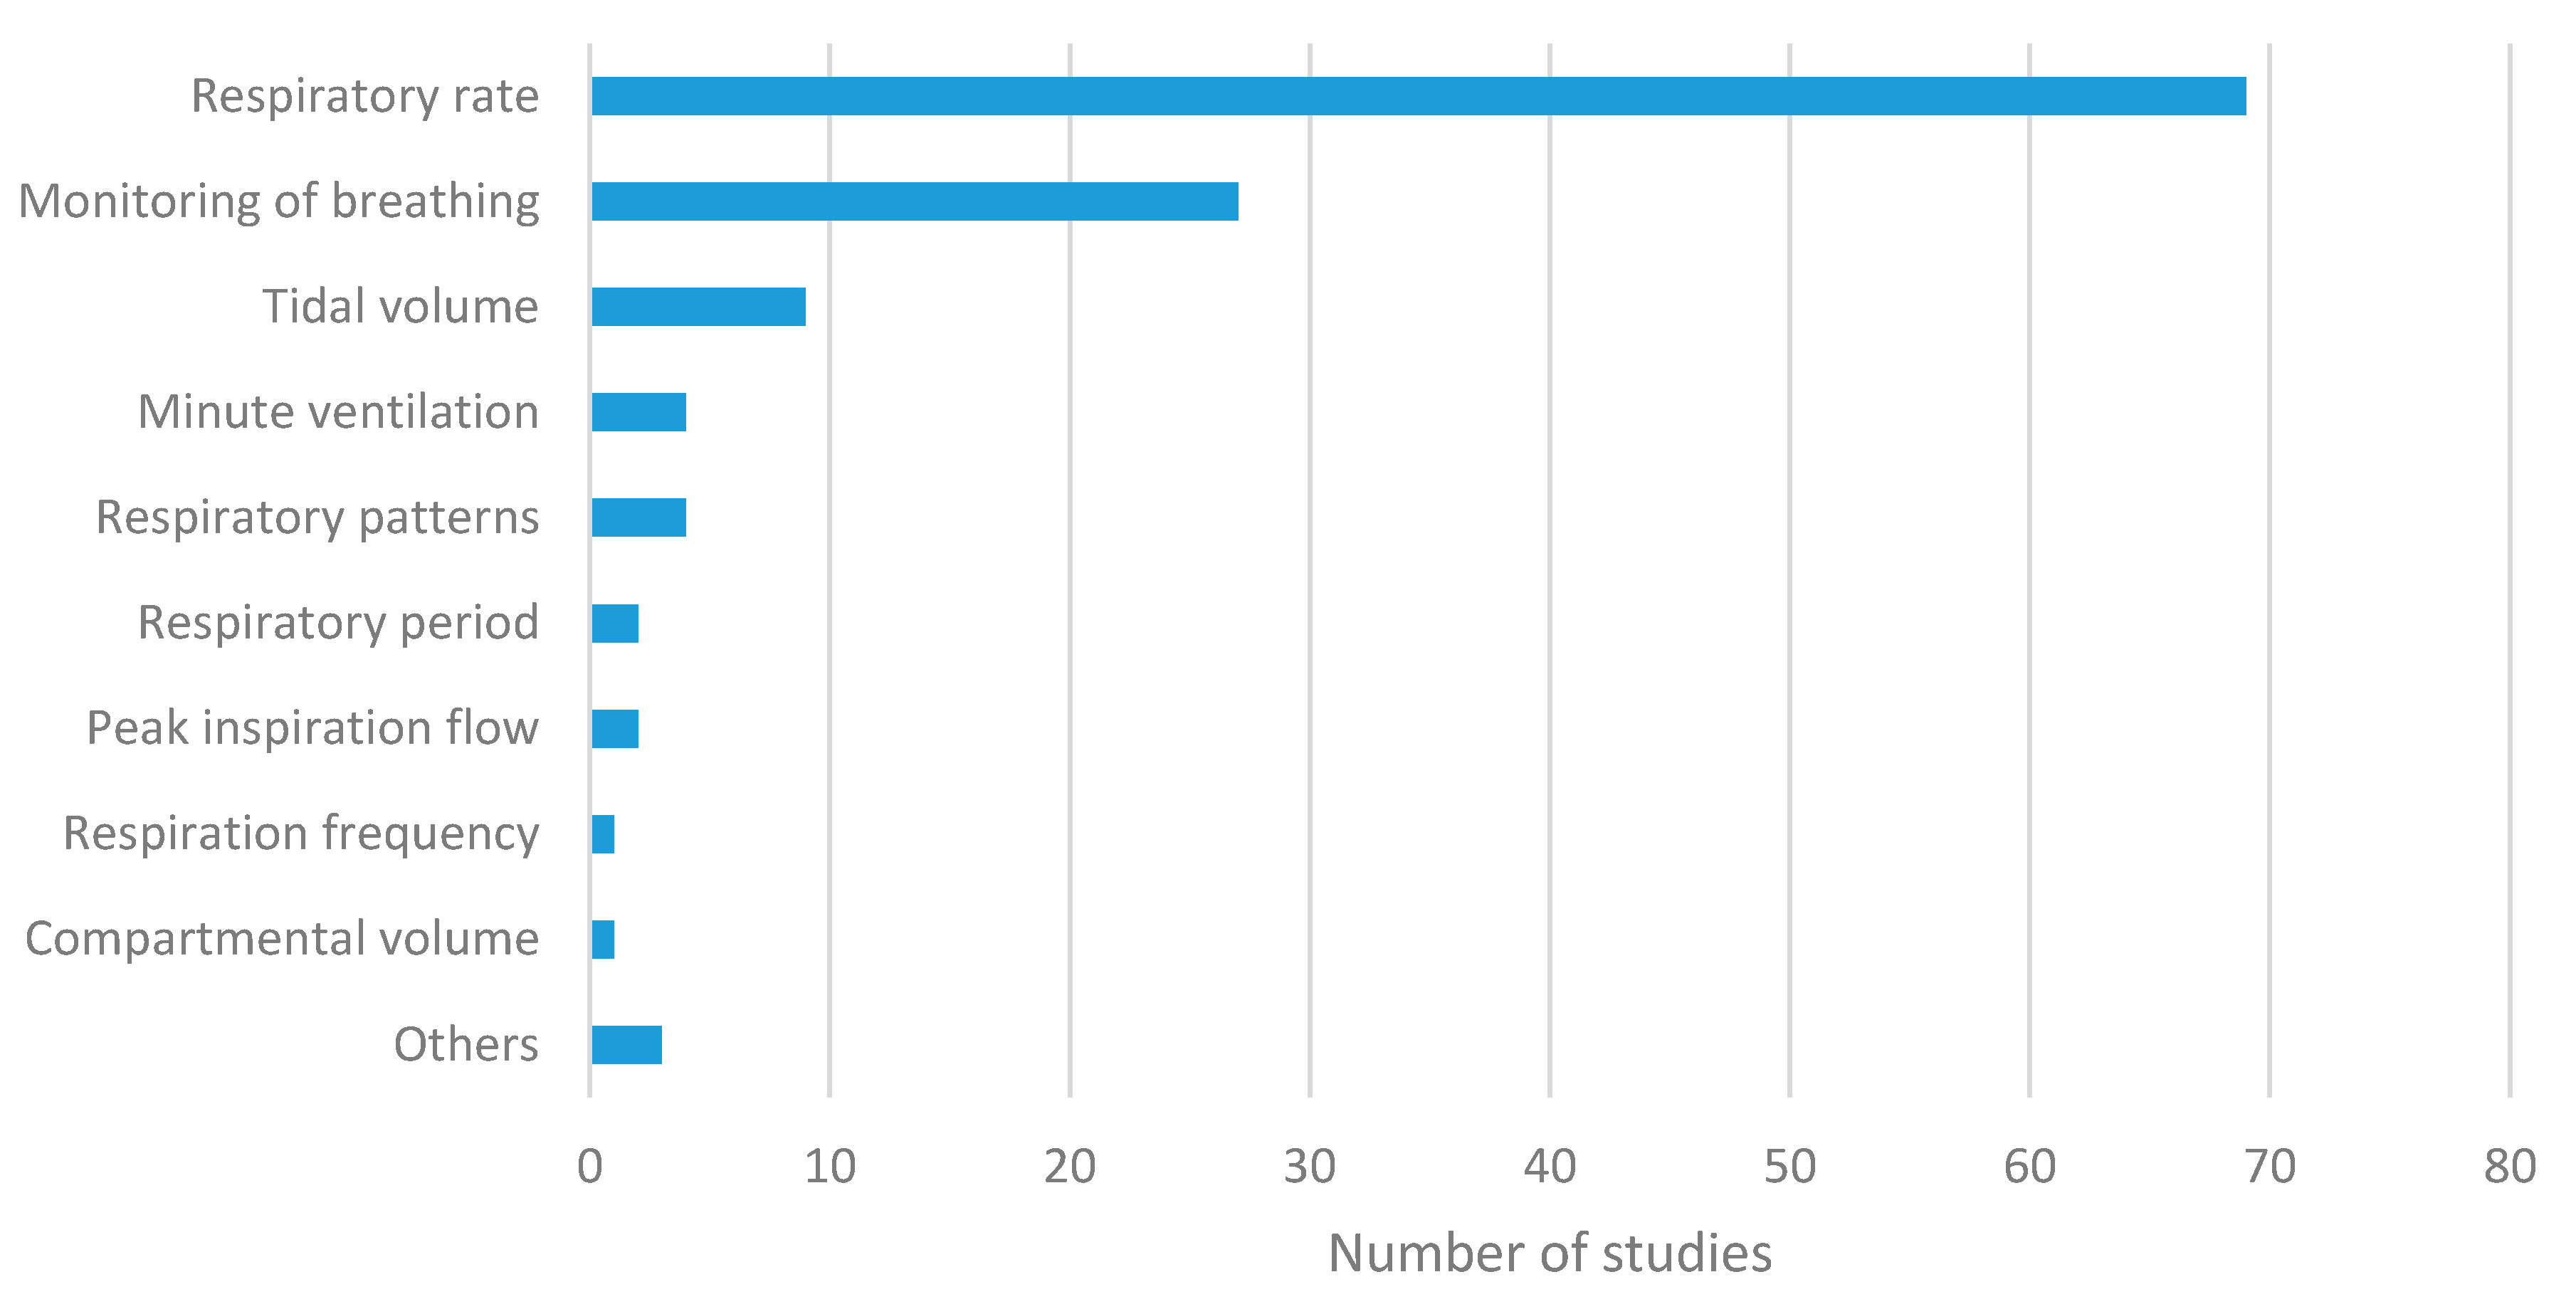
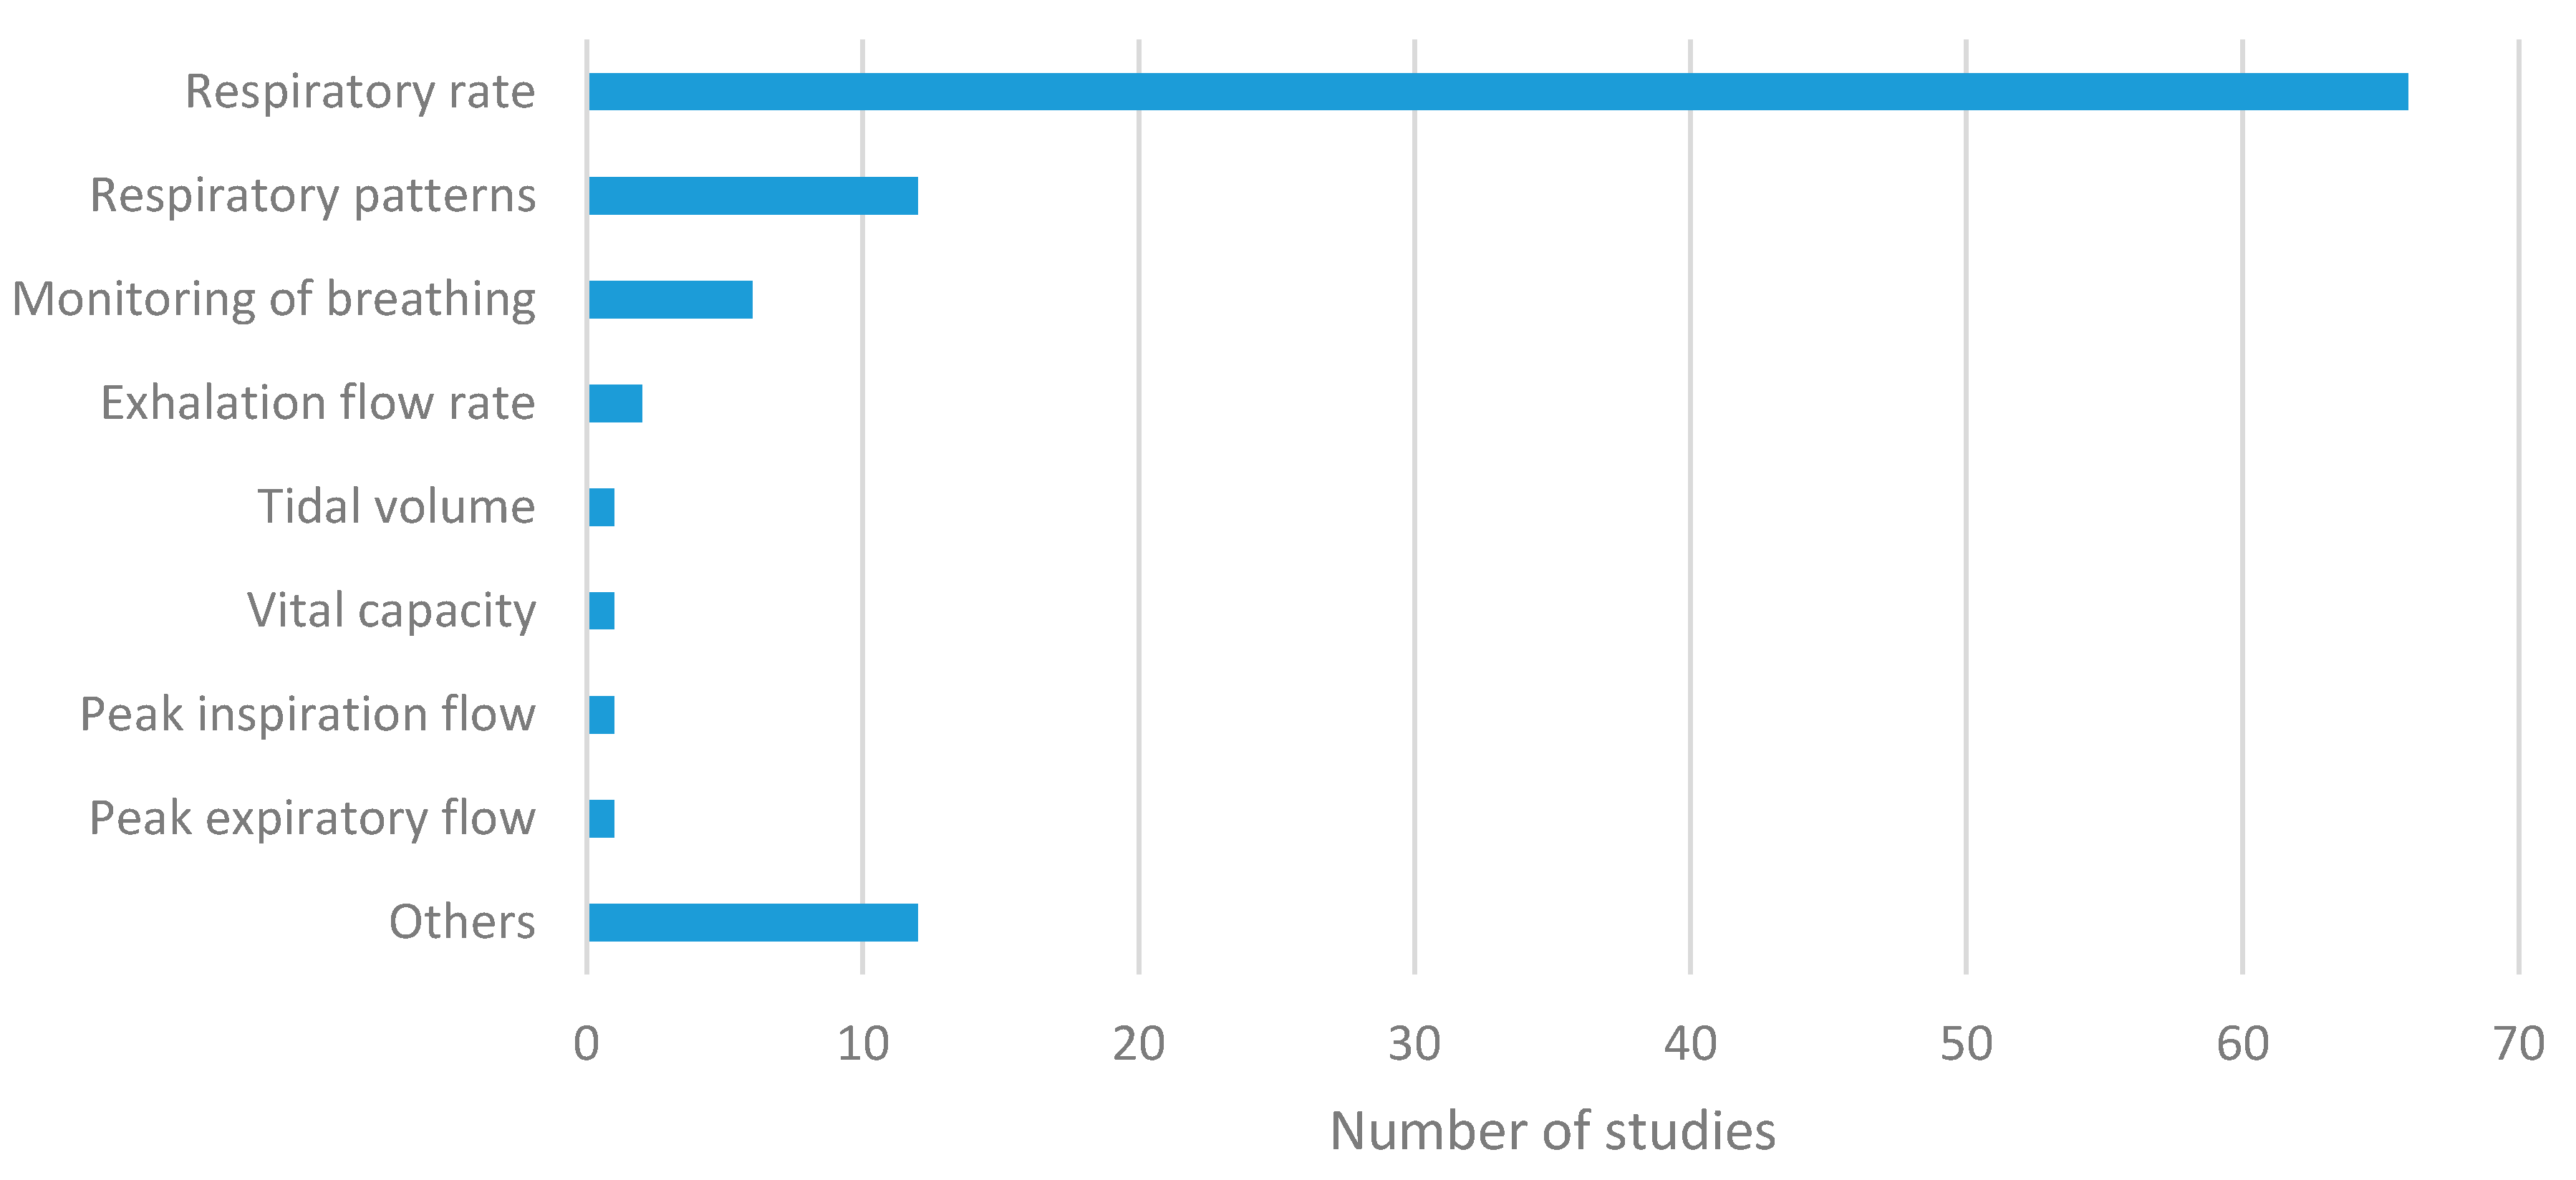
- Respiratory rate (RR): Number of breaths (inspiration and expiration cycles) performed by a subject in one minute (Figure 4). It is measured in breaths/min (bpm). Other metrics derived from the RR can also be calculated [10]:
- ○
- Breathing period: Time duration of a breathing cycle(s).
- ○
- Inspiratory time: Part of the breathing period that corresponds to inspiration (s). According to Figure 4A, it can be obtained as
- ○
- Expiratory time: Part of the breathing period that corresponds to expiration (s). According to Figure 4A, it can be obtained as
- Volume parameters: Metrics that provide volume information obtained from inhaled or exhaled air during breathing. Volume metrics comprise a set of sub-metrics related to the volume of air available in the lungs [47]. Some of the metrics that could be found in the breathing sensor studies were:
- ○
- Tidal volume (TV): It is the volume of air inhaled or exhaled during normal respiration (without forcing breathing). It is measured in liters (L). From the volume versus time signal represented in Figure 4B, the TV for a given breathing period could be calculated as , where Vn is the air volume associated with the n respiration peak or valley.
- ○
- Minute volume (MV): It is the volume of air inhaled or exhaled by a subject in one minute during normal breathing. It is measured in L/min. It can be roughly obtained from the TV and the RR as . From the representation of Figure 4B, the MV can be calculated as , where n is the number of peaks (or valleys) in the air volume curve that can be found in one minute of breathing.
- ○
- Peak inspiration flow (PIF): According to Warner and Patel [47], it is the maximum flow at which a given tidal volume breath can be delivered. It is measured in L/min. From the representation of Figure 4B, it can be obtained as , where (Va, ta) is the point associated with the valley in the time-volume curve before inspiration, and (Vb, tb) is the point related to the peak of inspiration at which the given tidal volume is delivered.
- ○
- Exhalation flow rate (EFR): Volume of air exhaled per time unit. It is expressed in L/s and can be calculated as [48]. From the representation of Figure 4B, it can be obtained as , where (V3, t3) is the point corresponding to a peak of the time-volume curve, and (V4, t4) is the next valley of the curve.
- ○
- There are other air volume metrics, such as peak expiratory flow (maximum flow at which a given tidal volume can be exhaled; it can be obtained as from Figure 4B), vital capacity (volume of air expired after deep inhalation; it can be obtained as from Figure 4B), or forced vital capacity (same as vital capacity but maximizing the expiratory effort; it can be obtained as from Figure 4B), among others [49]. They have barely been used in breathing sensor studies.
- ○
- Compartmental volume: Instead of considering air volume, this metric measures the change in volume of breathing-related body parts, like chest, thorax, or abdomen [49].
- Respiration patterns: There are studies in which the purpose is to identify patterns in the signals obtained from the recording of respiration instead of providing a particular breathing parameter. Common patterns identified are abnormal breathing [50,51,52], apnea episodes [50,51,53,54], Kussmaul’s respiration, Cheyne-Stokes breathing, Biot’s respiration, Cheyne-Stokes variant, or dysrhythmic breathing, among others [53]. There are also studies that identified the type of breathing (heavy or shallow breathing, mouth breathing, abdominal breathing, or chest breathing) [53].
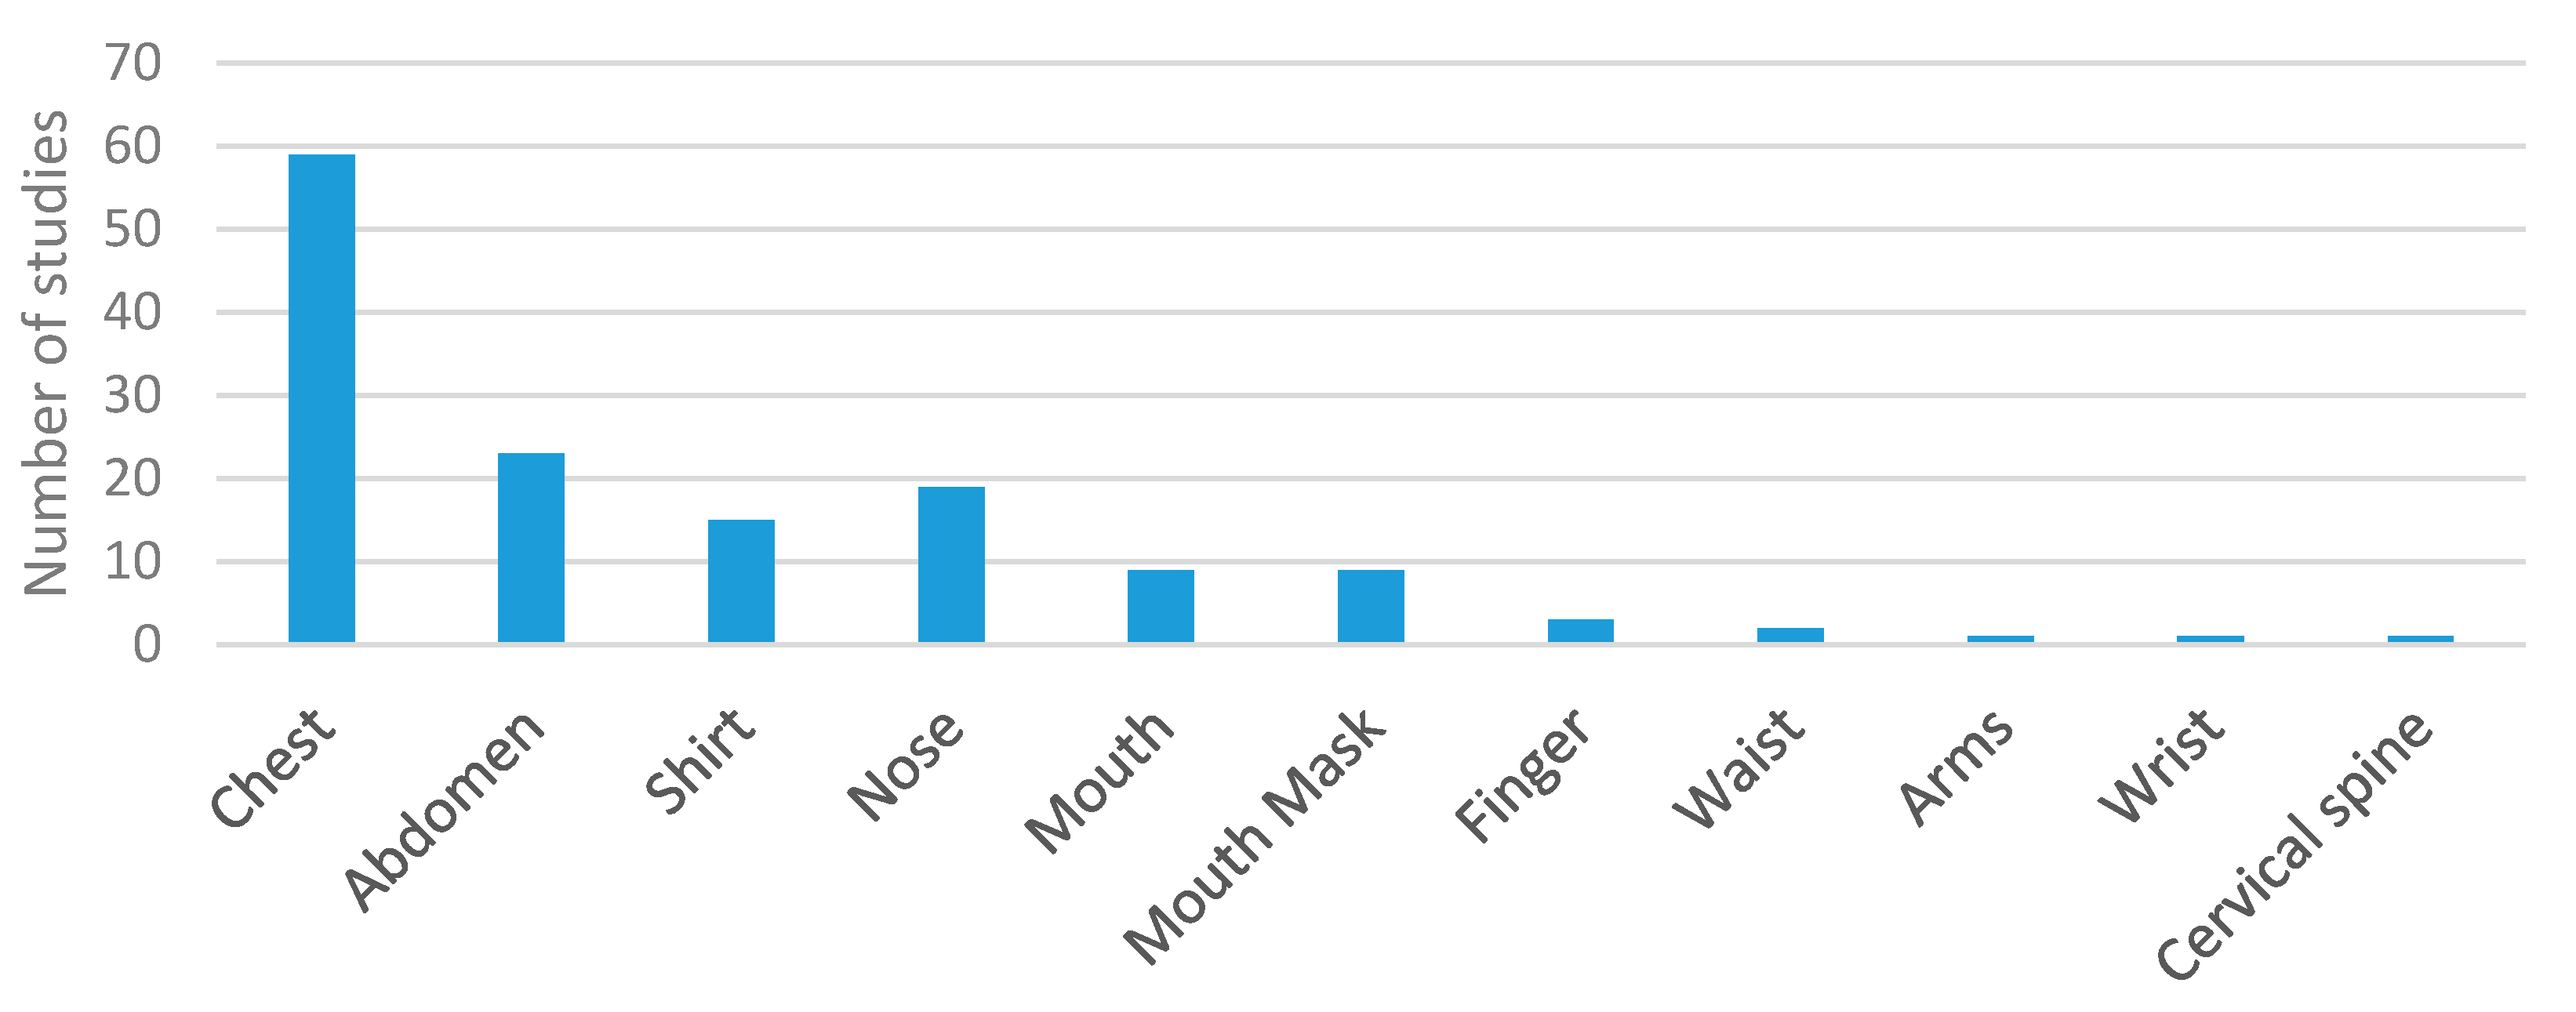
Sensor Location and Size
3.1.2. Results of the Analysis
3.2. Data Transmission and Power Consumption
3.2.1. Items of Analysis
General System Setup
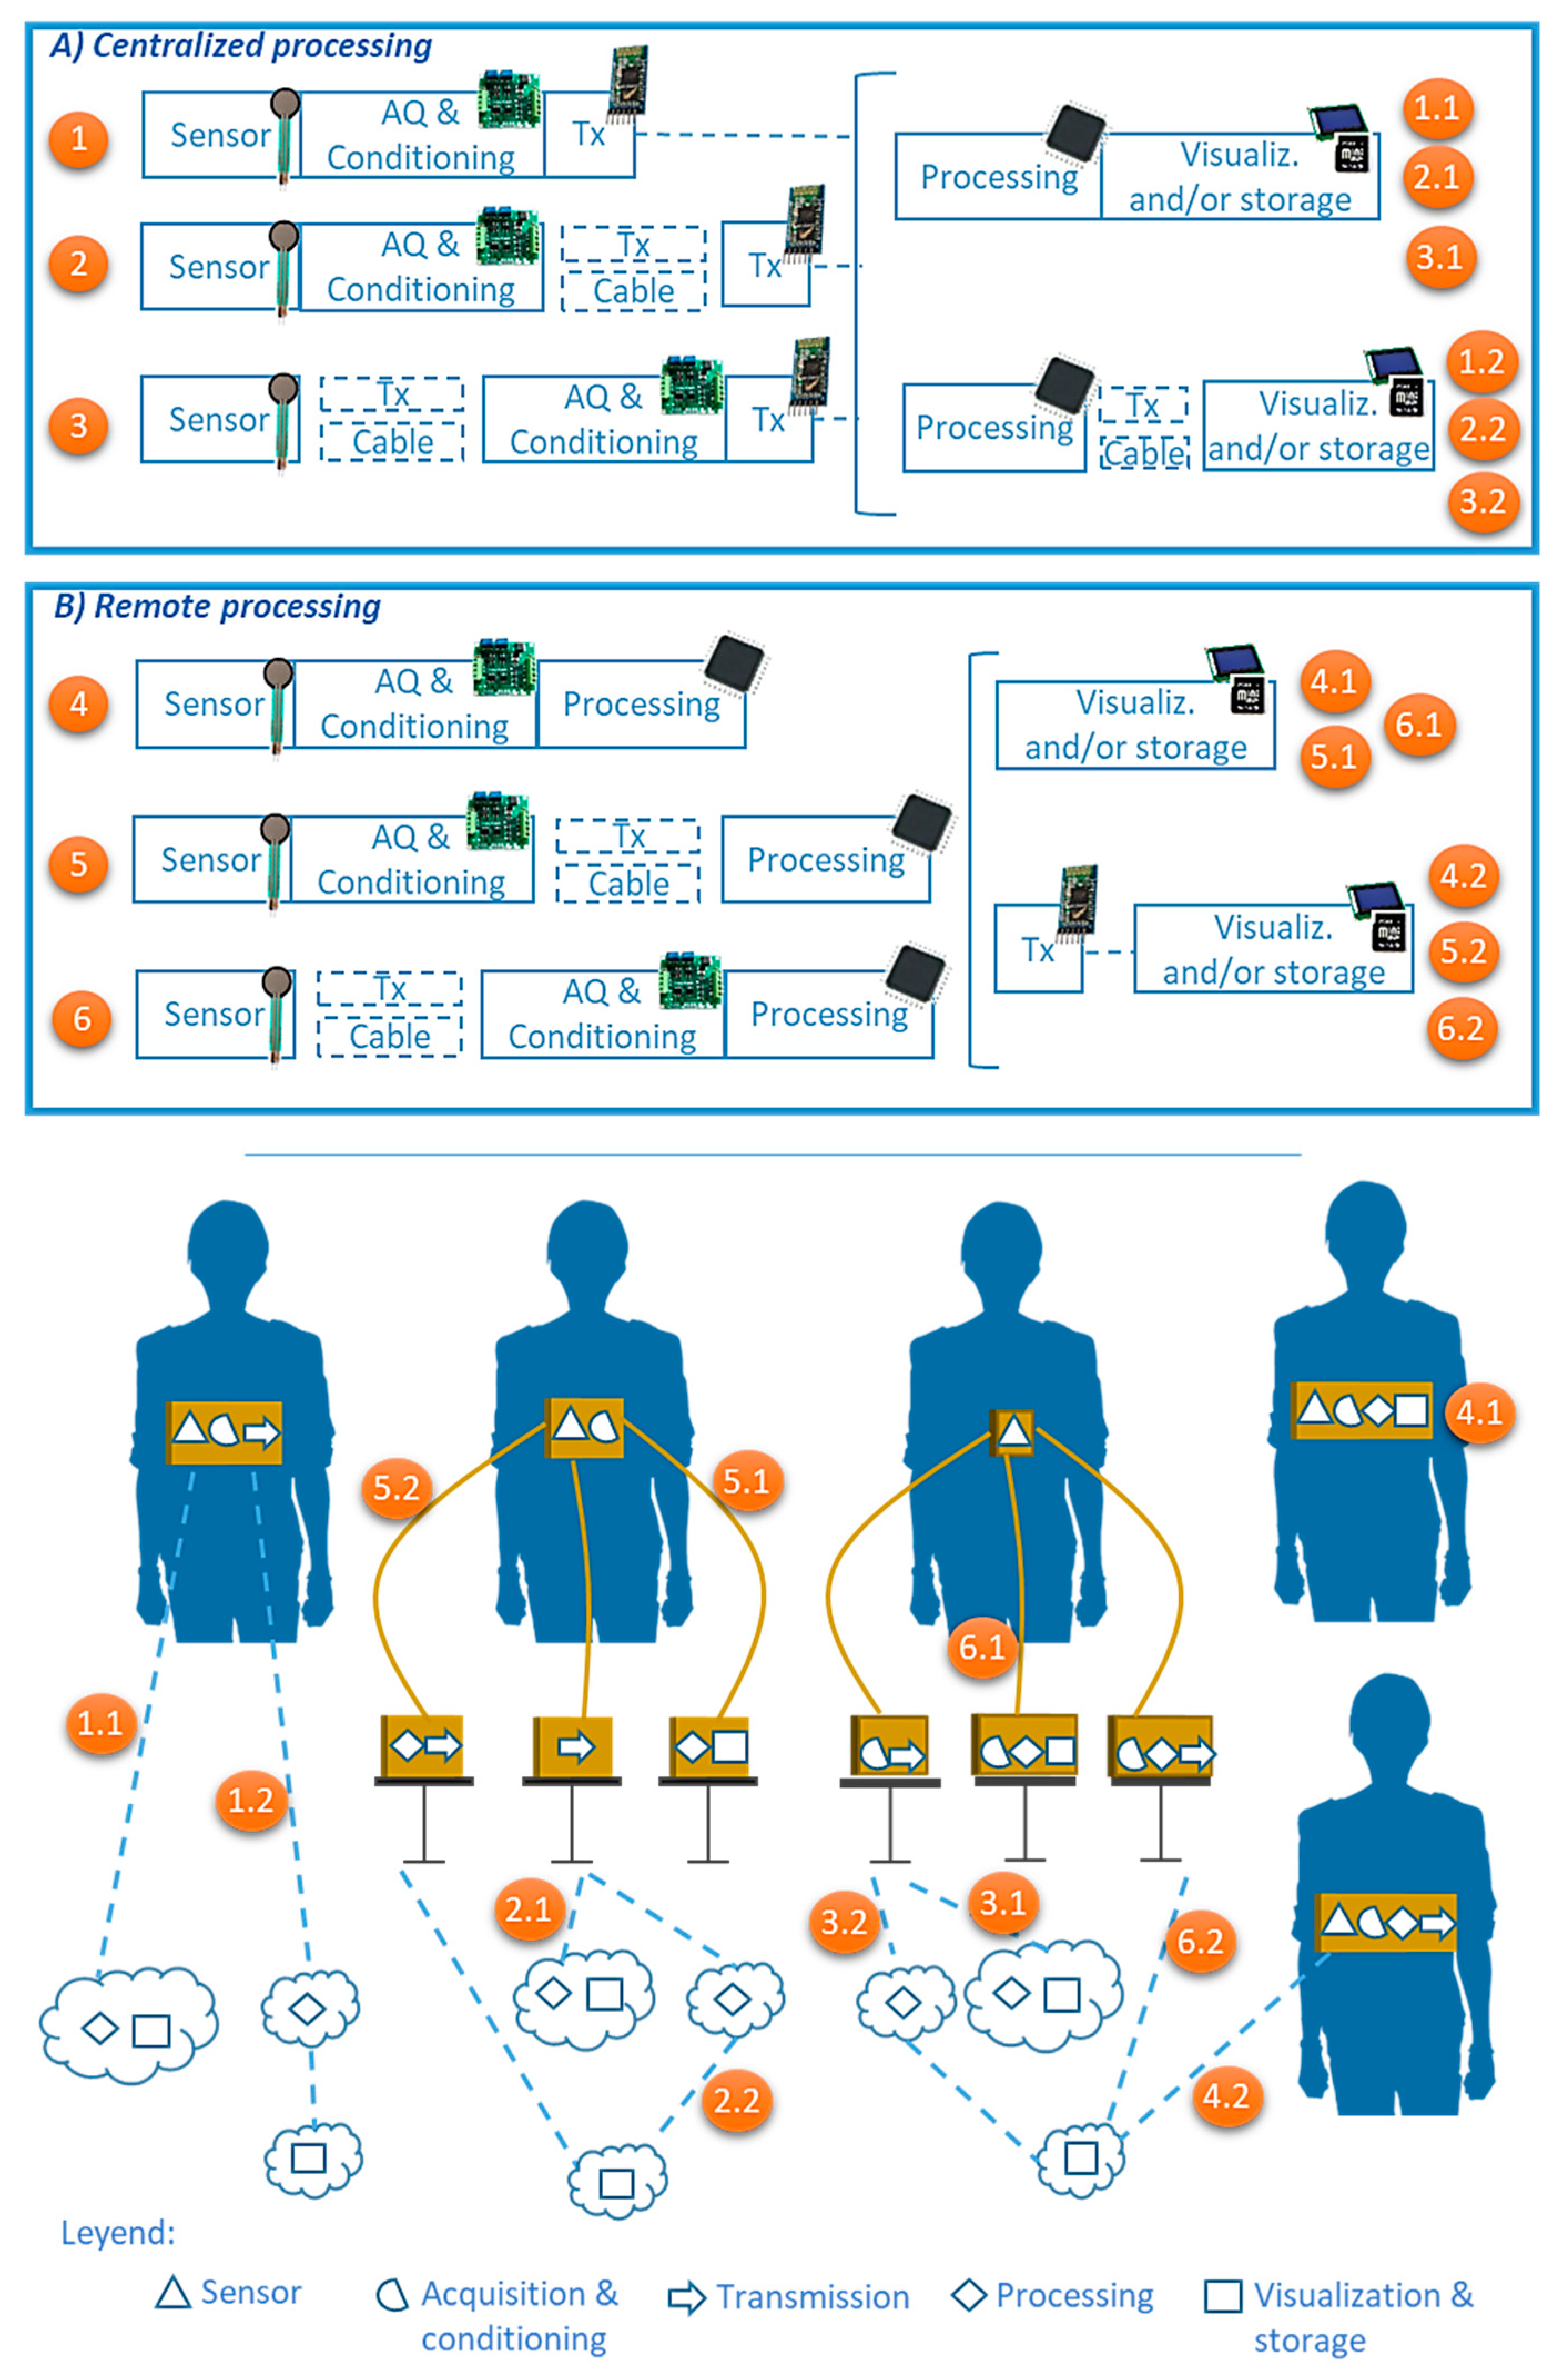
- Systems that perform centralized processing: Data processing is done in a centralized system that does not need to be close to the subject being monitored. The magnitude values registered by the sensors are acquired and conditioned [24] and then transmitted to a centralized processing unit. Three different approaches can be found depending on the specific point where the acquisition & conditioning module and transmission module are placed:
- ○
- The acquisition & conditioning and transmission modules are in the same package as the sensing unit (cases 1.x of Figure 11A, ).
- ○
- The acquisition & conditioning module is in the same package as the sensing unit, but the transmission module is placed externally (cases 2.x of Figure 11A, ).
- ○
- Both the acquisition & conditioning and transmission modules are not included in the same package as the sensing unit (cases 3.x of Figure 11A, ).
- Systems that perform remote processing: Processing of breathing signals to determine the respiratory parameters of interest is performed near the subject whose breathing is being monitored. Three different setups are possible depending on whether the acquisition & conditioning module and the processing module are included in the same package as the sensing unit:
- ○
- The acquisition & conditioning circuits, the microcontroller for the processing and the data transmission module are placed in the same package as the sensing unit (cases 4.x of Figure 11B, ).
- ○
- The acquisition & conditioning circuits are placed in the same package as the sensing unit. However, the microcontroller in charge of the processing and the data transmission module are placed in an external package, which is not compactly integrated with the sensing module (cases 5.x of Figure 11B, ).
- ○
- The acquisition & conditioning circuits, the microprocessor and the data transmission module are placed in a different package than the sensing unit (cases 6.x of Figure 11B, ).
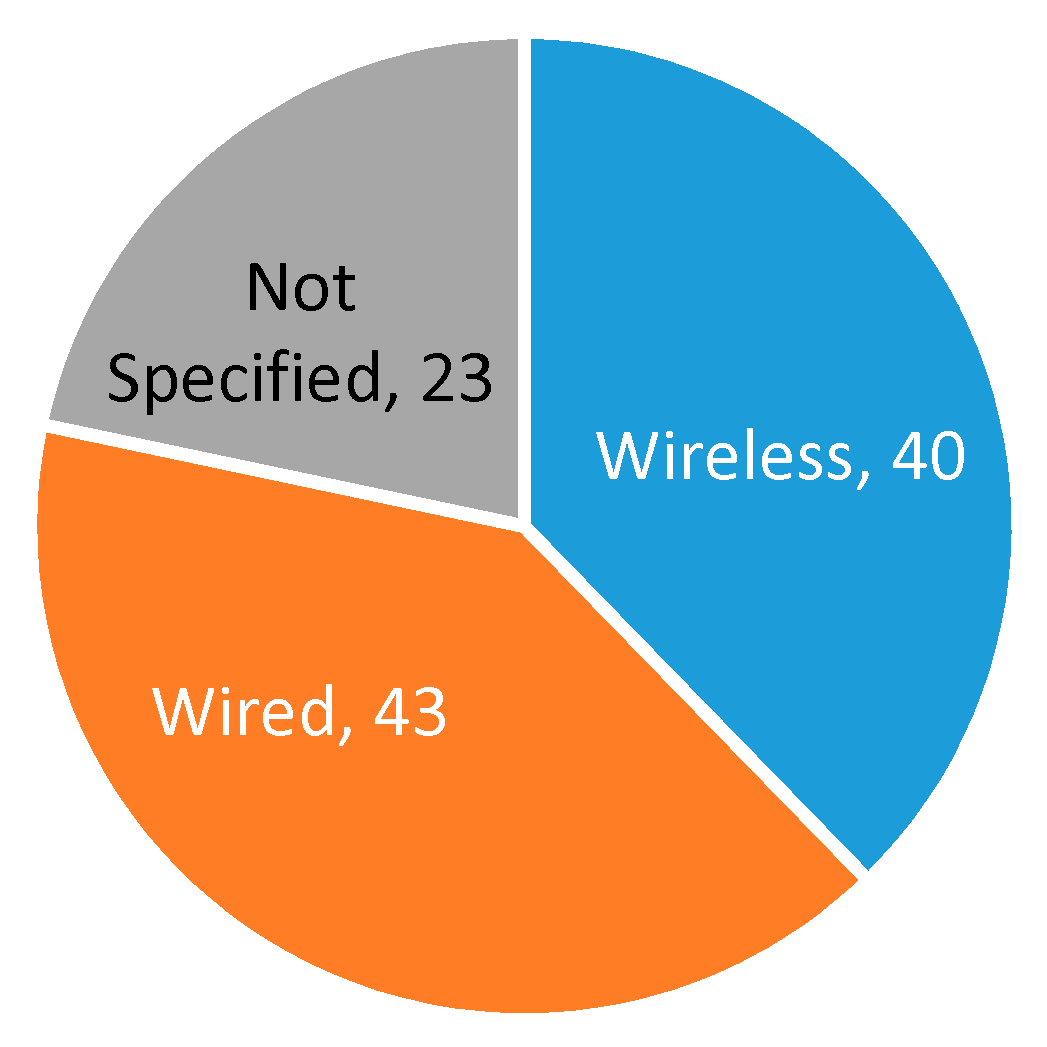
Communication Protocol
- Wired transmission: All system elements (sensing, acquisition, conditioning, transmission, processing, and visualization) are physically connected. The USB (universal serial bus) protocol is the most common way of transmitting the acquired respiratory signals.
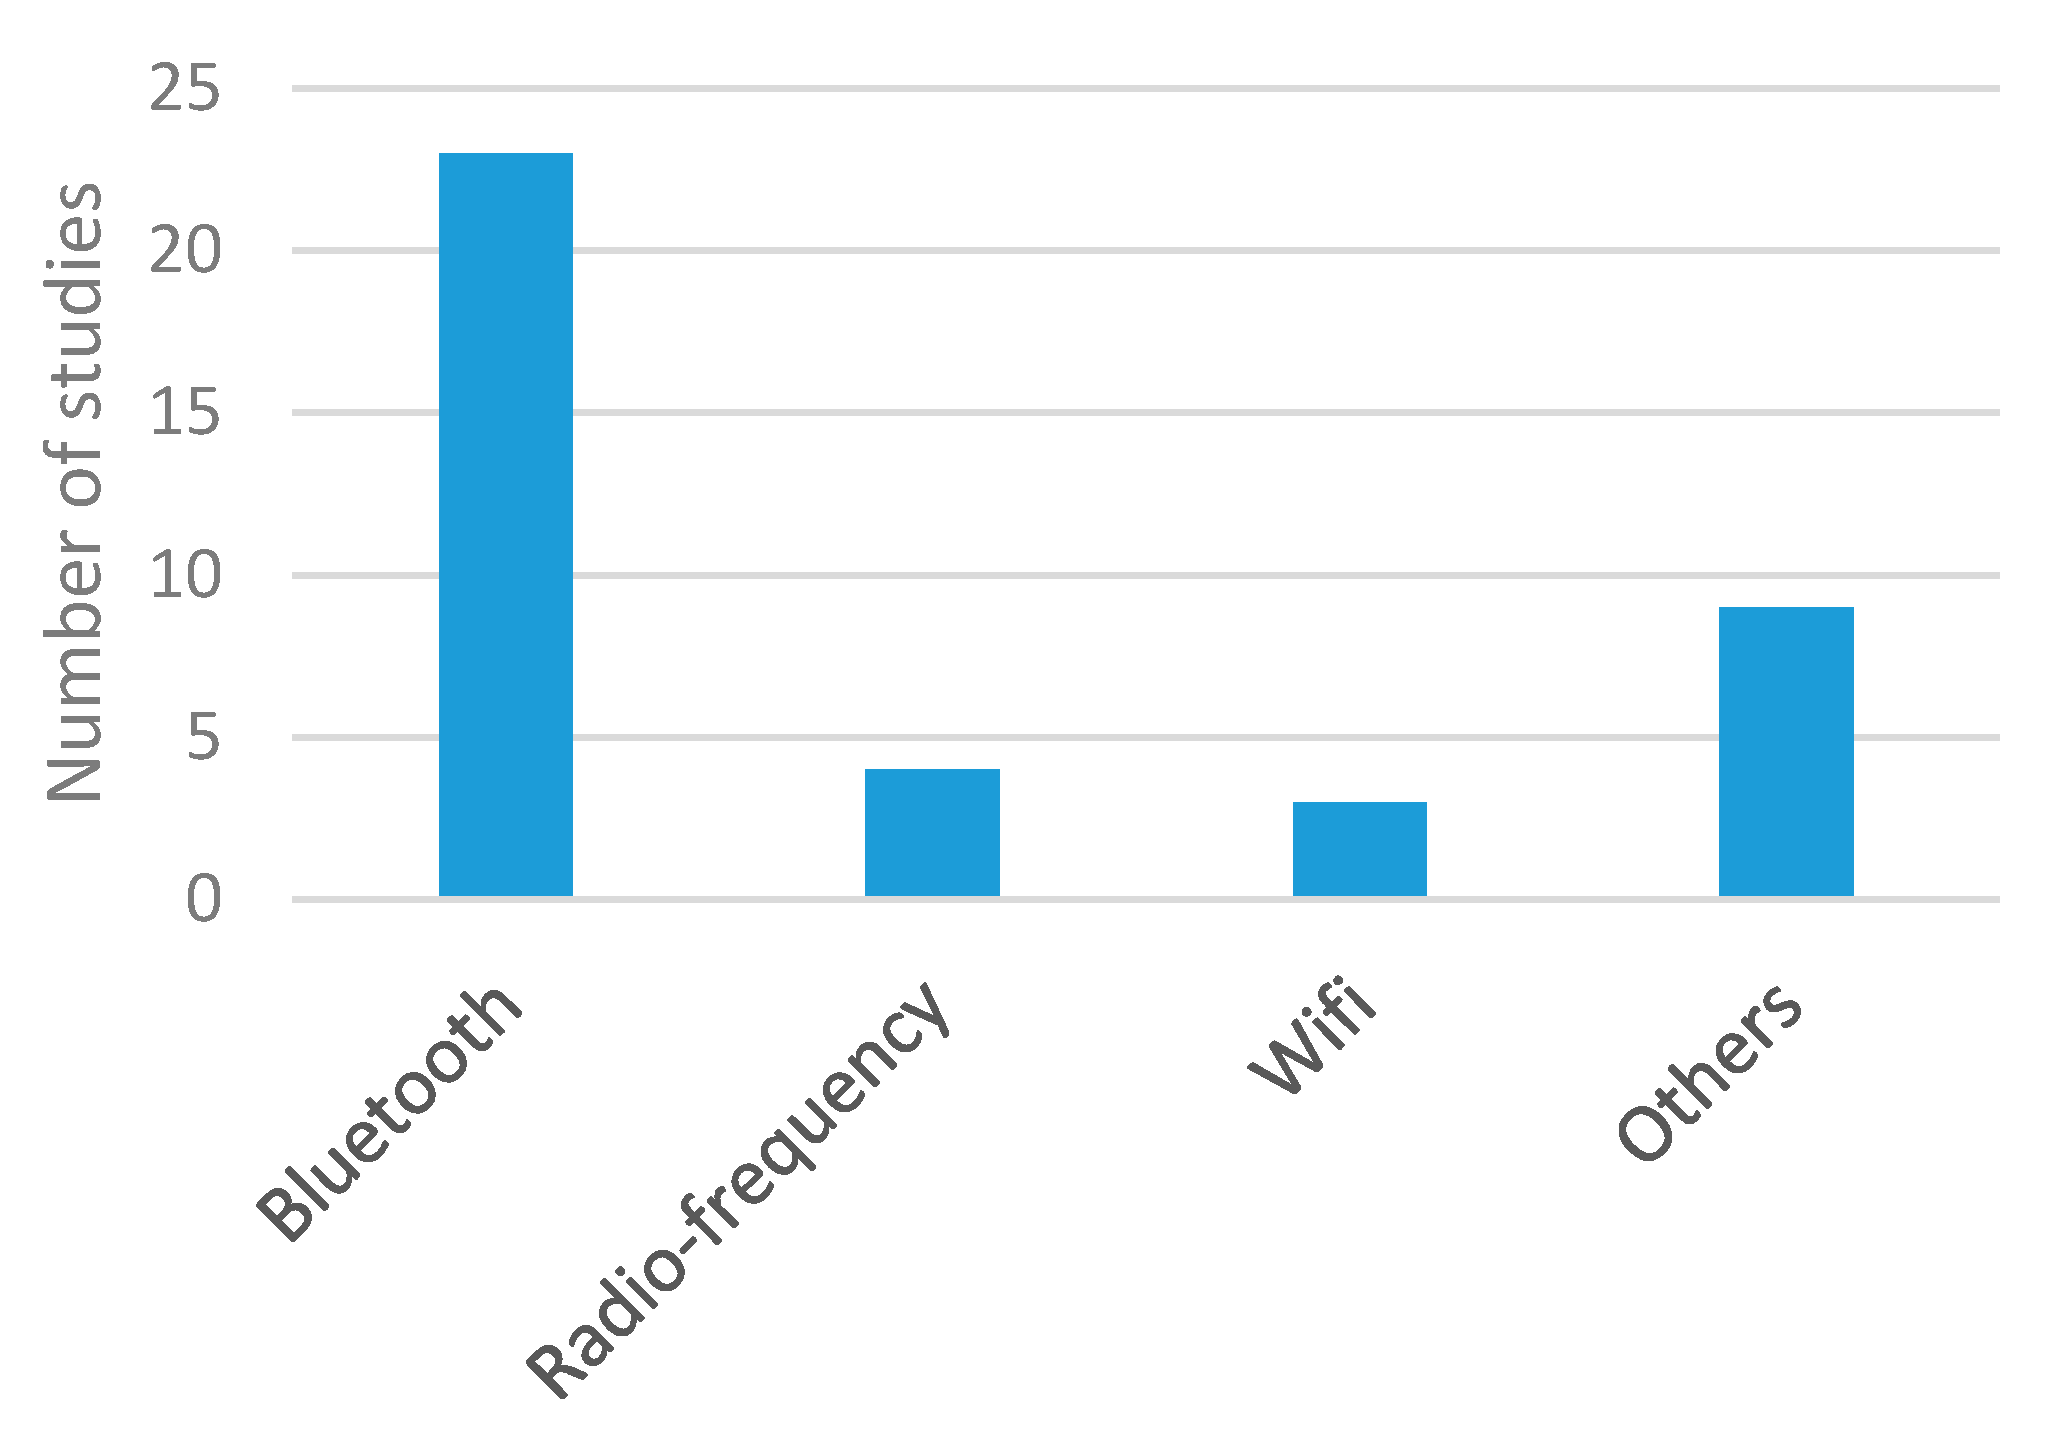
- Wireless transmission: Subjects wear the sensing system without cable connections to other elements of the system. The transmission and reception of measurements is carried out through a wireless transmission technology. Therefore, the usability of the system increases [55]. Different transmission technologies can be found in existing studies [237]:
- ○
- Bluetooth: It is a standard and communication protocol for personal area networks. It is suitable for applications that require continuous data transmission with a medium data transmission rate (up to 1 Mbps). It uses a radio communication system, which means that the transmitting and receiving devices do not need to be in line of sight. It operates in the 2.4–2.485 GHz band with a low transmission distance (1 to 100 m, typically). There are five Bluetooth classes (1, 1.5, 2, 3, and 4). Most Bluetooth-based respiration monitoring systems use class 2 or higher. This means that the transmission distance is short (less than 10 m, in general), but the power consumption is also moderate [237].
- ○
- Wi-Fi: This technology is generally used for local area networks instead of personal area networks, like Bluetooth. It has much higher data transmission rates and power consumption is also higher. At a typical 2.4 GHz operating frequency, it can consume a maximum of 100 mW. Wi-Fi operating band is in the 2.4–5 GHz range. In general, the transmission range is between 50 m and 100 m, although it can be greatly extended in some conditions. This technology is suitable for applications where constant high-speed data transmission is required, the transmission distance is relatively large, and power consumption is not an issue [238].
- ○
- GSM/GPRS: Global System for Mobile Communications (GSM) is a standard for mobile communication that belongs to the second-generation (2G) of digital cellular networks. It requires base stations to which the mobile devices connect. The coverage range of base stations varies from a few meters to dozen of kilometers. Within this 2G technology, it is also possible to find the General Packet Radio Service (GPRS), which is data-oriented. The transmission rate of GPRS is low (around 120 kbps, although this rate is usually lower in real conditions) with a limitation of 2 W of power consumption. The frequency band of this technology is in the range of 850–1900 MHz [239].
- ○
- Zigbee: It is a specification of several high-level communication protocols. Zigbee is used for the creation of personal area networks that do not need high data transmission rates. ZigBee can operate in the industrial, medical and scientific radio bands, which may vary among countries. This is the reason why it generally works in the 2.4 GHz band that is available worldwide. If the system operates in the 2.4 GHz band, its data transmission rate is 250 kbps. Devices using this technology are generally inexpensive since the required microprocessor is simple due to the low transmission rate of Zigbee. Power consumption is low since nodes can be asleep until some information is received. It is useful for applications that do not require constant transmission. The range of transmission distance is similar to that of Bluetooth technology [237].
- ○
- Radio frequency: These modules are suitable for applications that do not need a high speed of data transmission. Radio frequency works in the Ultra High Frequency band (433 MHz) and requires a receiver-transmitter pair. It is low power and cheap, with a small module size. Communication range is from 20 to 200 m. This range depends on the input voltage of the module: at higher voltages, greater communication distance is reached. Working voltage for this technology ranges from 3.5 to 12 V. Radio broadcasting is performed through amplitude modulation. Radio frequency requires both receivers and transmitters to incorporate a microcontroller module. Typical power consumption is up to 10 mW.
Processing Station
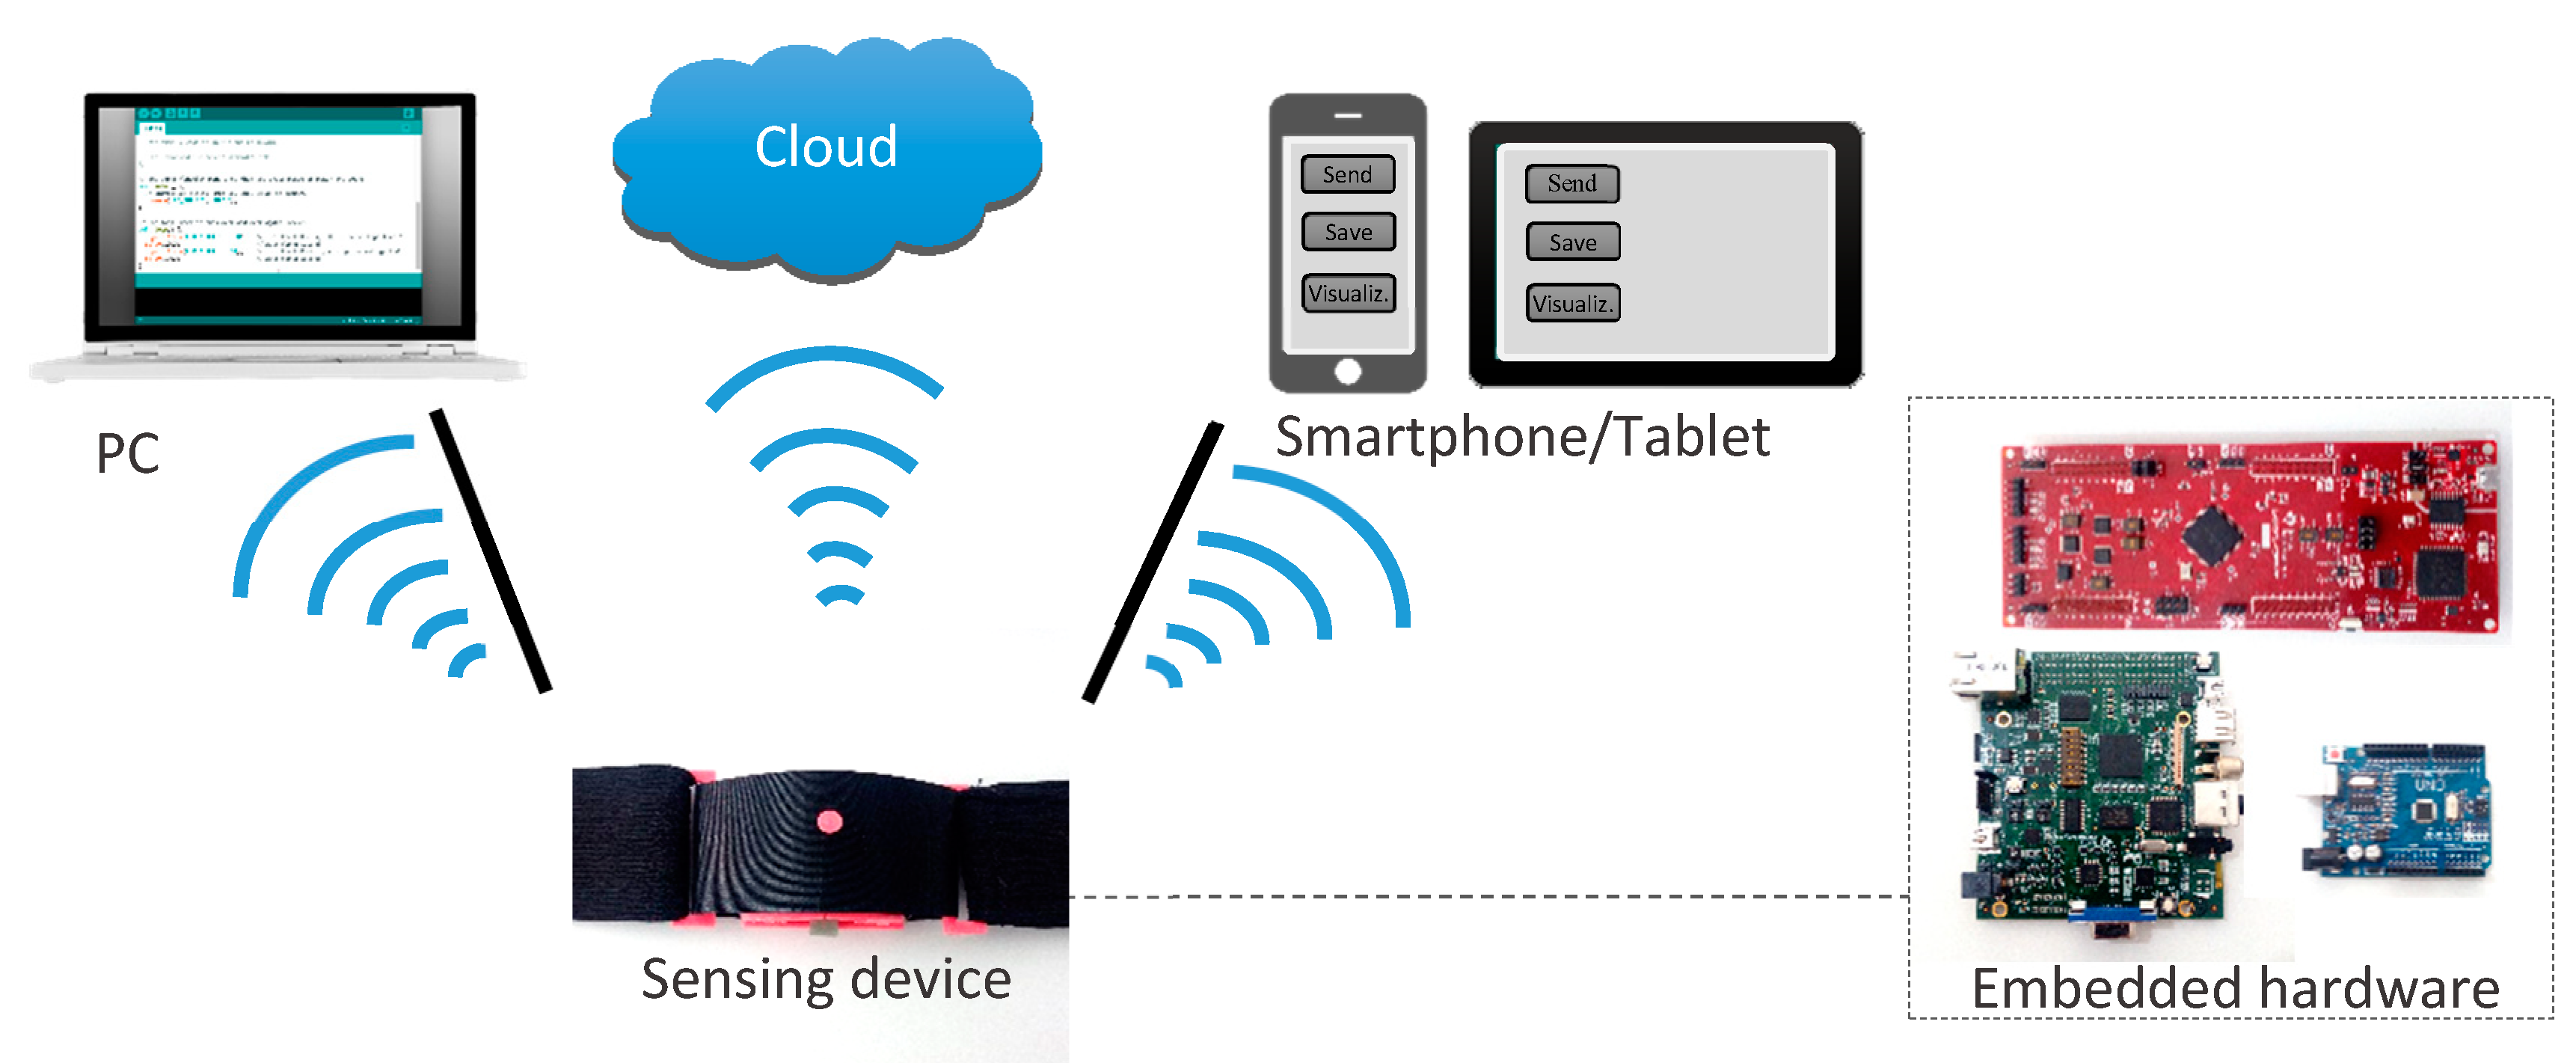
- PC (personal computer): The respiration sensing system is connected or linked to a local PC that performs the processing of the registered breathing signals.
- Smartphone/Tablet: The sensing system communicates wirelessly with a smartphone application that runs the processing algorithm ubiquitously.
- Cloud: Breathing signals are sent wirelessly to a remote server, which performs cloud computing.
- Embedded hardware: Processing is performed directly on embedded systems, which are located in or near the sensing unit package.
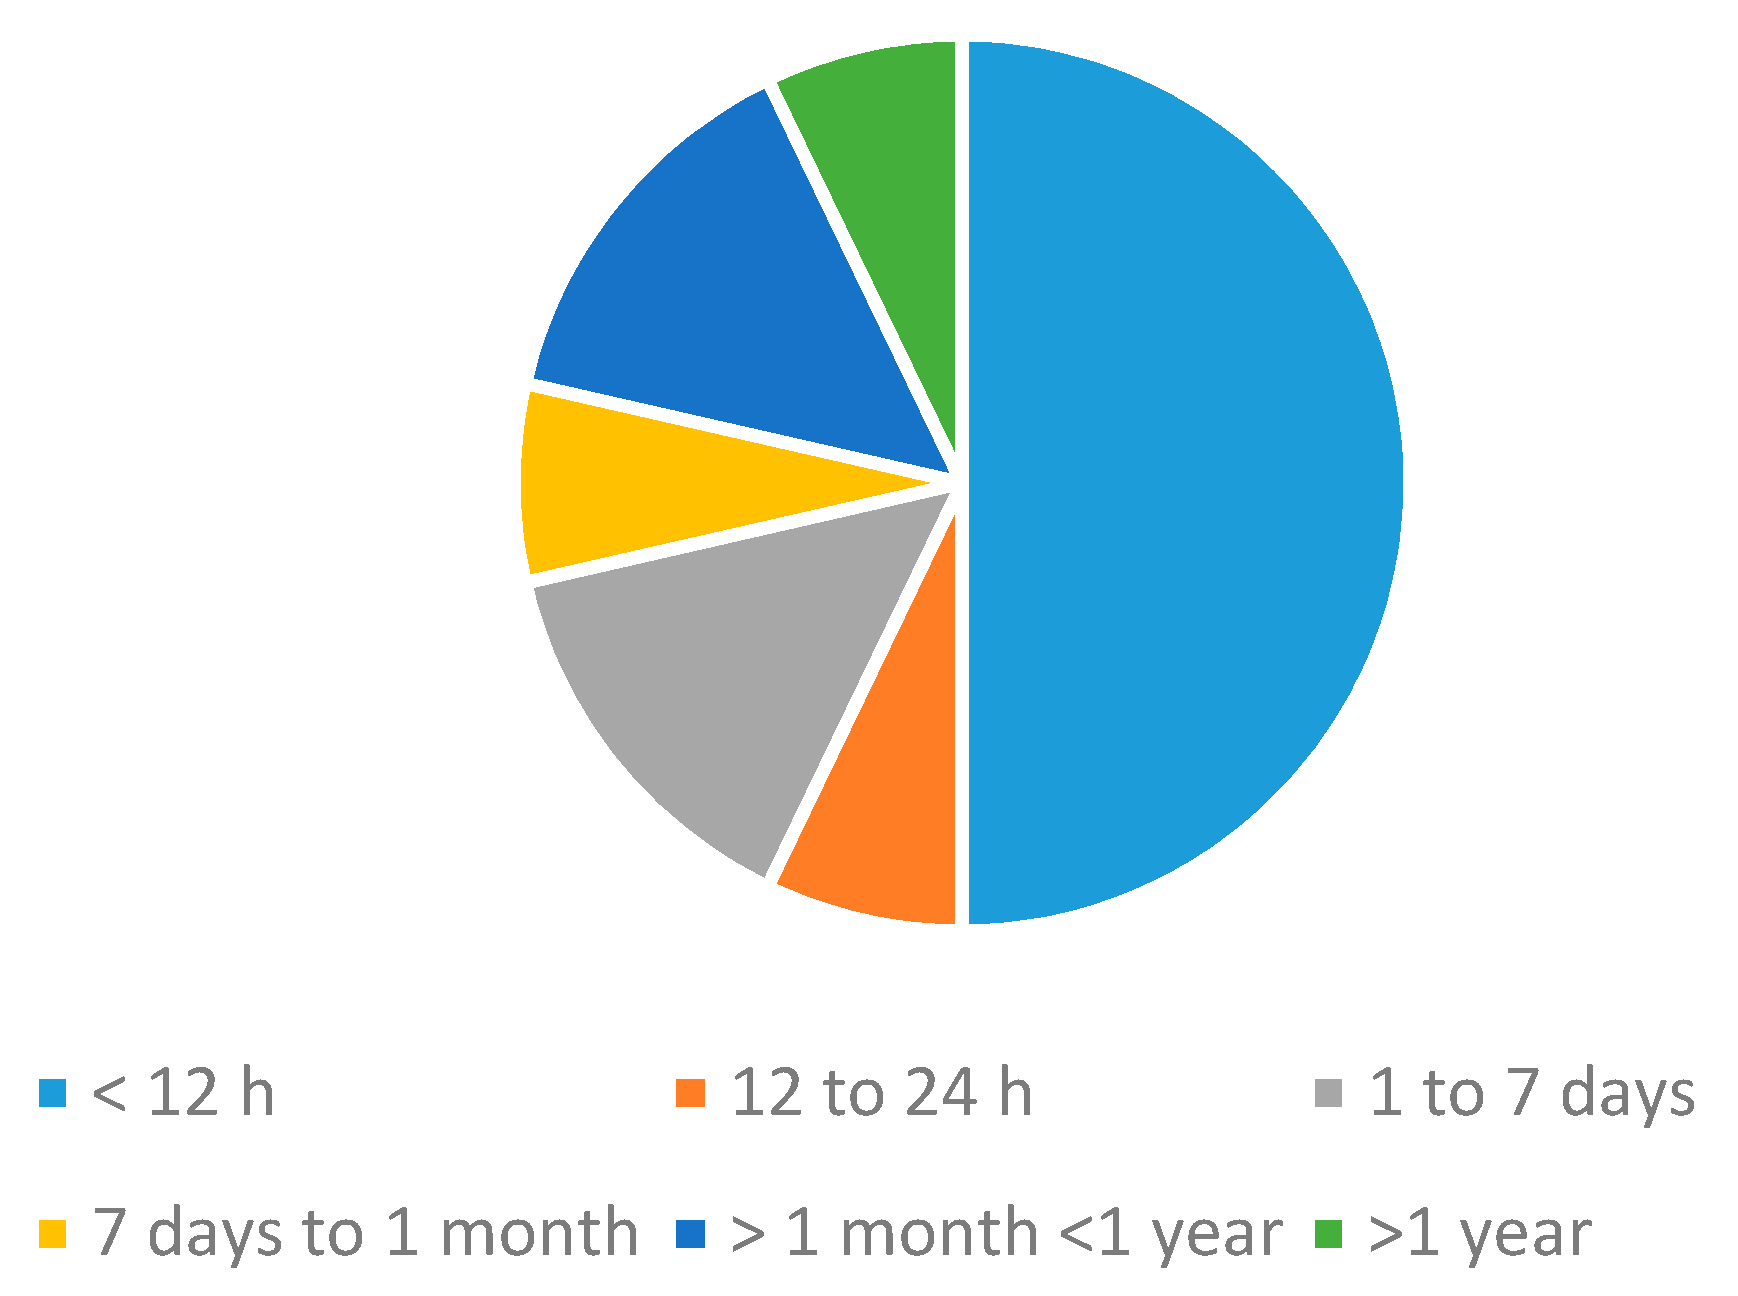
Energy Autonomy and Power Consumption
- (1)
- Energy Harvesters
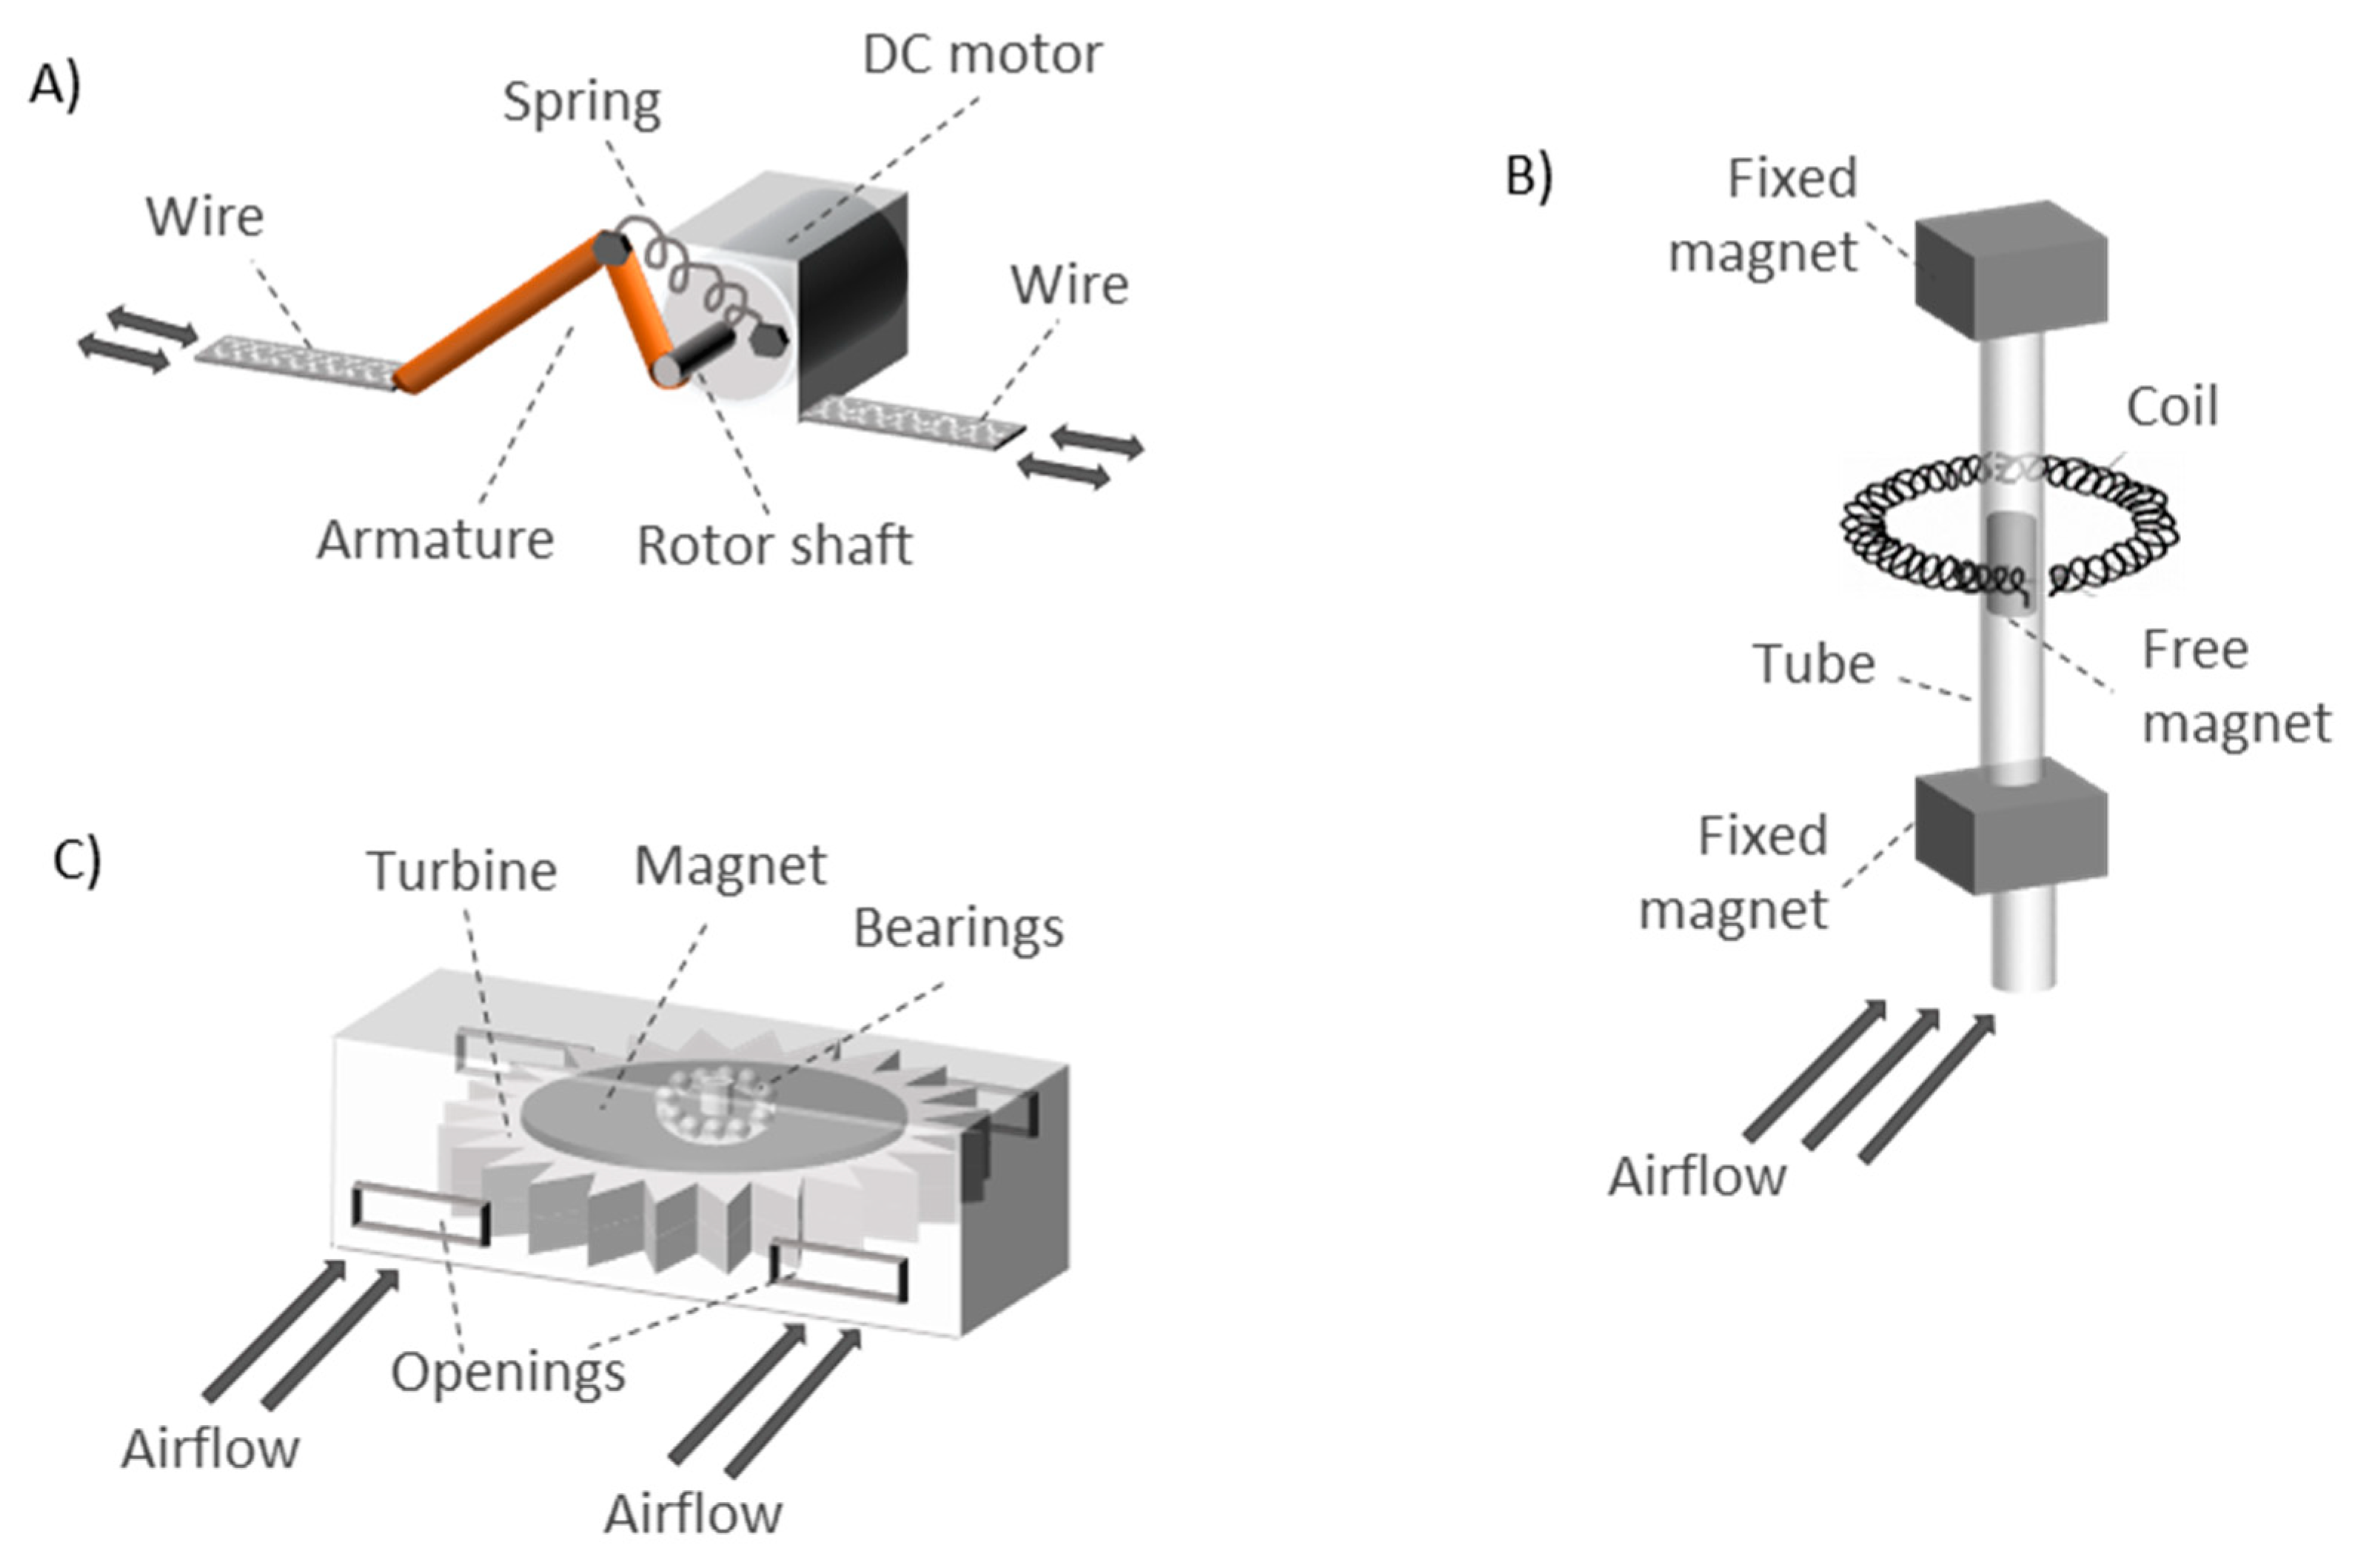
- Magnetic induction generator: A small electric generator can be used to transform mechanical energy into electrical energy according to Faraday’s law. An electric current is induced in the generator coils by a changing magnetic field produced by the movement of the rotor due to the mechanical energy applied to it during breathing. The amount of generated voltage can be calculated according to Equation (1) [135].
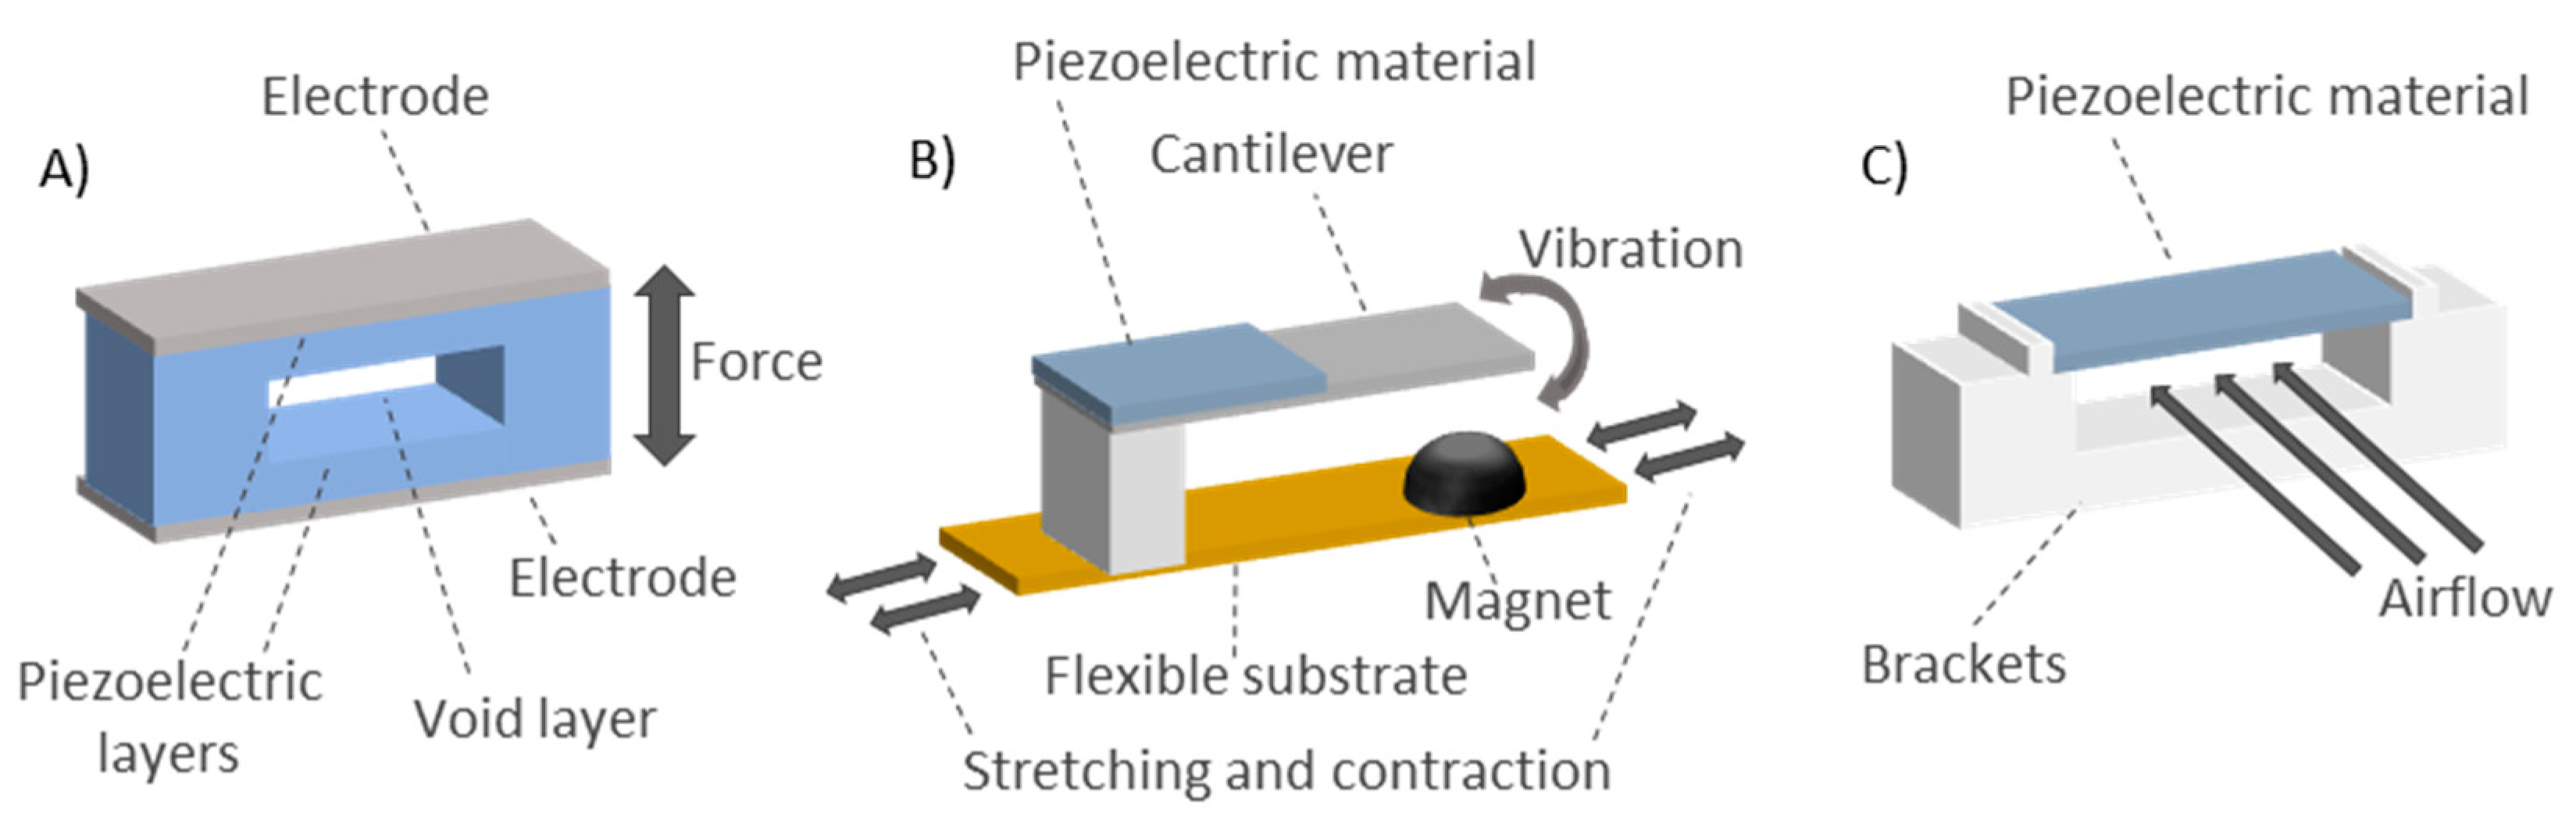
- Piezoelectric energy harvesting: These harvesters generate a voltage when compressed or stretched [242]. In the work of Shahhaidar et al. [242], they were embedded in a belt alongside the chest. Due to low capacitance of the piezoresistive materials, the overall harvested energy was low. Therefore, this piezoresistive configuration was unable to provide the necessary energy to power the entire system. The main drawback to adopting this energy harvesting technique for respiration sensors is that the required vibration frequency is much higher than the respiration frequency. In this sense, the paper of Li et al. [243] presented a prototype based on the interaction between a piezoelectric cantilever and a magnet placed on a substrate (Figure 14B). The vertical vibration of the cantilever due to the magnet presence allowed generating a constant amount of energy. The substrate with the magnet was attached to subject body (a limb joint). The movements of the subject led to substrate stretching and contraction, which caused the vibration of the piezoelectric cantilever. The energy generated was stable for different types of movements, since it was tested on different parts of the body. The energy harvester worked correctly for subject movements in the frequency range of 0.5–5.0 Hz. It has potential to be used with breathing movements. Meanwhile, Wang et al. [244] presented a piezoelectric rubber band that could be mounted on an elastic waistband to generate electricity from the circumferential stretch caused by breathing. The paper showed a structure made up of top and bottom electrodes with two solid layers and one void layer in between (Figure 14A). They were made of composite polymeric and metallic microstructures with embedded bipolar charges. Finally, the work of Sun et al. [245] presented an energy harvester from respiration air flow based on the piezoelectric effect. They used piezoelectric polyvinylidene fluoride (PVDF) microbelts that oscillated under low-speed airflow to generate electrical power in the order of magnitude of µW (Figure 14C).
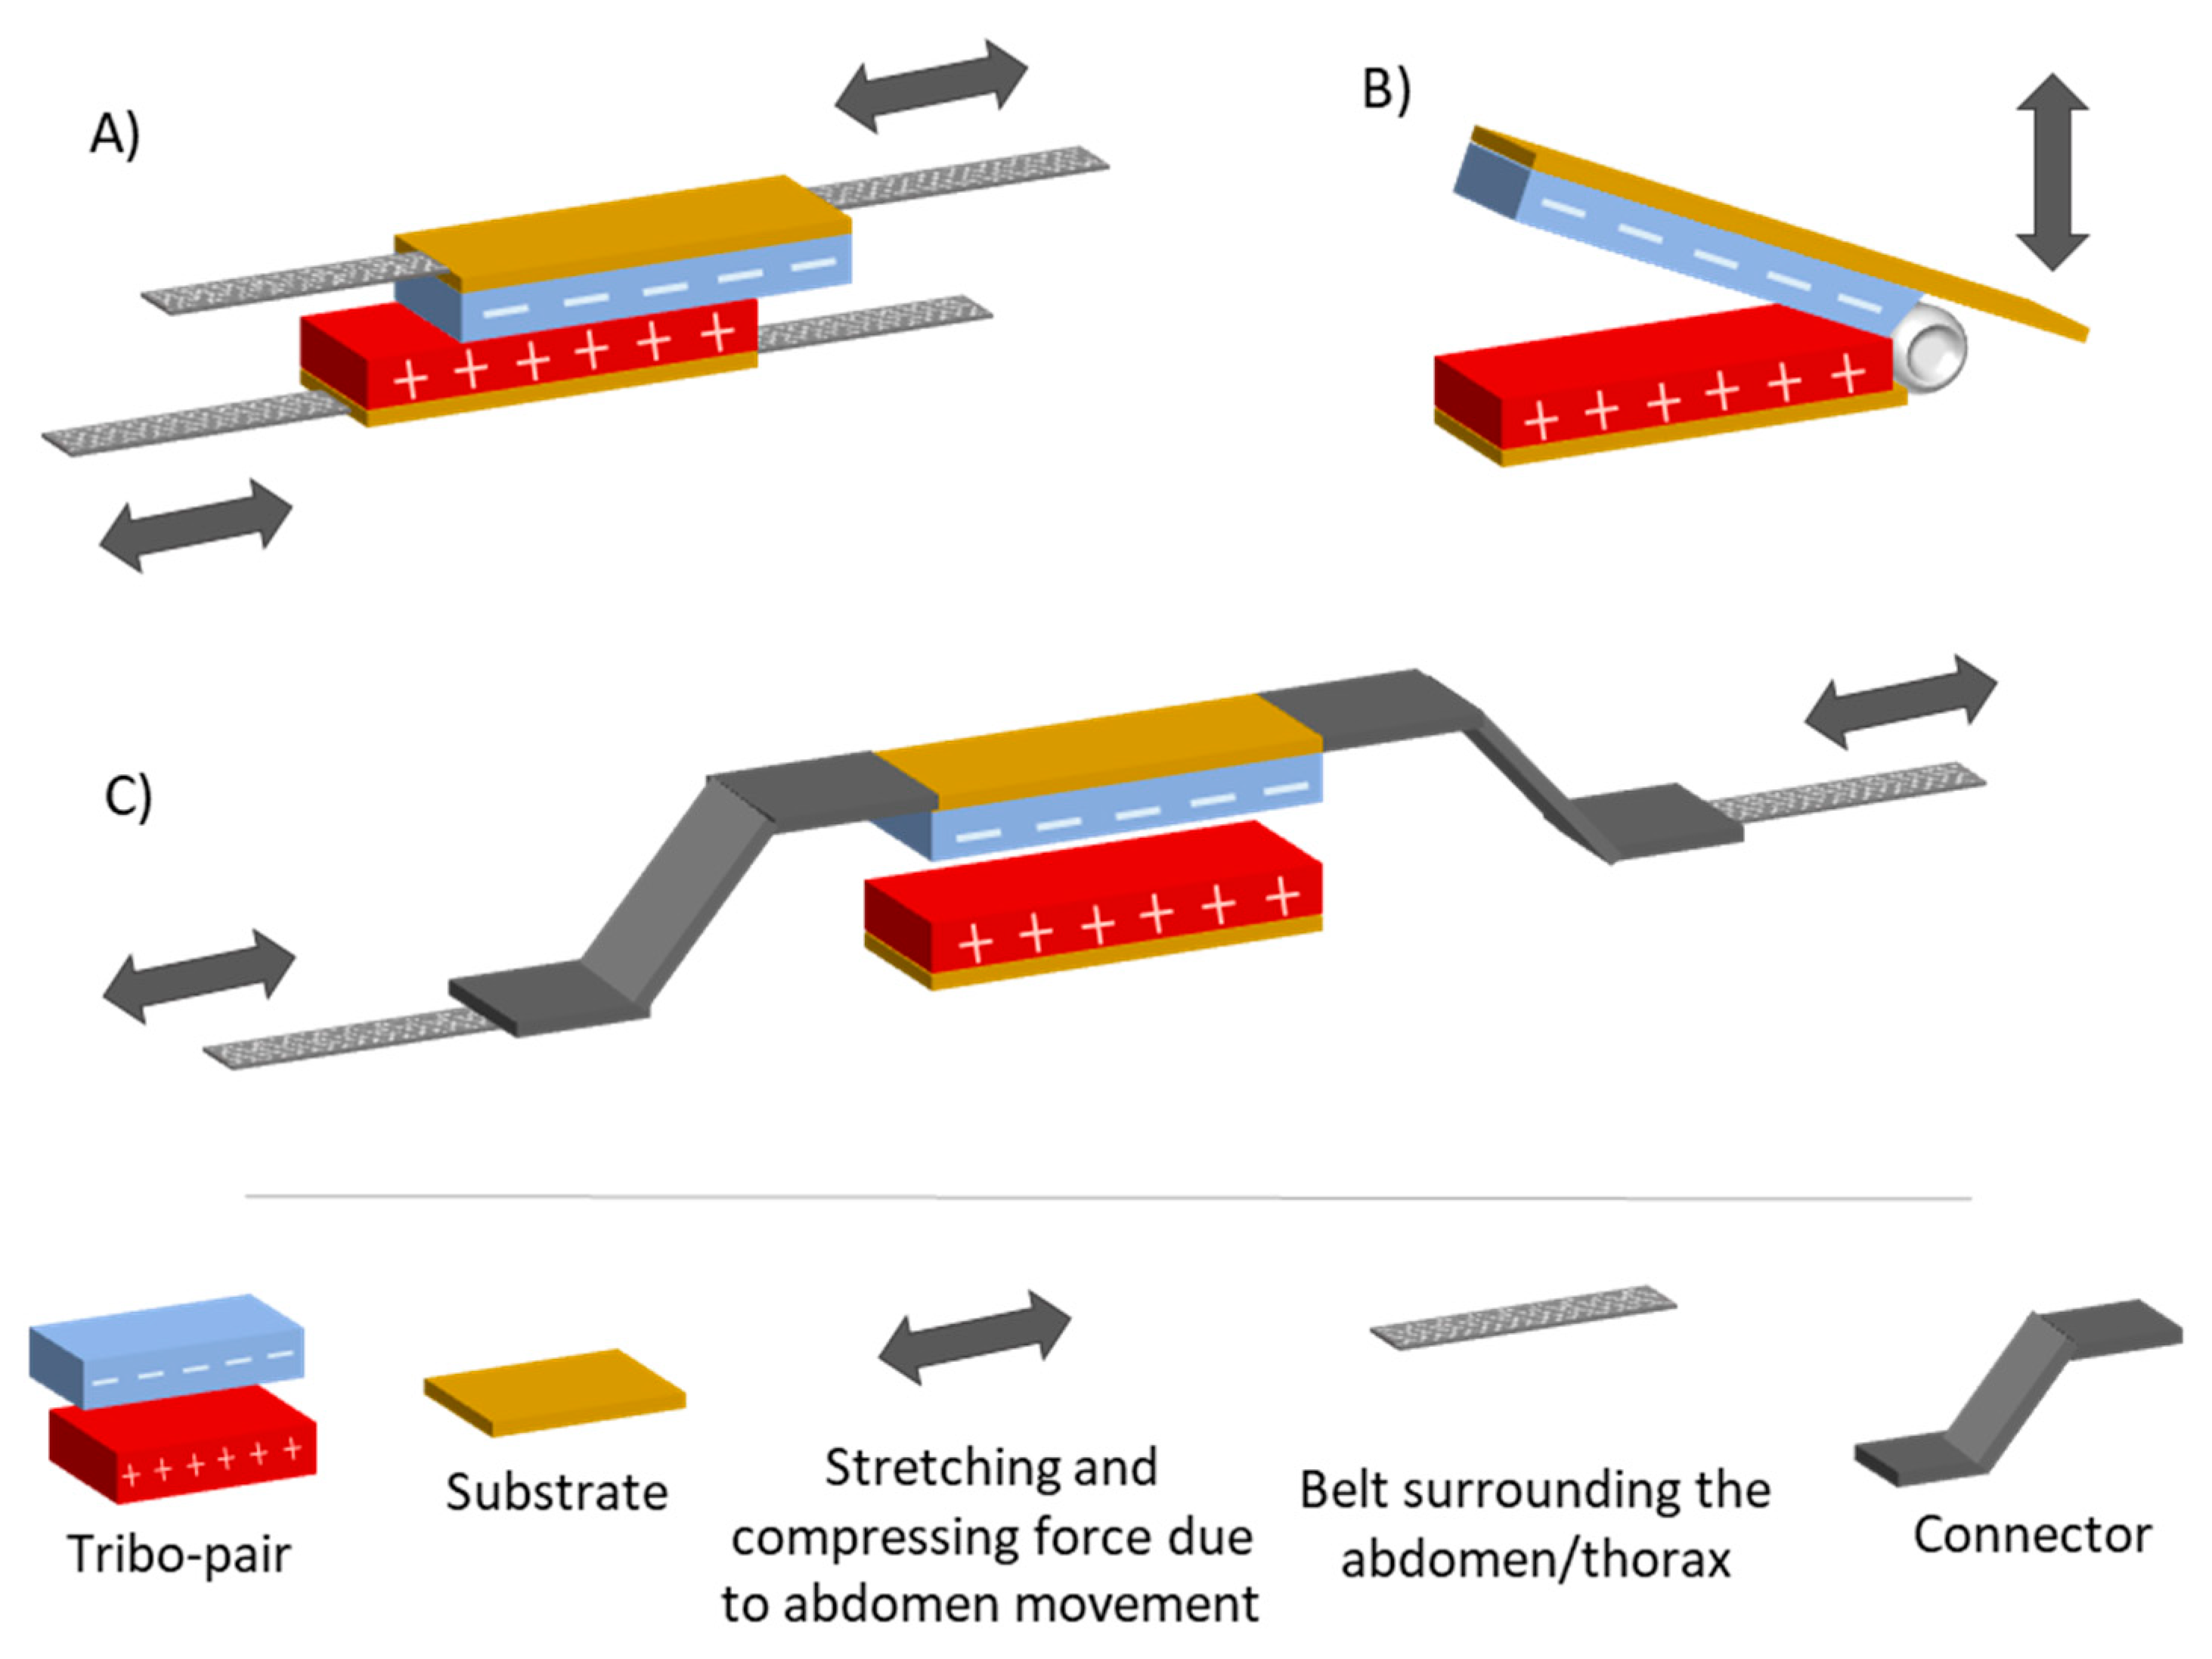
- Triboelectric energy harvesting: They generate charges by rubbing two different materials (one is an electron donor and the other is an electron acceptor), resulting in the creation of a potential in the contact region [250]. One possible setup is to attach the tribo-pair to a belt to detect variations in abdominal circumference. Triboelectric generators were used in breathing studies as a means of measuring RR, but not as energy harvesters, since the power generated is low for the power requirements of the entire respiration monitoring system that includes also a data transmission module. In the work of Zhang et al. [246] two belts (one extensible and one inextensible) were attached to each side of two materials (Figure 15A). A mechanical experiment was performed to obtain the peak voltage for different sliding amplitudes in the range of 2.5 to 30 mm that represents the typical displacement of a breathing depth. The result of this experiment was Equation (3).where is the peak value of the voltage, and the is the maximum sliding displacement of the tribo-pair. A similar approach was proposed by Zhang et al. [77]. They presented a tribo-pair with both sides of one material fixed to two “Z-shaped” connectors that were attached to a belt with an inextensible part and an extensible part (Figure 15B). The abdominal contraction and expansion associated with respiration caused deformation of the two “Z-shaped” connectors. This deformation led to a process of contact and separation of the tribo-pair, generating an electrical signal.
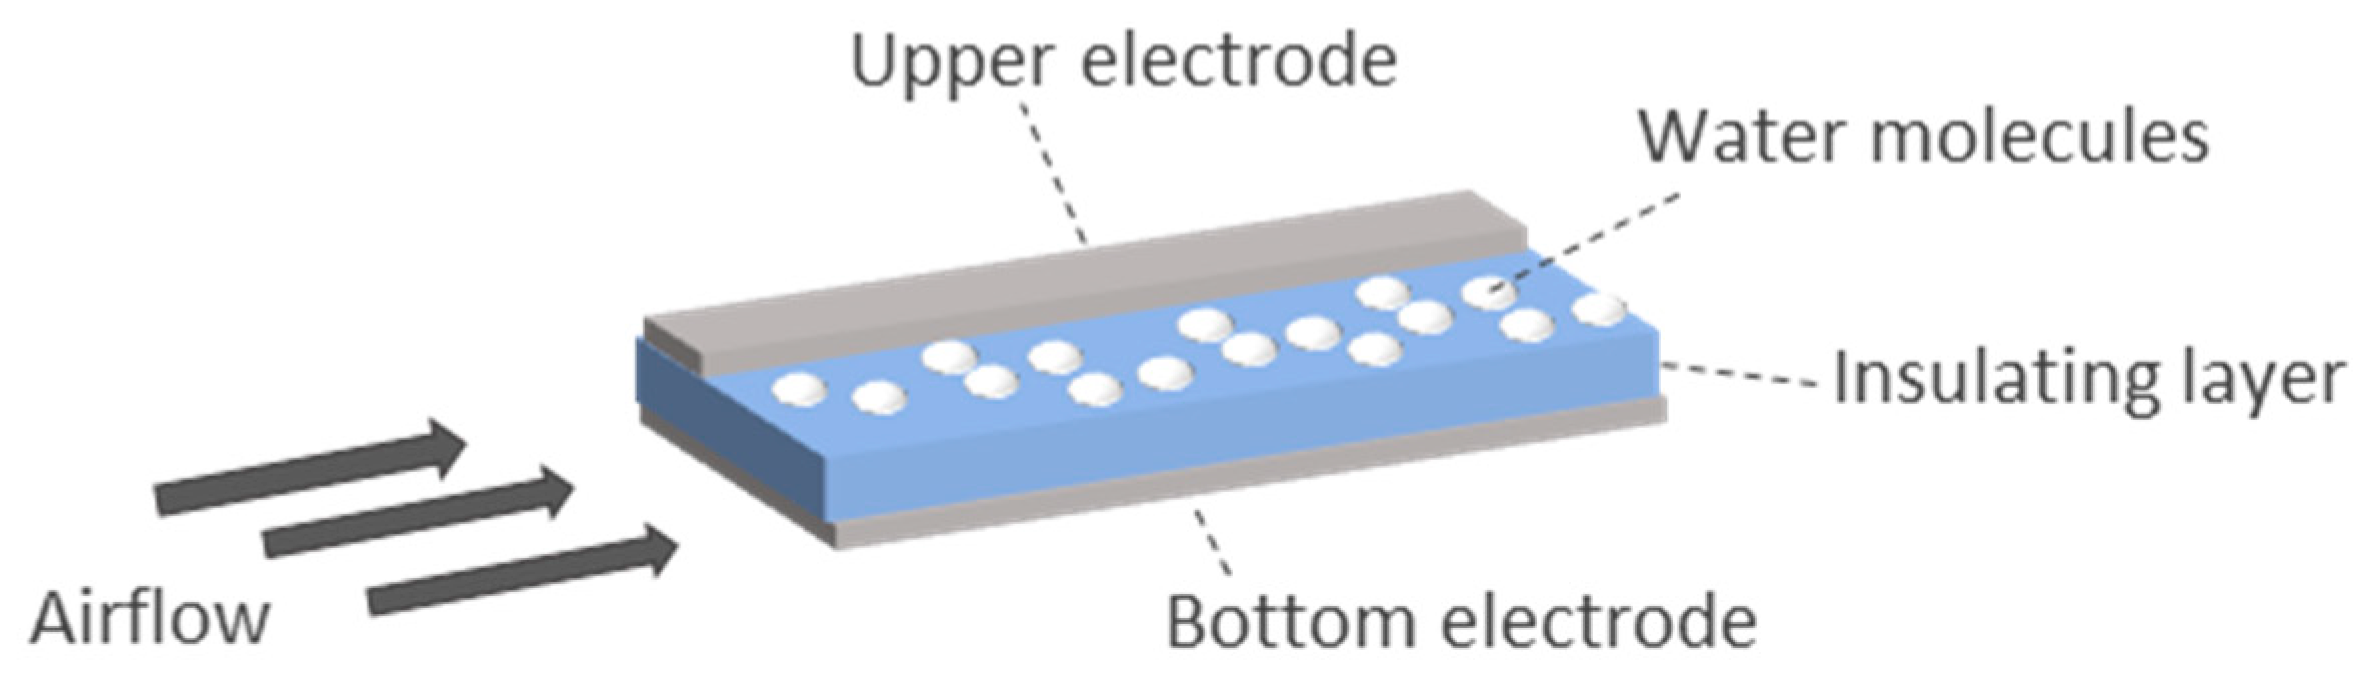
- Electrostatic energy harvesting: It is based on the change of parameters of a capacitive device, which is called electrostatic energy harvester. Breathing may cause separation of the capacitor plates or modification of the plate area, among others [251]. This energy harvesting technique is not common in respiratory systems. The prototype of Seo et al. [248] showed a capacitor made of two metal electrodes and an insulating layer in between. The capacitance of the prototype varied with respiration. This was because the area of the top electrode was variable depending on the presence of a wet surface associated with respiration (Figure 16). Humid exhaled breath air was cooled by the ambient air on the top surface of the insulated material. Thus, the water molecules were condensed, acting as part of the upper electrode and changing the capacitance of the prototype. This condensation provided a thick layer that became part of the electrode. Then, the water naturally evaporated due to its vapor pressure and the device returned to its original status. The variable capacitance allowed the charges to circulate, harvesting electrostatic energy. The prototype presented in Reference [248] reported a generated power of 2 μW/cm2.
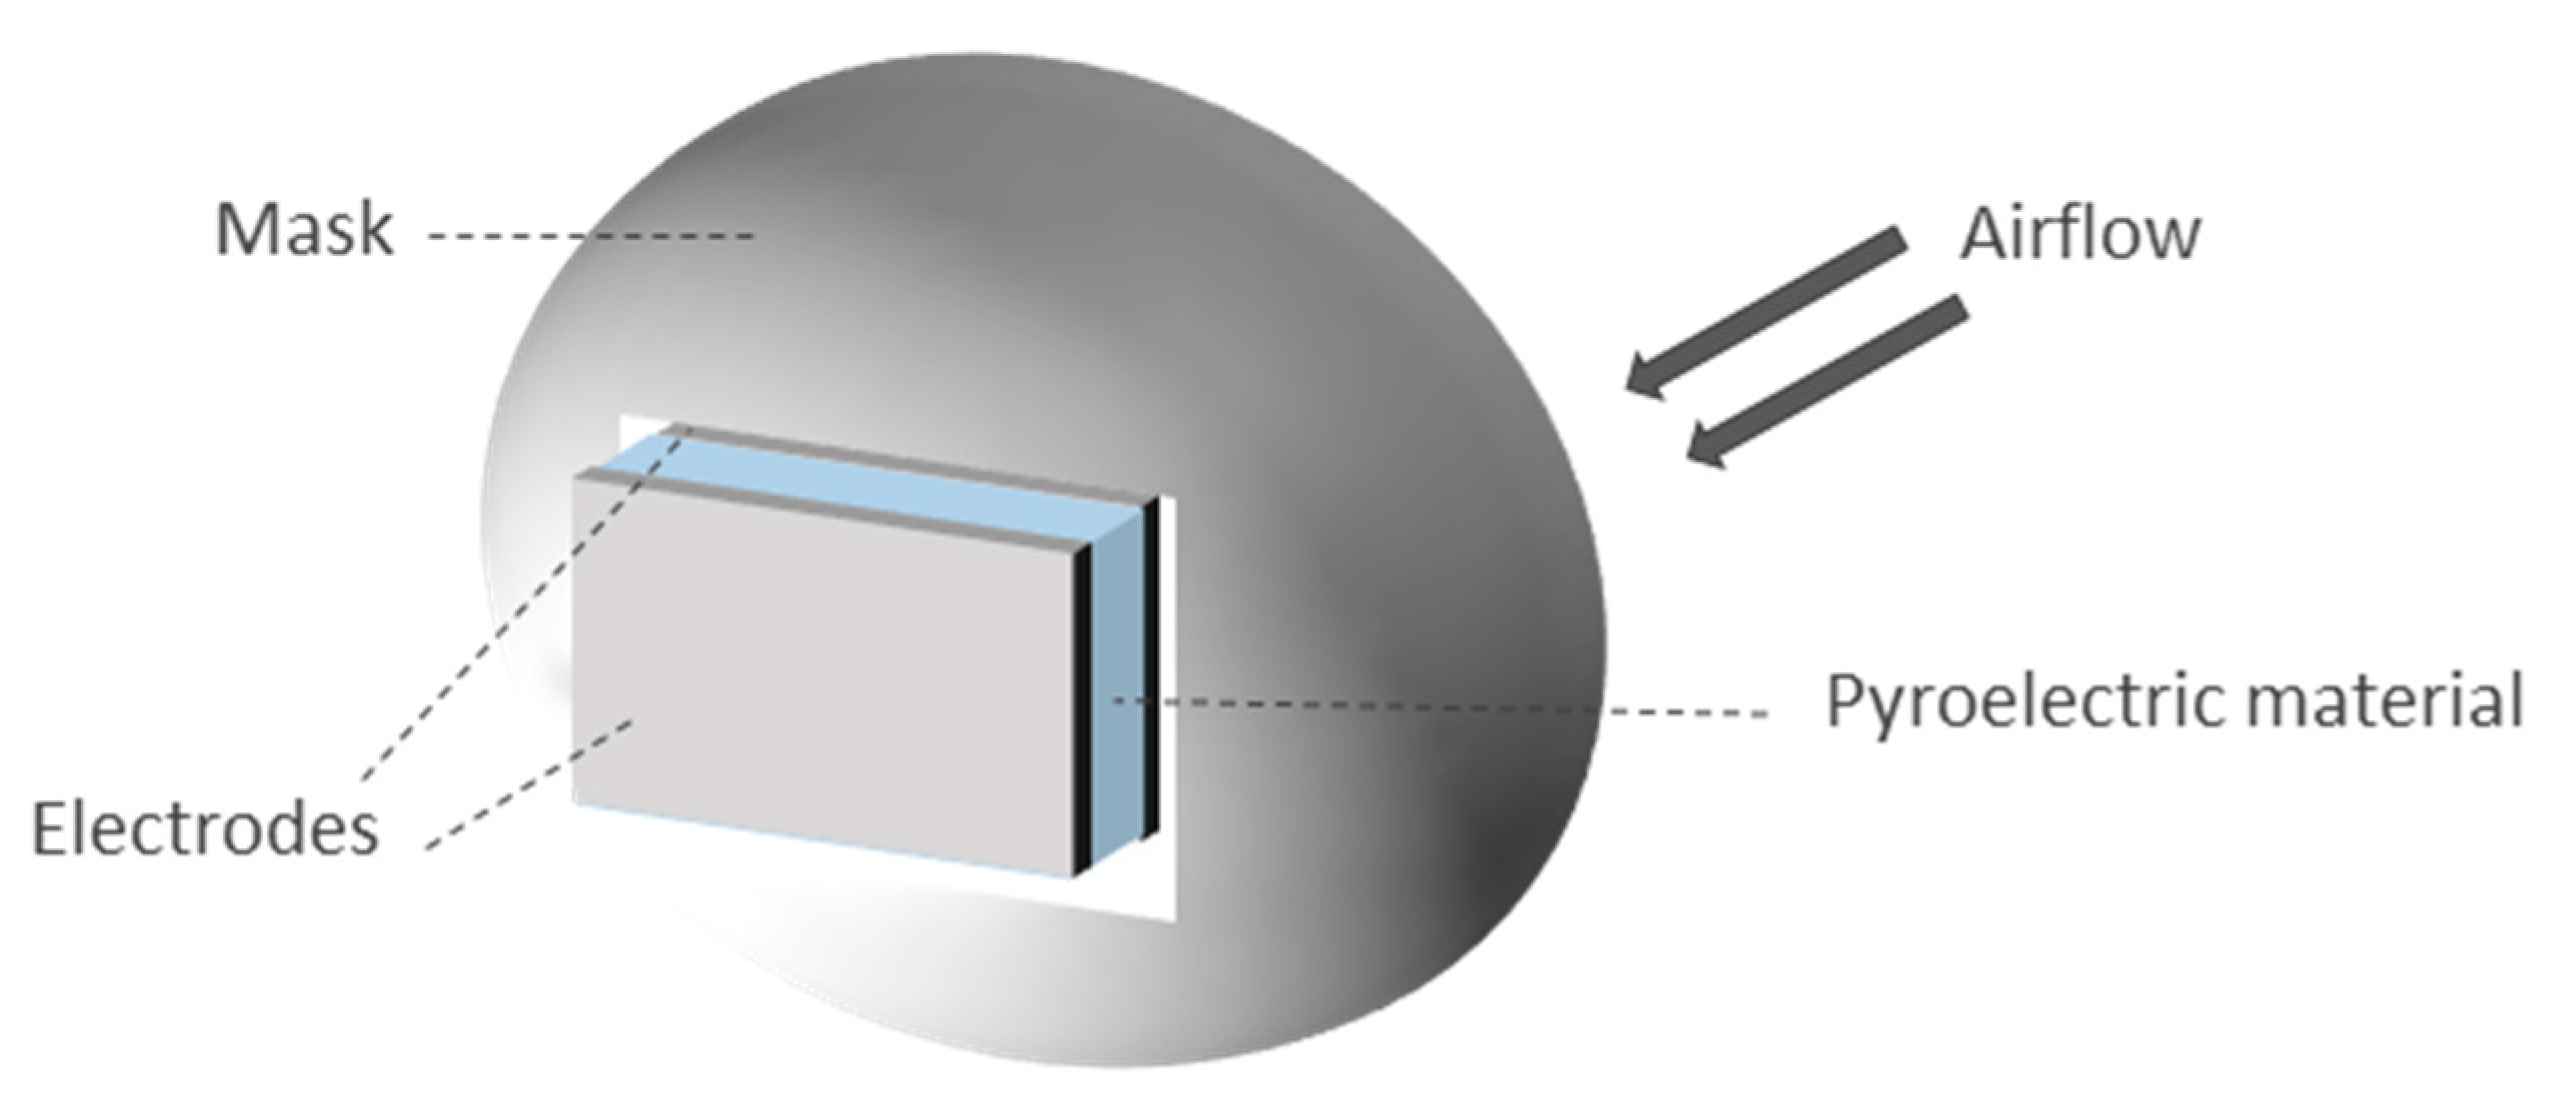
- Pyroelectric energy harvesting: These harvesters are based on the reorientation of dipoles owing to temperature fluctuations [252]. Therefore, they need a temperature variation in time. Xue et al. [249] presented a prototype made of a pyroelectric component (metal coated PVDF film) covered with electrodes and mounted on the respirator of a mask at the location where air flows during breathing (Figure 17). The size of the prototype was 3.5 × 3.5 cm. The estimated current generated can be derived from the pyroelectric effect equation:
- Thermoelectric energy harvesting: These harvesters are based on the Seebeck effect. They convert a temperature gradient into electric power. Therefore, they need a temperature variation in space [253]. A thermoelectric module is an array of p-type and n-type semiconductors. According to Nozariasbmarz et al. [252], the conversion efficiency of a thermoelectric generator can be calculated as:
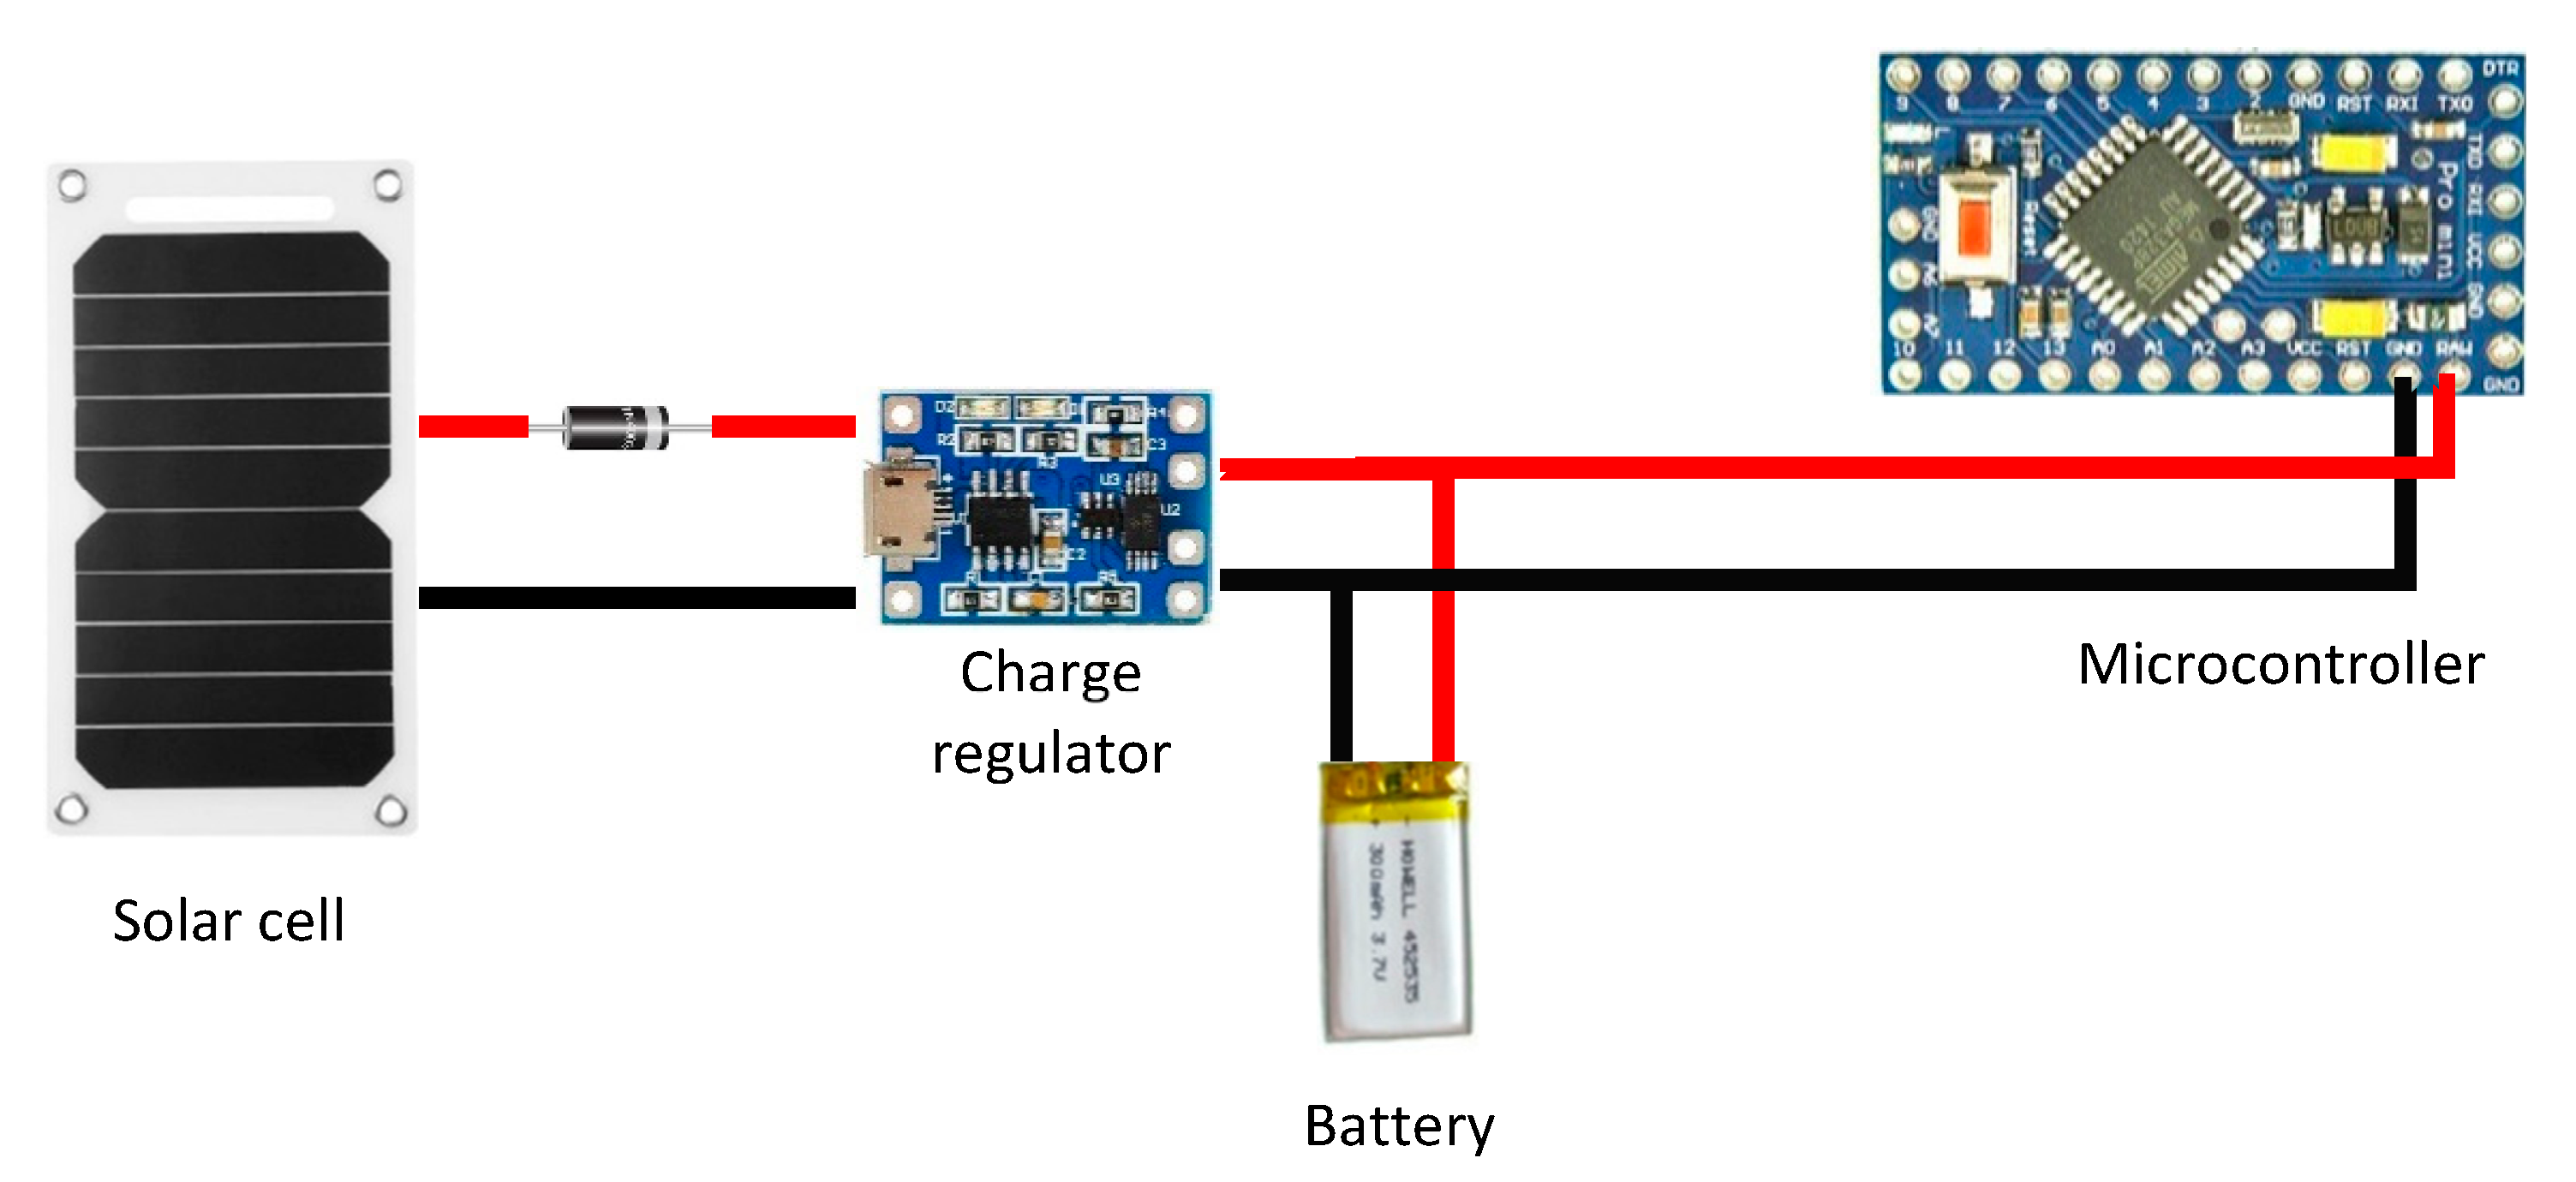
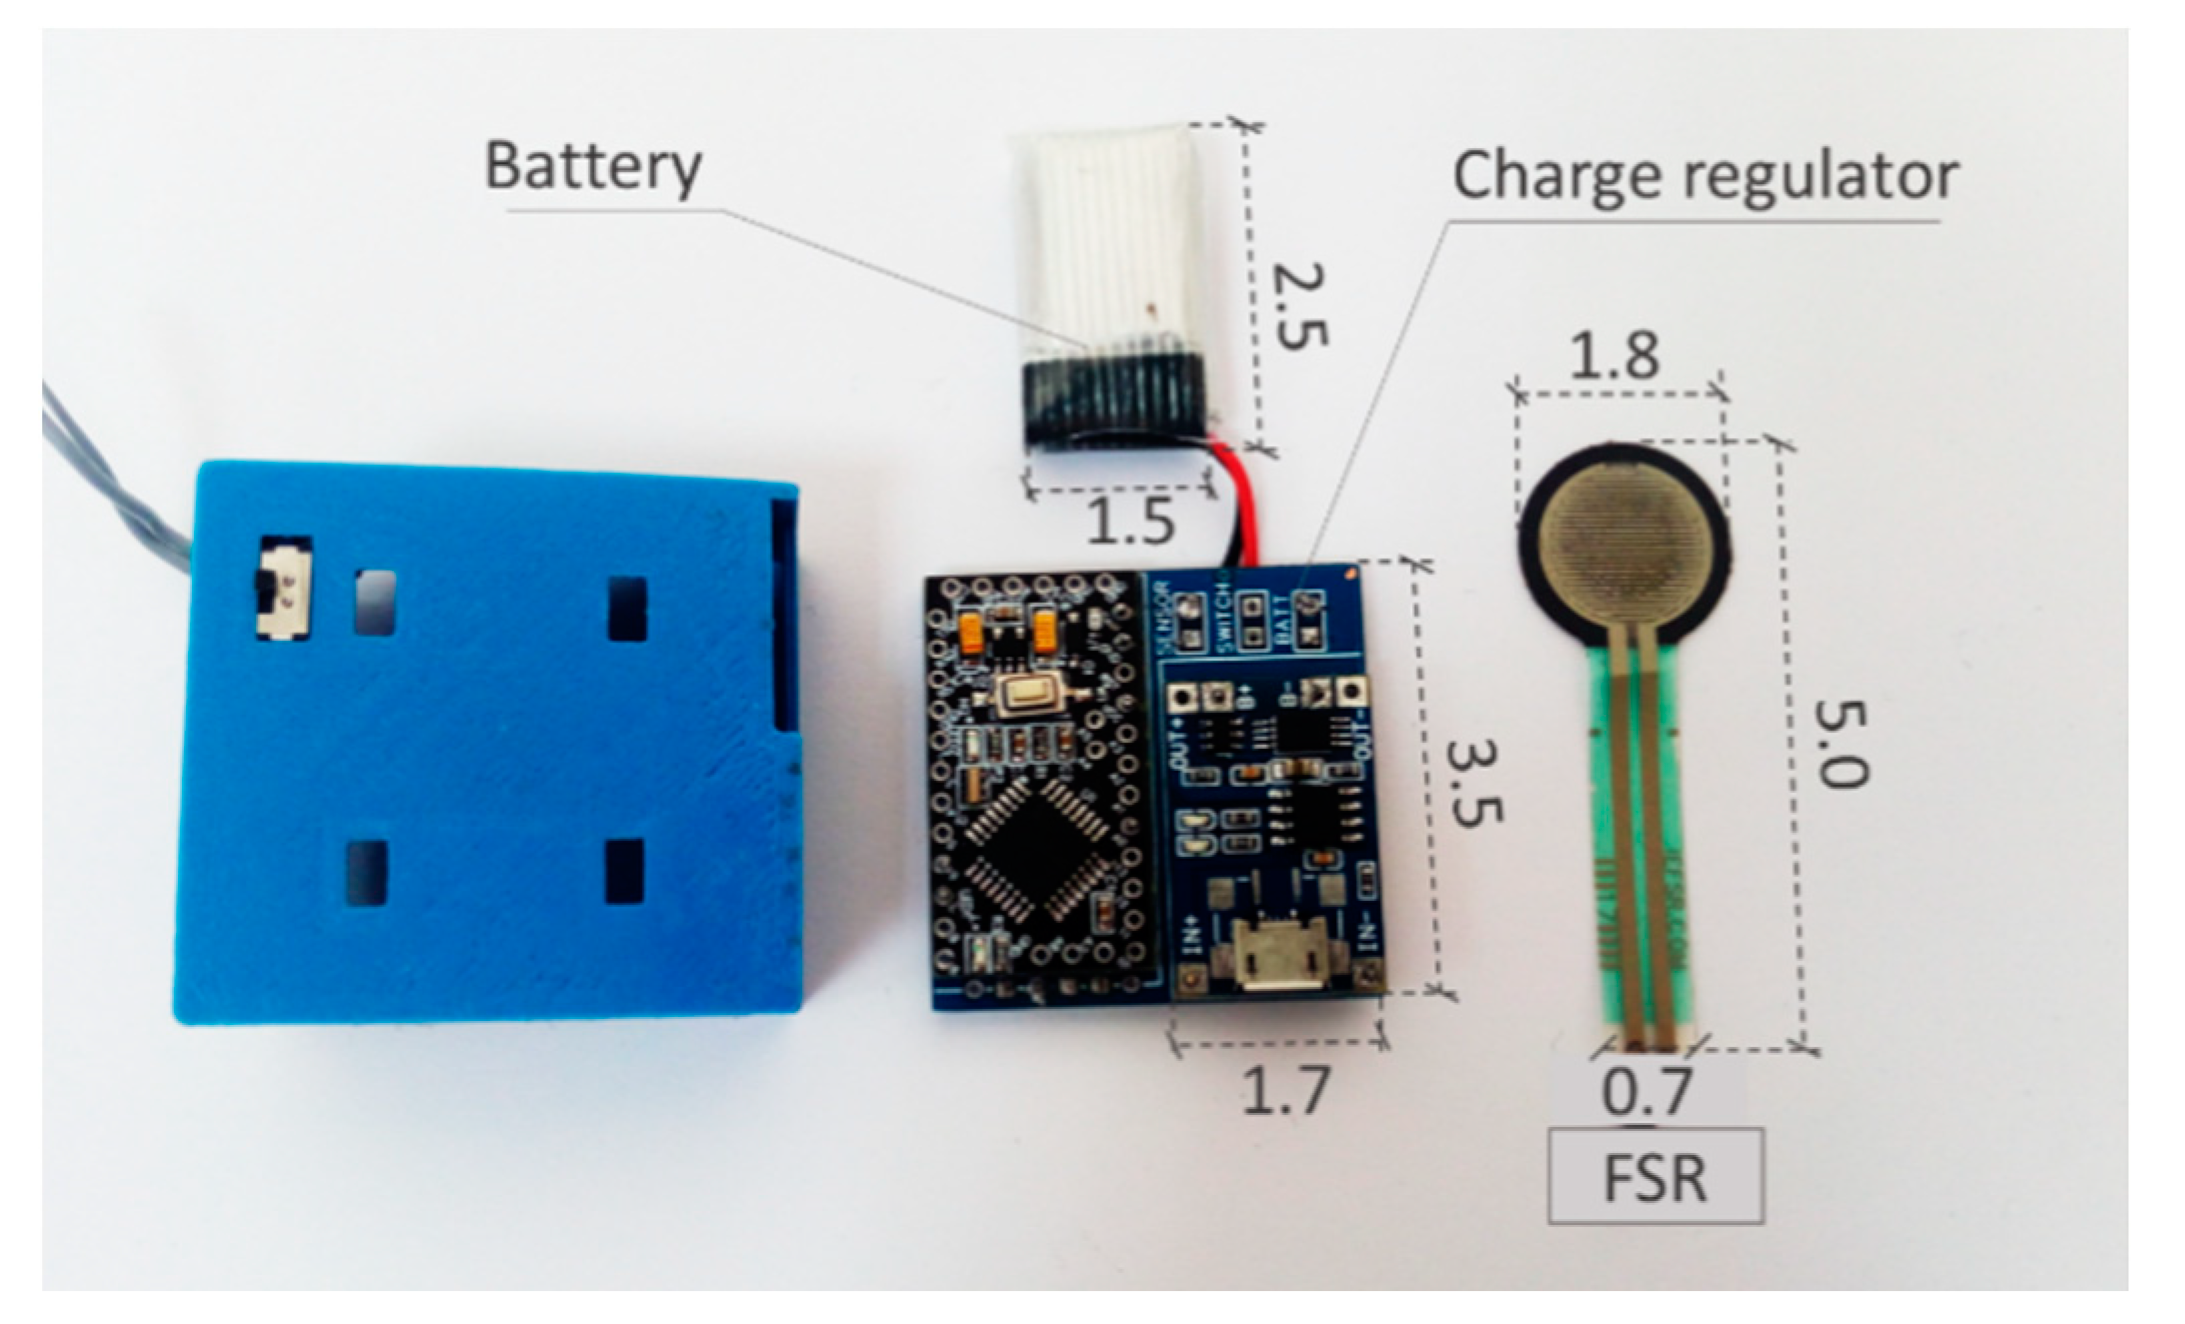
- Solar cells: This technology has been also used to power respiratory sensing systems. The energy produced by the solar cells is stored in a battery through a charge regulator that also controls the discharge of the battery to power the sensing system. The charge regulator controls that both the battery and the sensing system are supplied with adequate voltage and current levels. Figure 18 shows an example of sensing system powered by solar cells. Solar-powered systems have not been extensively explored in existing studies. As an exception, the work of Gorgutsa et al. [84] presented a Received Signal Strength Indicator through standard Bluetooth protocol using a hybrid-spiral antenna made of multi-material fibers. The system was integrated into a cotton shirt. They used a low-power Bluetooth module that was powered by a rechargeable battery and a solar cell on a custom printed circuit board.
- (2)
- Battery-Powered Systems
- Continuous operation: Battery life is measured with the breathing device operating continuously.
- Continuous operation + inactivity periods: A typical daily use of the system is considered, which may include certain inactivity periods in which the device is in “idle” mode or even off (not used).
- Measure of battery life directly: A battery can be considered discharged when the voltage drops below a certain value (3.6 V [257] for common small batteries). Therefore, by taking a full battery and monitoring the output voltage, it is possible to obtain battery life with expression (7).
- Measure of current consumption: Current consumption of the respiratory sensing system can be measured experimentally or estimated from the datasheets of the system components. The formula for calculating battery life is different for each operation mode:
- ○
- Continuous operation: The system is assumed to operate continuously consuming an average current value.where are reduction factors of the capacity to be applied in case tests are not performed under the optimal conditions mentioned above, and OC is the average value of the operating current.
- ○
- Continuous operation + inactivity periods (rough estimate): Current consumption in the operation and inactivity periods is assumed to be “constant”.where IC(mAh) is the average value of current consumed by the system in idle or non-active modes, is the number of minutes that the breathing system is in operation mode during a certain period of time (for instance, one day), is the number of minutes that the breathing system is in idle or non-active modes for the same time period, and .
- ○
- Continuous operation + inactivity periods (fine estimate): The calculation of battery life is performed using a more accurate model. Different values of current consumption are considered in operation and inactivity modes. In this calculation, the system can adopt not only two states, but n states. Let be the average current values of each of the n different states of the respiratory system considered, and the number of minutes in a given period of time (for instance, one day) that the breathing system remains in each state of the n possible states. The calculation can be done with Equation (10).
3.2.2. Results of the Analysis
3.3. Validation Experiments
3.3.1. Items of Analysis
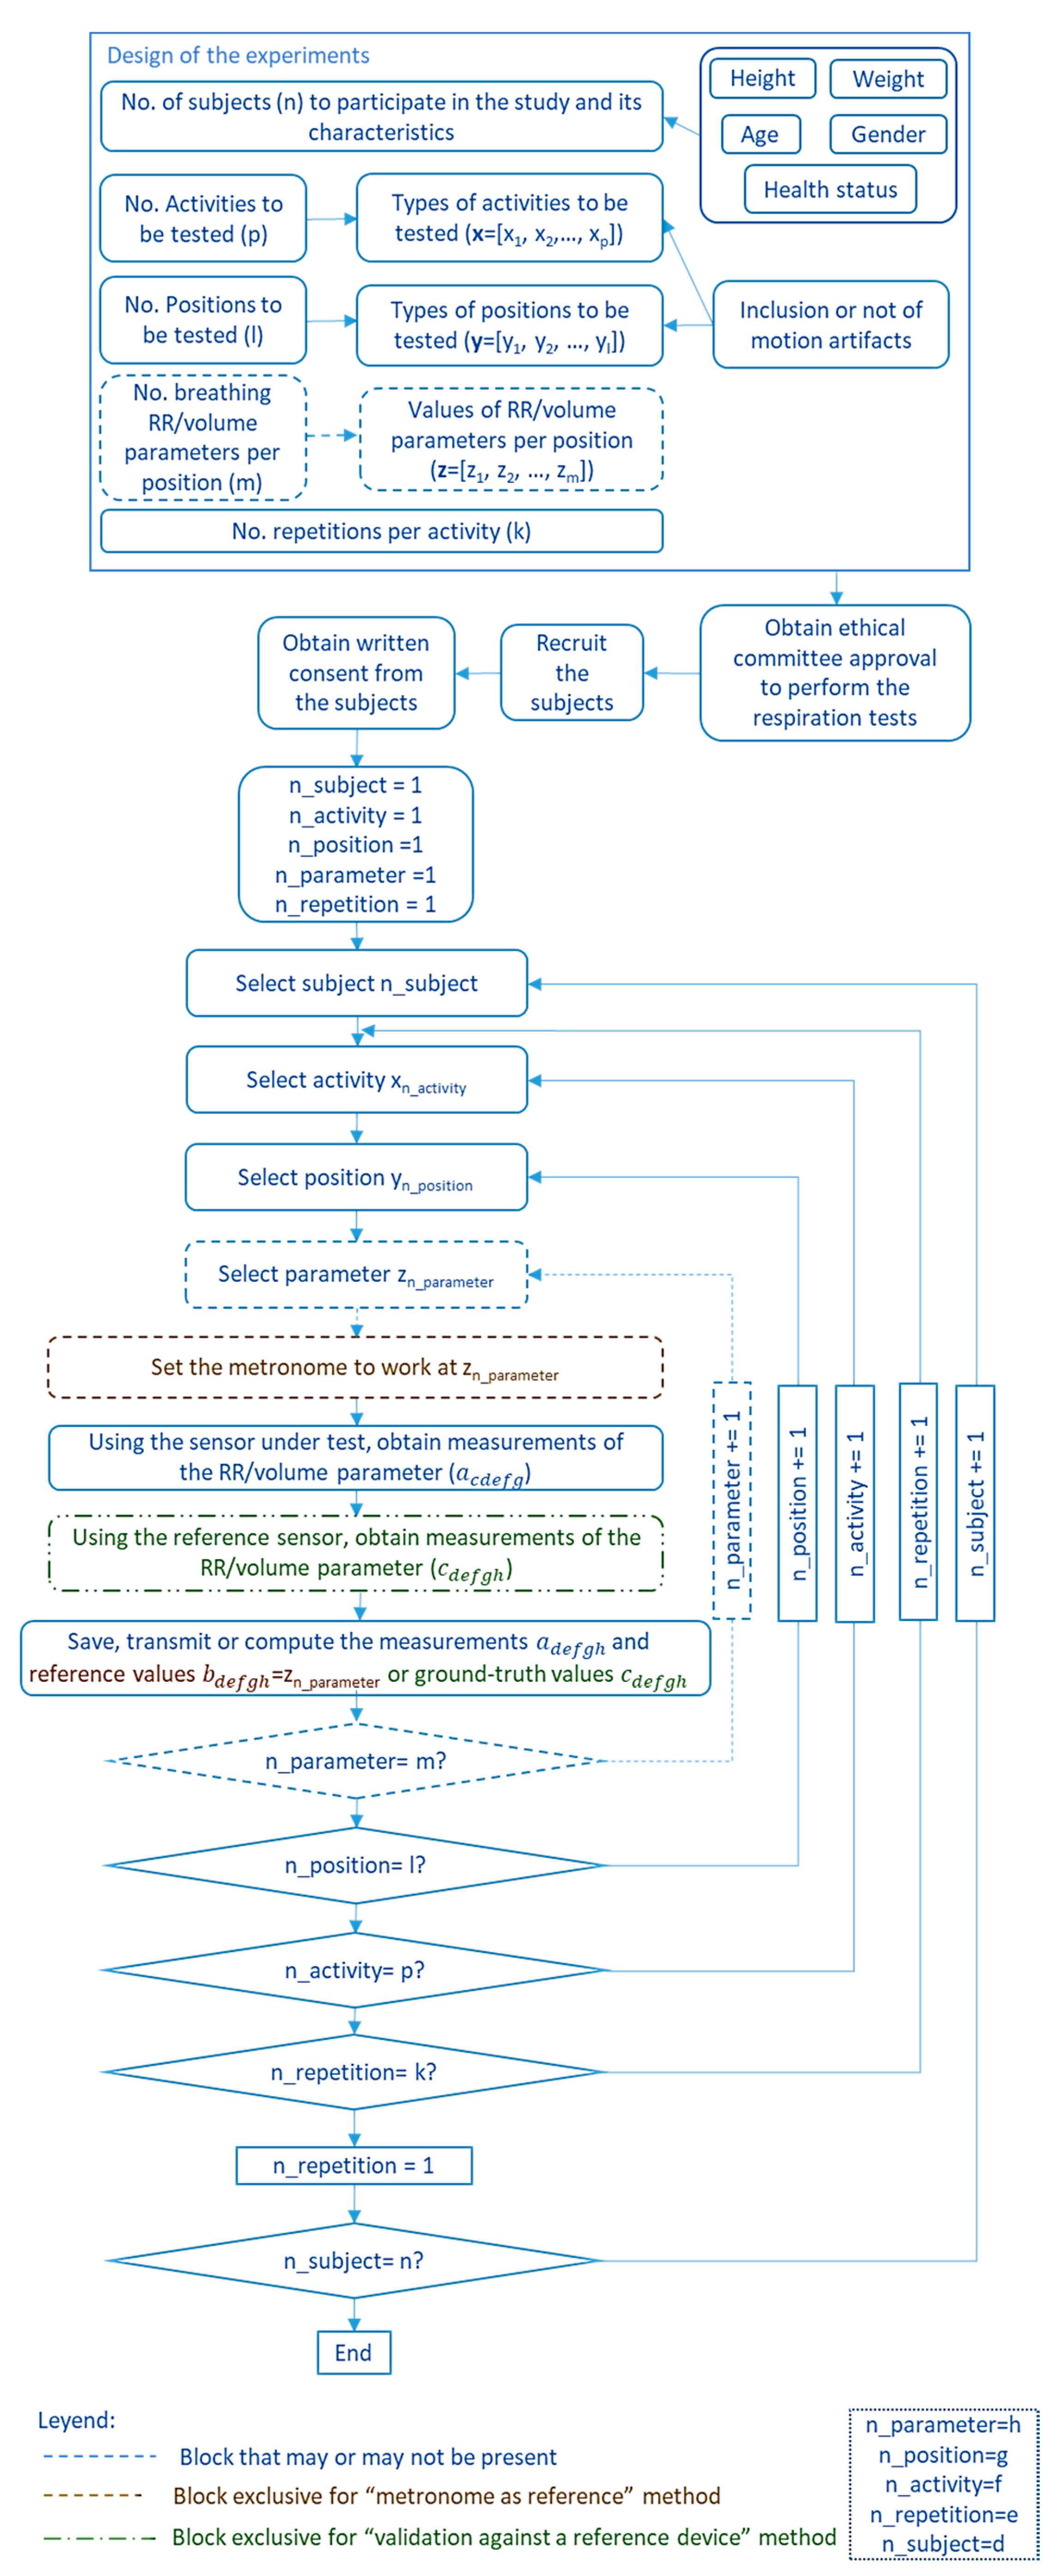
- Subjects: Almost all studies used volunteers to assess the respiration sensing systems. In this case, it is required to provide data, such as the number of subjects who participated in the tests and their main characteristics (age, weight, height, sex, and health status). As breathing studies generally involve humans, it is mandatory to have the approval of the competent ethical committee (following the Declaration of Helsinki [258]) to recruit the subjects to participate in the study, to inform them about the study, and to obtain their consent.
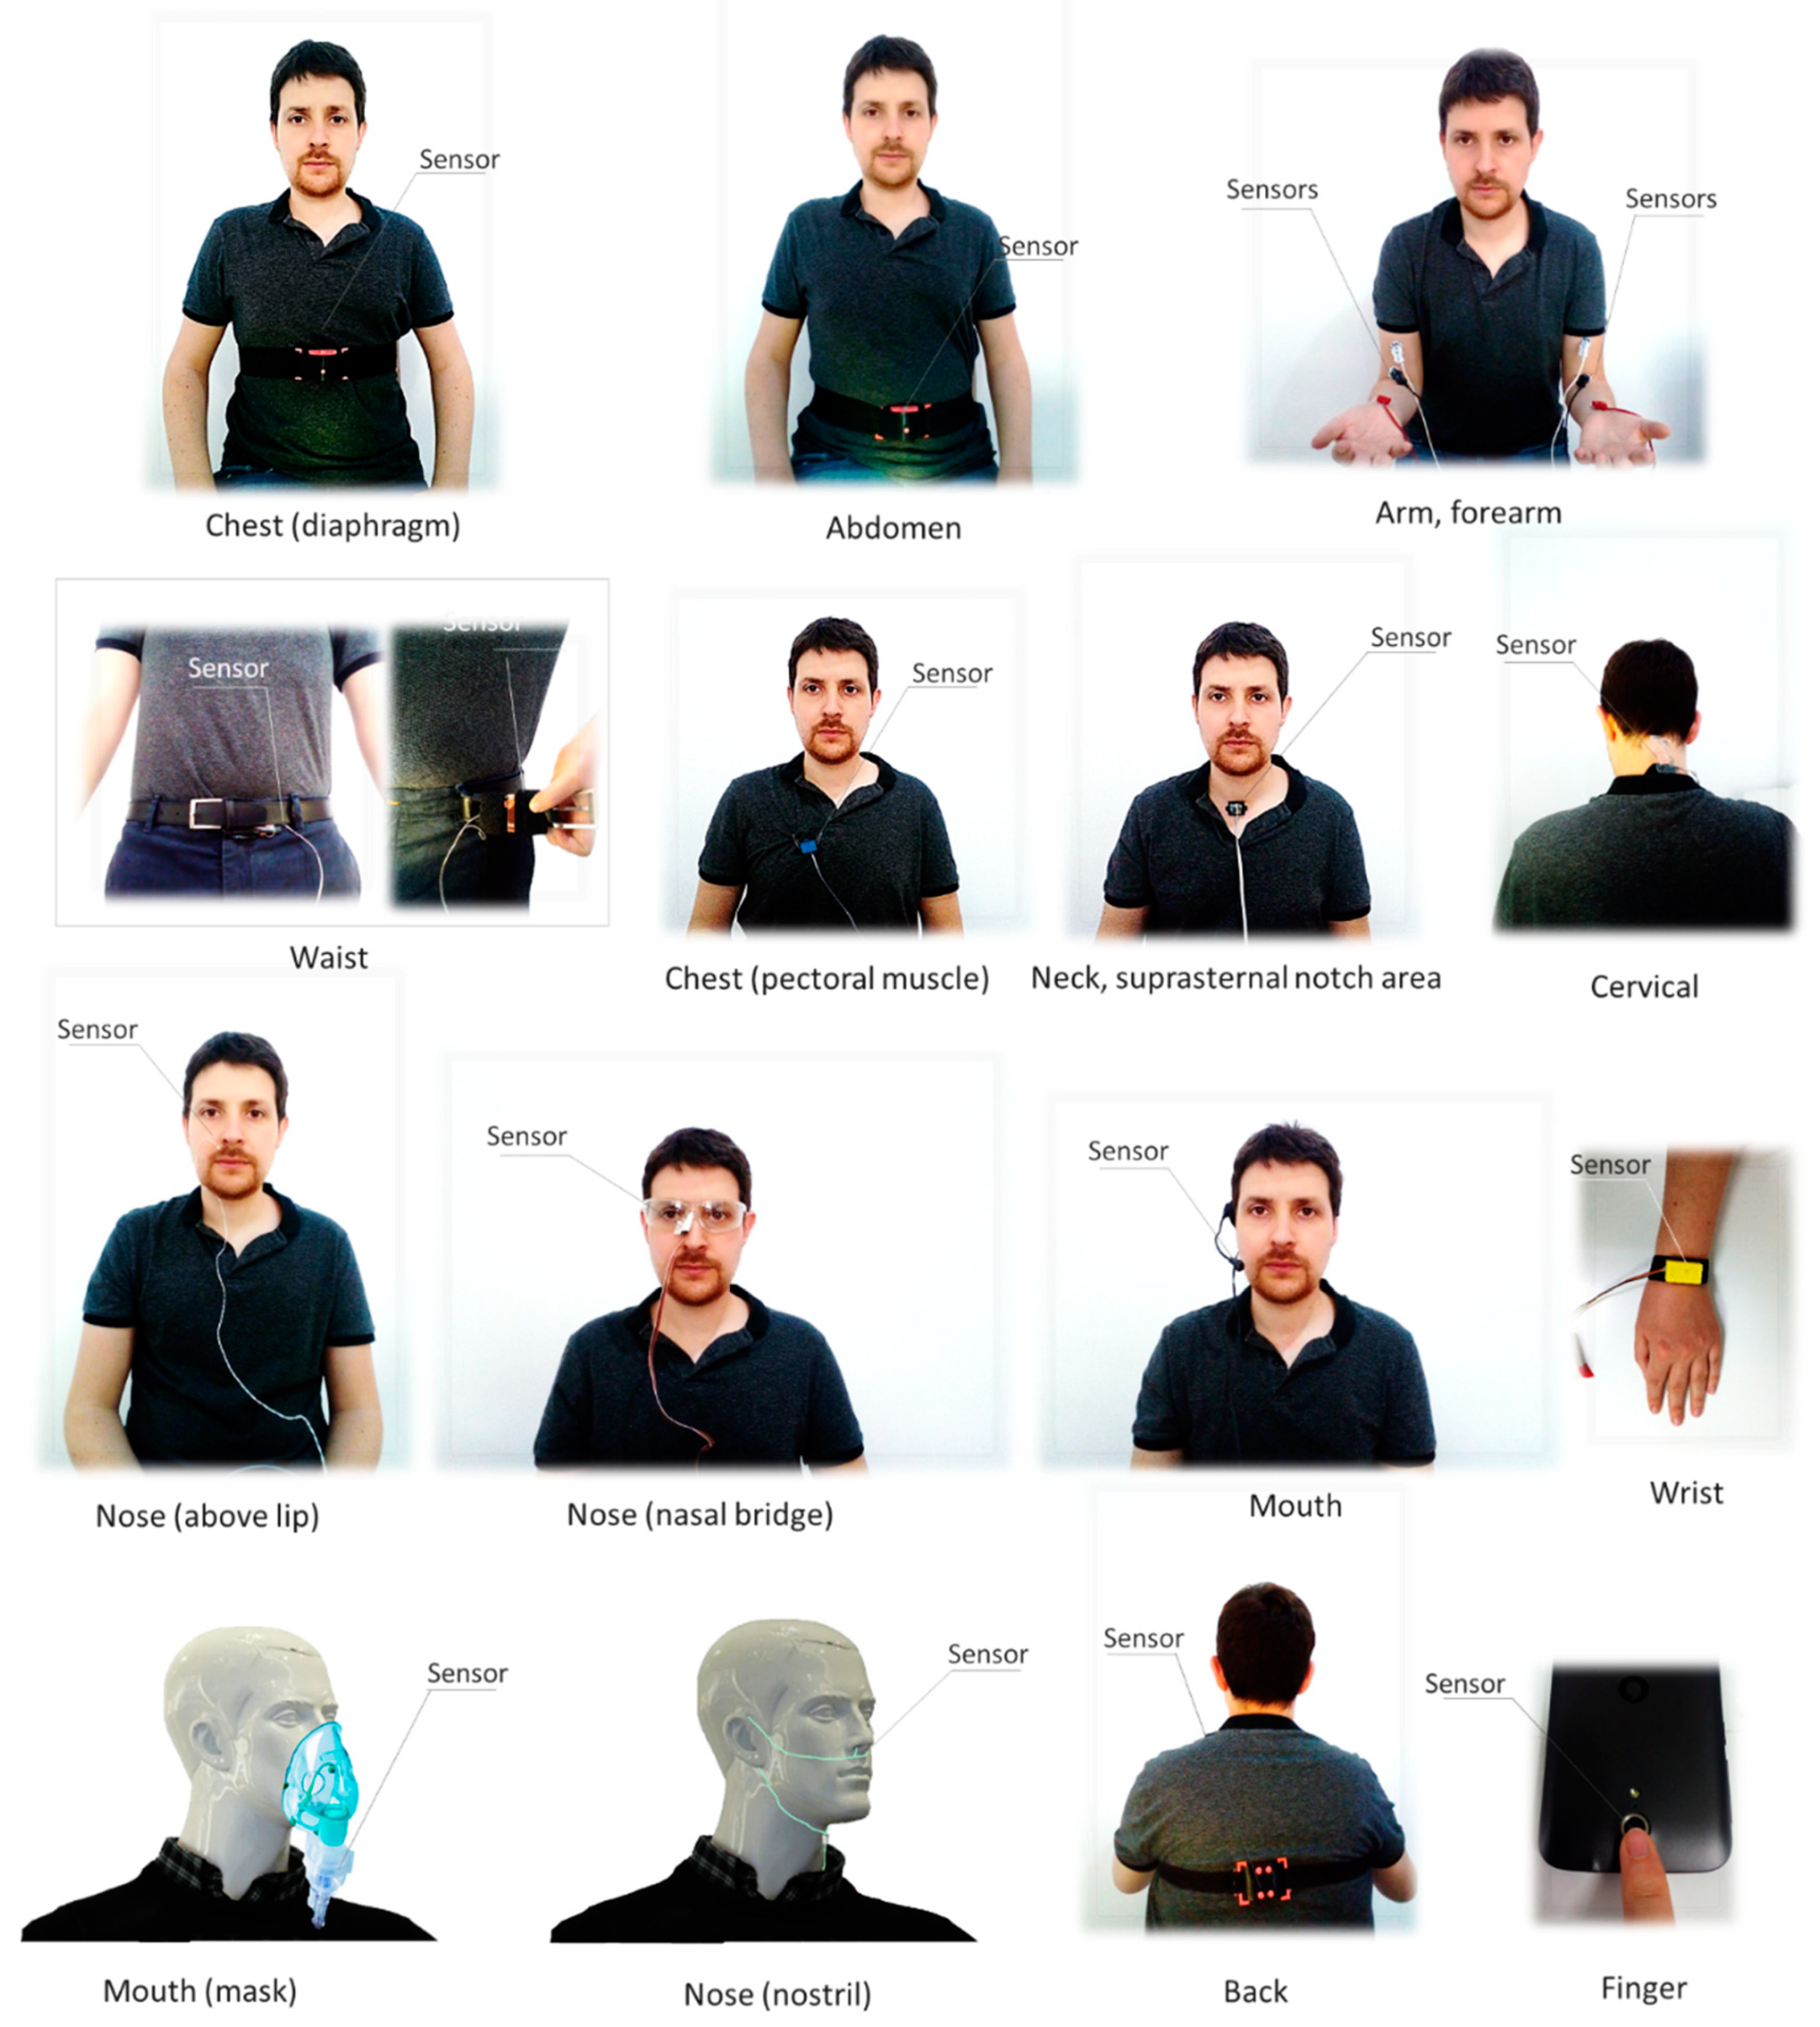
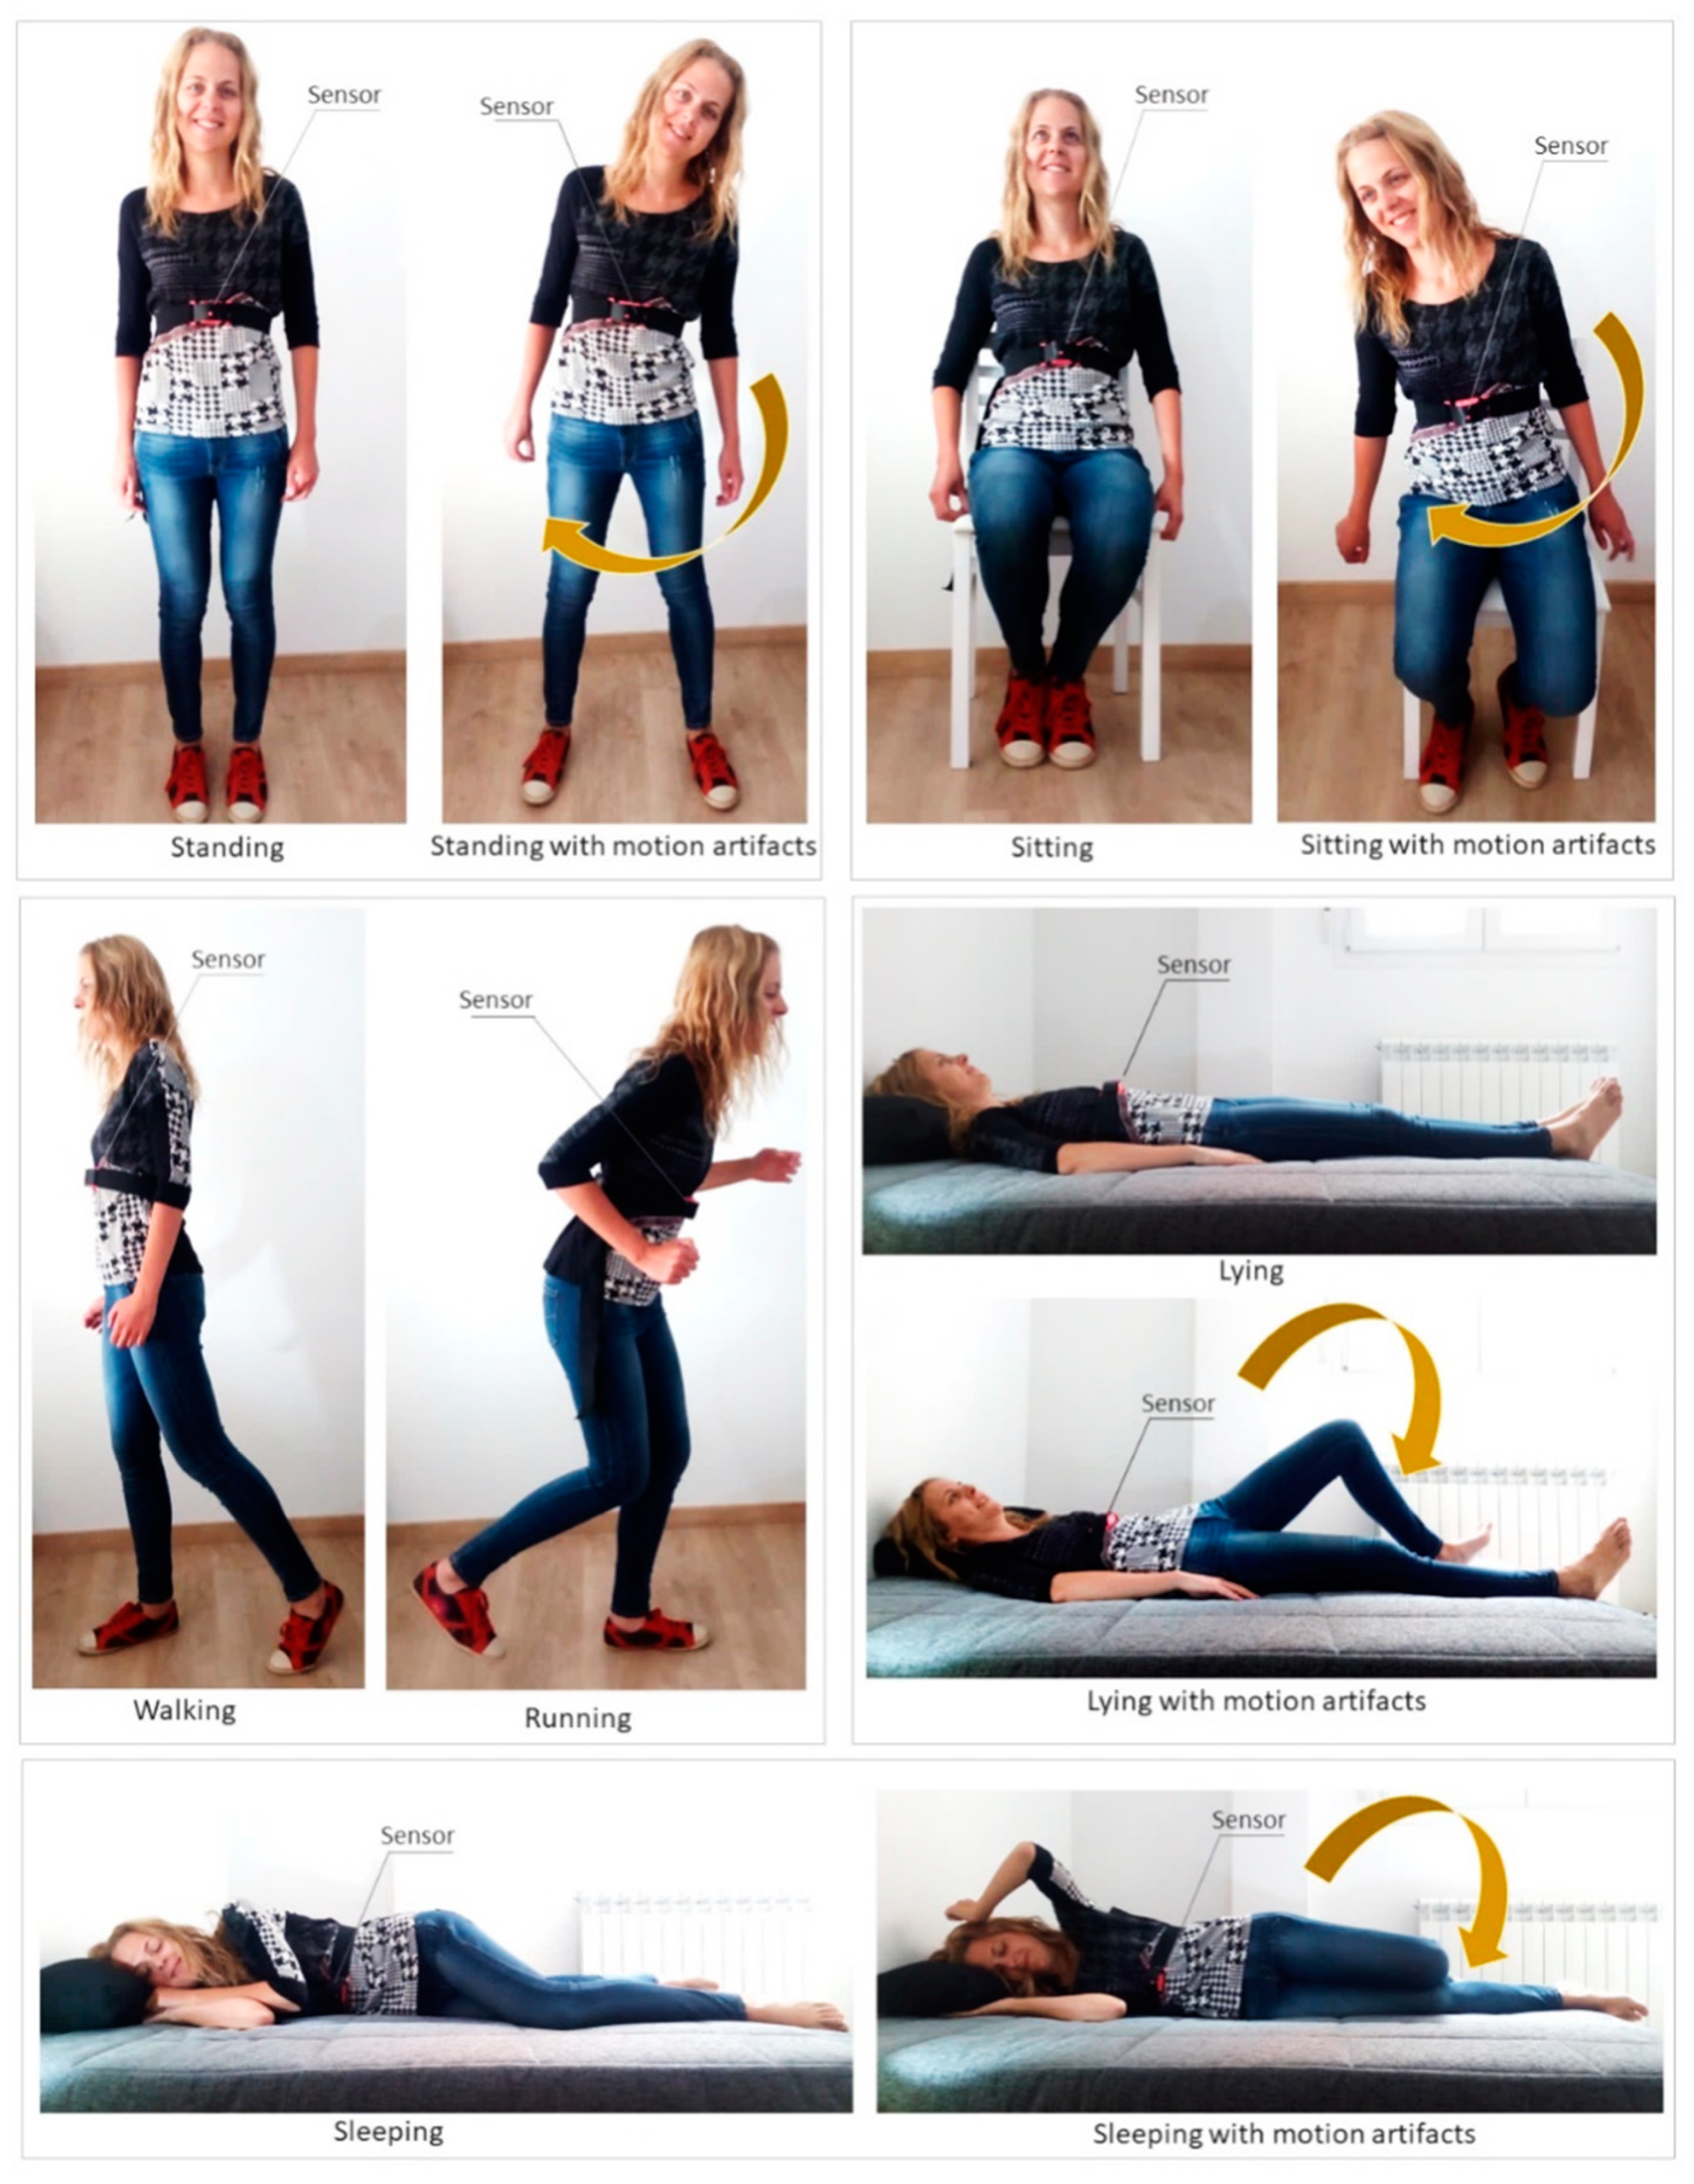
- Activities/positions: This item refers to the specific activities or positions that volunteers who participate in the tests are asked to perform as part of the validation experiments. The most common positions adopted in existing studies are represented in Figure 24 with an example sensor.
- Whether or not motion artifacts are included in the different activities.
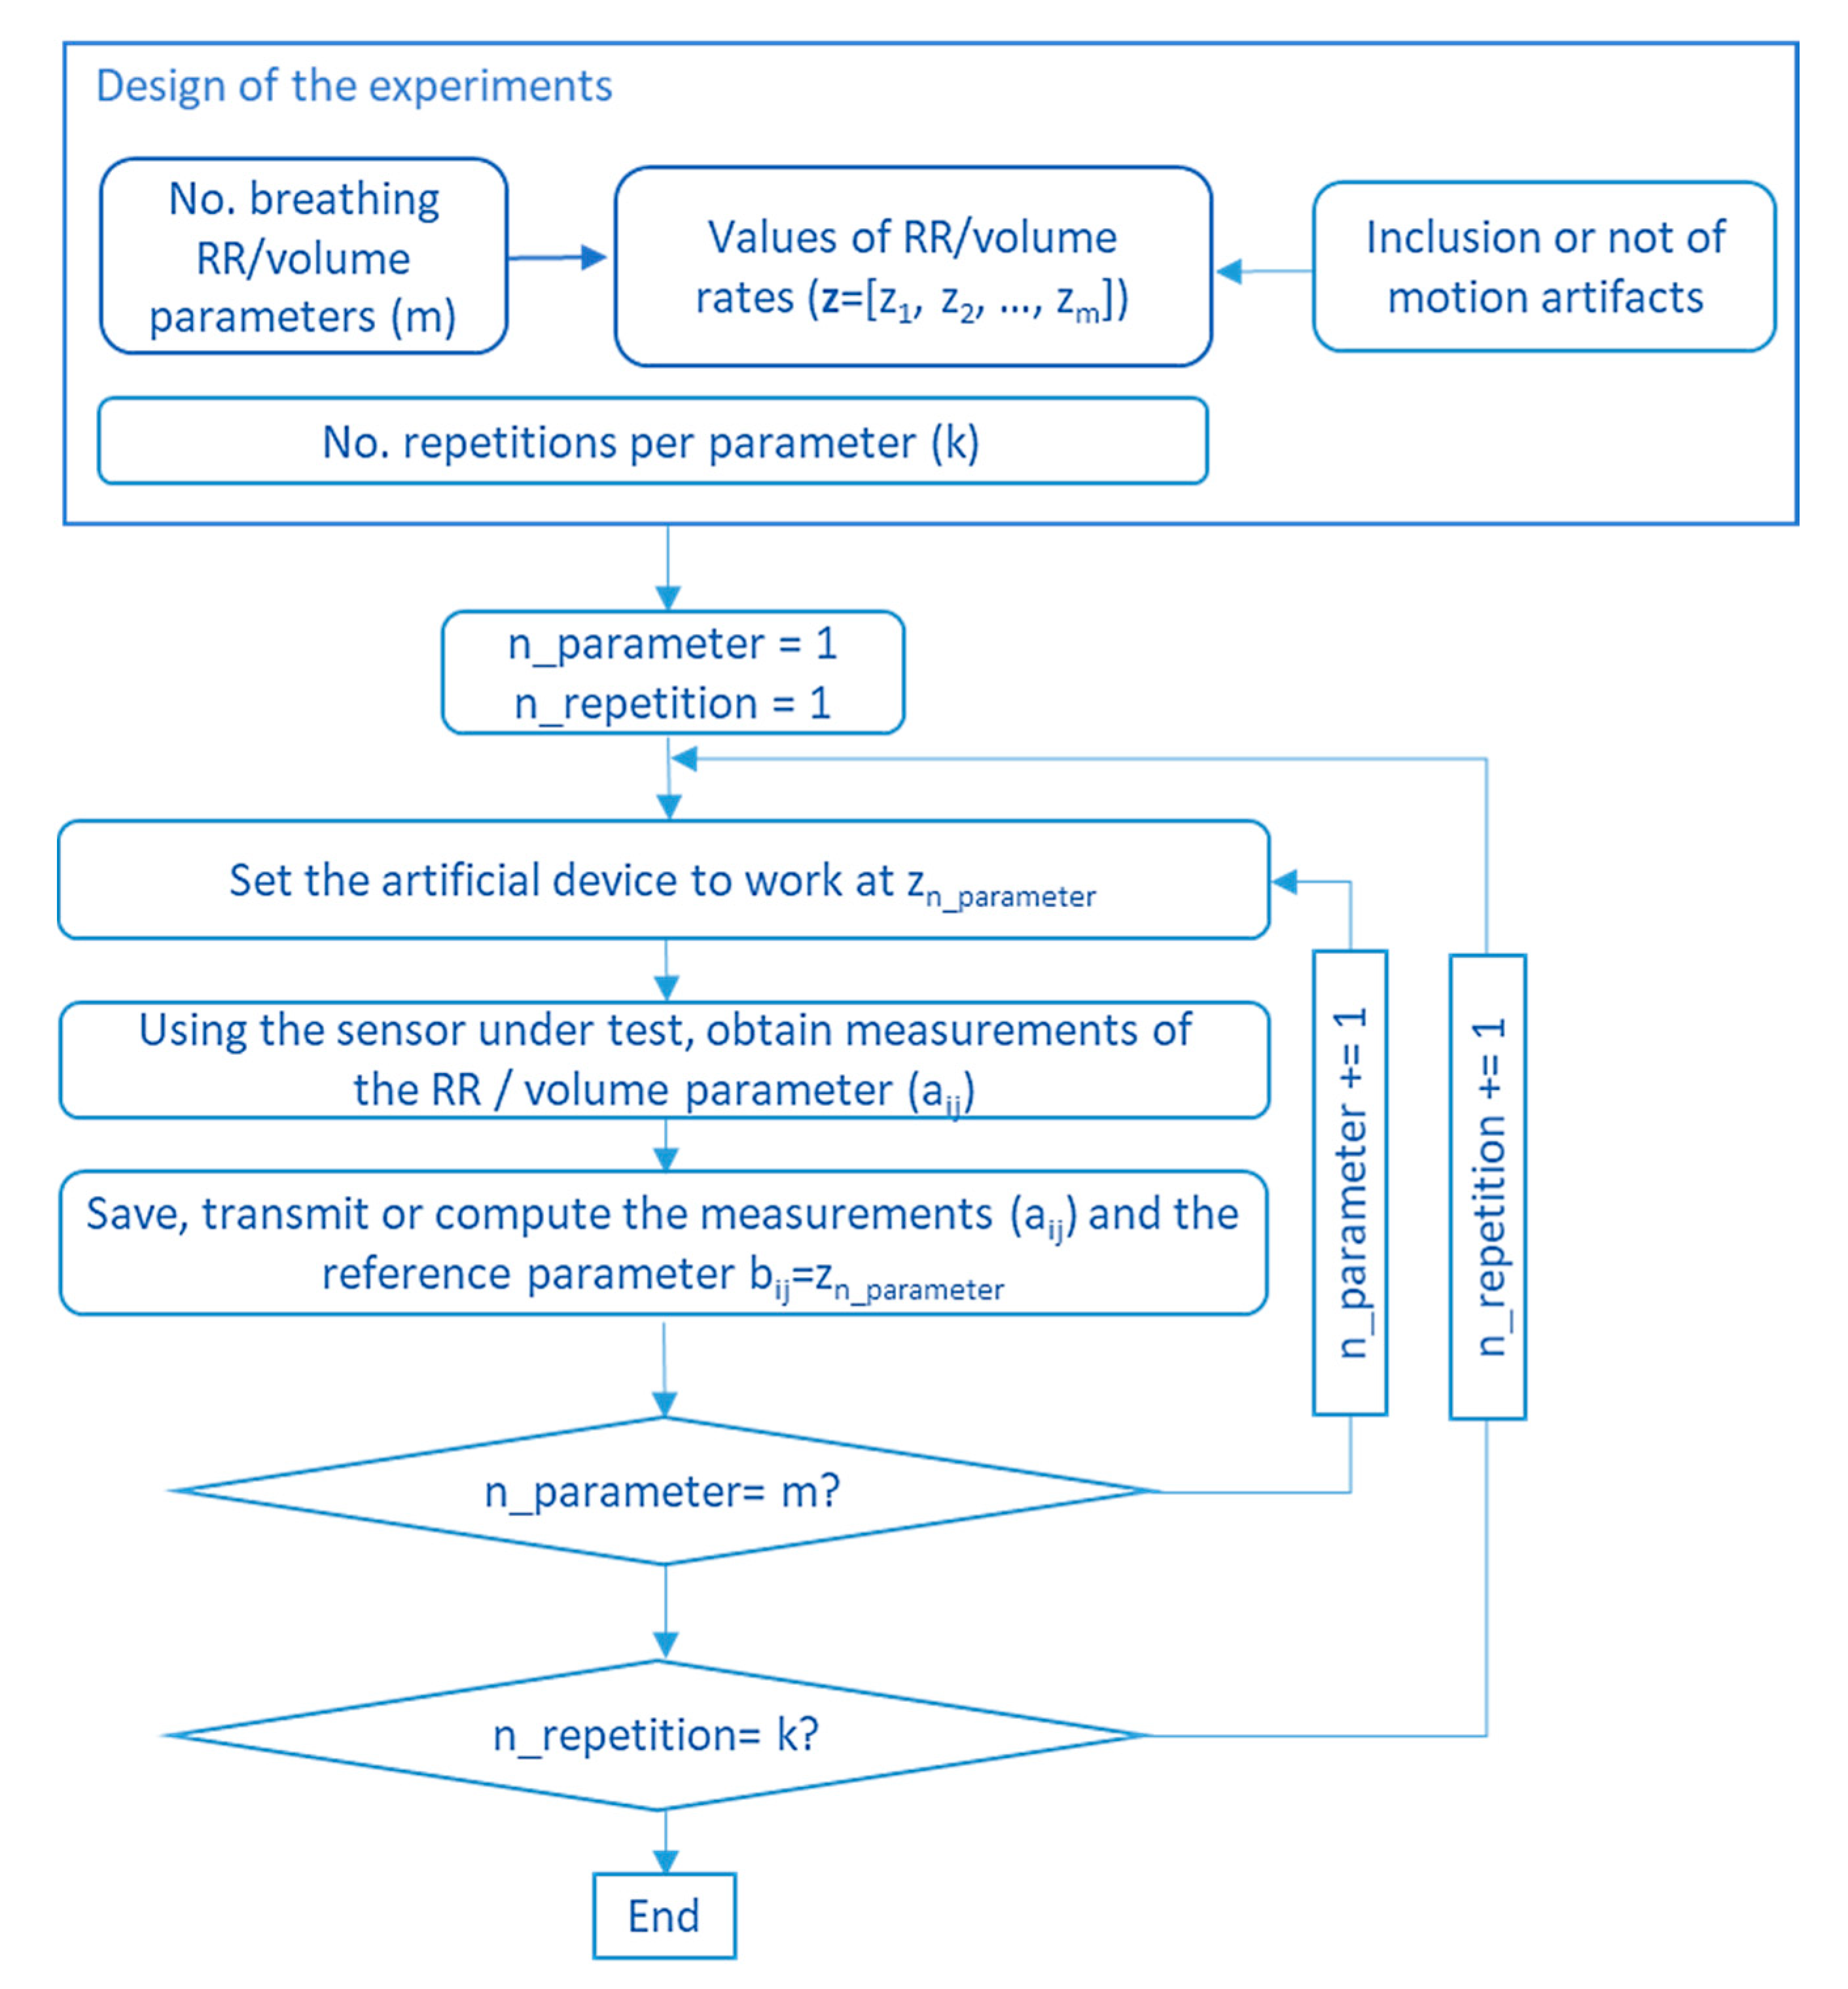
- Number and values of RRs or volume rates to be tested in the experiments.
- Number of repetitions of the different test scenarios.
- Duration: The designed tests (activities and positions, number of RRs or volume rates, and number of repetitions) determine the duration of the experiments.
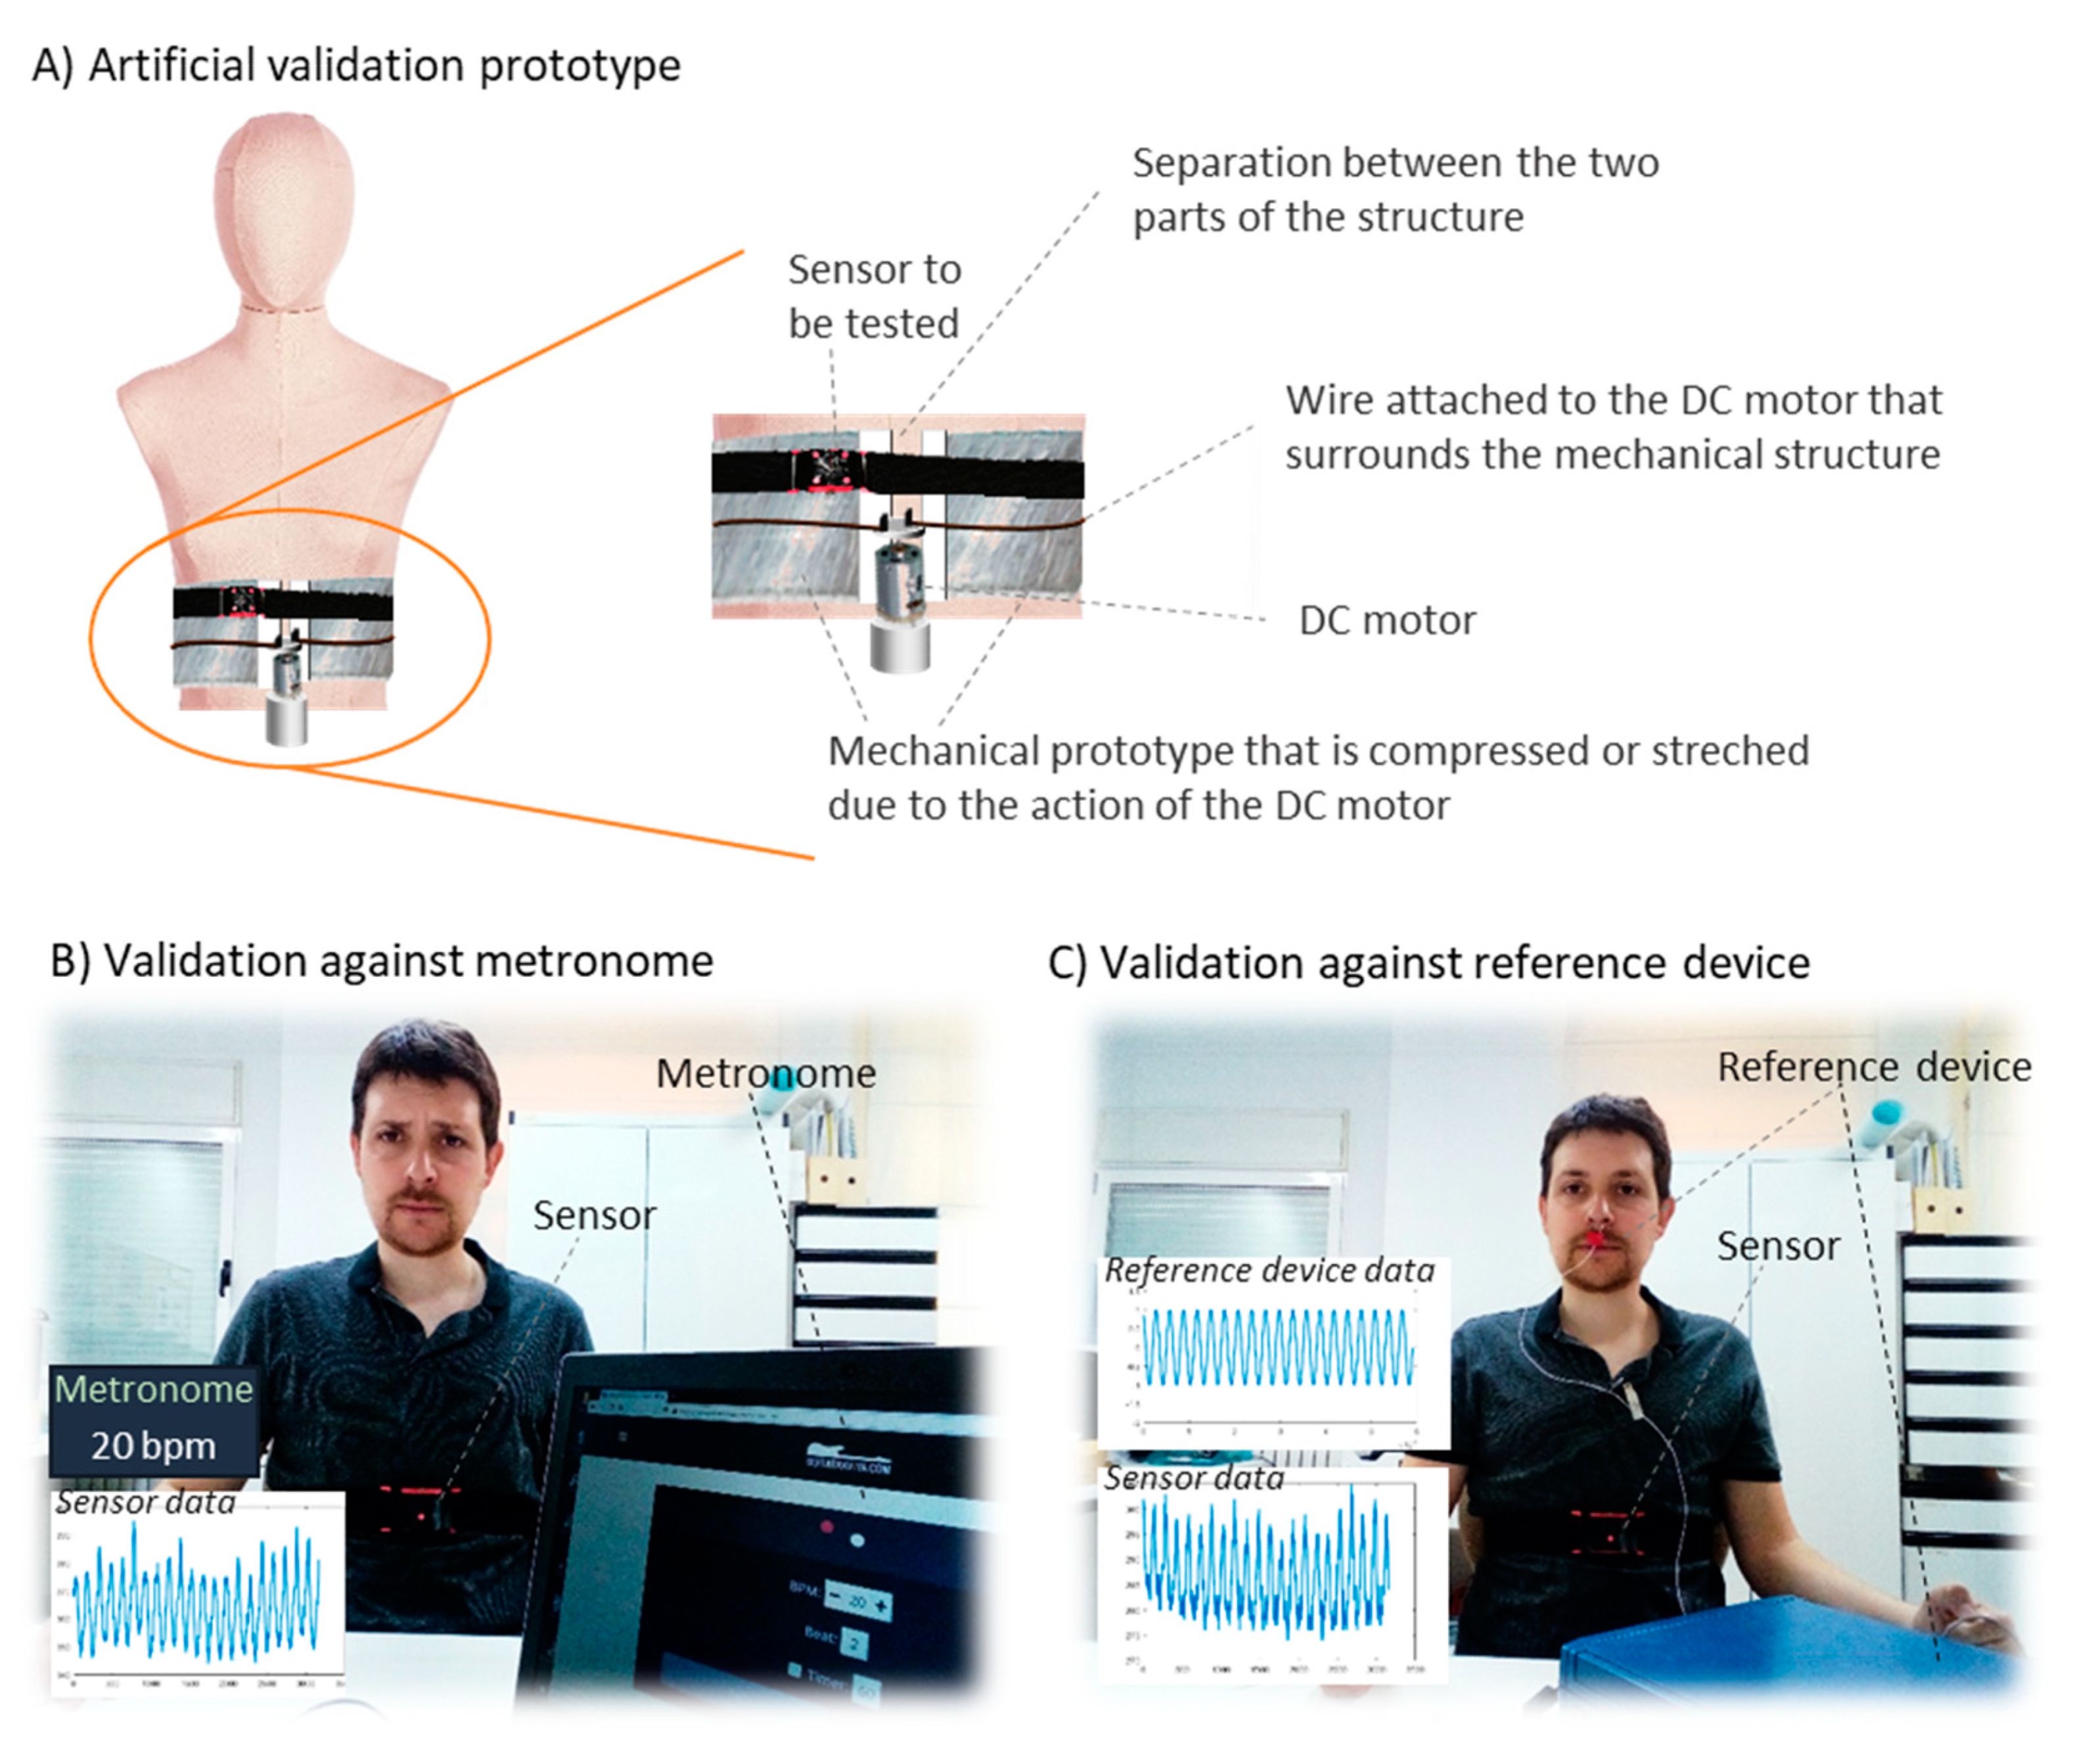
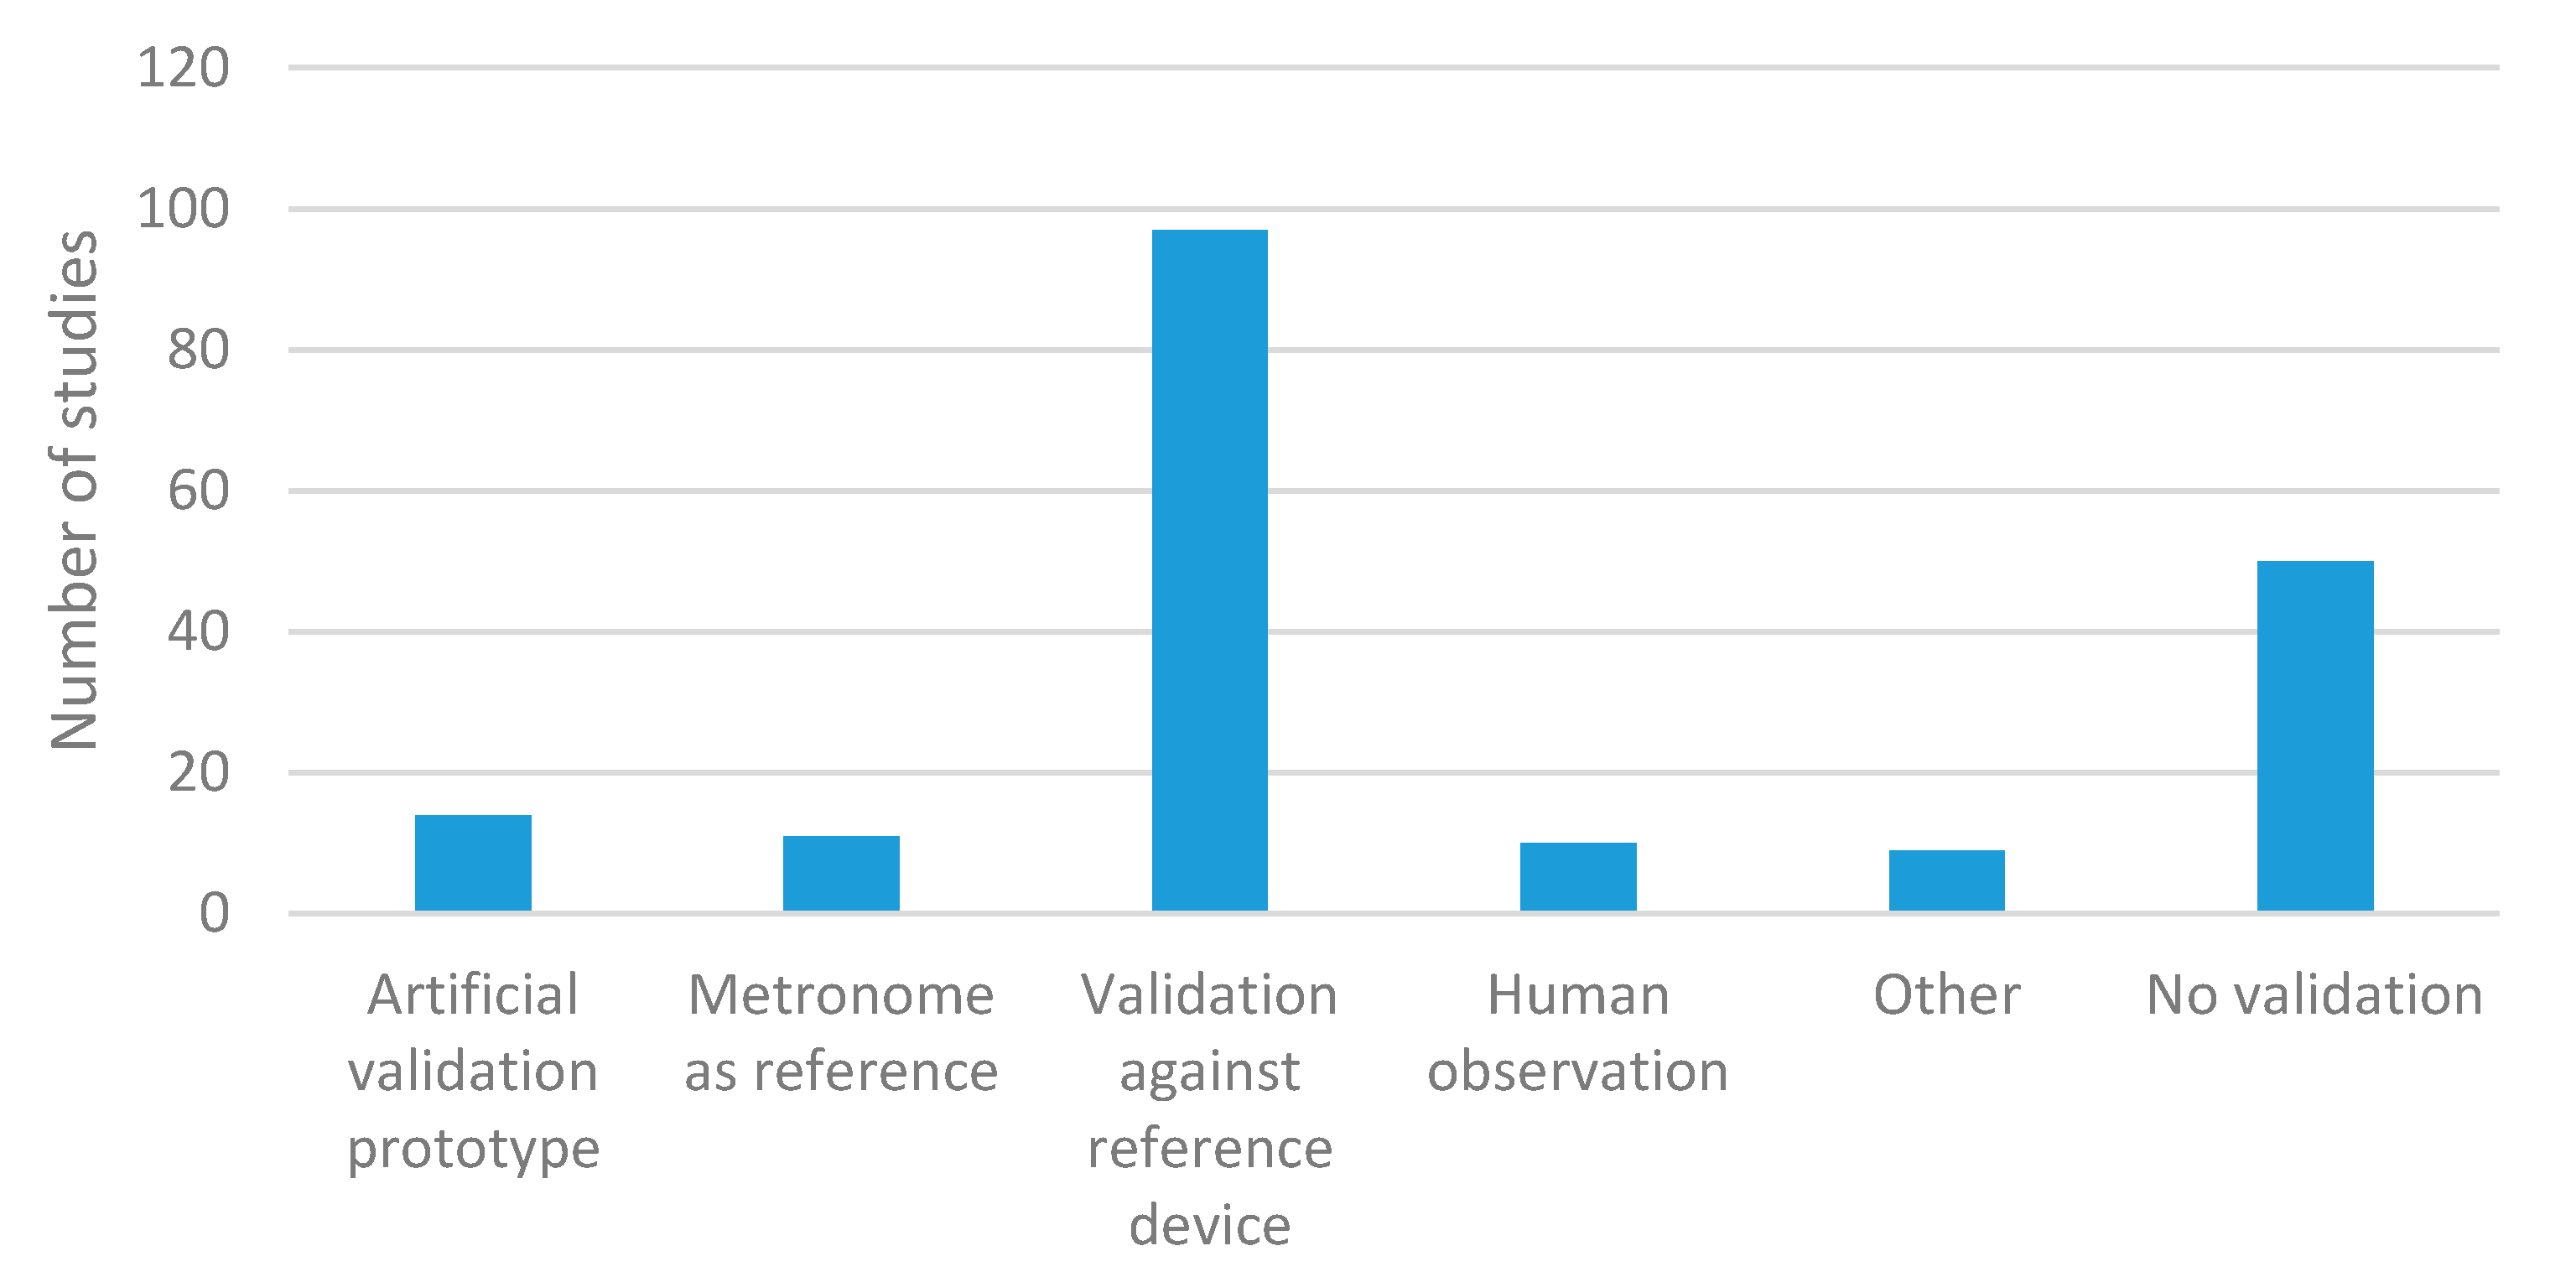
- Experiment design: This item refers to the strategies adopted to validate the breathing sensors. Three main methods have been found in the state of the art (Figure 25):
3.3.2. Results of the Analysis
3.4. Sensor Measurement Processing
3.4.1. Items of Analysis
Performance Evaluation
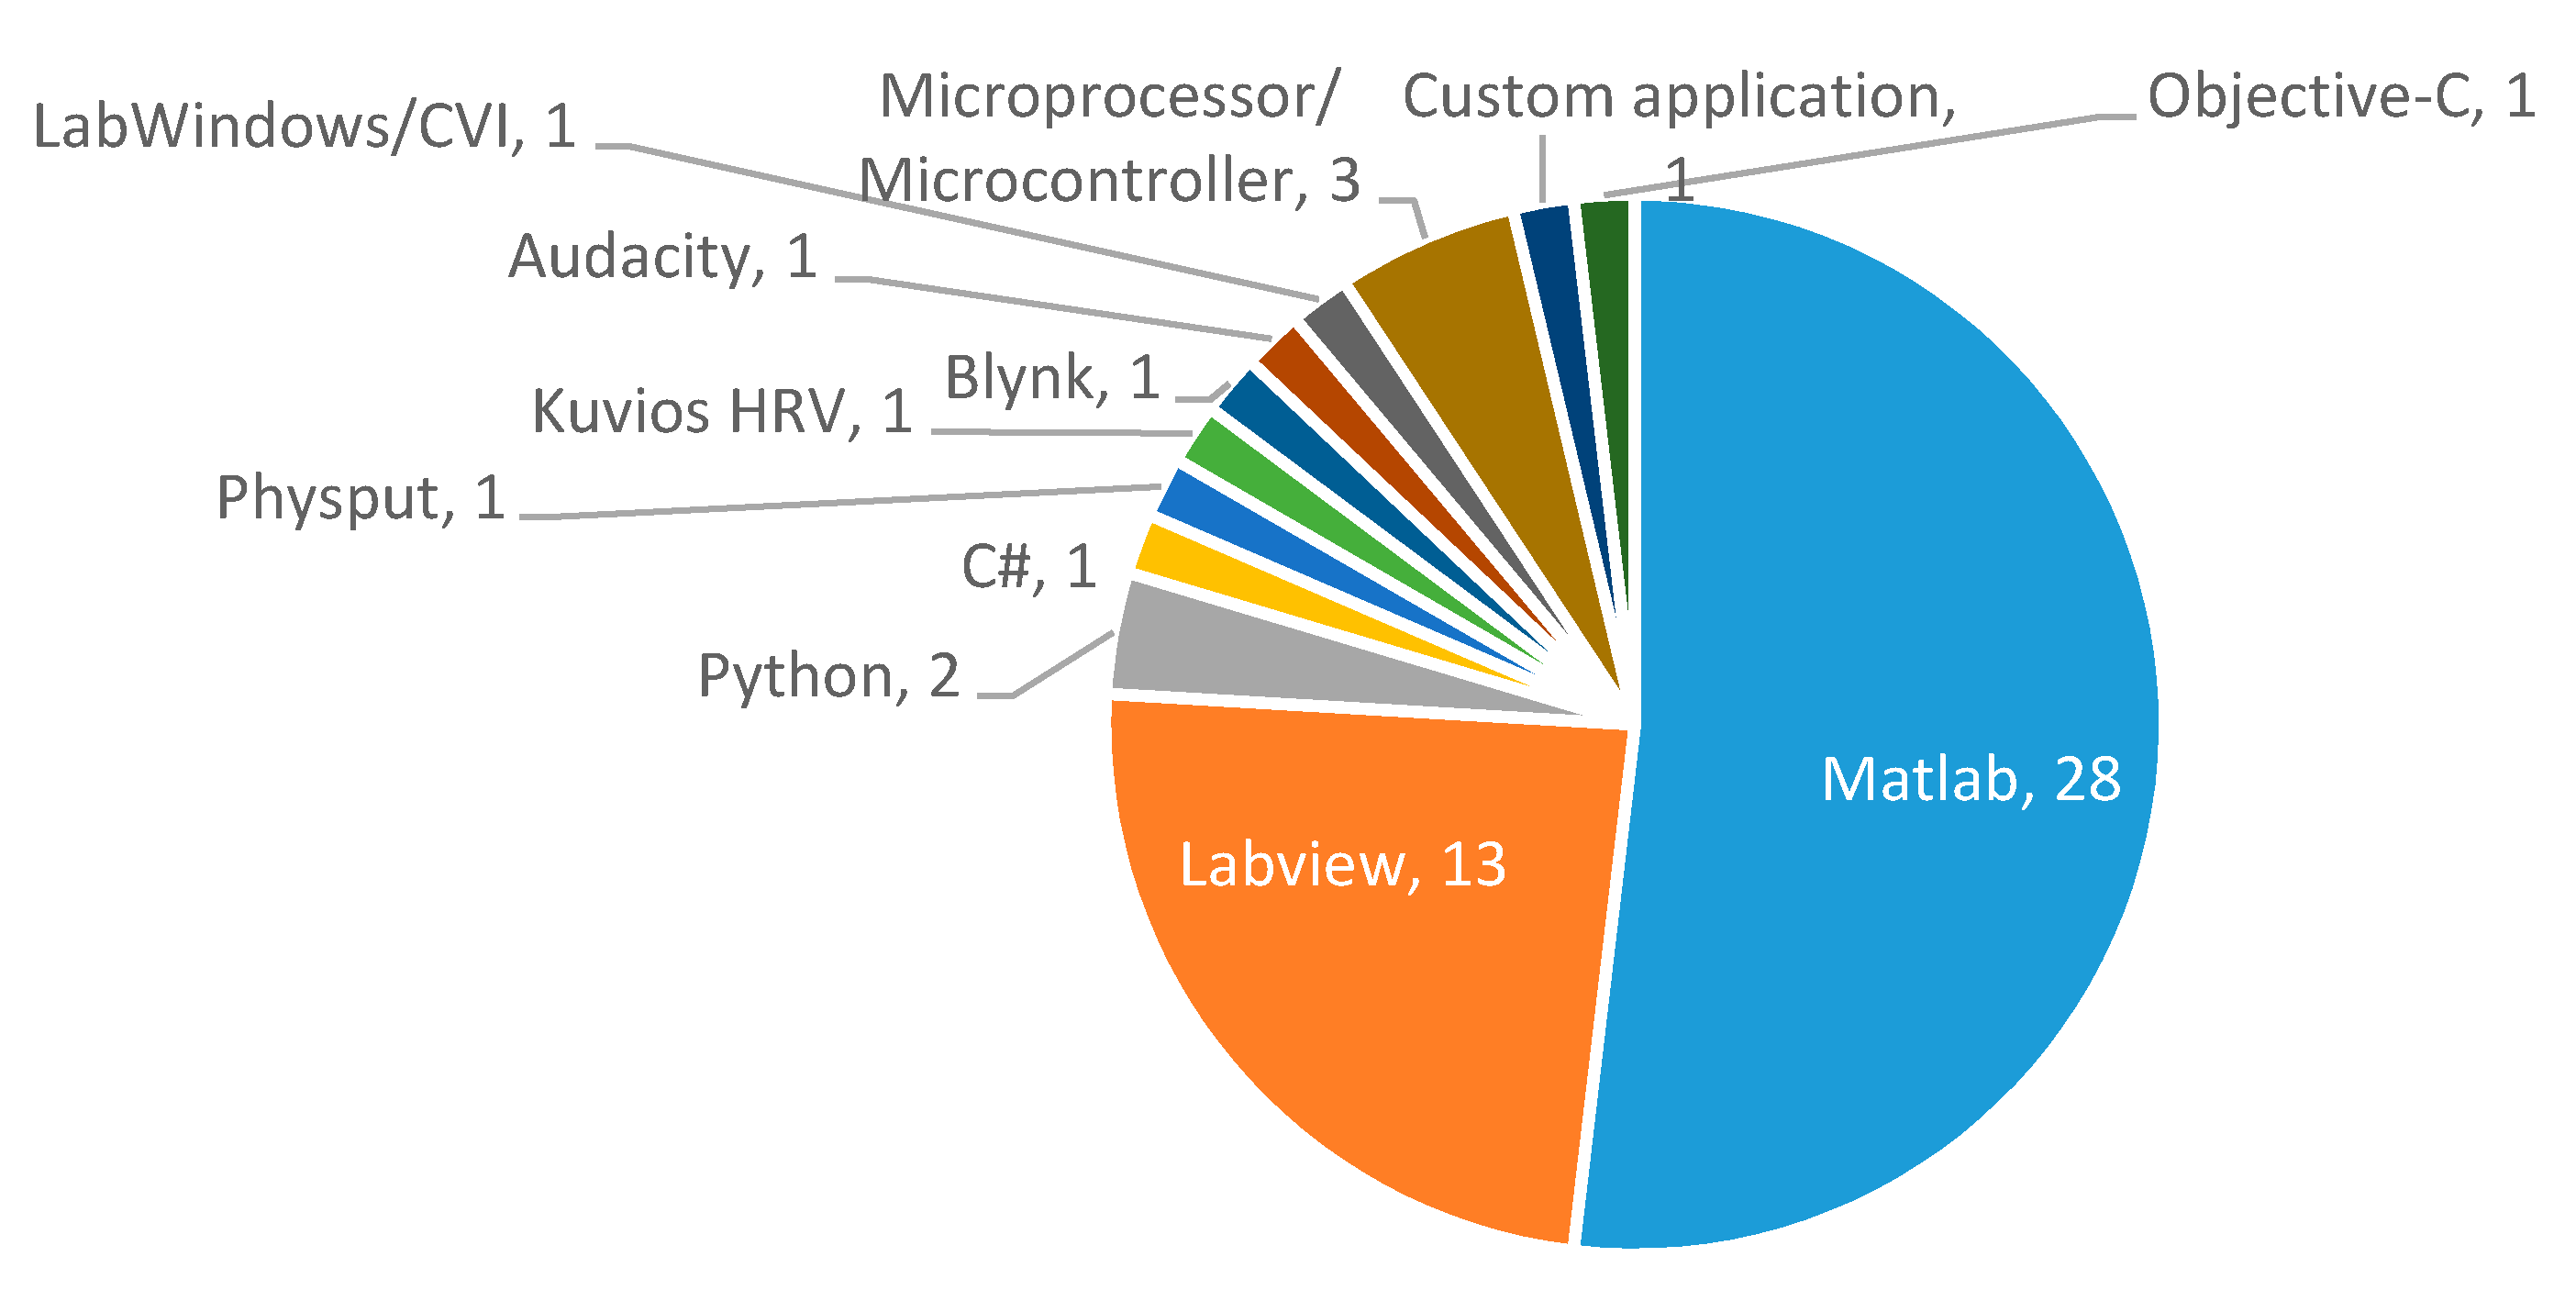
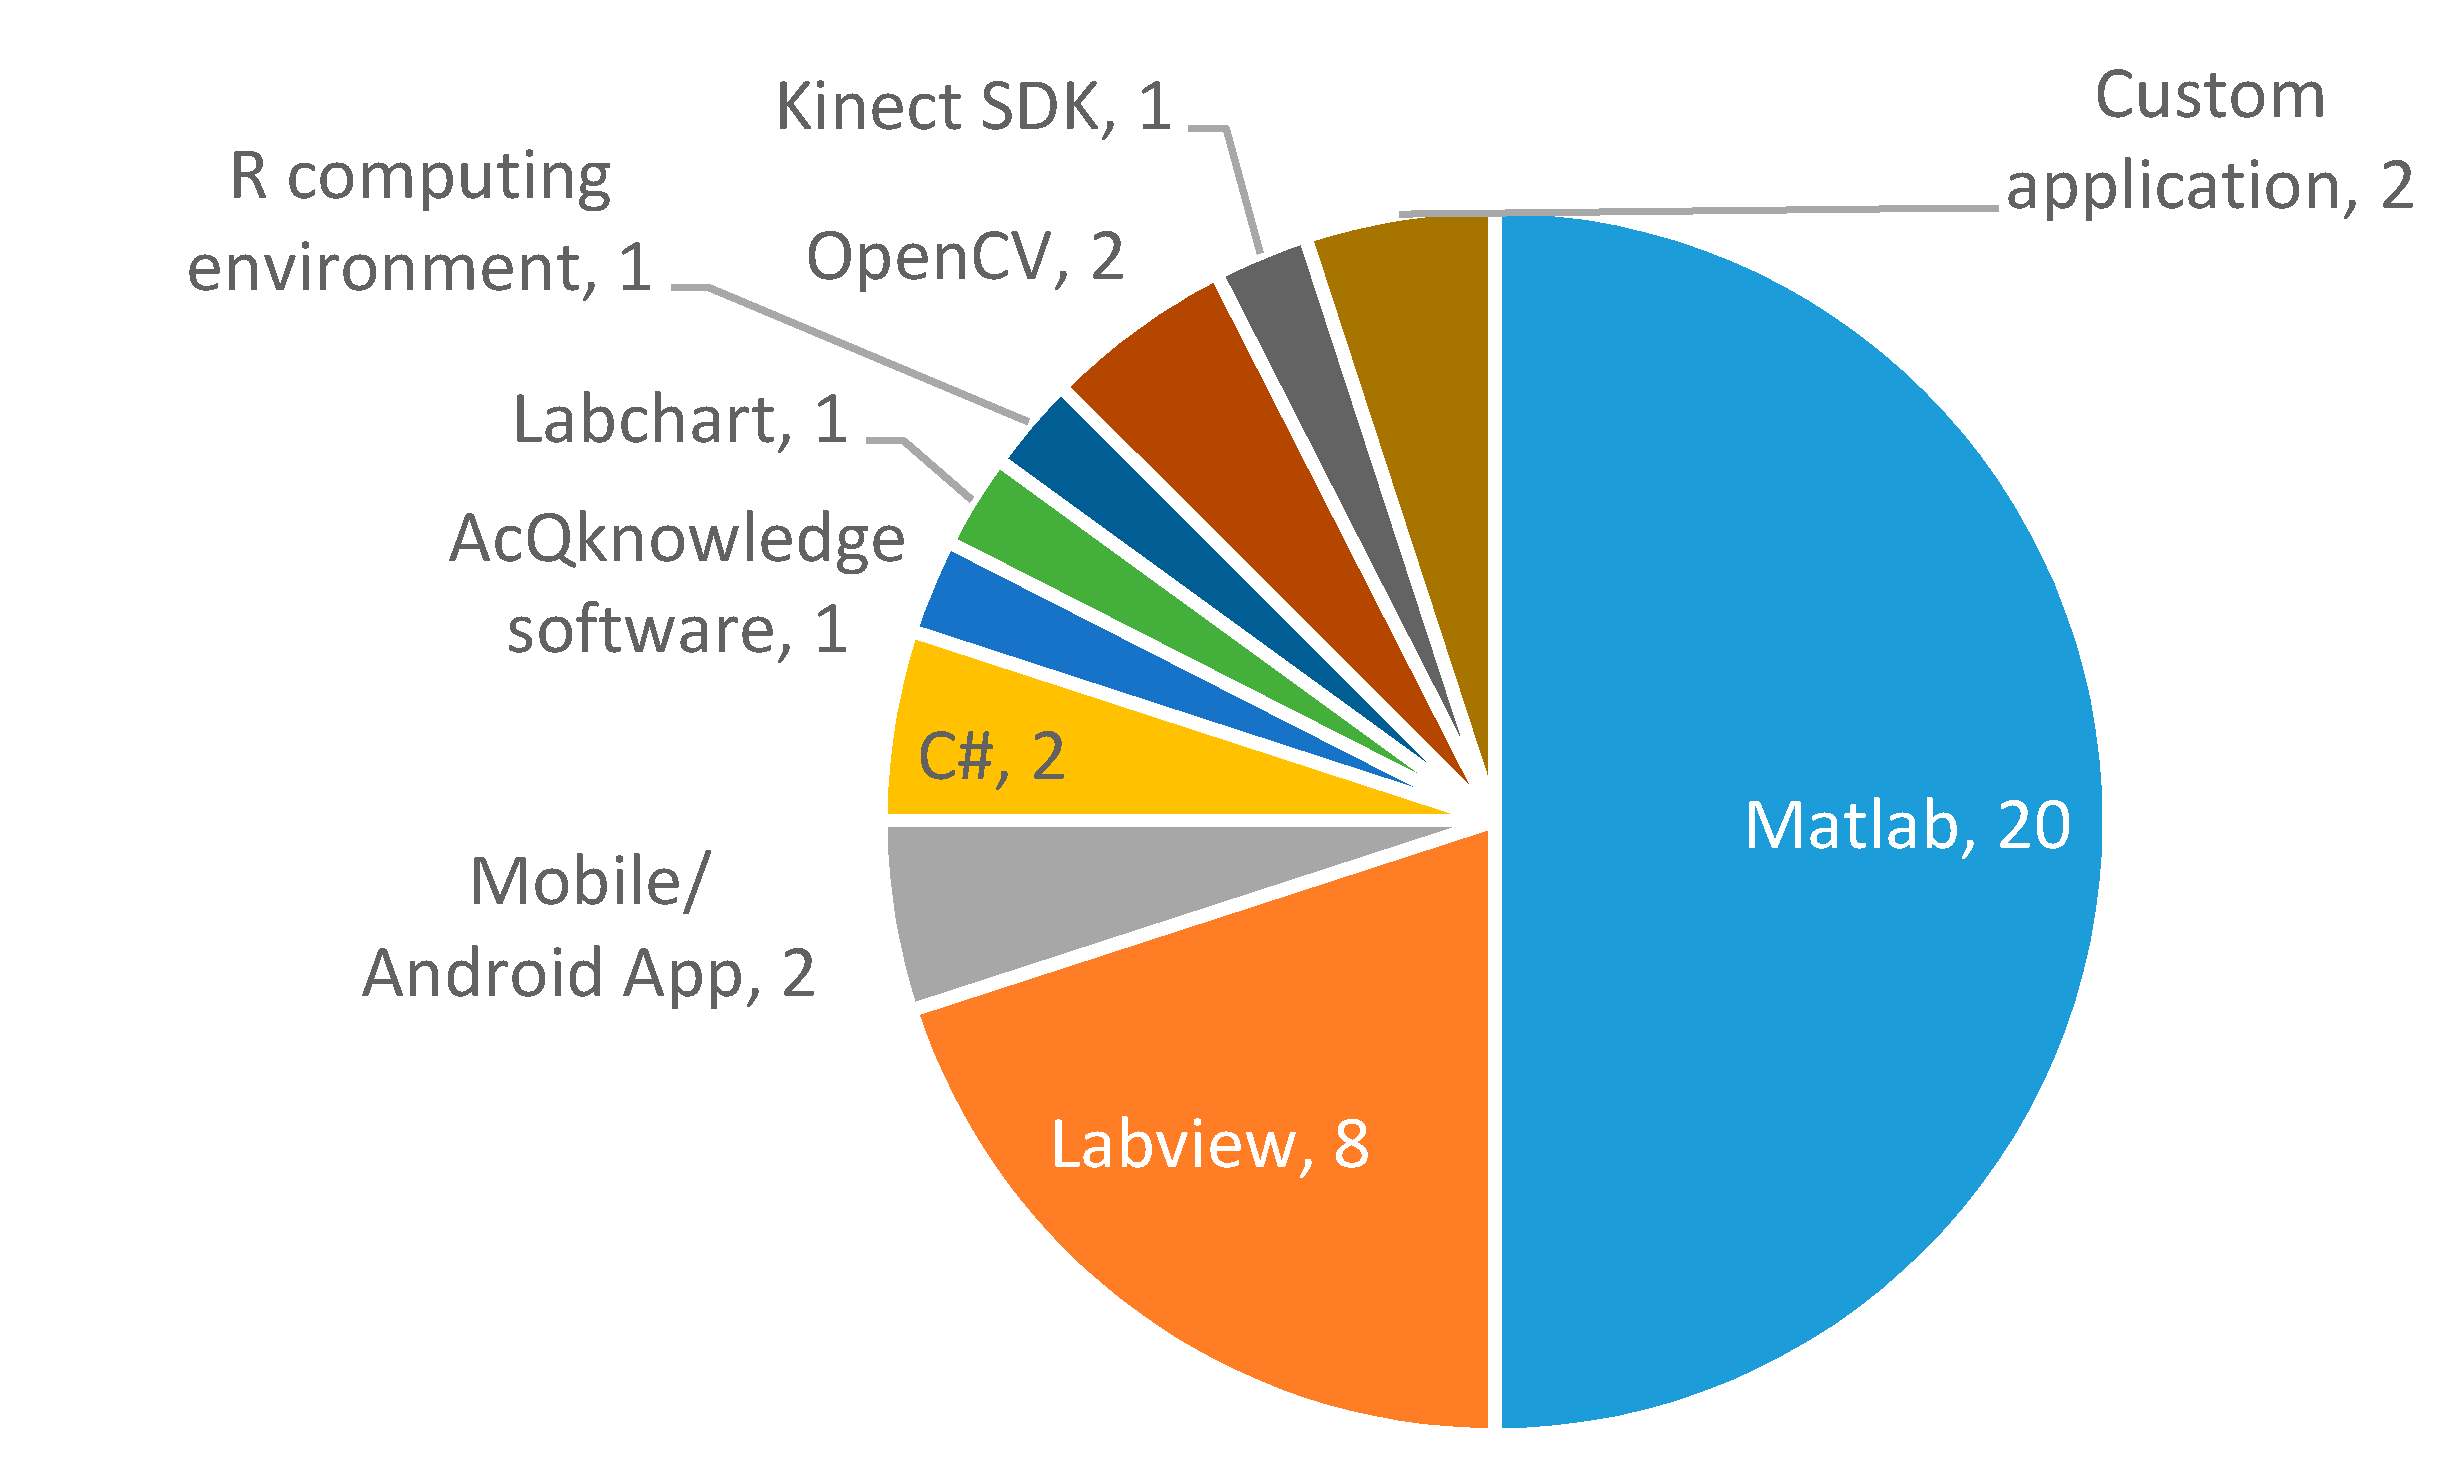
Analysis Software
- MATLAB: Popular numerical computing environment and programming language that is suitable for the implementation of algorithms, matrix operations, or data plotting, among others.
- Labview: System engineering software for applications that require testing, measurements, control, fast hardware access, and data information.
- Others: An extensive set of tools has been used in existing studies, such as Python (high-level, programming language specially focused on facilitating code readability), R (free software environment and programming language for statistical computing [260]), C# (general-purpose programming language developed by Microsoft [261]), C (general-purpose programming language that supports structured programming), OpenCV (open source software library for computer vision and machine learning [262]), Blynk (Internet of Things platform), Kubios HRV (heart rate variability analysis software for professionals and scientists), Audacity (free open-source audio software), Kinect SDK (suitable for developing gesture or voice recognition applications, using Kinect sensor technology [263]), LabChart (physiological data analysis and acquisition software [264]), Acqknowledge (software to measure, transform, replay and analyze data [265]), mobile/Android (mobile operating system), LabWindows/CVI (software development environment specially focused on measurement applications [266]), microcontroller/microprocessor (suitable if the processing is not done in any external software, but directly in the same microprocessor or microcontroller that controls the sensor), or custom applications (PC applications in which the native source could not be accurately determined).
Processing Algorithm
3.4.2. Results of the Analysis
4. Discussion
5. Conclusions
Author Contributions
Funding
Conflicts of Interest
Appendix A

| Study | Technique | Sensor | Measured Parameter | Location | Size |
|---|---|---|---|---|---|
| Agcayazi 2017 [123] | Chest wall movements | Capacitive | - | Chest (shirt) | - |
| Aileni 2017 [134] | Chest wall movements | Resistive | RR | Chest | - |
| Basra 2017 [145] | Air temperature | Pyroelectric | RR | Nose (nostril) | - |
| Bhattacharya 2017 [156] | Air temperature | Thermistor | RR | Mouth mask | - |
| Das 2017 [162] | Air temperature | Thermistor | - | Nose (near) Mouth (near) | - |
| Fajkus 2017 [83] | Chest wall movements | Fiber optic | RR | Chest | - |
| Gorgutsa 2017 [84] | Chest wall movements | Frequency shift | Monitoring of breathing | Chest (shirt) | - |
| Guay 2017 [85] | Chest wall movements | Frequency shift | Monitoring of breathing | Chest (shirt) | 20 × 10 cm |
| Kam 2017 [86,87,88] | Chest wall movements | Fiber optic | Monitoring of breathing | Chest | - |
| Kano 2017 [89] | Air humidity | Nanocrystal and nanoparticles | - | Nose (near) Mouth (near) | - |
| Koch 2017 [90] | Chest wall movements | Resistive | Monitoring of breathing | Abdomen | - |
| Milici 2017 [91] | Air temperature | Thermistor | RR Monitoring of respiratory diseases | Nose (near) Mouth (near) | - |
| Nakazumi 2017 [92] | Respiratory air flow | Photoelectric | Monitoring of breathing | Mouth mask (diving) | - |
| Park 2017 [93] | Abdomen movements | Capacitive | Monitoring of breathing | Waist | 20 × 10 × 1 mm (electrode) |
| Presti 2017 [94] | Chest wall movements | Fiber optic | RR Respiratory period | Chest and abdomen (shirt, front and back) | 1.5 cm |
| Valipour 2017 [95] | Respiratory sounds | Microphone | RR | Nose (near) Mouth (near) | - |
| White 2017 [96] | Chest wall movements | Capacitive | RR | Chest (below left pectoral muscle) | - |
| Yan 2017 [97] | Air humidity | Nanocrystal and nanoparticles | Monitoring of breathing | Mouth (4 cm away) | 5 × 2 × 1 mm |
| Mahbub 2016–2017 [98,99] | Chest wall movements | Piezoelectric | RR | Chest | 1.6 × 1.6 cm |
| Chethana 2016 [100] | Chest wall movements | Fiber optic | RR | Chest (interspace of pulmonic area) | |
| Güder 2016 [101] | Air humidity | Nanocrystal and nanoparticles | Monitoring of breathing | Mouth mask | - |
| Lepine 2016 [102] | Chest wall movements | Accelerometer ECG | RR | Chest | - |
| Massaroni 2016 [103] | Chest wall movements | Fiber optic | Respiratory period | Chest and abdomen (textile) | 1 cm |
| Massaroni 2016 [49] | Chest wall movements | Fiber optic | RR TV Compartmental volume | Chest and abdomen (shirt) | 10 × 10 cm |
| Moradian 2016 [104] | Air temperature | Pyroelectric | Monitoring of breathing | Nose (below) | - |
| Nag 2016 [105] | Chest wall movements | Capacitive | Monitoring of breathing | Chest (diaphragm) | 50 mm2 |
| Nam 2016 [106] | Respiratory sounds | Microphone | RR | Nose (near) Mouth (near) | - |
| Raji 2016 [107] | Air temperature | Thermistor | RR Monitoring of respiratory diseases | Mouth mask | - |
| Ramos-García 2016 [108] | Chest wall movements | Resistive | RR | Chest (shirt) | 23 × 4 cm |
| Rotariu 2016 [109] | Chest wall movements | Piezoelectric | RR Monitoring of respiratory diseases | Chest | - |
| Atalay 2015 [110] | Chest wall movements | Resistive | RR | Chest Abdomen | 2.7 × 9.3 cm |
| Ciocchetti 2015 [111] | Chest wall movements | Fiber optic | TV | Chest | - |
| Estrada 2015 [112] | Chest wall movements | Accelerometer | RR | Chest | - |
| Gargiulo 2015 [113] | Chest wall/ abdomen movements | Resistive | TV | Chest and abdomen (shirt) | 5 × 7cm (4 units) |
| Grlica 2015 [114] | Chest wall movements | Capacitive | - | Chest | 4.5 × 1.7 cm |
| Hernandez 2015 [115] | Chest wall movements | Accelerometer Gyroscope | RR | Wrist | - |
| Jiang 2015 [116] | Air temperature | Pyroelectric | MV, peak inspiratory flow, RR, TV | Nose (below) | 5 × 25 × 100 mm |
| Karlen 2015 [117] | Modulation cardiac activity | PPG | RR | Finger (on sensor) | - |
| Kazmi 2015 [118] | Modulation cardiac activity | PPG | RR | Finger (on sensor) | - |
| Metshein 2015 [21] | Modulation cardiac activity | ECG | RR | Chest (electrode shirt) | 8 × 17cm (electrode surface) |
| Teichmann 2015 [119] | Chest wall movements | Transthoracic impedance | RR | Chest (pocket of shirt) | 10 × 8 cm |
| Wei 2015 [120] | Air temperature | Other (micro electro-mechanical sensor) | Respiration detection | Nose (5 cm away) | 1.8 × 2.4 mm |
| Yang 2015 [3] | Chest wall movements | Fiber optic | RR | Chest | 70 cm (belt) |
| Bifulco 2014 [121] | Chest wall movements | Piezoelectric | Monitoring of breathing | Chest | - |
| Fekr 2014 [122] | Chest wall movements | Accelerometer | RR TV | Chest (middle sternum region) | - |
| Hesse 2014 [124] | Chest wall movements | Resistive | RR | Chest | 3 × 1.96 × 2.8 cm |
| Krehel 2014 [125] | Chest wall movements | Fiber optic | RR | Chest (different regions) | - |
| Min 2014 [126] | Chest wall movements | Capacitive | RR | Waist | 83 × 3.86 × 0.135 cm |
| Petrovic 2014 [127] | Chest wall movements | Fiber optic | MV TV | Chest (lower third of the thorax) | - |
| Sanchez 2014 [128] | Air temperature | Fiber optic | Monitoring of breathing | Nose (near) Mouth (near) | - |
| Wo 2014 [129] | Abdomen movements | Fiber optic | RR | Abdomen | - |
| Yang 2014 [130] | Chest wall movements | Capacitive | RR | Chest Abdomen | 10 × 1 cm |
| Yoon 2014 [131] | Chest wall movements | Accelerometer Gyroscope | RR | Chest | - |
| Chan 2013 [132] | Chest wall movements Modulation cardiac activity | Accelerometer ECG | RR | Chest | - |
| Huang 2013 [133] | Air temperature | Pyroelectric | RR | Nose (near) Mouth (near) | - |
| Kundu 2013 [161] | Chest wall/ abdomen movements | Capacitive | RR | Chest and abdomen (anterior and posterior region) | 9 × 13 cm 16 × 16 cm 5 × 5 cm |
| Padasdao 2013 [135] | Chest wall movements | DC generator | RR | Chest | Coin size |
| Cao 2012 [2] | Air temperature | Pyroelectric | RR, MV, peak inspiration flow, TV | Nose (near) Mouth (near) | 7 × 4.5 × 1.8 cm |
| Chiu 2012 [136] | Chest wall movements | Piezoelectric | RR | Chest | 48 × 19 × 4 mm |
| Favero 2012 [137] | Air humidity | Nanocrystal and nanoparticles | Monitoring of breathing | Mouth mask (3 cm from nose) | |
| Mathew 2012 [138] | Air humidity | Nanocrystal and nanoparticles | Monitoring of breathing | Nose (5 cm away) | 1 mm length |
| Scully 2012 [139] | Modulation cardiac activity | PPG | RR | Finger (on sensor) | - |
| Trobec 2012 [140] | Modulation cardiac activity | ECG | RR | Chest (different regions) | - |
| Witt 2012 [141] | Chest wall movements | Fiber optic | Monitoring of breathing | Chest | 1 cm (elastic part) |
| Zieba 2012 [142] | Chest wall movements | Resistive | RR | Chest (shirt) | - |
| Carlos 2011 [143] | Chest wall movements | Resistive | RR Coughing events | Chest and abdomen (shirt) | 5.3 × 3.2 cm |
| Ciobotariu 2011 [144] | Chest wall movements | Piezoelectric | RR Monitoring of respiratory diseases | Chest | 28 cm |
| Guo 2011 [146] | Chest wall movements | Resistive | RR | Chest | 10 × 0.25 cm |
| Hoffmann 2011 [17] | Chest wall movements | Capacitive | Respiration pattern TV (among others) | Chest | 3 × 3 cm |
| Liu 2011 [147] | Chest wall movements | Resistive | RR, MV | Abdomen | - |
| Liu 2011 [148] | Abdomen movements | Accelerometer | RR | Abdomen | 23 mm diameter |
| Mann 2011 [149] | Chest wall movements | Accelerometer | RR Respiratory disease monitoring | Neck (Midclavicular line and lower costal margin intersection) | - |
| Ono 2011 [150] | Chest wall movements | Accelerometer | RR | Chest | - |
| Silva 2011 [151] | Chest wall movements | Fiber optic | RR | Chest (shirt) | - |
| Yang 2011 [152] | Chest wall movements | Capacitive | Respiration pattern | Chest Abdomen | - |
| Yoo 2010–2011 [153,154,155] | Air temperature Abdomen movements | Fiber optic | Monitoring of breathing | Nose (below) Abdomen | - |
| Ansari 2010 [157] | Modulation cardiac activity | ECG | RR | Arm Forearm | - |
| De Jonckheere 2010 [158] | Chest wall movements | Fiber optic | Monitoring of breathing | Chest Abdomen | - |
| Mitchell 2010 [159] | Chest wall movements | Resistive | Respiration pattern | Chest Abdomen | - |
| Zhang 2010 [160] | Chest wall movements | Frequency shift | Respiration signal | Chest | - |
| Study | Technique | Sensor | Measured Parameter | Location | Size |
|---|---|---|---|---|---|
| Azimi 2017 [183] | Chest wall movements | Pressure (piezoelectric) | RR | Mat | 80 × 90 cm |
| Cho 2017 [184] | Air temperature | Camera | RR Respiratory pattern | - | 7.2 × 2.6 × 1.8 cm |
| Leicht 2017 [185] | Chest wall movements | Inductive | RR | Others (vehicle seatbelt) | - |
| Li 2017 [186] | Chest wall movements | Fiber optic | RR | Mat | - |
| Li 2017 [187] | Chest wall movements | Camera | RR | Distance from subject (1.4 m above) | - |
| Prathosh 2017 [10] | Chest wall movements | Camera | RR Respiratory pattern | Distance from subject (0.91 m away) | - |
| Prochazka 2017 [188] | Air temperature | Camera | RR | Distance from subject (in front of face) | - |
| Tataraidze 2017 [7] | Modulation cardiac activity | Radar | RR Movement activity periods | Distance from subject | - |
| Wang 2017 [189] | Modulation cardiac activity | Radar | RR | Distance from subject (5–55 cm away) | - |
| Heldt 2016 [5] | Modulation cardiac activity | Radar | RR | Distance from subject (15–50 cm away) | - |
| Kukkapalli 2016 [190] | Modulation cardiac activity | Radar | RR | Others (neck pendant) | - |
| Prochazka 2016 [191] | Chest wall movements | Kinect | RR | Distance from subject (in front of face) | - |
| Tveit 2016 [192] | Chest wall movements | Camera | RR | Distance from subject (above) | - |
| Ushijima 2016 [6] | Chest wall movements | Kinect | Respiration detection | Distance from subject (0.8–4 m away) | - |
| Erden 2015 [193] | Chest wall movements | Pyroelectric Vibration | RR | Distance from subject (20–100 cm above, pyroelectric) Mat (vibration) | - |
| Huang 2015 [54] | Modulation cardiac activity | Radar | Respiratory patterns | Distance from subject (1 m away) | - |
| Liu 2015 [194] | Chest wall movements | Piezoelectric | RR Respiratory pattern | Mat | 250 × 125 cm |
| Pereira 2015 [195] | Air temperature | Camera | RR | Distance from subject (1.5–2 m away) | - |
| Ravichandran 2015 [196] | Modulation cardiac activity | Wi-Fi transmitter and receiver | RR Falls | Distance from subject (0.9–4.3 m away) | |
| Sasaki 2015 [197] | Modulation cardiac activity | Radar | RR | Distance from subject (1–2 m above, diagonally) | - |
| Zakrzewski 2015 [198] | Modulation cardiac activity | Radar | RR | Distance from subject (1.5 m above) | - |
| Arlotto 2014 [199] | Modulation cardiac activity | Radar | Breathing monitoring | Distance from subject (30 cm away) | |
| Bernacchia 2014 [200] | Chest wall movements | Kinect | RR | Distance from subject (120 cm above) | - |
| Bernal 2014 [51] | Chest wall movements | Camera | Respiratory pattern, peak inspiratory and expiratory flow, vital capacity | Distance from subject (above) | - |
| Chen 2014 [201] | Chest wall movements | Fiber optic | RR | Mat | 25 × 20 cm |
| Lee 2014 [52] | Modulation cardiac activity | Radar | RR TV Respiratory pattern | Distance from subject (80 cm away) | - |
| Luis 2014 [202] | Chest wall movements | Capacitive | Respiration signal | Mat (chest region) | Different electrode sizes: 9 × 24 cm; 14 × 25 cm; 22 × 4 cm; 10 × 10 cm |
| Mukai 2014 [203] | Chest wall movements | Capacitive | RR | Mat (chest region) | 478 × 478 × 3.5 mm |
| Nukaya 2014 [204] | Chest wall movements | Piezoelectric | Breathing monitoring | Others (below a neonatal bed) | |
| Patwari 2014 [205] | Modulation cardiac activity | Wi-Fi transmitter and receiver | RR | Nodes | - |
| Patwari 2014 [206] | Modulation cardiac activity | Wi-Fi transmitter and receiver | RR Amplitude and phase | Nodes | - |
| Shao 2014 [48] | Chest wall movements | Camera | RR Exhalation flow rate | Distance from subject (0.5 m away) | - |
| Taheri 2014 [207] | Modulation cardiac activity | Radar | RR | Distance from subject (beside bed) | - |
| Wang 2014 [53] | Chest wall movements | Camera | Respiratory pattern | - | - |
| Bartula 2013 [208] | Chest wall movements | Camera | RR | Distance from subject (beside bed) | - |
| Chen 2013 [209] | Respiratory airflow | Fiber optic | Oxygen concentration | Others (inside measurement instrument) | - |
| Dziuda 2013 [210] | Chest wall movements | Fiber optic | RR | Mat | 220 × 95 × 1.5 mm |
| Klap 2013 [211] | Chest wall movements | Piezoelectric | RR | Mat (chest region) | - |
| Lau 2013 [19] | Chest wall movements | Fiber optic | RR Respiratory pattern | Mat | - |
| Nijsure 2013 [50] | Modulation cardiac activity | Radar | Respiratory monitoring Respiratory pattern | Distance from subject (1–3 m away) | - |
| Sprager 2013 [212] | Chest wall movements | Fiber optic | RR | Mat | |
| Vinci 2013 [213] | Modulation cardiac activity | Radar | RR | Distance from subject (1 m above) | |
| Yavari 2013 [214] | Modulation cardiac activity | Radar | Respiration detection | Distance from subject (1–1.5 m away) | - |
| Aoki 2012 [215] | Chest wall movements | Kinect | Exhalation flow rate | Distance from subject (1.2 m away, 1.1 m height) | - |
| Boccanfuso 2012 [216] | Air temperature | Infrared | RR | Distance from subject | - |
| Bruser 2012 [217] | Chest wall movements | Optical | Respiratory activity | Mat | 200 × 90 cm |
| Chen 2012 [218] | Chest wall movements | Fiber optic | RR Respiratory pattern | Mat | - |
| Dziuda 2012 [9,236] | Chest wall movements | Fiber optic | RR | Mat (pneumatic cushion) | 36 cm diameter, 7 cm height |
| Gu 2012 [219] | Modulation cardiac activity | Radar | Breathing monitoring | Distance from subject (50 cm above) | 5 × 5 cm |
| Lokavee 2012 [220] | Chest wall movements | Resistive | RR | Mat, pillow | - |
| Shimomura 2012 [221] | Modulation cardiac activity | Radar | RR | Distance from subject (2 m above) | - |
| Xia 2012 [222] | Chest wall movements | Kinect | Respiration signal | Distance from subject (above) | - |
| Lai 2011 [223] | Modulation cardiac activity | Radar | RR Respiration amplitude | Distance from subject (1 m away) | 3 × 4 cm (antenna) |
| Otsu 2011 [224] | Modulation cardiac activity | Radar | RR | Distance from subject (0.8 m above) | |
| Postolache 2011 [225] | Modulation cardiac activity | Radar | RR | Others (embedded in wheelchair) | - |
| Zito 2011 [226] | Modulation cardiac activity | Radar | Breathing monitoring | Distance from subject (25–40 cm from chest) | |
| Heise 2010 [227] | Chest wall movements | Resistive | RR | Mat | 130 × 7.6 cm |
| Min 2010 [228] | Chest wall movements | Ultrasonic (proximity) | RR | Distance from subject (1 m away) | - |
| Mostov 2010 [229] | Modulation cardiac activity | Radar | RR | Distance from subject (2 m away) | 10 × 10 × 5 cm |
| Nishiyama 2010 [230,231] | Chest wall movements | Fiber optic | Respiration monitoring | Mat (bed, chest region) | - |
| Scalise 2010 [232] | Modulation cardiac activity | Radar | RR | Distance from subject (1.5 m away, perpendicular) | - |
| Silvious 2010 [233] | Modulation cardiac activity | Radar | RR | Nodes (transmitter: 11.3 m from subject; receiver: 4.3 m from subject) | - |
| Tan 2010 [234] | Chest wall movements | Camera | RR | Distance from subject (0.5–1 m away) | - |
| Study | Wireless Transmission | Wired Transmission | Processing Station | Battery Capacity | Battery Life (Type Battery) |
|---|---|---|---|---|---|
| Agcayazi 2017 [123] | Bluetooth (low energy) | - | - | - | - |
| Aileni 2017 [134] | Bluetooth | - | PC, smartphone, tablet device | - | - |
| Basra 2017 [145] | - | Serial communication LCD integrated | Microcontroller, PC, mixed signal oscilloscope | 9 V, 500 mAh | - |
| Bhattacharya 2017 [156] | Wi-Fi | - | Smartphone, cloud storage | - | - |
| Das 2017 [162] | - | Mono audio jack | PC | 9 V, 500 mAh | - |
| Fajkus 2017 [83] | - | Interrogator | PC | - | - |
| Gorgutsa 2017 [84] | Bluetooth (low energy) | - | PC, tablet device | - | (Rechargeable battery and 630 mV solar cell) |
| Guay 2017 [85] | - | GPIB interface | PC | - | - |
| Kam 2017 [86,87,88] | - | USB | PC | - | (5 V DC power bank) |
| Kano 2017 [89] | Bluetooth | - | - | 9 V, 500 mAh | - |
| Koch 2017 [90] | - | - | - | - | - |
| Milici 2017 [91] | Backscattered field | - | Cloud storage | 330 h | >1 year |
| Nakazumi 2017 [92] | - | DAQ (Arduino) | PC | - | - |
| Park 2017 [93] | - | DAQ | PC | - | - |
| Presti 2017 [94] | - | Interrogator | PC | - | - |
| Valipour 2017 [95] | Radio-frequency transceiver | - | PC | - | - |
| White 2017 [96] | Wi-Fi | - | PC | - | - |
| Yan 2017 [97] | - | - | - | - | - |
| Mahbub 2016–2017 [98,99] | Impulse radio ultra-wide band | - | Cloud storage | 600 mAh | 40 days |
| Chethana 2016 [100] | - | Interrogator | - | - | - |
| Güder 2016 [101] | Bluetooth | - | Tablet device, smartphone, cloud storage | 2600 mAh | 9 h |
| Lepine 2016 [102] | Bluetooth (low energy) | - | Smartphone | - | - |
| Massaroni 2016 [103] | - | Interrogator | PC | - | - |
| Massaroni 2016 [49] | - | Interrogator | PC | - | - |
| Moradian 2016 [104] | Passive ultra-high-frequency RFID | - | Oscilloscope | - | (Self-powered passive sensor) |
| Nag 2016 [105] | - | - | - | - | - |
| Nam 2016 [106] | - | Data storage | PC | - | - |
| Raji 2016 [107] | Radio-frequency | - | Cloud storage | - | - |
| Ramos-García 2016 [108] | - | Serial communication | PC | - | - |
| Rotariu 2016 [109] | - | USB | Tablet device | - | - |
| Atalay 2015 [110] | - | - | - | - | - |
| Ciocchetti 2015 [111] | - | Interrogator | PC | - | - |
| Estrada 2015 [112] | - | Data storage | PC | - | - |
| Gargiulo 2015 [113] | - | - | - | - | - |
| Grlica 2015 [114] | - | USB | PC | 2000 mAh | >25 days |
| Hernandez 2015 [115] | - | Data storage | PC | - | 6–9 h |
| Jiang 2015 [116] | Bluetooth (low energy) | - | PC, smartphone | - | (Rechargeable battery, wireless charger) |
| Karlen 2015 [117] | - | Data storage | PC | - | - |
| Kazmi 2015 [118] | - | USB | PC | - | - |
| Metshein 2015 [21] | - | - | - | - | - |
| Teichmann 2015 [119] | Bluetooth | - | Smartphone | 2.95 Wh | 2.23 h |
| Wei 2015 [120] | - | - | - | - | - |
| Yang 2015 [3] | Bluetooth | - | PC | - | - |
| Bifulco 2014 [121] | - | - | - | - | - |
| Fekr 2014 [122] | Bluetooth (low energy) | - | PC, smartphone, tablet device, cloud storage | - | - |
| Hesse 2014 [124] | - | Data storage | PC | - | - |
| Krehel 2014 [125] | - | Interrogator | PC | - | - |
| Min 2014 [126] | - | - | PC | - | - |
| Petrovic 2014 [127] | - | Interrogator | PC | - | - |
| Sanchez 2014 [128] | - | Spectrometer | PC | - | - |
| Wo 2014 [129] | - | DAQ | PC | - | - |
| Yang 2014 [130] | Bluetooth (low energy) | - | Smartphone | - | 24 h |
| Yoon 2014 [131] | Bluetooth | - | PC | - | (Li-polymer battery) |
| Chan 2013 [132] | Bluetooth (low energy) | - | Smartphone | - | (Coin battery) |
| Huang 2013 [133] | - | USB | PC | - | - |
| Kundu 2013 [161] | - | - | - | - | - |
| Padasdao 2013 [135] | - | - | - | - | - |
| Cao 2012 [2] | Bluetooth | - | Smartphone | 1000 mAh | >10 h |
| Chiu 2012 [136] | - | - | PC | - | - |
| Favero 2012 [137] | - | Interrogator | - | - | - |
| Mathew 2012 [138] | - | Interrogator | PC | - | - |
| Scully 2012 [139] | - | Data storage | PC | - | - |
| Trobec 2012 [140] | - | - | PC | - | - |
| Witt 2012 [141] | - | USB | PC | - | - |
| Zieba 2012 [142] | - | - | PC | - | - |
| Carlos 2011 [143] | Bluetooth | - | PC, cloud storage | - | - |
| Ciobotariu 2011 [144] | Wi-Fi, GSM | - | Tablet device | - | 5 weeks |
| Guo 2011 [146] | Bluetooth | - | PC | - | - |
| Hoffmann 2011 [17] | Bluetooth | - | PC | 590 mAh | 12 h |
| Liu 2011 [147] | - | Data Storage (SD card) | PC | 370 mAh | 54 h |
| Liu 2011 [148] | Radio-frequency (transceiver) | - | Base station | - | - |
| Mann 2011 [149] | - | - | PC | - | - |
| Ono 2011 [150] | - | Data storage | PC | - | - |
| Silva 2011 [151] | - | Interrogator | - | - | - |
| Yang 2011 [152] | Bluetooth | - | PC | - | - |
| Yoo 2010–2011 [153,154,155] | - | DAQ | PC | - | - |
| Ansari 2010 [157] | - | - | - | - | - |
| De Jonckheere 2010 [158] | - | USB | PC | - | - |
| Mitchell 2010 [159] | Zigbee | - | PC | - | - |
| Zhang 2010 [160] | Bluetooth | - | PC | - | - |
| Study | Algorithm | Performance Evaluation | Performance Value | Analysis Software |
|---|---|---|---|---|
| Agcayazi 2017 [123] | - | Graphical monitoring | - | - |
| Aileni 2017 [134] | - | - | - | - |
| Basra 2017 [145] | Frequency analysis | Graphical monitoring | - | MATLAB |
| Bhattacharya 2017 [156] | Threshold detection | Graphical comparison | - | Blynk |
| Das 2017 [162] | - | Graphical monitoring | - | Audacity |
| Fajkus 2017 [83] | Frequency analysis | Relative error | 3.9% | MATLAB |
| Gorgutsa 2017 [84] | Received signal strength indicator | Graphical monitoring | - | Custom application |
| Guay 2017 [85] | - | Graphical monitoring | - | Labview |
| Kam 2017 [86,87,88] | - | Relative error | <4.08% | Labview MATLAB |
| Kano 2017 [89] | - | Graphical monitoring | - | - |
| Koch 2017 [90] | Custom algorithm | Graphical monitoring | - | - |
| Milici 2017 [91] | Peak detection | Graphical comparison | - | - |
| Nakazumi 2017 [92] | - | Graphical monitoring | - | - |
| Park 2017 [93] | - | Graphical monitoring | - | MATLAB |
| Presti 2017 [94] | Max-min detection | Bland-Altman analysis | 0.006–0.008 bpm (BA MOD) | MATLAB |
| Valipour 2017 [95] | - | Root mean square error Bland-Altman analysis | 1.26 bpm (RMSE) 0.1 bpm (BA, MOD) | - |
| White 2017 [96] | Frequency analysis | - | - | MATLAB |
| Yan 2017 [97] | - | Graphical monitoring | - | - |
| Mahbub 2016–2017 [98,99] | - | Graphical monitoring | - | - |
| Chethana 2016 [100] | Frequency analysis | - | - | - |
| Güder 2016 [101] | - | Graphical monitoring | - | - |
| Lepine 2016 [102] | Kalman filter | Absolute error | 2.11–5.98 bpm | MATLAB |
| Massaroni 2016 [103] | Max-min detection | Bland-Altman analysis Percentage error | <0.14 s (BA, MOD) 1.14% (PE) | - |
| Massaroni 2016 [49] | Max-min detection Custom algorithm | Relative error | −1.59% (RE for RR) 14% (RE for TV) | MATLAB |
| Moradian 2016 [104] | - | Graphical monitoring | - | - |
| Nag 2016 [105] | - | Graphical monitoring | - | - |
| Nam 2016 [106] | Frequency analysis | Mean relative error | <1% | MATLAB |
| Raji 2016 [107] | Threshold detection | Root mean square error | 1.7–2 bpm | - |
| Ramos-García 2016 [108] | Peak detection Frequency analysis | Correlation factor | 0.41 | - |
| Rotariu 2016 [109] | Peak detection | - | - | LabWindows/CVI |
| Atalay 2015 [110] | Frequency analysis | - | - | |
| Ciocchetti 2015 [111] | Peak detection Custom algorithm Manual verification | Correlation factor Percentage error Bland-Altman analysis | 0.87 (correlation) 8.3% (PE) <0.002 s (BA, mean difference, time between peaks) | MATLAB |
| Estrada 2015 [112] | Peak detection Custom Algorithm | Correlation factor Bland-Altman analysis | 0.8–0.97 (correlation) −0.01 bpm (BA, MOD) | MATLAB |
| Gargiulo 2015 [113] | - | Relative error | <10% | MATLAB |
| Grlica 2015 [114] | - | Graphical monitoring | - | C# |
| Hernandez 2015 [115] | Max-min detection Frequency analysis | Bland-Altman analysis Mean absolute error Root mean square error | 0.15 bpm (BA, MOD) 0.38 bpm (MAE) 1.25 bpm (RMSE) | - |
| Jiang 2015 [116] | Custom algorithm | Respiration simulation | - | - |
| Karlen 2015 [117] | Custom algorithm | Bland-Altman analysis Root mean square error | 6.01 bpm (RMSE) | MATLAB |
| Kazmi 2015 [118] | - | Graphical comparison | - | Easy pulse analyzer Cool term software Kuvios HRV |
| Metshein 2015 [21] | - | Graphical comparison | - | - |
| Teichmann 2015 [119] | Frequency analysis (Frequency modulation) Custom algorithm | Graphical comparison | - | Microcontroller |
| Wei 2015 [120] | - | - | - | - |
| Yang 2015 [3] | Manual verification | Graphical comparison | - | Labview |
| Bifulco 2014 [121] | - | - | - | - |
| Fekr 2014 [122] | Numeric integration algorithm | Correlation factor Relative error | 0.85 (correlation) 0.2% (RE) | - |
| Hesse 2014 [124] | Peak detection | Mean absolute error | 0.32 bpm | Microcontroller |
| Krehel 2014 [125] | - | Correlation factor Bland-Altman analysis | ±3 bpm (BA) | MATLAB |
| Min 2014 [126] | Peak detection Custom Algorithm | Correlation factor Bland-Altman analysis | 0.98 (correlation) 0.0015 bpm (BA, MOD) | MATLAB |
| Petrovic 2014 [127] | - | Mean relative error Bland-Altman analysis | 8.7% (RE-MV-) 10.5% (RE-TV-) −1 (BA, MOD) | MATLAB Labview |
| Sanchez 2014 [128] | - | - | - | - |
| Wo 2014 [129] | Frequency analysis | - | - | Labview |
| Yang 2014 [130] | - | Graphical monitoring | - | - |
| Yoon 2014 [131] | Kalman filter | Relative error | 7.3% | MATLAB Labview |
| Chan 2013 [132] | - | Absolute error | <2 bpm | - |
| Huang 2013 [133] | - | Accuracy | 98.8% | - |
| Kundu 2013 [161] | - | Accuracy Coefficient of determination | 100% (acc) 0.906 (r2) | - |
| Padasdao 2013 [135] | Frequency analysis (Fast Fourier Transform) | Bland-Altman analysis Mean absolute error | 0.23–0.48 bpm (BA, MOD) 0.00027 bpm (MAE) | - |
| Cao 2012 [2] | Peak detection | Graphical comparison | - | Labview |
| Chiu 2012 [136] | Frequency analysis | Paired t-test | No statistical difference with reference | MATLAB |
| Favero 2012 [137] | - | - | - | - |
| Mathew 2012 [138] | Zero-crossing detection | Graphical monitoring | - | Labview |
| Scully 2012 [139] | Frequency analysis (Frequency modulation) | Graphical comparison | - | MATLAB |
| Trobec 2012 [140] | ECG-derived algorithm | - | - | MATLAB |
| Witt 2012 [141] | - | Graphical comparison | - | - |
| Zieba 2012 [142] | Manual verification | - | - | Labview |
| Carlos 2011 [143] | - | Graphical monitoring | - | Custom application |
| Ciobotariu 2011 [144] | Max-min detection Custom algorithm | Graphical comparison | - | C# |
| Guo 2011 [146] | Peak detection | Simulation Graphical comparison | - | Labview |
| Hoffmann 2011 [17] | Custom algorithm | Correlation factor Relative error | 0.92 (correlation) | - |
| Liu 2011 [147] | Empirical Mode Decomposition | Mean percentage error Root mean square error | 6.1%, 14.6% (MPE) 4.1 bpm, 9.8 bpm (RMSE) | - |
| Liu 2011 [148] | Principal Component Analysis Frequency analysis | Relative error | 10% | - |
| Mann 2011 [149] | Threshold detection | Correlation factor | 0.97 | - |
| Ono 2011 [150] | Custom algorithm | Displacement comparison | - | Objective-C |
| Silva 2011 [151] | Frequency analysis | Graphical comparison | - | - |
| Yang 2011 [152] | - | - | - | - |
| Yoo 2010–2011 [153,154,155] | - | Graphical monitoring | - | Labview |
| Ansari 2010 [157] | Frequency analysis | - | - | - |
| De Jonckheere 2010 [158] | - | Graphical comparison Bland-Altman analysis | - | - |
| Mitchell 2010 [159] | Manual verification | Graphical comparison | - | Physput |
| Zhang 2010 [160] | - | Biofeedback (audiovisual feedback signal) | - | MATLAB |
| Study | Algorithm | Performance Evaluation | Performance Value | Analysis Software |
|---|---|---|---|---|
| Azimi 2017 [183] | Peak detection Custom algorithm | Linear regression | 0.968 and 1.0223 (slope) | - |
| Cho 2017 [184] | Custom algorithm | - | - | - |
| Leicht 2017 [185] | - | Graphical comparison | - | MATLAB |
| Li 2017 [186] | Frequency analysis | Graphical monitoring | - | MATLAB |
| Li 2017 [187] | Custom algorithm | Root mean square error | 1.12 bpm | OpenCV |
| Prathosh 2017 [10] | Custom algorithm | Correlation factor Bland-Altman analysis | 0.94 (correlation) 0.88 bpm (BA, MOD) | - |
| Prochazka 2017 [188] | Neural Network | - | - | - |
| Tataraidze 2017 [7] | Peak detection Custom algorithm | Accuracy | 97% | MATLAB |
| Wang 2017 [189] | Frequency analysis (Short-Time Fourier Transform) | Absolute error | 0.11–0.33 bpm | - |
| Heldt 2016 [5] | Threshold detection | Mean absolute error | 1.2 bpm | Acknowledge |
| Kukkapalli 2016 [190] | Peak detection | Accuracy | >95% | |
| Prochazka 2016 [191] | Custom algorithm | Relative error | 0.06–0.26% | - |
| Tveit 2016 [192] | Phase-based respiration detection Pixel-intensity detection | Manual verification Relative error | 7.21–11.57% | - |
| Ushijima 2016 [6] | - | Graphical comparison | - | - |
| Erden 2015 [193] | Wavelet transform Empirical mode decomposition | Accuracy | 93% | - |
| Huang 2015 [54] | Peak detection Threshold detection | - | - | - |
| Liu 2015 [194] | Peak detection Threshold detection | Relative error | 1.8–5.7% | - |
| Pereira 2015 [195] | Custom algorithm | Correlation factor Mean Absolute Error Bland-Altman analysis | 0.92 (correlation) 0.53 bpm (MAE) 0.025 bpm (BA, MOD) | MATLAB |
| Ravichandran 2015 [196] | Zero-crossing detection Frequency analysis Linear predictive coding Least-squares harmonic analysis | Absolute error | 2.16 bpm | - |
| Sasaki 2015 [197] | - | Relative error | 3% | - |
| Zakrzewski 2015 [198] | Linear/ non-Linear demodulation | Mean squared error | - | MATLAB |
| Arlotto 2014 [199] | - | Graphical comparison | - | - |
| Bernacchia 2014 [200] | Custom algorithm | Correlation factor Bland-Altman analysis | 0.96 (correlation) 0 bpm (BA, MOD) | MATLAB |
| Bernal 2014 [51] | Peak detection Zero-crossing detection Custom algorithm | Graphical comparison | - | - |
| Chen 2014 [201] | Peak detection | Absolute error Relative error | 1.65 bpm (AE) 9.9% (RE) | Labview |
| Lee 2014 [52] | Frequency analysis | Correlation factor Root mean square error | 0.90–0.976 (correlation) 0.0038–0.076 bpm (RMSE) | MATLAB |
| Luis 2014 [202] | Custom algorithm | - | - | MATLAB |
| Mukai 2014 [203] | Frequency analysis | - | - | - |
| Nukaya 2014 [204] | - | Scatterplot | - | - |
| Patwari 2014 [205] | Frequency analysis | Relative error | 1 bpm | - |
| Patwari 2014 [206] | Custom algorithm | Relative error | 0.1 to 0.4 bpm | - |
| Shao 2014 [48] | Custom algorithm | Correlation factor Bland-Altman analysis Root mean square error | 0.93 (correlation) 0.02 bpm (BA, MOD) 1.2 bpm (RMSE) | MATLAB |
| Taheri 2014 [207] | Custom algorithm | Mean absolute error Accuracy | 0.93–1.77 bpm (MAE) 79–89% (Acc) | - |
| Wang 2014 [53] | Threshold detection | Others (confusion matrix) | 94% | - |
| Bartula 2013 [208] | Custom algorithm | Correlation factor | 0.98 | - |
| Chen 2013 [209] | Frequency analysis | Linear regression Bland-Altman analysis | 0.999 (r2) | - |
| Dziuda 2013 [210] | Max detection | Relative error Bland-Altman analysis | <8% (RE) 0 bpm (BA, MOD) | Custom application |
| Klap 2013 [211] | Proprietary algorithms | Relative error | 4–8% (RE) | - |
| Lau 2013 [19] | Peak detection | Correlation factor Mean absolute error | 0.971 (correlation) 2 bpm (MAE) | Labview |
| Nijsure 2013 [50] | Custom algorithm | Correlation factor | 0.814 | - |
| Sprager 2013 [212] | Wavelet transform | Relative error | 7.37 ± 7.20% | MATLAB |
| Vinci 2013 [213] | Frequency analysis | Graphical comparison | - | MATLAB |
| Yavari 2013 [214] | - | Graphical comparison | - | - |
| Aoki 2012 [215] | Custom algorithm | Correlation factor Bland-Altman plot | 0.98 (correlation) | Kinect SDK |
| Boccanfuso 2012 [216] | Sinusoidal curve-fitting function | Accuracy | - | OpenCV |
| Bruser 2012 [217] | - | - | - | - |
| Chen 2012 [218] | Frequency analysis | Mean absolute error | 2 bpm | Labview |
| Dziuda 2012 [9,236] | Max-min detection | Relative error | 12% | C# |
| Gu 2012 [219] | - | Graphical comparison | - | Labview |
| Lokavee 2012 [220] | - | Graphical comparison | - | Labview |
| Shimomura 2012 [221] | Frequency analysis | Relative error | 1.61% | - |
| Xia 2012 [222] | - | Correlation factor | 0.958–0.978 | - |
| Lai 2011 [223] | Multipeak detection | Correlation factor | 0.5–0.83 | MATLAB Labview |
| Otsu 2011 [224] | Custom algorithm | Absolute error | 0.19 bpm | - |
| Postolache 2011 [225] | Peak detection | - | - | Labview Android app |
| Zito 2011 [226] | - | Graphical comparison | - | - |
| Heise 2010 [227] | Zero-crossing detection | - | - | - |
| Min 2010 [228] | Envelop detection Zero-crossing detection | Correlation factor Bland-Altman analysis | 0.93–0.98 (correlation) −0.002–0.006 bpm (BA, MOD) | MATLAB |
| Mostov 2010 [229] | Custom algorithm | - | - | - |
| Nishiyama 2010 [230,231] | - | Graphical monitoring | - | - |
| Scalise 2010 [232] | Wavelet transform | Correlation factor Bland-Altman analysis | 0.98 (correlation) 13 ms (BAP, MOD) | - |
| Silvious 2010 [233] | - | Graphical comparison | - | - |
| Tan 2010 [234] | Custom algorithm | Graphical comparison | - | Custom application |
References
- Milenković, A.; Otto, C.; Jovanov, E. Wireless sensor networks for personal health monitoring: Issues and an implementation. Comput. Commun. 2006, 29, 2521–2533. [Google Scholar] [CrossRef]
- Cao, Z.; Zhu, R.; Que, R.-Y. A wireless portable system with microsensors for monitoring respiratory diseases. IEEE Trans. Biomed. Eng. 2012, 59, 3110–3116. [Google Scholar]
- Yang, X.; Chen, Z.; Elvin, C.S.M.; Janice, L.H.Y.; Ng, S.H.; Teo, J.T.; Wu, R. Textile Fiber Optic Microbend Sensor Used for Heartbeat and Respiration Monitoring. IEEE Sens. J. 2015, 15, 757–761. [Google Scholar] [CrossRef]
- Subbe, C.P.; Kinsella, S. Continuous monitoring of respiratory rate in emergency admissions: Evaluation of the RespiraSenseTM sensor in acute care compared to the industry standard and gold standard. Sensors 2018, 18, 2700. [Google Scholar] [CrossRef]
- Heldt, G.P.; Ward, R.J., III. Evaluation of Ultrasound-Based Sensor to Monitor Respiratory and Nonrespiratory Movement and Timing in Infants. IEEE Trans. Biomed. Eng. 2016, 63, 619–629. [Google Scholar] [CrossRef] [PubMed]
- Ushijima, T.; Satake, J. Development of a Breathing Detection Robot for a Monitoring System. In Proceedings of the Joint 8th International Conference on Soft Computing and Intelligent Systems (SCIS) and 17th International Symposium on Advanced Intelligent Systems (ISIS), Sapporo, Japan, 25–28 August 2016; pp. 790–795. [Google Scholar]
- Tataraidze, A.; Anishchenko, L.; Korostovtseva, L.; Bochkarev, M.; Sviryaev, Y.; Alborova, I. Detection of movement activity and breathing cycles on bioradiolocation signals. In Proceedings of the IEEE nternational Conference on Microwaves, Antennas, Communications and Electronic Systems (COMCAS), Tel Aviv, Israel, 13–15 November 2017; pp. 1–4. [Google Scholar]
- Gatti, U.C.; Schneider, S.; Migliaccio, G.C. Physiological condition monitoring of construction workers. Autom. Constr. 2014, 44, 227–233. [Google Scholar] [CrossRef]
- Dziuda, L.; Skibniewski, F.W.; Krej, M.; Lewandowski, J. Monitoring Respiration and Cardiac Activity Using Fiber Bragg Grating-Based Sensor. IEEE Trans. Biomed. Eng. 2012, 59, 1934–1942. [Google Scholar] [CrossRef] [PubMed]
- Prathosh, A.P.; Praveena, P.; Mestha, L.K.; Bharadwaj, S. Estimation of Respiratory Pattern From Video Using Selective Ensemble Aggregation. IEEE Trans. Signal Process. 2017, 65, 2902–2916. [Google Scholar] [CrossRef]
- Liu, X.; Wang, Q.; Liu, D.; Wang, Y.; Zhang, Y.; Bai, O.; Sun, J. Human emotion classification based on multiple physiological signals by wearable system. Technol. Health Care 2018, 26, 459–469. [Google Scholar] [CrossRef]
- Homma, I.; Masaoka, Y. Breathing rhythms and emotions. Exp. Physiol. 2008, 93, 1011–1021. [Google Scholar] [CrossRef]
- Ćosić, D. Neuromarketing in market research. Interdiscip. Descr. Complex Syst. INDECS 2016, 14, 139–147. [Google Scholar] [CrossRef]
- Kowalczuk, Z.; Czubenko Michałand Merta, T. Emotion monitoring system for drivers. IFAC-PapersOnLine 2019, 52, 200–205. [Google Scholar] [CrossRef]
- Granato, M. Emotions Recognition in Video Game Players Using Physiological Information. Ph.D. Thesis, Università degli studi di Milano, Milano, Italy, 2019. [Google Scholar]
- Kołakowska, A.; Landowska, A.; Szwoch, M.; Szwoch, W.; Wrobel, M.R. Emotion recognition and its applications. In Human-Computer Systems Interaction: Backgrounds and Applications 3; Springer: Berlin/Heidelberg, Germany, 2014; pp. 51–62. [Google Scholar]
- Hoffmann, T.; Eilebrecht, B.; Leonhardt, S. Respiratory Monitoring System on the Basis of Capacitive Textile Force Sensors. IEEE Sens. J. 2011, 11, 1112–1119. [Google Scholar] [CrossRef]
- Sperlich, B.; Aminian, K.; Düking, P.; Holmberg, H.-C. Wearable Sensor Technology for Monitoring Training Load and Health in the Athletic Population. Front. Physiol. 2019, 10. [Google Scholar] [CrossRef]
- Lau, D.; Chen, Z.; Teo, J.T.; Ng, S.H.; Rumpel, H.; Lian, Y.; Yang, H.; Kei, P.L. Intensity-Modulated Microbend Fiber Optic Sensor for Respiratory Monitoring and Gating During MRI. IEEE Trans. Biomed. Eng. 2013, 60, 2655–2662. [Google Scholar] [CrossRef]
- Krebber, K.; Lenke, P.; Liehr, S.; Schukar, M.; Wendt, M.; Witt, J.; Wosniok, A. Technology and applications of smart technical textiles based on fiber optic sensors. Adv. Photonics Renew. Energy 2008. [Google Scholar] [CrossRef]
- Metshein, M. A device for measuring the electrical bioimpedance with variety of electrode placements for monitoring the breathing and heart rate. In Proceedings of the 26th Irish Signals and Systems Conference (ISSC), Carlow, UK, 24–25 June 2015; pp. 1–4. [Google Scholar]
- Friedl, K.E. Military applications of soldier physiological monitoring. J. Sci. Med. Sport 2018, 21, 1147–1153. [Google Scholar] [CrossRef]
- Scalise, L.; Mariani Primiani, V.; Russo, P.; De Leo, A.; Shahu, D.; Cerri, G. Wireless sensing for the respiratory activity of human beings: Measurements and wide-band numerical analysis. Int. J. Antennas Propag. 2013, 2013, 396459. [Google Scholar] [CrossRef]
- Massaroni, C.; Nicolò, A.; Lo Presti, D.; Sacchetti, M.; Silvestri, S.; Schena, E. Contact-based methods for measuring respiratory rate. Sensors 2019, 19, 908. [Google Scholar] [CrossRef]
- Mukhopadhyay, S.C. Wearable Sensors for Human Activity Monitoring: A Review. IEEE Sens. J. 2015, 15, 1321–1330. [Google Scholar] [CrossRef]
- Nag, A.; Mukhopadhyay, S.C.; Kosel, J. Wearable Flexible Sensors: A Review. IEEE Sens. J. 2017, 17, 3949–3960. [Google Scholar] [CrossRef]
- Chung, M.; Fortunato, G.; Radacsi, N. Wearable flexible sweat sensors for healthcare monitoring: A review. J. R. Soc. Interface 2019, 16, 20190217. [Google Scholar] [CrossRef]
- Bandodkar, A.J.; Jeang, W.J.; Ghaffari, R.; Rogers, J.A. Wearable sensors for biochemical sweat analysis. Annu. Rev. Anal. Chem. 2019, 12, 1–22. [Google Scholar] [CrossRef] [PubMed]
- López-Nava, I.H.; Muñoz-Meléndez, A. Wearable Inertial Sensors for Human Motion Analysis: A Review. IEEE Sens. J. 2016, 16, 7821–7834. [Google Scholar] [CrossRef]
- Seshadri, D.R.; Li, R.T.; Voos, J.E.; Rowbottom, J.R.; Alfes, C.M.; Zorman, C.A.; Drummond, C.K. Wearable sensors for monitoring the internal and external workload of the athlete. NPJ Digit. Med. 2019, 2, 71. [Google Scholar] [CrossRef] [PubMed]
- Aroganam, G.; Manivannan, N.; Harrison, D. Review on Wearable Technology Sensors Used in Consumer Sport Applications. Sensors 2019, 19, 1983. [Google Scholar] [CrossRef] [PubMed]
- Al-Eidan, R.M.; Al-Khalifa, H.; Al-Salman, A.M. A Review of Wrist-Worn Wearable: Sensors, Models, and Challenges. J. Sens. 2018, 2018, 5853917. [Google Scholar] [CrossRef]
- Baig, M.M.; Afifi, S.; GholamHosseini, H.; Mirza, F. A Systematic Review of Wearable Sensors and IoT-Based Monitoring Applications for Older Adults—A Focus on Ageing Population and Independent Living. J. Med. Syst. 2019, 43, 233. [Google Scholar] [CrossRef] [PubMed]
- Heikenfeld, J.; Jajack, A.; Rogers, J.; Gutruf, P.; Tian, L.; Pan, T.; Li, R.; Khine, M.; Kim, J.; Wang, J.; et al. Wearable sensors: Modalities, challenges, and prospects. Lab Chip 2018, 18, 217–248. [Google Scholar] [CrossRef] [PubMed]
- Witte, A.-K.; Zarnekow, R. Transforming Personal Healthcare through Technology—A Systematic Literature Review of Wearable Sensors for Medical Application. In Proceedings of the 52nd Hawaii International Conference on System Sciences, Grand Wailea, Maui, 8–11 January 2019; pp. 3848–3857. [Google Scholar]
- Pantelopoulos, A.; Bourbakis, N.G. A Survey on Wearable Sensor-Based Systems for Health Monitoring and Prognosis. Healthc. Inform. Res. 2010, 40, 1–12. [Google Scholar] [CrossRef]
- Liang, T.; Yuan, Y.J. Wearable Medical Monitoring Systems Based on Wireless Networks: A Review. IEEE Sens. J. 2016, 16, 8186–8199. [Google Scholar] [CrossRef]
- Charlton, P.H.; Birrenkott, D.A.; Bonnici, T.; Pimentel, M.A.F.; Johnson, A.E.W.; Alastruey, J.; Tarassenko, L.; Watkinson, P.J.; Beale, R.; Clifton, D.A. Breathing Rate Estimation From the Electrocardiogram and Photoplethysmogram: A Review. IEEE Sens. J. 2018, 11, 2–20. [Google Scholar] [CrossRef] [PubMed]
- AL-Khalidi, F.Q.; Saatchi, R.; Burke, D.; Elphick, H.; Tan, S. Respiration rate monitoring methods: A review. Pediatr. Pulmonol. 2011, 46, 523–529. [Google Scholar] [CrossRef] [PubMed]
- Van Loon, K.; Zaane, B.; Bosch, E.J.; Kalkman, C.; Peelen, L.M. Non-Invasive Continuous Respiratory Monitoring on General Hospital Wards: A Systematic Review. PLoS ONE 2015, 10, e0144626. [Google Scholar] [CrossRef] [PubMed]
- Rajala, S.; Lekkala, J. Film-Type Sensor Materials PVDF and EMFi in Measurement of Cardiorespiratory Signals—A Review. IEEE Sens. J. 2012, 12, 439–446. [Google Scholar] [CrossRef]
- Massaroni, C.; Zaltieri, M.; Lo Presti, D.; Nicolò, A.; Tosi, D.; Schena, E. Fiber Bragg Grating Sensors for Cardiorespiratory Monitoring: A Review. IEEE Sens. J. 2020, 1. [Google Scholar] [CrossRef]
- IEEE Xplore Search Results Page. Available online: https://ieeexplore.ieee.org/Xplorehelp/searching-ieee-xplore/search-results-page (accessed on 8 September 2020).
- Google Sholar About. Available online: https://scholar.google.com/intl/es/scholar/about.html (accessed on 8 September 2020).
- PRISMA. Transparent Reporting of Systematic Reviews and Meta-Analyses. Available online: http://prisma-statement.org/ (accessed on 14 September 2020).
- Igual, R.; Medrano, C.; Plaza, I. Challenges, issues and trends in fall detection systems. Biomed. Eng. Online 2013, 12. [Google Scholar] [CrossRef]
- Warner, M.A.; Patel, B. Mechanical ventilation. In Benumof and Hagberg’s Airway Management; Elsevier: Amsterdam, The Netherlands, 2013; pp. 981–997. [Google Scholar]
- Shao, D.; Yang, Y.; Liu, C.; Tsow, F.; Yu, H.; Tao, N. Noncontact Monitoring Breathing Pattern, Exhalation Flow Rate and Pulse Transit Time. IEEE Trans. Biomed. Eng. 2014, 61, 2760–2767. [Google Scholar] [CrossRef]
- Massaroni, C.; Saccomandi, P.; Formica, D.; Lo Presti, D.; Caponero, M.A.; Di Tomaso, G.; Giurazza, F.; Muto, M.; Schena, E. Design and Feasibility Assessment of a Magnetic Resonance-Compatible Smart Textile Based on Fiber Bragg Grating Sensors for Respiratory Monitoring. IEEE Sens. J. 2016, 16, 8103–8110. [Google Scholar] [CrossRef]
- Nijsure, Y.; Tay, W.P.; Gunawan, E.; Wen, F.; Yang, Z.; Guan, Y.L.; Chua, A.P. An Impulse Radio Ultrawideband System for Contactless Noninvasive Respiratory Monitoring. IEEE Trans. Biomed. Eng. 2013, 60, 1509–1517. [Google Scholar] [CrossRef]
- Bernal, E.A.; Mestha, L.K.; Shilla, E. Non contact monitoring of respiratory function via depth sensing. In Proceedings of the IEEE-EMBS International Conference on Biomedical and Health Informatics (BHI), Valencia, Spain, 1–4 June 2014; pp. 101–104. [Google Scholar]
- Lee, Y.S.; Pathirana, P.N.; Steinfort, C.L.; Caelli, T. Monitoring and Analysis of Respiratory Patterns Using Microwave Doppler Radar. IEEE J. Transl. Eng. Health Med. 2014, 2, 1–12. [Google Scholar] [CrossRef] [PubMed]
- Wang, C.; Hunter, A.; Gravill, N.; Matusiewicz, S. Unconstrained Video Monitoring of Breathing Behavior and Application to Diagnosis of Sleep Apnea. IEEE Trans. Biomed. Eng. 2014, 61, 396–404. [Google Scholar] [CrossRef] [PubMed]
- Huang, X.; Sun, L.; Tian, T.; Huang, Z.; Clancy, E. Real-time non-contact infant respiratory monitoring using UWB radar. In Proceedings of the 16th IEEE International Conference on Communication Technology, Hangzhou, China, 18–21 October 2015; pp. 493–496. [Google Scholar]
- Igual, R.; Plaza, I.; Medrano, C.; Rubio, M.A. Personalizable smartphone-based system adapted to assist dependent people. J. Ambient Intell. Smart Environ. 2014, 6, 569–593. [Google Scholar] [CrossRef]
- Igual, R.; Plaza, I.; Martín, L.; Corbalan, M.; Medrano, C. Guidelines to Design Smartphone Applications for People with Intellectual Disability: A Practical Experience. In Ambient Intelligence—Software and Applications; Advances in Intelligent Systems and Computing; Springer: Heidelberg, Germany, 2013; Volume 219, ISBN 9783319005652. [Google Scholar]
- Aitkulov, A.; Tosi, D. Optical fiber sensor based on plastic optical fiber and smartphone for measurement of the breathing rate. IEEE Sens. J. 2019, 19, 3282–3287. [Google Scholar] [CrossRef]
- Aitkulov, A.; Tosi, D. Design of an all-POF-fiber smartphone multichannel breathing sensor with camera-division multiplexing. IEEE Sens. Lett. 2019, 3, 1–4. [Google Scholar] [CrossRef]
- Balasubramaniyam, H.; Vignesh, M.S.; Abhirami, A.; Abanah, A. Design and Development of a IoT based Flexible and Wearable T-Shirt for Monitoring Breathing Rate. In Proceedings of the 3rd International Conference on Computing Methodologies and Communication (ICCMC), Erode, India, 27–29 March 2019; pp. 376–379. [Google Scholar]
- Bricout, A.; Fontecave-Jallon, J.; Colas, D.; Gerard, G.; Pépin, J.-L.; Guméry, P.-Y. Adaptive Accelerometry Derived Respiration: Comparison with Respiratory Inductance Plethysmography during Sleep. In Proceedings of the 41st Annual International Conference of the IEEE Engineering in Medicine and Biology Society (EMBC), Berlin, Germany, 23–27 July 2019; pp. 6714–6717. [Google Scholar]
- Chu, M.; Nguyen, T.; Pandey, V.; Zhou, Y.; Pham, H.N.; Bar-Yoseph, R.; Radom-Aizik, S.; Jain, R.; Cooper, D.M.; Khine, M. Respiration rate and volume measurements using wearable strain sensors. NPJ Digit. Med. 2019, 2, 1–9. [Google Scholar] [CrossRef]
- Elfaramawy, T.; Fall, C.L.; Arab, S.; Morissette, M.; Lellouche, F.; Gosselin, B. A Wireless Respiratory Monitoring System Using a Wearable Patch Sensor Network. IEEE Sens. J. 2019, 19, 650–657. [Google Scholar] [CrossRef]
- Fajkus, M.; Nedoma, J.; Martinek, R.; Brablik, J.; Vanus, J.; Novak, M.; Zabka, S.; Vasinek, V.; Hanzlikova, P.; Vojtisek, L. MR fully compatible and safe FBG breathing sensor: A practical solution for respiratory triggering. IEEE Access 2019, 7, 123013–123025. [Google Scholar] [CrossRef]
- Hurtado, D.E.; Abusleme, A.; Chávez, J.A.P. Non-invasive continuous respiratory monitoring using temperature-based sensors. J. Clin. Monit. Comput. 2019, 1–9. [Google Scholar] [CrossRef]
- Jayarathna, T.; Gargiulo, G.D.; Breen, P.P. Polymer sensor embedded, IOT enabled t-shirt for long-term monitoring of sleep disordered breathing. In Proceedings of the IEEE 5th World Forum on Internet of Things (WF-IoT), Limerick, UK, 15–18 April 2019; pp. 139–143. [Google Scholar]
- Kano, S.; Yamamoto, A.; Ishikawa, A.; Fujii, M. Respiratory rate on exercise measured by nanoparticle-based humidity sensor. In Proceedings of the 41st Annual International Conference of the IEEE Engineering in Medicine and Biology Society (EMBC), Berlin, Germany, 23–27 July 2019; pp. 3567–3570. [Google Scholar]
- Karacocuk, G.; Höflinger, F.; Zhang, R.; Reindl, L.M.; Laufer, B.; Möller, K.; Röell, M.; Zdzieblik, D. Inertial sensor-based respiration analysis. IEEE Trans. Instrum. Meas. 2019, 68, 4268–4275. [Google Scholar] [CrossRef]
- Massaroni, C.; Nicolò, A.; Girardi, M.; La Camera, A.; Schena, E.; Sacchetti, M.; Silvestri, S.; Taffoni, F. Validation of a wearable device and an algorithm for respiratory monitoring during exercise. IEEE Sens. J. 2019, 19, 4652–4659. [Google Scholar] [CrossRef]
- Massaroni, C.; Di Tocco, J.; Presti, D.L.; Longo, U.G.; Miccinilli, S.; Sterzi, S.; Formica, D.; Saccomandi, P.; Schena, E. Smart textile based on piezoresistive sensing elements for respiratory monitoring. IEEE Sens. J. 2019, 19, 7718–7725. [Google Scholar] [CrossRef]
- Nguyen, T.-V.; Ichiki, M. MEMS-Based Sensor for Simultaneous Measurement of Pulse Wave and Respiration Rate. Sensors 2019, 19, 4942. [Google Scholar] [CrossRef] [PubMed]
- Presti, D.L.; Massaroni, C.; Di Tocco, J.; Schena, E.; Carnevale, A.; Longo, U.G.; D’Abbraccio, J.; Massari, L.; Oddo, C.M.; Caponero, M.A. Single-plane neck movements and respiratory frequency monitoring: A smart system for computer workers. In Proceedings of the 2019 II Workshop on Metrology for Industry 4.0 and IoT (MetroInd4. 0&IoT), Naples, Italy, 4–6 June 2019; pp. 167–170. [Google Scholar]
- Presti, D.L.; Massaroni, C.; D’Abbraccio, J.; Massari, L.; Caponero, M.; Longo, U.G.; Formica, D.; Oddo, C.M.; Schena, E. Wearable system based on flexible FBG for respiratory and cardiac monitoring. IEEE Sens. J. 2019, 19, 7391–7398. [Google Scholar] [CrossRef]
- Puranik, K.A.; Kanthi, M. Wearable Device for Yogic Breathing. In Proceedings of the 2019 Amity International Conference on Artificial Intelligence (AICAI), Dubai, UAE, 4–6 February 2019; pp. 605–610. [Google Scholar]
- Soomro, A.M.; Jabbar, F.; Ali, M.; Lee, J.-W.; Mun, S.W.; Choi, K.H. All-range flexible and biocompatible humidity sensor based on poly lactic glycolic acid (PLGA) and its application in human breathing for wearable health monitoring. J. Mater. Sci. Mater. Electron. 2019, 30, 9455–9465. [Google Scholar] [CrossRef]
- Xiao, S.; Nie, J.; Tan, R.; Duan, X.; Ma, J.; Li, Q.; Wang, T. Fast-response ionogel humidity sensor for real-time monitoring of breathing rate. Mater. Chem. Front. 2019, 3, 484–491. [Google Scholar] [CrossRef]
- Yuasa, Y.; Suzuki, K. Wearable device for monitoring respiratory phases based on breathing sound and chest movement. Adv. Biomed. Eng. 2019, 8, 85–91. [Google Scholar] [CrossRef]
- Zhang, H.; Zhang, J.; Hu, Z.; Quan, L.; Shi, L.; Chen, J.; Xuan, W.; Zhang, Z.; Dong, S.; Luo, J. Waist-wearable wireless respiration sensor based on triboelectric effect. Nano Energy 2019, 59, 75–83. [Google Scholar] [CrossRef]
- Dan, G.; Zhao, J.; Chen, Z.; Yang, H.; Zhu, Z. A Novel Signal Acquisition System for Wearable Respiratory Monitoring. IEEE Access 2018, 6, 34365–34371. [Google Scholar] [CrossRef]
- Koyama, Y.; Nishiyama, M.; Watanabe, K. Smart Textile Using Hetero-Core Optical Fiber for Heartbeat and Respiration Monitoring. IEEE Sens. J. 2018, 18, 6175–6180. [Google Scholar] [CrossRef]
- Malik, S.; Ahmad, M.; Punjiya, M.; Sadeqi, A.; Baghini, M.S.; Sonkusale, S. Respiration Monitoring Using a Flexible Paper-Based Capacitive Sensor. In Proceedings of the 2018 IEEE Sensors, New Delhi, India, 28–31 October 2018; pp. 1–4. [Google Scholar]
- Martin, A.; Voix, J. In-Ear Audio Wearable: Measurement of Heart and Breathing Rates for Health and Safety Monitoring. IEEE Trans. Biomed. Eng. 2018, 65, 1256–1263. [Google Scholar] [CrossRef] [PubMed]
- Pang, Y.; Jian, J.; Tu, T.; Yang, Z.; Ling, J.; Li, Y.; Wang, X.; Qiao, Y.; Tian, H.; Yang, Y.; et al. Wearable humidity sensor based on porous graphene network for respiration monitoring. Biosens. Bioelectron. 2018, 116, 123–129. [Google Scholar] [CrossRef] [PubMed]
- Fajkus, M.; Nedoma, J.; Martinek, R.; Vasinek, V.; Nazeran, H.; Siska, P. A non-invasive multichannel hybrid fiber-optic sensor system for vital sign monitoring. Sensors 2017, 17, 111. [Google Scholar] [CrossRef] [PubMed]
- Gorgutsa, S.; Bellemare-Rousseau, S.; Guay, P.; Miled, A.; Messaddeq, Y. Smart T-shirt with wireless respiration sensor. In Proceedings of the 2017 IEEE Sensors, Glasgow, UK, 29 October–1 November 2017; pp. 1–3. [Google Scholar]
- Guay, P.; Gorgutsa, S.; LaRochelle, S.; Messaddeq, Y. Wearable contactless respiration sensor based on multi-material fibers integrated into textile. Sensors 2017, 17, 1050. [Google Scholar] [CrossRef] [PubMed]
- Kam, W.; Mohammed, W.S.; Leen, G.; O’Sullivan, K.; O’Keeffe, M.; O’Keeffe, S.; Lewis, E. All plastic optical fiber-based respiration monitoring sensor. In Proceedings of the 2017 IEEE Sensors, Glasgow, UK, 29 October–1 November 2017; pp. 1–3. [Google Scholar]
- Kam, W.; Mohammed, W.S.; Leen, G.; O’Keeffe, M.; O’Sullivan, K.; O’Keeffe, S.; Lewis, E. Compact and Low-Cost Optical Fiber Respiratory Monitoring Sensor Based on Intensity Interrogation. J. Light. Technol. 2017, 35, 4567–4573. [Google Scholar] [CrossRef]
- Kam, W.; Mohammed, W.S.; O’Keeffe, S.; Lewis, E. Portable 3-D Printed Plastic Optical Fibre Motion Sensor for Monitoring of Breathing Pattern and Respiratory Rate. In Proceedings of the IEEE 5th World Forum on Internet of Things (WF-IoT), Limerick, UK, 15–18 April 2019; pp. 144–148. [Google Scholar]
- Kano, S.; Fujii, M. Battery-powered wearable respiration sensor chip with nanocrystal thin film. In Proceedings of the 2017 IEEE Sensors, Glasgow, UK, 29 October–1 November 2017; pp. 1–3. [Google Scholar]
- Koch, E.; Dietzel, A. Stretchable sensor array for respiratory monitoring. In Proceedings of the 19th International Conference on Solid-State Sensors, Actuators and Microsystems (TRANSDUCERS), Kaohsiung, Taiwan, 18–22 June 2017; pp. 2227–2230. [Google Scholar]
- Milici, S.; Lorenzo, J.; Lázaro, A.; Villarino, R.; Girbau, D. Wireless Breathing Sensor Based on Wearable Modulated Frequency Selective Surface. IEEE Sens. J. 2017, 17, 1285–1292. [Google Scholar] [CrossRef]
- Nakazumi, R.; Inoue, M.; Yoshimi, T.; Fuchiyama, S.; Tsuchiya, H. Development of a respiration monitoring sensor for diving worker. In Proceedings of the 56th Annual Conference of the Society of Instrument and Control Engineers of Japan (SICE), Kanazawa, Japan, 19–22 September 2017; pp. 206–208. [Google Scholar]
- Park, S.W.; Das, P.S.; Chhetry, A.; Park, J.Y. A Flexible Capacitive Pressure Sensor for Wearable Respiration Monitoring System. IEEE Sens. J. 2017, 17, 6558–6564. [Google Scholar] [CrossRef]
- Presti, D.L.; Massaroni, C.; Formica, D.; Saccomandi, P.; Giurazza, F.; Caponero, M.A.; Schena, E. Smart Textile Based on 12 Fiber Bragg Gratings Array for Vital Signs Monitoring. IEEE Sens. J. 2017, 17, 6037–6043. [Google Scholar] [CrossRef]
- Valipour, A.; Abbasi-Kesbi, R. A heartbeat and respiration rate sensor based on phonocardiogram for healthcare applications. In Proceedings of the Iranian Conference on Electrical Engineering (ICEE), Tehran, Iran, 2–4 May 2017; pp. 45–48. [Google Scholar]
- White, N.M.; Ash, J.; Wei, Y.; Akerman, H. A Planar Respiration Sensor Based on a Capaciflector Structure. IEEE Sens. Lett. 2017, 1, 1–4. [Google Scholar] [CrossRef]
- Yan, H.; Zhang, L.; Yu, P.; Mao, L. Sensitive and fast humidity sensor based on a redox conducting supramolecular ionic material for respiration monitoring. Anal. Chem. 2017, 89, 996–1001. [Google Scholar] [CrossRef]
- Mahbub, I.; Wang, H.; Islam, S.K.; Pullano, S.A.; Fiorillo, A.S. A low power wireless breathing monitoring system using piezoelectric transducer. In Proceedings of the IEEE International Symposium on Medical Measurements and Applications (MeMeA), Benevento, Italy, 15–18 May 2016; pp. 1–5. [Google Scholar]
- Mahbub, I.; Pullano, S.A.; Wang, H.; Islam, S.K.; Fiorillo, A.S.; To, G.; Mahfouz, M.R. A low-power wireless piezoelectric sensor-based respiration monitoring system realized in CMOS process. IEEE Sens. J. 2017, 17, 1858–1864. [Google Scholar] [CrossRef]
- Chethana, K.; Guru Prasad, A.S.; Omkar, S.N.; Asokan, S. Fiber bragg grating sensor based device for simultaneous measurement of respiratory and cardiac activities. J. Biophotonics 2017, 10, 278–285. [Google Scholar] [CrossRef] [PubMed]
- Güder, F.; Ainla, A.; Redston, J.; Mosadegh, B.; Glavan, A.; Martin, T.J.; Whitesides, G.M. Paper-based electrical respiration sensor. Angew. Chem. Int. Ed. 2016, 55, 5727–5732. [Google Scholar] [CrossRef] [PubMed]
- Lepine, N.N.; Tajima, T.; Ogasawara, T.; Kasahara, R.; Koizumi, H. Robust respiration rate estimation using adaptive Kalman filtering with textile ECG sensor and accelerometer. In Proceedings of the 38th Annual International Conference of the IEEE Engineering in Medicine and Biology Society (EMBC), Orlando, FL, USA, 16–20 August 2016; pp. 3797–3800. [Google Scholar]
- Massaroni, C.; Ciocchetti, M.; Di Tomaso, G.; Saccomandi, P.; Caponero, M.A.; Polimadei, A.; Formica, D.; Schena, E. Design and preliminary assessment of a smart textile for respiratory monitoring based on an array of Fiber Bragg Gratings. In Proceedings of the of the 38th Annual International Conference of the IEEE Engineering in Medicine and Biology Society (EMBC), Orlando, FL, USA, 16–20 August 2016; pp. 6054–6057. [Google Scholar]
- Moradian, S.; Abdolvand, R. MEMS-based passive wireless respiration profile sensor. In Proceedings of the 2016 IEEE Sensors, Orlando, FL, USA, 30 October–3 November 2016; pp. 1–3. [Google Scholar]
- Nag, A.; Mukhopadhyay, S.C.; Kosel, J. Flexible carbon nanotube nanocomposite sensor for multiple physiological parameter monitoring. Sens. Actuators A Phys. 2016, 251, 148–155. [Google Scholar] [CrossRef]
- Nam, Y.; Reyes, B.A.; Chon, K.H. Estimation of Respiratory Rates Using the Built-in Microphone of a Smartphone or Headset. IEEE J. Biomed. Health Inform. 2016, 20, 1493–1501. [Google Scholar] [CrossRef] [PubMed]
- Raji, A.; Kanchana Devi, P.; Golda Jeyaseeli, P.; Balaganesh, N. Respiratory monitoring system for asthma patients based on IoT. In Proceedings of the Online International Conference on Green Engineering and Technologies (IC-GET), Coimbatore, India, 19 November 2016; pp. 1–6. [Google Scholar]
- Ramos-Garcia, R.I.; Da Silva, F.; Kondi, Y.; Sazonov, E.; Dunne, L.E. Analysis of a coverstitched stretch sensor for monitoring of breathing. In Proceedings of the 10th International Conference on Sensing Technology (ICST), Nanjing, China, 11–13 November 2016; pp. 1–6. [Google Scholar]
- Rotariu, C.; Cristea, C.; Arotaritei, D.; Bozomitu, R.G.; Pasarica, A. Continuous respiratory monitoring device for detection of sleep apnea episodes. In Proceedings of the IEEE 22nd International Symposium for Design and Technology in Electronic Packaging (SIITME), Oradea, Romania, 20–23 October 2016; pp. 106–109. [Google Scholar]
- Atalay, O.; Kennon, W.R.; Demirok, E. Weft-Knitted Strain Sensor for Monitoring Respiratory Rate and Its Electro-Mechanical Modeling. IEEE Sens. J. 2015, 15, 110–122. [Google Scholar] [CrossRef]
- Ciocchetti, M.; Massaroni, C.; Saccomandi, P.; Caponero, M.A.; Polimadei, A.; Formica, D.; Schena, E. Smart textile based on fiber bragg grating sensors for respiratory monitoring: Design and preliminary trials. Biosensors 2015, 5, 602–615. [Google Scholar] [CrossRef]
- Estrada, L.; Torres, A.; Sarlabous, L.; Jané, R. Respiratory signal derived from the smartphone built-in accelerometer during a Respiratory Load Protocol. In Proceedings of the 37th Annual International Conference of the IEEE Engineering in Medicine and Biology Society (EMBC), Milan, Italy, 25–29 August 2015; pp. 6768–6771. [Google Scholar]
- Gargiulo, G.D.; Gunawardana, U.; O’Loughlin, A.; Sadozai, M.; Varaki, E.S.; Breen, P.P. A wearable contactless sensor suitable for continuous simultaneous monitoring of respiration and cardiac activity. J. Sens. 2015, 2015, 151859. [Google Scholar] [CrossRef]
- Grlica, J.; Martinović, T.; Džapo, H. Capacitive sensor for respiration monitoring. In Proceedings of the IEEE Sensors Applications Symposium (SAS), Zadar, Croatia, 13–15 April 2015; pp. 1–6. [Google Scholar]
- Hernandez, J.; McDuff, D.; Picard, R.W. Biowatch: Estimation of heart and breathing rates from wrist motions. In Proceedings of the 9th International Conference on Pervasive Computing Technologies for Healthcare (PervasiveHealth), Istanbul, Turkey, 20–23 May 2015; pp. 169–176. [Google Scholar]
- Jiang, P.; Zhao, S.; Zhu, R. Smart Sensing Strip Using Monolithically Integrated Flexible Flow Sensor for Noninvasively Monitoring Respiratory Flow. Sensors 2015, 15, 31738–31750. [Google Scholar] [CrossRef]
- Karlen, W.; Garde, A.; Myers, D.; Scheffer, C.; Ansermino, J.M.; Dumont, G.A. Estimation of Respiratory Rate From Photoplethysmographic Imaging Videos Compared to Pulse Oximetry. IEEE J. Biomed. Health Inform. 2015, 19, 1331–1338. [Google Scholar] [CrossRef]
- Kazmi, S.A.; Shah, M.H.; Khan, S.; Khalifa, O.O. Respiratory rate (RR) based analysis of PPG signal for different physiological conditions. In Proceedings of the International Conference on Smart Sensors and Application (ICSSA), Kuala Lumpur, Malaysia, 26–28 May 2015; pp. 166–171. [Google Scholar]
- Teichmann, D.; De Matteis, D.; Bartelt, T.; Walter, M.; Leonhardt, S. A Bendable and Wearable Cardiorespiratory Monitoring Device Fusing Two Noncontact Sensor Principles. IEEE J. Biomed. Health Inform. 2015, 19, 784–793. [Google Scholar] [CrossRef] [PubMed]
- Wei, C.; Lin, Y.; Chen, T.; Lin, R.; Liu, T. Respiration Detection Chip with Integrated Temperature-Insensitive MEMS Sensors and CMOS Signal Processing Circuits. IEEE Trans. Biomed. Circuits Syst. 2015, 9, 105–112. [Google Scholar] [CrossRef] [PubMed]
- Bifulco, P.; Gargiulo, G.D.; d’Angelo, G.; Liccardo, A.; Romano, M.; Clemente, F.; Cesarelli, M.; Angelo, G.; Liccardo, A.; Romano, M.; et al. Monitoring of respiration, seismocardiogram and heart sounds by a PVDF piezo film sensor. Measurement 2014, 11, 786–789. [Google Scholar]
- Fekr, A.R.; Radecka, K.; Zilic, Z. Tidal volume variability and respiration rate estimation using a wearable accelerometer sensor. In Proceedings of the 4th International Conference on Wireless Mobile Communication and Healthcare—Transforming Healthcare Through Innovations in Mobile and Wireless Technologies (MOBIHEALTH), Athens, Greece, 3–5 November 2014; pp. 1–6. [Google Scholar]
- Agcayazi, T.; Yokus, M.A.; Gordon, M.; Ghosh, T.; Bozkurt, A. A stitched textile-based capacitive respiration sensor. In Proceedings of the 2017 IEEE Sensors, Glasgow, UK, 29 October–1 November 2017; pp. 1–3. [Google Scholar]
- Hesse, M.; Christ, P.; Hörmann, T.; Rückert, U. A respiration sensor for a chest-strap based wireless body sensor. In Proceedings of the 2014 IEEE Sensors, Valencia, Spain, 2–5 November 2014; pp. 490–493. [Google Scholar]
- Krehel, M.; Schmid, M.; Rossi, R.; Boesel, L.; Bona, G.-L.; Scherer, L. An Optical Fibre-Based Sensor for Respiratory Monitoring. Sensors 2014, 14, 13088–13101. [Google Scholar] [CrossRef]
- Min, S.D.; Yun, Y.; Shin, H. Simplified Structural Textile Respiration Sensor Based on Capacitive Pressure Sensing Method. IEEE Sens. J. 2014, 14, 3245–3251. [Google Scholar] [CrossRef]
- Petrović, M.D.; Petrovic, J.; Daničić, A.; Vukčević, M.; Bojović, B.; Hadžievski, L.; Allsop, T.; Lloyd, G.; Webb, D.J. Non-invasive respiratory monitoring using long-period fiber grating sensors. Biomed. Opt. Express 2014, 5, 1136–1144. [Google Scholar] [CrossRef]
- Sanchez, P.; Zamarreno, C.R.; Zamarreo, C.R.; Hernaez, M.; Matias, I.R.; Arregui, F.J. Exhaled breath optical fiber sensor based on LMRs for respiration monitoring. In Proceedings of the 2014 IEEE Sensors, Valencia, Spain, 2–5 November 2014; pp. 1142–1145. [Google Scholar]
- Wo, J.; Wang, H.; Sun, Q.; Shum, P.P.; Liu, D. Noninvasive respiration movement sensor based on distributed Bragg reflector fiber laser with beat frequency interrogation. J. Biomed. Opt. 2014, 19, 17003. [Google Scholar] [CrossRef]
- Yang, C.M.; Yang, T.L.; Wu, C.C.; Hung, S.H.; Liao, M.H.; Su, M.J.; Hsieh, H.C. Textile-based capacitive sensor for a wireless wearable breath monitoring system. In Proceedings of the IEEE International Conference on Consumer Electronics (ICCE), Las Vegas, NV, USA, 11–14 January 2014; pp. 232–233. [Google Scholar]
- Yoon, J.-W.; Noh, Y.-S.; Kwon, Y.-S.; Kim, W.-K.; Yoon, H.-R. Improvement of dynamic respiration monitoring through sensor fusion of accelerometer and gyro-sensor. J. Electr. Eng. Technol. 2014, 9, 334–343. [Google Scholar] [CrossRef]
- Chan, A.M.; Selvaraj, N.; Ferdosi, N.; Narasimhan, R. Wireless patch sensor for remote monitoring of heart rate, respiration, activity, and falls. In Proceedings of the 35th Annual international conference of the IEEE engineering in medicine and biology society (EMBC), Osaka, Japan, 3–7 July 2013; pp. 6115–6118. [Google Scholar]
- Huang, Y.; Huang, K. Monitoring of breathing rate by a piezofilm sensor using pyroelectric effect. In Proceedings of the 1st International Conference on Orange Technologies (ICOT), Tainan, Taiwan, 12–16 March 2013; pp. 99–102. [Google Scholar]
- Aileni, R.M.; Pasca, S.; Strungaru, R.; Valderrama, C. Biomedical signal acquisition for respiration monitoring by flexible analog wearable sensors. In Proceedings of the 2017 E-Health and Bioengineering Conference (EHB), Sinaia, Romania, 22–24 June 2017; pp. 81–84. [Google Scholar]
- Padasdao, B.; Shahhaidar, E.; Stickley, C.; Boric-Lubecke, O. Electromagnetic Biosensing of Respiratory Rate. IEEE Sens. J. 2013, 13, 4204–4211. [Google Scholar] [CrossRef]
- Chiu, Y.-Y.; Lin, W.-Y.; Wang, H.-Y.; Huang, S.-B.; Wu, M.-H. Development of a piezoelectric polyvinylidene fluoride (PVDF) polymer-based sensor patch for simultaneous heartbeat and respiration monitoring. Sens. Actuators A Phys. 2013, 189, 328–334. [Google Scholar] [CrossRef]
- Favero, F.C.; Pruneri, V.; Villatoro, J. Microstructured optical fiber interferometric breathing sensor. J. Biomed. Opt. 2012, 17, 37006. [Google Scholar] [CrossRef] [PubMed]
- Mathew, J.; Semenova, Y.; Farrell, G. A miniature optical breathing sensor. Biomed. Opt. Express 2012, 3, 3325–3331. [Google Scholar] [CrossRef] [PubMed]
- Scully, C.G.; Lee, J.; Meyer, J.; Gorbach, A.M.; Granquist-Fraser, D.; Mendelson, Y.; Chon, K.H. Physiological Parameter Monitoring from Optical Recordings With a Mobile Phone. IEEE Trans. Biomed. Eng. 2012, 59, 303–306. [Google Scholar] [CrossRef] [PubMed]
- Trobec, R.; Rashkovska, A.; Avbelj, V. Two proximal skin electrodes—A body sensor for respiration rate. Sensors 2012, 12, 13813–13828. [Google Scholar] [CrossRef] [PubMed]
- Witt, J.; Narbonneau, F.; Schukar, M.; Krebber, K.; De Jonckheere, J.; Jeanne, M.; Kinet, D.; Paquet, B.; Depre, A.; D’Angelo, L.T.; et al. Medical Textiles with Embedded Fiber Optic Sensors for Monitoring of Respiratory Movement. IEEE Sens. J. 2012, 12, 246–254. [Google Scholar] [CrossRef]
- Zięba, J.; Frydrysiak, M.; Błaszczyk, J. Textronic clothing with resistance textile sensor to monitoring frequency of human breathing. In Proceedings of the IEEE International Symposium on Medical Measurements and Applications Proceedings, Budapest, Hungary, 18–19 May 2012; pp. 1–6. [Google Scholar]
- Carlos, R.; Coyle, S.; Corcoran, B.; Diamond, D.; Tomas, W.; Aaron, M.; Stroiescu, F.; Daly, K. Web-based sensor streaming wearable for respiratory monitoring applications. In Proceedings of the 2011 IEEE Sensors, Limerick, UK, 28–31 October 2011; pp. 901–903. [Google Scholar]
- Ciobotariu, R.; Rotariu, C.; Adochiei, F.; Costin, H. Wireless breathing system for long term telemonitoring of respiratory activity. In Proceedings of the 7th International Symposium on Advanced Topics in Electrical (ATEE), Bucharest, Romania, 12–14 May 2011; pp. 1–4. [Google Scholar]
- Basra, A.; Mukhopadhayay, B.; Kar, S. Temperature sensor based ultra low cost respiration monitoring system. In Proceedings of the 9th International Conference on Communication Systems and Networks (COMSNETS), Bengaluru, India, 4–8 January 2017; pp. 530–535. [Google Scholar]
- Guo, L.; Berglin, L.; Li, Y.J.; Mattila, H.; Mehrjerdi, A.K.; Skrifvars, M. ’Disappearing Sensor’-Textile Based Sensor for Monitoring Breathing. In Proceedings of the International Conference on Control, Automation and Systems Engineering (CASE), Singapore, 30–31 July 2011; pp. 1–4. [Google Scholar]
- Liu, S.; Gao, R.X.; Freedson, P.S. Non-invasive respiration and ventilation prediction using a single abdominal sensor belt. In Proceedings of the 2011 IEEE Signal Processing in Medicine and Biology Symposium (SPMB), New York, NY, USA, 10 December 2011; pp. 1–5. [Google Scholar]
- Liu, G.-Z.; Guo, Y.-W.; Zhu, Q.-S.; Huang, B.-Y.; Wang, L. Estimation of respiration rate from three-dimensional acceleration data based on body sensor network. Telemed. E-Health 2011, 17, 705–711. [Google Scholar] [CrossRef]
- Mann, J.; Rabinovich, R.; Bates, A.; Giavedoni, S.; MacNee, W.; Arvind, D.K. Simultaneous Activity and Respiratory Monitoring Using an Accelerometer. In Proceedings of the 2011 International Conference on Body Sensor Networks, Dallas, TX, USA, 23–25 May 2011; pp. 139–143. [Google Scholar]
- Ono, T.; Takegawa, H.; Ageishi, T.; Takashina, M.; Numasaki, H.; Matsumoto, M.; Teshima, T. Respiratory monitoring with an acceleration sensor. Phys. Med. Biol. 2011, 56, 6279–6289. [Google Scholar] [CrossRef]
- Silva, A.F.; Carmo, J.; Mendes, P.M.; Correia, J.H. Simultaneous cardiac and respiratory frequency measurement based on a single fiber Bragg grating sensor. Meas. Sci. Technol. Meas. Sci. Technol. 2011, 22, 75801. [Google Scholar] [CrossRef]
- Yang, C.M.; Yang, T.; Wu, C.C.; Chu, N.N.Y. A breathing game with capacitive textile sensors. In Proceedings of the IEEE International Games Innovation Conference (IGIC), Orange, CA, USA, 2–3 November 2011; pp. 134–136. [Google Scholar]
- Yoo, W.J.; Jang, K.W.; Seo, J.K.; Heo, J.Y.; Moon, J.S.; Jun, J.H.; Park, J.-Y.; Lee, B. Development of optical fiber-based respiration sensor for noninvasive respiratory monitoring. Opt. Rev. 2011, 18, 132–138. [Google Scholar] [CrossRef]
- Yoo, W.-J.; Jang, K.-W.; Seo, J.-K.; Heo, J.-Y.; Moon, J.-S.; Park, J.-Y.; Lee, B.-S. Development of respiration sensors using plastic optical fiber for respiratory monitoring inside MRI system. J. Opt. Soc. Korea 2010, 14, 235–239. [Google Scholar] [CrossRef]
- Yoo, W.; Jang, K.; Seo, J.; Heo, J.Y.; Moon, J.S.; Lee, B.; Park, J.-Y. Development of Nasal-cavity-and Abdomen-attached Fiber-optic Respiration Sensors. J. Korean Phys. Soc. 2010, 57, 1550–1554. [Google Scholar]
- Bhattacharya, R.; Bandyopadhyay, N.; Kalaivani, S. Real time Android app based respiration rate monitor. In Proceedings of the International Conference of Electronics, Communication and Aerospace Technology (ICECA), Coimbatore, India, 20–22 April 2017; Volume 1, pp. 709–712. [Google Scholar]
- Ansari, S.; Belle, A.; Najarian, K.; Ward, K. Impedance plethysmography on the arms: Respiration monitoring. In Proceedings of the IEEE International Conference on Bioinformatics and Biomedicine Workshops (BIBMW), Hong Kong, China, 18 December 2010; pp. 471–472. [Google Scholar]
- De Jonckheere, J.; Jeanne, M.; Narbonneau, F.; Witt, J.; Paquet, B.; Kinet, D.; Kreber, K.; Logier, R. OFSETH: A breathing motions monitoring system for patients under MRI. In Proceedings of the Annual International Conference of the IEEE Engineering in Medicine and Biology, Buenos Aires, Argentina, 31 August–4 September 2010; pp. 1016–1019. [Google Scholar]
- Mitchell, E.; Coyle, S.; O’Connor, N.E.; Diamond, D.; Ward, T. Breathing Feedback System with Wearable Textile Sensors. In Proceedings of the International Conference on Body Sensor Networks, Singapore, 7–9 June 2010; pp. 56–61. [Google Scholar]
- Zhang, Z.; Wu, H.; Wang, W.; Wang, B. A smartphone based respiratory biofeedback system. In Proceedings of the 3rd International Conference on Biomedical Engineering and Informatics, Yantai, China, 16–18 October 2010; Volume 2, pp. 717–720. [Google Scholar]
- Kundu, S.K.; Kumagai, S.; Sasaki, M. A wearable capacitive sensor for monitoring human respiratory rate. Jpn. J. Appl. Phys. 2013, 52, 04CL05. [Google Scholar] [CrossRef]
- Das, T.; Guha, S.; Banerjee, N.; Basak, P. Development of thermistor based low cost high sensitive respiration rate measurement system using audio software with audio input. In Proceedings of the Third International Conference on Biosignals, Images and Instrumentation (ICBSII), Chennai, India, 16–18 March 2017; pp. 1–3. [Google Scholar]
- Al-Wahedi, A.; Al-Shams, M.; Albettar, M.A.; Alawsh, S.; Muqaibel, A. Wireless Monitoring of Respiration and Heart Rates Using Software-Defined-Radio. In Proceedings of the 2019 16th International Multi-Conference on Systems, Signals & Devices (SSD), Istanbul, Turkey, 21–24 March 2019; pp. 529–532. [Google Scholar]
- Chen, Y.; Kaneko, M.; Hirose, S.; Chen, W. Real-time Respiration Measurement during Sleep Using a Microwave Sensor. In Proceedings of the 41st Annual International Conference of the IEEE Engineering in Medicine and Biology Society (EMBC), Berlin, Germany, 23–27 July 2019; pp. 3791–3794. [Google Scholar]
- Gunaratne, P.; Tamura, H.; Yoshida, C.; Sakurai, K.; Tanno, K.; Takahashi, N.; Nagata, J. A Study on Breathing and Heartbeat Monitoring System during Sleeping Using Multi-Piezoelectric Elements. In Proceedings of the 2019 Moratuwa Engineering Research Conference (MERCon), Moratuwa, Sri Lanka, 3–5 June 2019; pp. 382–387. [Google Scholar]
- Guo, S.; Zhao, X.; Matsuo, K.; Liu, J.; Mukai, T. Unconstrained Detection of the Respiratory Motions of Chest and Abdomen in Different Lying Positions Using a Flexible Tactile Sensor Array. IEEE Sens. J. 2019, 19, 10067–10076. [Google Scholar] [CrossRef]
- Isono, S.; Nozaki-Taguchi, N.; Hasegawa, M.; Kato, S.; Todoroki, S.; Masuda, S.; Iida, N.; Nishimura, T.; Noto, M.; Sato, Y. Contact-free unconstraint respiratory measurements with load cells under the bed in awake healthy volunteers: Breath-by-breath comparison with pneumotachography. J. Appl. Physiol. 2019, 126, 1432–1441. [Google Scholar] [CrossRef]
- Ivanovs, A.; Nikitenko, A.; Di Castro, M.; Torims, T.; Masi, A.; Ferre, M. Multisensor low-cost system for real time human detection and remote respiration monitoring. In Proceedings of the Third IEEE 7International Conference on Robotic Computing (IRC), Naples, Italy, 25–27 February 2019; pp. 254–257. [Google Scholar]
- Joshi, R.; Bierling, B.; Feijs, L.; van Pul, C.; Andriessen, P. Monitoring the respiratory rate of preterm infants using an ultrathin film sensor embedded in the bedding: A comparative feasibility study. Physiol. Meas. 2019, 40, 45003. [Google Scholar] [CrossRef]
- Krej, M.; Baran, P.; Dziuda, Ł. Detection of respiratory rate using a classifier of waves in the signal from a FBG-based vital signs sensor. Comput. Methods Programs Biomed. 2019, 177, 31–38. [Google Scholar] [CrossRef]
- Lorato, I.; Bakkes, T.; Stuijk, S.; Meftah, M.; De Haan, G. Unobtrusive respiratory flow monitoring using a thermopile array: A feasibility study. Appl. Sci. 2019, 9, 2449. [Google Scholar] [CrossRef]
- Massaroni, C.; Lo Presti, D.; Formica, D.; Silvestri, S.; Schena, E. Non-contact monitoring of breathing pattern and respiratory rate via RGB signal measurement. Sensors 2019, 19, 2758. [Google Scholar] [CrossRef]
- Park, S.; Choi, H.; Yang, H.C.; Yoon, J.; Shin, H. Force-Sensing-Based Unobtrusive System for Awakening and Respiration Rate Analysis during Sleep. IEEE Sens. J. 2019, 19, 1917–1924. [Google Scholar] [CrossRef]
- Walterscheid, I.; Biallawons, O.; Berens, P. Contactless Respiration and Heartbeat Monitoring of Multiple People Using a 2-D Imaging Radar. In Proceedings of the 2019 41st Annual International Conference of the IEEE Engineering in Medicine and Biology Society (EMBC), Berlin, Germany, 23–27 July 2019; pp. 3720–3725. [Google Scholar]
- Wang, T.; Zhang, D.; Wang, L.; Zheng, Y.; Gu, T.; Dorizzi, B.; Zhou, X. Contactless respiration monitoring using ultrasound signal with off-the-shelf audio devices. IEEE Internet Things J. 2018, 6, 2959–2973. [Google Scholar] [CrossRef]
- Xu, X.; Yu, J.; Chen, Y.; Zhu, Y.; Kong, L.; Li, M. BreathListener: Fine-grained Breathing Monitoring in Driving Environments Utilizing Acoustic Signals. In Proceedings of the 17th Annual International Conference on Mobile Systems, Applications, and Services, Breckenridge, CO, USA, 17–20 June 2019; pp. 54–66. [Google Scholar]
- Yang, Y.; Cao, J.; Liu, X.; Liu, X. Multi-Breath: Separate Respiration Monitoring for Multiple Persons with UWB Radar. In Proceedings of the IEEE 43rd Annual Computer Software and Applications Conference (COMPSAC), Milwaukee, WI, USA, 15–19 July 2019; Volume 1, pp. 840–849. [Google Scholar]
- Chen, C.; Han, Y.; Chen, Y.; Lai, H.; Zhang, F.; Wang, B.; Liu, K.J.R. TR-BREATH: Time-Reversal Breathing Rate Estimation and Detection. IEEE Trans. Biomed. Eng. 2018, 65, 489–501. [Google Scholar] [CrossRef] [PubMed]
- Chen, S.; Wu, N.; Ma, L.; Lin, S.; Yuan, F.; Xu, Z.; Li, W.; Wang, B.; Zhou, J. Noncontact heartbeat and respiration monitoring based on a hollow microstructured self-powered pressure sensor. ACS Appl. Mater. Interfaces 2018, 10, 3660–3667. [Google Scholar] [CrossRef] [PubMed]
- Massaroni, C.; Schena, E.; Silvestri, S.; Taffoni, F.; Merone, M. Measurement system based on RBG camera signal for contactless breathing pattern and respiratory rate monitoring. In Proceedings of the IEEE International Symposium on Medical Measurements and Applications (MeMeA), Rome, Italy, 11–13 June 2018; pp. 1–6. [Google Scholar]
- Massaroni, C.; Lo Presti, D.; Saccomandi, P.; Caponero, M.A.; D’Amato, R.; Schena, E. Fiber Bragg Grating Probe for Relative Humidity and Respiratory Frequency Estimation: Assessment During Mechanical Ventilation. IEEE Sens. J. 2018, 18, 2125–2130. [Google Scholar] [CrossRef]
- Sadek, I.; Seet, E.; Biswas, J.; Abdulrazak, B.; Mokhtari, M. Nonintrusive Vital Signs Monitoring for Sleep Apnea Patients: A Preliminary Study. IEEE Access 2018, 6, 2506–2514. [Google Scholar] [CrossRef]
- Azimi, H.; Soleimani Gilakjani, S.; Bouchard, M.; Bennett, S.; Goubran, R.A.; Knoefel, F. Breathing signal combining for respiration rate estimation in smart beds. In Proceedings of the IEEE International Symposium on Medical Measurements and Applications (MeMeA), Rochester, MN, USA, 7–10 May 2017; pp. 303–307. [Google Scholar]
- Cho, Y.; Bianchi-Berthouze, N.; Julier, S.J.; Marquardt, N. ThermSense: Smartphone-based breathing sensing platform using noncontact low-cost thermal camera. In Proceedings of the 2017 7th International Conference on Affective Computing and Intelligent Interaction Workshops and Demos (ACIIW), San Antonio, TX, USA, 23–26 October 2017; pp. 83–84. [Google Scholar]
- Leicht, L.; Vetter, P.; Leonhardt, S.; Teichmann, D. The PhysioBelt: A safety belt integrated sensor system for heart activity and respiration. In Proceedings of the 2017 IEEE International Conference on Vehicular Electronics and Safety (ICVES), Vienna, Austria, 27–28 June 2017; pp. 191–195. [Google Scholar]
- Li, K.; Xu, W.; Zhan, N.; Wan, K.; Yu, C.; Yu, C. Non-wearable respiration monitoring based on Mach-Zehnder interferometer. In Proceedings of the Conference on Lasers and Electro-Optics Pacific Rim (CLEO-PR), Singapore, 31 July–4 August 2017; pp. 1–2. [Google Scholar]
- Li, M.H.; Yadollahi, A.; Taati, B. Noncontact Vision-Based Cardiopulmonary Monitoring in Different Sleeping Positions. IEEE J. Biomed. Health Inform. 2017, 21, 1367–1375. [Google Scholar] [CrossRef]
- Procházka, A.; Charvátová, H.; Vyšata, O.; Kopal, J.; Chambers, J. Breathing Analysis Using Thermal and Depth Imaging Camera Video Records. Sensors 2017, 17, 1408. [Google Scholar] [CrossRef] [PubMed]
- Wang, X.; Huang, R.; Mao, S. SonarBeat: Sonar Phase for Breathing Beat Monitoring with Smartphones. In Proceedings of the 26th International Conference on Computer Communication and Networks (ICCCN), Vancouver, BC, Canada, 31 July–3 August 2017; pp. 1–8. [Google Scholar]
- Kukkapalli, R.; Banerjee, N.; Robucci, R.; Kostov, Y. Micro-radar wearable respiration monitor. In Proceedings of the 2016 IEEE Sensors, Orlando, FL, USA, 30 October–3 November 2016; pp. 1–3. [Google Scholar]
- Procházka, A.; Schätz, M.; Vyšata, O.; Vališ, M. Microsoft Kinect Visual and Depth Sensors for Breathing and Heart Rate Analysis. Sensors 2016, 16, 996. [Google Scholar] [CrossRef]
- Tveit, D.M.; Engan, K.; Austvoll, I.; Meinich-Bache, Ø. Motion based detection of respiration rate in infants using video. In Proceedings of the IEEE International Conference on Image Processing (ICIP), Phoenix, AZ, USA, 25–28 September 2016; pp. 1225–1229. [Google Scholar]
- Erden, F.; Alkar, A.Z.; Cetin, A.E. Contact-free measurement of respiratory rate using infrared and vibration sensors. Infrared Phys. Technol. 2015, 73, 88–94. [Google Scholar] [CrossRef]
- Liu, J.J.; Huang, M.; Xu, W.; Zhang, X.; Stevens, L.; Alshurafa, N.; Sarrafzadeh, M. BreathSens: A Continuous On-Bed Respiratory Monitoring System With Torso Localization Using an Unobtrusive Pressure Sensing Array. IEEE J. Biomed. Health Inform. 2015, 19, 1682–1688. [Google Scholar] [CrossRef]
- Pereira, C.B.; Yu, X.; Blazek, V.; Leonhardt, S. Robust remote monitoring of breathing function by using infrared thermography. In Proceedings of the 37th Annual International Conference of the IEEE Engineering in Medicine and Biology Society (EMBC), Milan, Italy, 25–29 August 2015; pp. 4250–4253. [Google Scholar]
- Ravichandran, R.; Saba, E.; Chen, K.-Y.; Goel, M.; Gupta, S.; Patel, S.N. WiBreathe: Estimating respiration rate using wireless signals in natural settings in the home. In Proceedings of the IEEE International Conference on Pervasive Computing and Communications (PerCom), St. Louis, MO, USA, 23–27 March 2015; pp. 131–139. [Google Scholar]
- Sasaki, E.; Kajiwara, A. Multiple Respiration Monitoring by Stepped-FM UWB Sensor. In Proceedings of the 2015 IEEE International Conference on Computational Intelligence Communication Technology, Ghaziabad, India, 13–14 February 2015; pp. 406–409. [Google Scholar]
- Zakrzewski, M.; Vehkaoja, A.; Joutsen, A.S.; Palovuori, K.T.; Vanhala, J.J. Noncontact Respiration Monitoring During Sleep with Microwave Doppler Radar. IEEE Sens. J. 2015, 15, 5683–5693. [Google Scholar] [CrossRef]
- Arlotto, P.; Grimaldi, M.; Naeck, R.; Ginoux, J.-M. An ultrasonic contactless sensor for breathing monitoring. Sensors 2014, 14, 15371–15386. [Google Scholar] [CrossRef] [PubMed]
- Bernacchia, N.; Scalise, L.; Casacanditella, L.; Ercoli, I.; Marchionni, P.; Tomasini, E.P. Non contact measurement of heart and respiration rates based on KinectTM. In Proceedings of the 2014 IEEE International Symposium on Medical Measurements and Applications (MeMeA), Lisboa, Portugal, 11–12 June 2014; pp. 1–5. [Google Scholar]
- Chen, Z.; Lau, D.; Teo, J.T.; Ng, S.H.; Yang, X.; Kei, P.L. Simultaneous measurement of breathing rate and heart rate using a microbend multimode fiber optic sensor. J. Biomed. Opt. 2014, 19, 1–11. [Google Scholar] [CrossRef] [PubMed]
- Luis, J.; Roa Romero, L.M.; Galan, J.A.; Naranjo, D.; Estudillo-Valderrama, M.; Barbarov-Rostán, G.; Rubia-Marcos, C. Design and Implementation of a Smart Sensor for Respiratory Rate Monitoring. Sensors 2014, 14, 3019–3032. [Google Scholar] [CrossRef] [PubMed]
- Mukai, T.; Matsuo, K.; Kato, Y.; Shimizu, A.; Guo, S. Determination of locations on a tactile sensor suitable for respiration and heartbeat measurement of a person on a bed. In Proceedings of the 36th Annual International Conference of the IEEE Engineering in Medicine and Biology Society, Chicago, IL, USA, 26–30 August 2014; pp. 66–69. [Google Scholar]
- Nukaya, S.; Sugie, M.; Kurihara, Y.; Hiroyasu, T.; Watanabe, K.; Tanaka, H. A noninvasive heartbeat, respiration, and body movement monitoring system for neonates. Artif. Life Robot. 2014, 19, 414–419. [Google Scholar] [CrossRef]
- Patwari, N.; Brewer, L.; Tate, Q.; Kaltiokallio, O.; Bocca, M. Breathfinding: A Wireless Network That Monitors and Locates Breathing in a Home. IEEE J. Sel. Top. Signal Process. 2014, 8, 30–42. [Google Scholar] [CrossRef]
- Patwari, N.; Wilson, J.; Ananthanarayanan, S.; Kasera, S.K.; Westenskow, D.R. Monitoring Breathing via Signal Strength in Wireless Networks. IEEE Trans. Mob. Comput. 2014, 13, 1774–1786. [Google Scholar] [CrossRef]
- Taheri, T.; Sant’Anna, A. Non-invasive breathing rate detection using a very low power ultra-wide-band radar. In Proceedings of the IEEE International Conference on Bioinformatics and Biomedicine (BIBM), Belfast, UK, 2–5 November 2014; pp. 78–83. [Google Scholar]
- Bartula, M.; Tigges, T.; Muehlsteff, J. Camera-based system for contactless monitoring of respiration. In Proceedings of the 35th Annual International Conference of the IEEE Engineering in Medicine and Biology Society (EMBC), Osaka, Japan, 3–7 July 2013; pp. 2672–2675. [Google Scholar]
- Chen, R.; Formenti, F.; Obeid, A.; Hahn, C.E.W.; Farmery, A. A fibre-optic oxygen sensor for monitoring human breathing. Physiol. Meas. 2013, 34, N71–N81. [Google Scholar] [CrossRef]
- Dziuda, Ł.; Krej, M.; Skibniewski, F.W. Fiber Bragg Grating Strain Sensor Incorporated to Monitor Patient Vital Signs during MRI. IEEE Sens. J. 2013, 13, 4986–4991. [Google Scholar] [CrossRef]
- Klap, T.; Shinar, Z. Using piezoelectric sensor for continuous-contact-free monitoring of heart and respiration rates in real-life hospital settings. In Proceedings of the Computing in Cardiology, Zaragoza, Spain, 22–25 September 2013; pp. 671–674. [Google Scholar]
- Šprager, S.; Zazula, D. Detection of heartbeat and respiration from optical interferometric signal by using wavelet transform. Comput. Methods Programs Biomed. 2013, 111, 41–51. [Google Scholar] [CrossRef]
- Vinci, G.; Lindner, S.; Barbon, F.; Mann, S.; Hofmann, M.; Duda, A.; Weigel, R.; Koelpin, A. Six-port radar sensor for remote respiration rate and heartbeat vital-sign monitoring. IEEE Trans. Microw. Theory Tech. 2013, 61, 2093–2100. [Google Scholar] [CrossRef]
- Yavari, E.; Jou, H.; Lubecke, V.; Boric-Lubecke, O. Doppler radar sensor for occupancy monitoring. In Proceedings of the IEEE Topical Conference on Power Amplifiers for Wireless and Radio Applications, Santa Clara, CA, USA, 20 January 2013; pp. 145–147. [Google Scholar]
- Aoki, H.; Miyazaki, M.; Nakamura, H.; Furukawa, R.; Sagawa, R.; Kawasaki, H. Non-contact respiration measurement using structured light 3-D sensor. In Proceedings of the SICE Annual Conference (SICE), Akita, Japan, 20–23 August 2012; pp. 614–618. [Google Scholar]
- Boccanfuso, L.; O’Kane, J.M. Remote measurement of breathing rate in real time using a high precision, single-point infrared temperature sensor. In Proceedings of the 4th IEEE RAS EMBS International Conference on Biomedical Robotics and Biomechatronics (BioRob), Rome, Italy, 24–27 June 2012; pp. 1704–1709. [Google Scholar]
- Brüser, C.; Kerekes, A.; Winter, S.; Leonhardt, S. Multi-channel optical sensor-array for measuring ballistocardiograms and respiratory activity in bed. In Proceedings of the Annual International Conference of the IEEE Engineering in Medicine and Biology Society, San Diego, CA, USA, 28 August–1 September 2012; pp. 5042–5045. [Google Scholar]
- Chen, Z.; Teo, J.T.; Ng, S.H.; Yang, X. Plastic optical fiber microbend sensor used as breathing sensor. In Proceedings of the 2012 IEEE Sensors, Taipei, Taiwan, 28–31 October 2012; pp. 1–4. [Google Scholar]
- Gu, C.; Li, R.; Zhang, H.; Fung, A.Y.C.; Torres, C.; Jiang, S.B.; Li, C. Accurate respiration measurement using DC-coupled continuous-wave radar sensor for motion-adaptive cancer radiotherapy. IEEE Trans. Biomed. Eng. 2012, 59, 3117–3123. [Google Scholar] [PubMed]
- Lokavee, S.; Puntheeranurak, T.; Kerdcharoen, T.; Watthanwisuth, N.; Tuantranont, A. Sensor pillow and bed sheet system: Unconstrained monitoring of respiration rate and posture movements during sleep. In Proceedings of the IEEE International Conference on Systems, Man, and Cybernetics (SMC), Seoul, Korea, 14–17 October 2012; pp. 1564–1568. [Google Scholar]
- Shimomura, N.; Otsu, M.; Kajiwara, A. Empirical study of remote respiration monitoring sensor using wideband system. In Proceedings of the 6th International Conference on Signal Processing and Communication Systems, Gold Coast, Australia, 12–14 December 2012; pp. 1–5. [Google Scholar]
- Xia, J.; Siochi, R.A. A real-time respiratory motion monitoring system using KINECT: Proof of concept. Med. Phys. 2013, 39, 2682–2685. [Google Scholar] [CrossRef] [PubMed]
- Lai, J.C.Y.; Xu, Y.; Gunawan, E.; Chua, E.C.; Maskooki, A.; Guan, Y.L.; Low, K.; Soh, C.B.; Poh, C. Wireless Sensing of Human Respiratory Parameters by Low-Power Ultrawideband Impulse Radio Radar. IEEE Trans. Instrum. Meas. 2011, 60, 928–938. [Google Scholar] [CrossRef]
- Otsu, M.; Nakamura, R.; Kajiwara, A. Remote respiration monitoring sensor using stepped-FM. In Proceedings of the IEEE Sensors Applications Symposium, San Antonio, TX, USA, 22–24 February 2011; pp. 155–158. [Google Scholar]
- Postolache, O.; Girão, P.S.; Postolache, G.; Gabriel, J. Cardio-respiratory and daily activity monitor based on FMCW Doppler radar embedded in a wheelchair. In Proceedings of the Annual International Conference of the IEEE Engineering in Medicine and Biology Society, Boston, MA, USA, 30 August–3 September 2011; pp. 1917–1920. [Google Scholar]
- Zito, D.; Pepe, D.; Mincica, M.; Zito, F.; Tognetti, A.; Lanata, A.; De Rossi, D. SoC CMOS UWB pulse radar sensor for contactless respiratory rate monitoring. IEEE Trans. Biomed. Circuits Syst. 2011, 5, 503–510. [Google Scholar] [CrossRef]
- Heise, D.; Skubic, M. Monitoring pulse and respiration with a non-invasive hydraulic bed sensor. In Proceedings of the Annual International Conference of the IEEE Engineering in Medicine and Biology, Buenos Aires, Argentina, 31 August–4 September 2010; pp. 2119–2123. [Google Scholar]
- Min, S.D.; Kim, J.K.; Shin, H.S.; Yun, Y.H.; Lee, C.K.; Lee, M. Noncontact Respiration Rate Measurement System Using an Ultrasonic Proximity Sensor. IEEE Sens. J. 2010, 10, 1732–1739. [Google Scholar] [CrossRef]
- Mostov, K.; Liptsen, E.; Boutchko, R. Medical applications of shortwave FM radar: Remote monitoring of cardiac and respiratory motion. Med. Phys. 2010, 37, 1332–1338. [Google Scholar] [CrossRef]
- Nishiyama, M.; Miyamoto, M.; Watanabe, K. Respiration rhythm monitoring in sleep based on weight movement using hetero-core fiber optic sensors. In Proceedings of the ICCAS 2010, Gyeonggi-do, Korea, 27–30 October 2010; pp. 205–208. [Google Scholar]
- Nishyama, M.; Miyamoto, M.; Watanabe, K. Respiration and body movement analysis during sleep in bed using hetero-core fiber optic pressure sensors without constraint to human activity. J. Biomed. Opt. 2011, 16, 17002. [Google Scholar] [CrossRef]
- Scalise, L.; Marchionni, P.; Ercoli, I. Optical method for measurement of respiration rate. In Proceedings of the IEEE International Workshop on Medical Measurements and Applications, Ottawa, ON, Canada, 30 April–1 May 2010; pp. 19–22. [Google Scholar]
- Silvious, J.; Tahmoush, D. UHF measurement of breathing and heartbeat at a distance. In Proceedings of the IEEE Radio and Wireless Symposium (RWS), New Orleans, LA, USA, 10–14 January 2010; pp. 567–570. [Google Scholar]
- Tan, K.S.; Saatchi, R.; Elphick, H.; Burke, D. Real-time vision based respiration monitoring system. In Proceedings of the 7th International Symposium on Communication Systems, Networks Digital Signal Processing (CSNDSP 2010), Newcastle upon Tyne, UK, 21–23 July 2010; pp. 770–774. [Google Scholar]
- Brady, S.; Dunne, L.E.; Tynan, R.; Diamond, D.; Smyth, B.; O’Hare, G.M.P. Garment-based monitoring of respiration rate using a foam pressure sensor. In Proceedings of the Ninth IEEE International Symposium on Wearable Computers (ISWC’05), Osaka, Japan, 18–21 October 2005; pp. 214–215. [Google Scholar]
- Dziuda, L.; Skibniewski, F.; Rozanowski, K.; Krej, M.; Lewandowski, J. Fiber-optic sensor for monitoring respiration and cardiac activity. In Proceedings of the 2011 IEEE Sensors, Limerick, UK, 28–31 October 2011; pp. 413–416. [Google Scholar]
- Gutierrez Pascual, M.D. Indoor Location Systems Based on Zigbee Networks. Bachelor’s Thesis, Faculty of Computing, Karlskrona, Sweden, 2012. [Google Scholar]
- Wei, Y.-H.; Leng, Q.; Han, S.; Mok, A.K.; Zhang, W.; Tomizuka, M. RT-WiFi: Real-time high-speed communication protocol for wireless cyber-physical control applications. In Proceedings of the IEEE 34th Real-Time Systems Symposium, Vancouver, BC, Canada, 3–6 December 2013; pp. 140–149. [Google Scholar]
- Bettstetter, C.; Vogel, H.-J.; Eberspacher, J. GSM phase 2+ general packet radio service GPRS: Architecture, protocols, and air interface. IEEE Commun. Surv. 1999, 2, 2–14. [Google Scholar] [CrossRef]
- Delnavaz, A.; Voix, J. Electromagnetic micro-power generator for energy harvesting from breathing. In Proceedings of the IECON 38th Annual Conference on IEEE Industrial Electronics Society, Montreal, QC, Canada, 25–28 October 2012; pp. 984–988. [Google Scholar]
- Goreke, U.; Habibiabad, S.; Azgin, K.; Beyaz, M.I. A MEMS turbine prototype for respiration harvesting. Proc. J. Phys. Conf. Ser. 2015, 660, 12059. [Google Scholar] [CrossRef]
- Shahhaidar, E.; Padasdao, B.; Romine, R.; Stickley, C.; Boric-Lubecke, O. Piezoelectric and electromagnetic respiratory effort energy harvesters. In Proceedings of the 35th Annual International Conference of the IEEE Engineering in Medicine and Biology Society (EMBC), Osaka, Japan, 3–7 July 2013; pp. 3439–3442. [Google Scholar]
- Li, K.; He, Q.; Wang, J.; Zhou, Z.; Li, X. Wearable energy harvesters generating electricity from low-frequency human limb movement. Microsyst. Nanoeng. 2018, 4, 1–13. [Google Scholar] [CrossRef]
- Wang, J.-J.; Su, H.-J.; Hsu, C.-I.; Su, Y.-C. Composite piezoelectric rubber band for energy harvesting from breathing and limb motion. Proc. J. Phys. Conf. Ser. 2014, 557, 12022. [Google Scholar] [CrossRef]
- Sun, C.; Shi, J.; Bayerl, D.J.; Wang, X. PVDF microbelts for harvesting energy from respiration. Energy Environ. Sci. 2011, 4, 4508–4512. [Google Scholar] [CrossRef]
- Zhang, Z.; Zhang, J.; Zhang, H.; Wang, H.; Hu, Z.; Xuan, W.; Dong, S.; Luo, J. A Portable Triboelectric Nanogenerator for Real-Time Respiration Monitoring. Nanoscale Res. Lett. 2019, 14, 354. [Google Scholar] [CrossRef] [PubMed]
- Vasandani, P.; Gattu, B.; Wu, J.; Mao, Z.-H.; Jia, W.; Sun, M. Triboelectric nanogenerator using microdome-patterned PDMS as a wearable respiratory energy harvester. Adv. Mater. Technol. 2017, 2, 1700014. [Google Scholar] [CrossRef]
- Seo, M.-H.; Choi, D.-H.; Han, C.-H.; Yoo, J.-Y.; Yoon, J.-B. An electrostatic energy harvester exploiting variable-area water electrode by respiration. In Proceedings of the 28th IEEE International Conference on Micro Electro Mechanical Systems (MEMS), Estoril, Portugal, 18–22 January 2015; pp. 126–129. [Google Scholar]
- Xue, H.; Yang, Q.; Wang, D.; Luo, W.; Wang, W.; Lin, M.; Liang, D.; Luo, Q. A wearable pyroelectric nanogenerator and self-powered breathing sensor. Nano Energy 2017, 38, 147–154. [Google Scholar] [CrossRef]
- Fan, F.-R.; Tian, Z.-Q.; Wang, Z.L. Flexible triboelectric generator. Nano Energy 2012, 1, 328–334. [Google Scholar] [CrossRef]
- Aljadiri, R.T.; Taha, L.Y.; Ivey, P. Electrostatic energy harvesting systems: A better understanding of their sustainability. J. Clean Energy Technol. 2017, 5, 409–416. [Google Scholar] [CrossRef]
- Nozariasbmarz, A.; Collins, H.; Dsouza, K.; Polash, M.H.; Hosseini, M.; Hyland, M.; Liu, J.; Malhotra, A.; Ortiz, F.M.; Mohaddes, F.; et al. Review of wearable thermoelectric energy harvesting: From body temperature to electronic systems. Appl. Energy 2020, 258, 114069. [Google Scholar] [CrossRef]
- Enescu, D. Thermoelectric Energy Harvesting: Basic Principles and Applications. In Green Energy Advances; IntechOpen: London, UK, 2019. [Google Scholar]
- Vanegas, E.; Igual, R.; Plaza, I. Piezoresistive Breathing Sensing System with 3D Printed Wearable Casing. J. Sens. 2019, 2019. [Google Scholar] [CrossRef]
- Doerffel, D.; Sharkh, S.A. A critical review of using the Peukert equation for determining the remaining capacity of lead-acid and lithium-ion batteries. J. Power Sources 2006, 155, 395–400. [Google Scholar] [CrossRef]
- Kirchev, A. Battery management and battery diagnostics. In Electrochemical Energy Storage for Renewable Sources and Grid Balancing; Elsevier: Amsterdam, The Netherlands, 2015; pp. 411–435. [Google Scholar]
- Lee, S.; Kim, J.; Lee, J.; Cho, B.H. State-of-charge and capacity estimation of lithium-ion battery using a new open-circuit voltage versus state-of-charge. J. Power Sources 2008, 185, 1367–1373. [Google Scholar] [CrossRef]
- Association, W.M. World Medical Association Declaration of Helsinki. Ethical principles for medical research involving human subjects. Bull. World Health Organ. 2001, 79, 373–374. [Google Scholar]
- Zhu, W.; Zeng, N.; Wang, N. Sensitivity, Specificity, Accuracy, Associated Confidence Interval and ROC Analysis with Practical SAS ® Implementations. Health Care Life Sci. 2010, 19, 67. [Google Scholar]
- The R Foundation. The R Project for Statistical Computing. Available online: https://www.r-project.org/ (accessed on 20 March 2020).
- Microsoft C#. Available online: https://docs.microsoft.com/es-es/dotnet/csharp/ (accessed on 3 August 2020).
- Team, O. OpenCV. Available online: https://opencv.org/about/ (accessed on 20 March 2020).
- Microsoft Kinect for Windows. Available online: https://www.microsoft.com/en-us/download/details.aspx?id=40278 (accessed on 20 March 2020).
- ADINSTRUMENTS. LabChart Lightning. Available online: https://www.adinstruments.com/products/labchart (accessed on 20 March 2020).
- Biopac Systems Inc. Acqknowledge Software. Available online: https://www.biopac.com/product/acqknowledge-software/ (accessed on 20 March 2020).
- National Instruments LabWindows/CVI. 2020. Available online: http://sine.ni.com/nips/cds/view/p/lang/es/nid/11104 (accessed on 18 September 2020).
- MathWorks Peak Analysis. Available online: https://es.mathworks.com/help/signal/examples/peak-analysis.html (accessed on 1 July 2020).
- Mallat, S. A Wavelet Tour of Signal Processing; Academic Press: Boston, MA, USA, 2009; ISBN 978-0-12-374370-1. [Google Scholar]
- Jawerth, B.; Sweldens, W. An overview of wavelet based multiresolution analyses. SIAM Rev. 1994, 36, 377–412. [Google Scholar] [CrossRef]
- Welch, G.; Bishop, G. An Introduction to the Kalman Filter; Citeseer: University Park, PA, USA, 1995. [Google Scholar]
- Chen, A.T.-Y.; Biglari-Abhari, M.; Wang, K.I.-K. Trusting the Computer in Computer Vision: A Privacy-Affirming Framework. In Proceedings of the IEEE Conference on Computer Vision and Pattern Recognition (CVPR) Workshops, Honolulu, HI, USA, 21–26 July 2017. [Google Scholar]
- Venkatesh, V.; Morris, M.G.; Davis, G.B.; Davis, F.D. User Acceptance of Information Technology: Toward a Unified View. MIS Q. 2003, 27, 425–478. [Google Scholar] [CrossRef]
- Sundaravej, T. Empirical Validation of Unified Theory of Acceptance and Use of Technology Model. J. Glob. Inf. Technol. Manag. 2010, 13, 5–27. [Google Scholar]
- Moon, Y.-J.; Hwang, Y.-H.; Cho, S. An Empirical Study of Impacts of User Intention for Smart Wearable Devices and Use Behavior. Adv. Multimed. Ubiquitous Eng. 2016, 354, 357–365. [Google Scholar] [CrossRef]
- Wolbring, G.; Leopatra, V. Sensors: Views of Staff of a Disability Service Organization. J. Pers. Med. 2013, 3, 23–39. [Google Scholar] [CrossRef]
- Gao, Y.; Li, H.; Luo, Y. An empirical study of wearable technology acceptance in healthcare. Ind. Manag. Data Syst. 2015, 115, 1704–1723. [Google Scholar] [CrossRef]
- Alam, M.Z.; Hu, W.; Barua, Z. Using the UTAT model to determine factors affecting acceptance and use of mobile health (mHealth) services in Bangladesh. J. Stud. Soc. Sci. 2018, 3, 137–172. [Google Scholar]
- Lo Presti, D.; Romano, C.; Massaroni, C.; Abbraccio, J.D.; Massari, L.; Caponero, M.A.; Oddo, C.M.; Formica, D.; Schena, E. Cardio-Respiratory Monitoring in Archery Using a Smart Textile Based on Flexible Fiber Bragg Grating Sensors. Sensors 2019, 19, 3581. [Google Scholar] [CrossRef] [PubMed]
- Igual, R.; Medrano, C.; Plaza, I.; Orrite, C. Adaptive tracking algorithms to improve the use of computing resources. IET Comput. Vis. 2013, 7, 415–424. [Google Scholar] [CrossRef]
- Kim, J.D.; Lee, W.H.; Lee, Y.; Lee, H.J.; Cha, T.; Kim, S.H.; Song, K.-M.; Lim, Y.-H.; Cho, S.H.; Cho, S.H.; et al. Non-contact respiration monitoring using impulse radio ultrawideband radar in neonates. R. Soc. Open Sci. 2019, 6, 190149. [Google Scholar] [CrossRef] [PubMed]
- Giavarina, D. Understanding Bland Altman analysis. Biochem. Med. 2015, 141–151. [Google Scholar] [CrossRef]
- Barré, A.; Deguilhem, B.; Grolleau, S.; Gérard, M.; Suard, F.; Riu, D. A review on lithium-ion battery ageing mechanisms and estimations for automotive applications. J. Power Sources 2013, 241, 680–689. [Google Scholar] [CrossRef]


| Study 1 | Technique | Sensor | Measured Parameter | Location | Size |
|---|---|---|---|---|---|
| Aitkulov 2019 [57,58] | Chest wall movements | Fiber optic | RR | Chest | - |
| Balasubramaniyam 2019 [59] | Chest wall movements | Resistive | RR | Abdomen (shirt) | - |
| Bricout 2019 [60] | Chest wall movements | Accelerometer | RR | Chest Abdomen | - |
| Chu 2019 [61] | Chest wall movements | Resistive | RR TV | Chest | |
| Elfaramawy 2019 [62] | Chest wall/abdomen movements | Accelerometer Gyroscope Magnetometer | RR | Chest Abdomen | 26.67 × 65.53 mm |
| Fajkus 2019 [63] | Respiratory air flow | Fiber optic | RR | Nose (nasal oxygen cannula) | |
| Hurtado 2019 [64] | Air temperature | Pyroelectric | RR | Nose (below) | 30 × 16 × 20 mm |
| Jayarathna 2019 [65] | Chest wall movements | Resistive | RR | Chest (shirt) | - |
| Kano 2019 [66] | Air humidity | Nanocrystal and nanoparticles | RR | Mouth mask | |
| Karacocuk 2019 [67] | Chest wall movements | Accelerometer Gyroscope | MV | Chest (front and back) | |
| Massaroni 2019 [68] | Respiratory air flow (pressure) | Differential pressure | RR | Nose (nostril) | 36 mm diameter (PCB) |
| Massaroni 2019 [69] | Chest wall movements | Resistive | RR | Chest and abdomen (shirt, front and back) | - |
| Nguyen 2019 [70] | Respiratory air flow (vibration) | Differential pressure sensor | RR | Nose (nasal bridge) | |
| Presti 2019 [71] | Respiratory air flow | Fiber optic | RR | Cervical spine | 90 × 24 × 1 mm |
| Presti 2019 [72] | Chest/abdomen movements | Fiber optic | RR | Chest | - |
| Puranik 2019 [73] | Chest wall movements | Gyroscope | Monitoring of breathing | Chest Abdomen | - |
| Soomro 2019 [74] | Air humidity | Impedance | Monitoring of breathing | Nose (below) | |
| Xiao 2019 [75] | Air humidity | Resistive | Monitoring of breathing | Mouth mask (2–3 cm from nose) | |
| Yuasa 2019 [76] | Respiratory sounds Chest wall movements | MicrophoneOptical | RR | Chest (adhesive gel) | |
| Zhang 2019 [77] | Chest wall movements | Triboelectric nanogenerator | RR | Abdomen | - |
| Dan 2018 [78] | Chest wall movements | Accelerometer | RR Respiratory phase | Neck (Suprasternal notch area) | - |
| Koyama 2018 [79] | Chest wall movements | Fiber Optic sensor | RR | Abdomen (Cardigan, garment) | - |
| Malik 2018 [80] | Air humidity | Capacitive sensor | Monitoring of breathing | Mouth mask | - |
| Martin 2018 [81] | Respiratory sounds | Microphone | RR | Head (inside ear) | - |
| Pang 2018 [82] | Air humidity | Nanocrystal and Nanoparticles sensor | Monitoring of breathing | Mouth mask | - |
| Study 1 | Technique | Sensor | Measured Parameter | Location | Size |
|---|---|---|---|---|---|
| Al-Wahedi 2019 [163] | Modulation cardiac activity | Radar | RR | Distance from subject (20–75 cm away) | |
| Chen 2019 [164] | Modulation cardiac activity | Radar | RR | Mat (below bed) | |
| Gunaratne 2019 [165] | Chest wall movements | Piezoelectric | RR | Mat | 7 × 7 cm (each sensor) |
| Guo 2019 [166] | Chest wall movements | Capacitive | RR | Mat | |
| Isono 2019 [167] | Chest wall movements | Piezoelectric | RR | Others (under bed legs) | |
| Ivanovs 2019 [168] | Chest wall movements Modulation cardiac activity | Camera Radar | Respiration detection | - | |
| Joshi 2019 [169] | Chest wall movements | Capacitive | RR | Mat (below baby mattress) | 580 × 300 × 0.4 mm |
| Krej 2019 [170] | Chest wall movements | Fiber optic | RR | Mat | |
| Lorato 2019 [171] | Air temperature | Camera | RR | Distance from subject (side and front, 10–50 cm away) | |
| Massaroni 2019 [172] | Chest wall movements | Camera | RR | Distance from subject (1.2 m away) | |
| Park 2019 [173] | Chest wall movements | Piezoelectric | RR | User’s mat (Chest region) | 40 × 750 × 0.25 mm |
| Walterscheid 2019 [174] | Modulation cardiac activity | Radar | RR | Distance from subject (3.3–4.2 m away) | |
| Wang 2019 [175] | Modulation cardiac activity | Radar | RR | Distance from subject (50 cm away) | |
| Xu 2019 [176] | Respiratory sounds | Microphone | RR | Others (instrument panel of vehicle) | |
| Yang 2019 [177] | Modulation cardiac activity | Radar | RR | Distance from subject (1.5 m height, 0–3 m away) | |
| Chen 2018 [178] | Modulation cardiac activity | Wi-Fi transmitter and receiver | RR Respiration detection | Nodes | - |
| Chen 2018 [179] | Chest wall movements | Piezoelectric | RR | Mat | 2 × 35 cm |
| Massaroni 2018 [180] | Chest wall movements | Camera | RR Respiratory pattern | Distance from subject (1.2 m away) | - |
| Massaroni 2018 [181] | Chest wall movements | Fiber optic | RR | Others (inside ventilator duct) | 3 cm |
| Sadek 2018 [182] | Chest wall movements | Fiber optic | RR Respiratory pattern | Mat | 20 × 50 cm |
| Operating Bandwidth | Transmission Speed | Power Consumption | Range (m) | Hardware Complexity | |
|---|---|---|---|---|---|
| Bluetooth | 2.4 GHz | 1 Mbps |  | 1–100 |  |
| Zigbee | 2.4 GHz (valid worldwide) | 250 kbps at 2.4 GHz band |  | 10–100 |  |
| Wi-Fi | 2.4–5 GHz generally | Up to 1 Gbps |  | 50–100 |  |
| GSM/GPRS | 850–1900 MHz | 120 kbps |  | 100 m–several kilometers |  |
| Radio frequency | 433 MHz | 4 kbps |  | 20–200 |  |
| Study 1 | Wireless Transmission | Wired Transmission | Processing Station | Battery Capacity | Battery Life (Type Battery) |
|---|---|---|---|---|---|
| Aitkulov 2019 [57,58] | - | Data storage | - | - | - |
| Balasubramaniyam 2019 [59] | Internet connection | - | Cloud storage, PC, Smartphone | - | - |
| Bricout 2019 [60] | - | - | - | - | - |
| Chu 2019 [61] | Bluetooth | - | PC | - | - |
| Elfaramawy 2019 [62] | Radio-frequency | - | PC | 3.7 V, 100 mAh | 6 h (Li-ion battery) |
| Fajkus 2019 [63] | - | Interrogator DAQ (data acquisition) | PC | - | - |
| Hurtado 2019 [64] | - | - | - | - | - |
| Jayarathna 2019 [65] | Bluetooth (low energy), SD card | - | PC, smartphone, cloud Storage | 600 mAh | 5 days (Li-ion battery) |
| Kano 2019 [66] | Bluetooth | - | Smartphone | 3 V | (Cell battery) |
| Karacocuk 2019 [67] | Bluetooth | - | PC, smartphone | - | - |
| Massaroni 2019 [68] | Bluetooth | - | PC | 3.6 V, 650 mAh | 8 h (Li-polymer battery) |
| Massaroni 2019 [69] | Bluetooth | - | - | - | - |
| Nguyen 2019 [70] | - | - | - | - | - |
| Presti 2019 [71] | - | Interrogator | PC | - | - |
| Presti 2019 [72] | - | Interrogator | PC | - | - |
| Puranik 2019 [73] | Wi-Fi | - | - | 3.7 V, 1020 mAh | (Li-ion battery) |
| Soomro 2019 [74] | - | USB | PC, smartphone | - | - |
| Xiao 2019 [75] | - | - | PC | - | - |
| Yuasa 2019 [76] | - | USB | Smartphone | - | - |
| Zhang 2019 [77] | - | - | Smartphone, PC | - | - |
| Dan 2018 [78] | - | - | - | - | - |
| Koyama 2018 [79] | - | Interrogator DAQ | PC | - | - |
| Malik 2018 [80] | - | DAQ | - | - | - |
| Martin 2018 [81] | - | - | PC | - | - |
| Pang 2018 [82] | - | - | - | - | - |
| Validation Parameters | Number of Subjects | Duration | Activities Considered | |||||||||||
|---|---|---|---|---|---|---|---|---|---|---|---|---|---|---|
| 1 | 2 to 5 | 6 to 10 | 11 to 20 | >20 | Not specified | <5 min | >5 min | Sitting | Standing | Lying down | Sleeping | Walking, running, moving | Motion artifacts | |
| Number of studies | 34 | 40 | 30 | 22 | 19 | 63 | 47 | 34 | 59 | 25 | 66 | 16 | 28 | 27 |
| Study 1 | Algorithm | Performance Evaluation | Performance Value | Analysis Software |
|---|---|---|---|---|
| Aitkulov 2019 [57,58] | Frequency analysis | Graphical comparison | - | - |
| Balasubramaniyam 2019 [59] | - | - | - | MATLAB |
| Bricout 2019 [60] | Adaptive reconstruction | Correlation factor | 0.64–0.74 | - |
| Chu 2019 [61] | Peak detection | Bland-Altman analysis Correlation factor | 0.99 (correlation) | MATLAB |
| Elfaramawy 2019 [62] | Peak detection | - | - | MATLAB |
| Fajkus 2019 [63] | Peak detection | Relative error Bland-Altman analysis | 3.9% (RE) | Labview |
| Hurtado 2019 [64] | Zero-crossing detection | Relative error Bland-Altman analysis | 0.4 bpm (BA, mean of difference –MOD–) | - |
| Jayarathna 2019 [65] | Peak detection | - | - | - |
| Kano 2019 [66] | Peak detection | Correlation coefficient Bland-Altman analysis | 0.88 (correlation) 0.026 bpm (BA, MOD) | - |
| Karacocuk 2019 [67] | Frequency analysis | Correlation | - | MATLAB Microprocessor |
| Massaroni 2019 [68] | Custom algorithm | Relative error Linear regression Bland-Altman analysis | 4.03% (RE) 0.91–0.97 (r2) −0.06 (BA, MOD) | MATLAB |
| Massaroni 2019 [69] | Peak detection | Bland-Altman analysis | 0.05 bpm (BA, MOD) | - |
| Nguyen 2019 [70] | Frequency analysis | - | - | - |
| Presti 2019 [71] | Peak detection | Percentage error | <4.71% (PE) | MATLAB Labview |
| Presti 2019 [72] | Peak detection | - | - | - |
| Puranik 2019 [73] | - | - | - | - |
| Soomro 2019 [74] | - | - | - | - |
| Xiao 2019 [75] | - | Graphical comparison | - | - |
| Yuasa 2019 [76] | Peak detection | Accuracy | 61.3–65.6% | MATLAB |
| Zhang 2019 [77] | Frequency analysis | - | - | - |
| Dan 2018 [78] | Zero-crossing detection | Bland-Altman analysis | 0.01–0.02 bpm (BA, MOD) | - |
| Koyama 2018 [79] | Frequency analysis | Absolute error | 4 bpm | Python |
| Malik 2018 [80] | - | Graphical monitoring | - | Python |
| Martin 2018 [81] | Custom algorithm | Mean absolute error Mean relative error Bland-Altman analysis | 2.7 bpm (MAE) 30.9% (MRE) 2.4 bpm (BA, MOD) | MATLAB |
| Pang 2018 [82] | - | Graphical monitoring | - | - |
| Study 1 | Algorithm | Performance Evaluation | Performance Value | Analysis Software |
|---|---|---|---|---|
| Al-Wahedi 2019 [163] | Frequency analysis | Manual verification Relative error | 4–14% (RE) | Labview |
| Chen 2019 [164] | Zero-crossing detection | Mean squared error | 1.23 bpm | - |
| Gunaratne 2019 [165] | Wavelet transform Fuzzy logic | Relative error | 6.2% | - |
| Guo 2019 [166] | Wavelet transform | Cross-correlation | 0.76–0.85 | - |
| Isono 2019 [167] | Custom algorithm | Linear regression Bland-Altman analysis | 0.969 (r2) 0.07–0.17 bpm (BA, MOD) | LabChart MATLAB |
| Ivanovs 2019 [168] | Neural networks | Others | - | - |
| Joshi 2019 [169] | - | Correlation factor Root mean square error Bland-Altman analysis | 0.74 (correlation) 4.7 bpm (RMSE) −0.36 (BA, MOD) | - |
| Krej 2019 [170] | Machine learning methods | Root mean square error Bland-Altman analysis | 1.48 bpm (RMSE) 0.16 bpm (BA, MOD) | C# R |
| Lorato 2019 [171] | Frequency analysis | Root mean square error Bland-Altman analysis | 1.59 bpm (RMSE) | MATLAB |
| Massaroni 2019 [172] | Custom algorithm | Absolute error Standard error Percentage error Bland-Altman analysis | 0.39 bpm (AE) 0.02 bpm (SE) 0.07% (PE) −0.01 bpm (BA, MOD) | MATLAB |
| Park 2019 [173] | Frequency analysis | Accuracy Bland-Altman analysis | 99.4% (Acc) | MATLAB |
| Walterscheid 2019 [174] | Peak detection | Graphical comparison | - | - |
| Wang 2019 [175] | Custom algorithm | Absolute error Relative error | 0.3 bpm (AE) 2% (RE) | MATLAB |
| Xu 2019 [176] | Custom algorithm | Absolute error Correlation factor | 0.11 bpm (AE) 0.95 (correlation) | - |
| Yang 2019 [177] | Custom algorithm | Absolute error | 0.3–0.6 bpm | - |
| Chen 2018 [178] | Custom algorithm | Accuracy | 98.65% | - |
| Chen 2018 [179] | Frequency analysis | Graphical comparison | - | Mobile app |
| Massaroni 2018 [180] | Threshold detection Zero-crossing detection Custom algorithm | Correlation factor Bland-Altman analysis Percentage error Others | 0.97 (correlation) 0.01 bpm (BA, MOD) 5.5% (PE) | MATLAB |
| Massaroni 2018 [181] | Peak detection | Relative error | 2% | MATLAB |
| Sadek 2018 [182] | Peak detection Custom algorithm | Correlation factor Bland-Altman analysis Mean absolute error | 0.78 (correlation) 0.38 bpm (MAE) | - |
© 2020 by the authors. Licensee MDPI, Basel, Switzerland. This article is an open access article distributed under the terms and conditions of the Creative Commons Attribution (CC BY) license (http://creativecommons.org/licenses/by/4.0/).
Share and Cite
Vanegas, E.; Igual, R.; Plaza, I. Sensing Systems for Respiration Monitoring: A Technical Systematic Review. Sensors 2020, 20, 5446. https://doi.org/10.3390/s20185446
Vanegas E, Igual R, Plaza I. Sensing Systems for Respiration Monitoring: A Technical Systematic Review. Sensors. 2020; 20(18):5446. https://doi.org/10.3390/s20185446
Chicago/Turabian StyleVanegas, Erik, Raul Igual, and Inmaculada Plaza. 2020. "Sensing Systems for Respiration Monitoring: A Technical Systematic Review" Sensors 20, no. 18: 5446. https://doi.org/10.3390/s20185446
APA StyleVanegas, E., Igual, R., & Plaza, I. (2020). Sensing Systems for Respiration Monitoring: A Technical Systematic Review. Sensors, 20(18), 5446. https://doi.org/10.3390/s20185446