Article

Non-Invasive Estimation of Machining Parameters during End-Milling Operations Based on Acoustic Emission

by
Andrés Sio-Sever
1,*,
Erardo Leal-Muñoz
2,
Juan Manuel Lopez-Navarro
3,
Ricardo Alzugaray-Franz
2,4,
Antonio Vizan-Idoipe
4 and
Guillermo de Arcas-Castro
1,*
1
Grupo de Investigación en Instrumentación y Acústica Aplicada, Departamento de Ingeniería Mecánica, Universidad Politécnica de Madrid, 28040 Madrid, Spain
2
Departamento de Ingeniería Mecánica, Universidad de La Frontera, Temuco 4780000, Chile
3
Grupo de Investigación en Instrumentación y Acústica Aplicada, Departamento de Telemática y Electrónica, Universidad Politécnica de Madrid, 28040 Madrid, Spain
4
Departamento de Ingeniería Mecánica, Universidad Politécnica de Madrid, 28006 Madrid, Spain
*
Authors to whom correspondence should be addressed.
Sensors 2020, 20(18), 5326; https://doi.org/10.3390/s20185326
Submission received: 29 June 2020 / Revised: 11 September 2020 / Accepted: 14 September 2020 / Published: 17 September 2020
(This article belongs to the Special Issue Sensors in Experimental Mechanics)

Abstract

:
This work presents a non-invasive and low-cost alternative to traditional methods for measuring the performance of machining processes directly on existing machine tools. A prototype measuring system has been developed based on non-contact microphones, a custom designed signal conditioning board and signal processing techniques that take advantage of the underlying physics of the machining process. Experiments have been conducted to estimate the depth of cut during end-milling process by means of the measurement of the acoustic emission energy generated during operation. Moreover, the predicted values have been compared with well established methods based on cutting forces measured by dynamometers.

1. Introduction

The improvement of industrial processes demands new technologies that provide accurate information regarding the stationary or dynamic conditions of their operations. In the case of machining processes, the knowledge of operating conditions is required towards efficiency improvement and quality optimization.
A wide range of methods have been developed to monitor milling processes, most of them are based on the measurement of the cutting forces present in the workpiece because it represents accurately most of common machining phenomena. Cutting force methods have the advantage of providing accurate results [1,2,3] and they are simple to implement, but they have the disadvantage of requiring high cost transducers and direct contact between the sensor and the workpiece.
Other detecting methods rely on ultrasound emission and reception to measure the depth of cut in milling applications [4], thus solving the direct contact requirement. More recently, the contact between the cutting tool and the workpiece has been studied with their electrostatic contact to determine the engagement of each tooth [5,6].
Acoustic emission (AE) techniques have received increasing attention during the last few years due to the ability to perform multiple monitoring tasks during machining processes. One of the first applications was the detection and study of tool and workpiece contact in machining [7,8], which quickly led to an interest in the automatic detection of malfunctions. In the event of a tool with broken or blunt teeth, acoustic emission technologies can automatically detect their presence with the use of relatively simple setups [9,10,11,12,13]. Even if the tool is in good working condition, phenomena like runout [14,15] or chatter [16,17,18,19] are common problems that modern industry has to face, but due to the change in the acoustic emission generated by each of those phenomena they can be readily detected and solved.
Beyond their conventional uses in traditional machining, the continuous research on AE allowed it to have newfound popularity in more subtle applications, such as roughness analysis [20] and the study of micromachining processes [21]. The main advantages of using AE sensors rely on their low invasiveness and the possibility to assess different sources of interest during the machining process.

Acoustic Emission

Acoustic emission has attained notable focus in the engineering community in recent years, both in contact sensors [22,23,24,25] and non-contact ones [26,27,28] in a wide range of applications. Besides the use of AE sensors in the machining field, it has also been used in detecting weak points in metallic structures such as piping [29], aircraft [30], windmills [31] and even bone-milling surgery [32].
Acoustic emission refers to the mechanical waves generated by the plastic (irreversible) changes in solid bodies during the application of stresses that can produce cracks, deformations and movement of dislocations among others, as well as friction and other phenomena [33].
Traditionally, AE is obtained by means of piezoelectric transducers that are directly attached to the surface of the specimen under load [22,23,24,25], which requires the use of expensive sensors that may obstruct the pathway of the cutting tool and whose proximity to the cutting fluid may be dangerous to the integrity of the sensing device. To solve the intrusiveness and cost issues, the use of microelectromechanical systems (MEMSs) was chosen in the present work.
MEMS technology was initially applied to microelectronics because of the small form factor required by the ever increasing processing needs of computers. Due to the elevated cost of such devices, their mass implementation outside the field of computation was hardly profitable, but the recent developments in MEMS manufacturing [34,35,36,37,38,39,40,41,42] suggest that they can potentially be used in numerous applications where their small size and cost reduction [43,44,45,46,47] can offer an unobtrusive and affordable solution.
In machining processes, AE might be one of the best options to analyze subsurface damage and anisotropic materials [48] because of the capabilities of this technology of detecting weak points and discontinuities inside solid bodies without the need to perform any destructive testing.
These monitoring capabilities are not limited to milling, and with some modifications, it can also be applied to operations such as drilling [49], boring or turning [50], as all of them would benefit from tool monitoring [51].
The measurement of airborne AE signals poses a big challenge in filtering the background noise, which is produced by the machine under study and by other industrial noise sources present in the surrounding environment. Previous works have shown different approaches to find a flexible method that works under different operating conditions without compromising accuracy. For example, the use of neural networks by Gaja et al. [52], fuzzy logic algorithms [53,54,55], and radial basis functions [56,57] have proven to be effective methods to estimate the axial depth of cut based on AE.
With the aforementioned state of the art in mind, the objective of the present work is to analyze the performance and applicability of a truly non-invasive and low-cost alternative AE measurement system with the ability to estimate the cutting conditions during end-milling operations. In order to do so, a system prototype has been developed and tested in real operating conditions, and the accuracy of the method has been compared with the results of well established methods based on the measurement of the cutting forces [3].
Section 1 describes the context of this work and provides the theoretical background. Section 2 includes the geometrical model used to characterize the signal pattern of the cutting forces in end-milling processes and Section 3 expands on its application in system that is being studied. Section 4 presents the materials and methods used in the development of a measuring system prototype, including the design of the signal conditioning unit, the hardware and software architecture of the system, the calibration and signal processing algorithms. Section 5 presents and discusses the experimental results from both a qualitative and a quantitative point of view. Finally, Section 6 summarizes the main findings this work.

2. Geometrical Model of the End-Milling Process

The machining conditions in end-milling process can be obtained in terms of the geometrical characteristics of the cutting tool. This means, that the radial depth of cut (ae) and the axial depth of cut (ap) can be related to the characteristic angles of the tool flute (entry angle φ e n , exit angle φ e x , projected angle φ p r and flute angle λ s ) shown in Figure 1a,b.
If the diameter of the tool (D) is known, the relationship between the entry angle of the tool and the width of cut can be established geometrically as shown in Equation (1):
φ e n i = π a r c o s 1 2 a e i D
Furthermore, if a fixed geometrical reference is set, and a time base is available, this angle can be determined by measuring the time it takes the flute to complete that part of the rotation. This can be done by adding a digital pulse for each revolution of the spindle as shown in Figure 1c. The associated time parameter is denoted as the entry time (teni) and it represents the time, measured from the reference pulse, that takes the cutting edge of the tool to get in contact with the workpiece on each spindle revolution.
The entry time and entry angle are related by the spindle period (T) as shown in Equation (2):
t e n i = φ e n i 2 π T
The width of cut can be obtained in terms of the tool diameter (D), the entry time (teni) and the spindle period (T) (see Equation (3)).
a e i = D 2 1 + c o s 1 2 π t e n i T
Analogously, the projected time depends on the projected angle of the active flute over the working plane of the workpiece being machined ( φ pr). This angle can be obtained by measuring the time it takes each flute of the tool to travel the projected angle as shown in Equation (4).
t p r i = T 2 π φ p r i = T a p i t a n λ s π D
Therefore, the depth of cut can be obtained in terms of the projected angle ( φ pr) and the spindle period (T) of the tool as shown in Equation (5).
a p i = π D T t a n λ s t p r i

3. Cutting Force Model

One of the main problems in measuring airborne acoustic emissions during machining processes is dealing with background noise. Among the main sources one can find electrical noise, environmental noise, and some other internal noise sources from the machine under analysis. This effect can be noticed in Figure 2, when comparing the experimental signals of the cutting forces measured by a dynamometer and the acoustic emission registered from a non-contact microphone during end-milling operations. In the case of the cutting forces, there are three clearly marked phases depending on the degree of engagement between the cutting tool and the workpiece. In the first phase, the cutting tool is approaching the workpiece with no material removal; the second phase, where the tool is entering into the workpiece; and the third phase, the zone of uniform cut once the tool is fully engaged. These features are not easy to find on the acoustic emission signal, and therefore signal filtering is required. In this work an adaptive filter is used, taking the synthesized model of cutting forces proposed by Leal et al. [3] as the reference signal.
The formulation of the geometric model described in the previous section can be extended to the three cutting phases shown in Figure 1c, then the instantaneous axial depth of cut can be rewritten as shown in Equation (6).
a p a ( φ ) = φ j φ e n φ p r a p φ e n φ j φ e x φ e x φ e n φ p r a p φ e x φ j φ e n + φ p r φ e x ( φ j φ p r ) φ p r a p φ e n + φ p r φ j φ e x + φ p r
Equation (7) allows the determination of the average chip thickness ( h ¯ ( φ )) on each of the three cutting phases, where fz is the feed per tooth in mm.
h ¯ ( φ ) = 1 φ j φ e n f z [ c o s ( φ e n ) c o s ( φ j ) ] φ e n φ j φ e x 1 φ e x φ e n f z [ c o s ( φ e n ) c o s ( φ e x ) ] φ e x φ j φ e n + φ p r 1 φ e x ( φ j φ p r ) f z [ c o s ( φ j φ p r ) c o s ( φ e x ) ] φ e n + φ p r φ j φ e x + φ p r
Thus, the three components of the cutting forces can be obtained from Equations (8)–(10):
F t ( φ ) = k t ( φ ) a p a h ¯ ( φ )
F r ( φ ) = k r ( φ ) a p a h ¯ ( φ )
F a ( φ ) = k a ( φ ) a p a h ¯ ( φ )
where kt, kr and ka correspond to the cutting force coefficients for tangential, radial and axial directions, respectively. These coefficients are obtained experimentally and adjusted for each material. This set of equations can be used to model the cutting forces as shown in Figure 3, where the entry and exit points of the cutting edge on each tool revolution are time parameters needed to estimate the depth of cut. This signal is generated from the nominal cutting conditions and the cutting tool geometry, and it represents the reference signal for the adaptive filter described in Section 4.1.

4. Materials and Methods

This section describes the design of the prototype measuring system, and the experimental setup used to perform the validation of the method.

4.1. Prototype Measuring System

The prototype proposed in this work is a combination of hardware and software to measure the airborne acoustic emission during the end-milling process in order to estimate the depth of cut. The transducer selected for this application is the Knowles SPU1410LR5H-QB. This corresponds to a low-cost and non-contact microelectromechanical systems (MEMS) microphone with the ability to measure high frequency content of acoustic emissions [7,8] but at expense of amplitude precision. The technical specifications of this transducer are listed in Table 1.
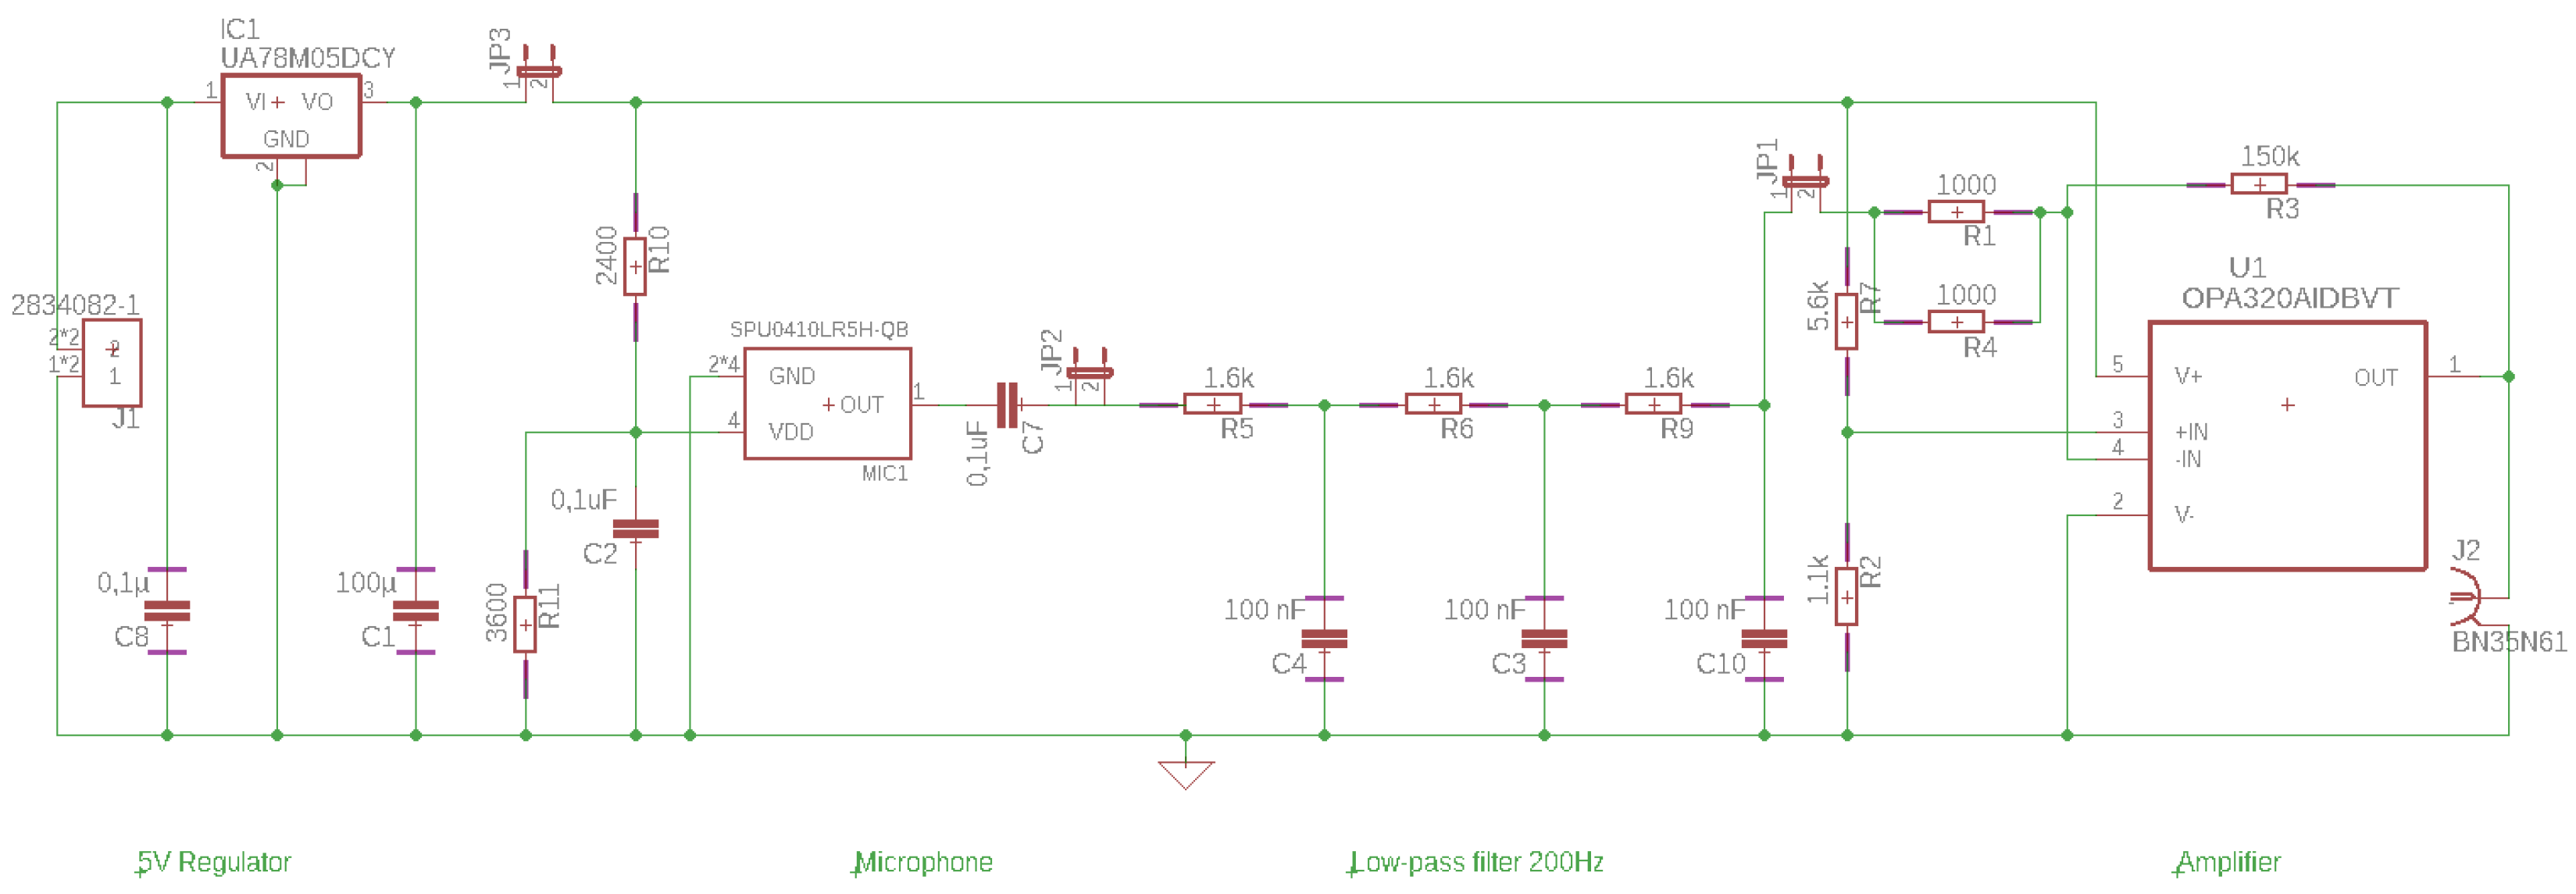
Additionally, a signal conditioning board has been designed to provide power supply to the microphone and also to handle basic amplification and filtering. Its schematic circuit is depicted in Figure 4, where IC2, C1 and C8 provide a 5 V DC stabilized power supply from a 9 V battery connected to J1. The microphone MC1 is powered from a 3.6 V DC using R10 and R11, and C2 has been added to eliminate power fluctuations. The output of the microphone is connected to a three-stage low pass Butterworth filter with a cut-off frequency of 1 kHz represented by R5, C4, R6, C3, R9 and C10. Finally, the signal amplification stage is composed by U1 and its surrounding components (R2 and R3 for the voltage divider, R1 and R4 for the input resistor and R3 for the feedback resistor). The latter deals with the inherent offset value of the microphone and it also maximizes the achievable dynamic range with a unipolar power supply.
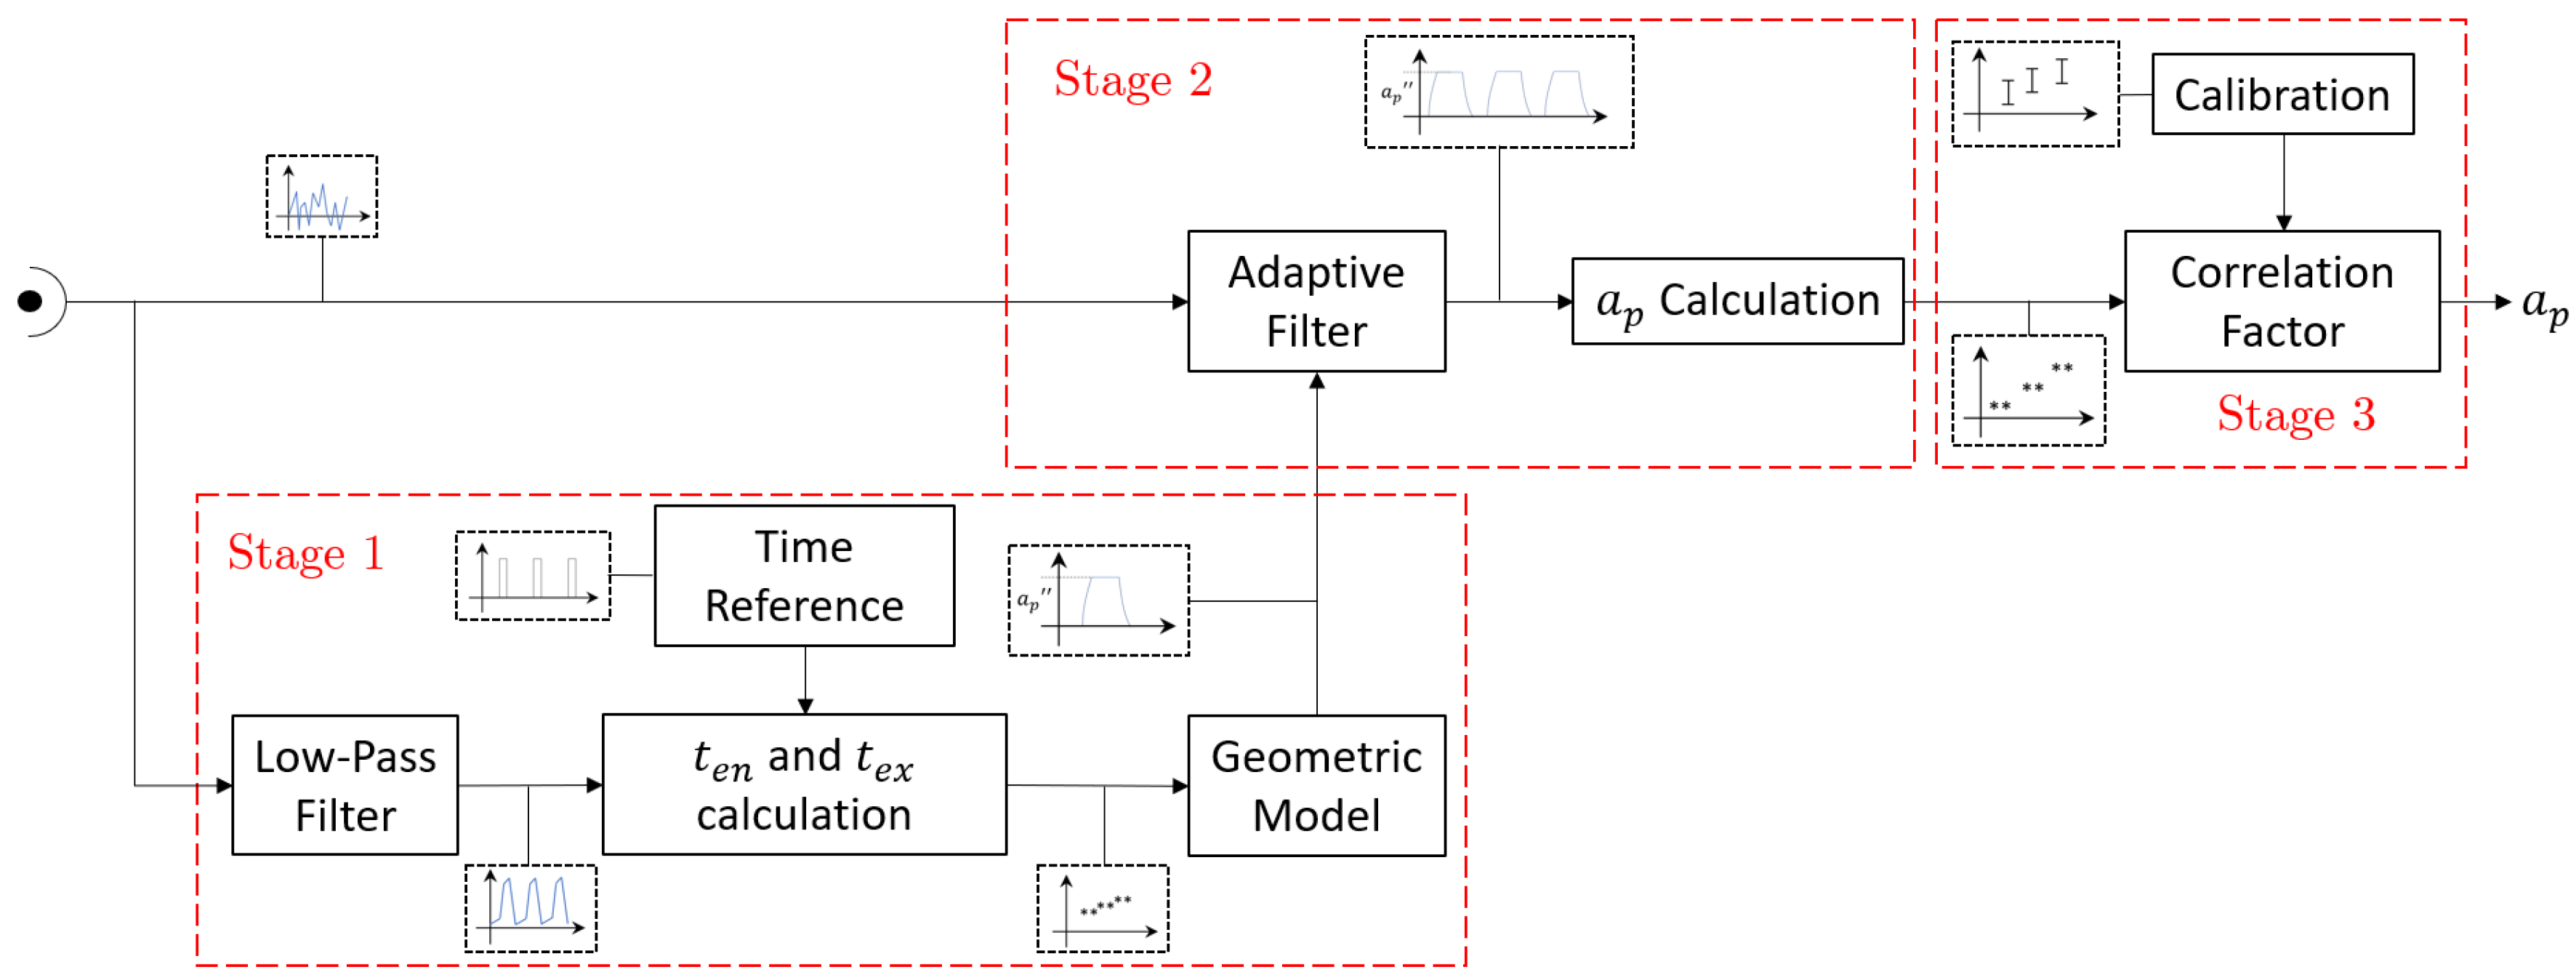
The analog output from the conditioning board is digitalized by means of a data acquisition system which would be described in the next section. This signal is fed to an algorithm that estimates the axial depth of cut. The block diagram of the main routine is illustrated in Figure 5, where three stages can be identified.
In the first stage, the reference signal for the adaptive filter is generated based on the cutting force model described in Section 3. The second stage, which can be considered as core of the algorithm, applies an adaptive filter to obtain the time parameters needed to compute the depth of cut using Equation (5). Finally, the third stage consists on the estimation of the depth of cut after adjustments that compensate for systematic errors present along the measurement chain.

4.1.1. Stage 1: Generation of Cutting Force Reference Signal

As mentioned previously, the goal of this stage was to provide a reference signal for the adaptive filter on stage 2. This was done by extracting the main features of the acoustic emission signal based on the geometric model of the cutting forces presented in Equations (6)–(10). This strategy was sensitive to changes in the operation conditions, and therefore, this measuring system had the ability to work completely independent of the machining control system.
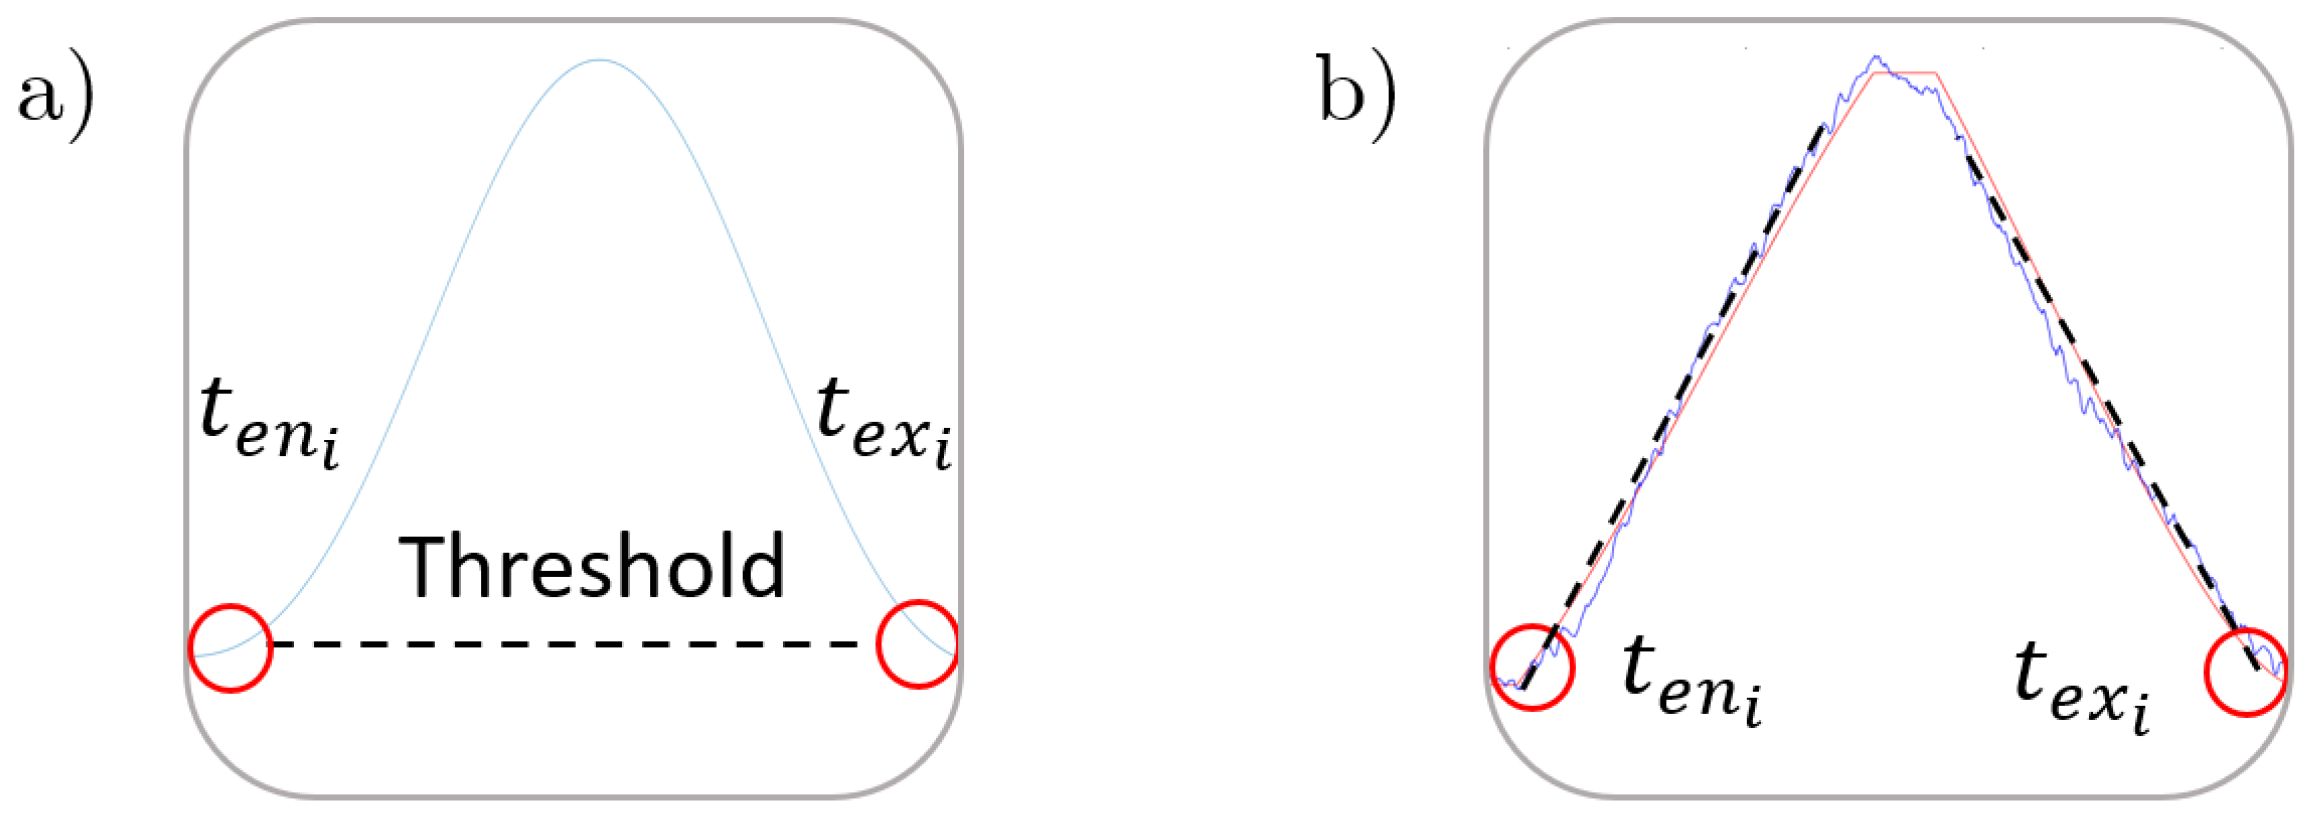
Before obtaining the time parameters, a third order Butterworth filter with a cut-off frequency of 150 Hz needed to be applied to the microphone raw signal, in order to remove most of the electrical and background noise. From the low frequency waveform, the entry and exit times were found by detecting the amplitude peaks that exceeded a threshold value (see Figure 6a). This threshold was automatically set from the mean value of the signal while the cutting tool was approaching the workpiece with no material removal. Furthermore, the digital pulse allowed the transformation of time values to the angle domain, which were independent of the spindle speed variations.

4.1.2. Stage 2: Estimation of Depth of Cut Using the Adaptive Filter

At this stage, the AE raw signal was filtered using the reference signal generated in stage 1. Both signals were divided into equally sized segments (windowing), whose size depended on the priorities of the monitoring process. A short window could be used to respond quickly to changes in the process parameters (e.g., width or depth of cut), but it would make the system less robust against background noise, whereas long windows would have the opposite effect. A window width of two tool revolutions (0.1 s) was chosen as a good compromise between these two factors.
The adaptive filter implemented was a 7th order that uses a Normalized Least Mean Squares algorithm (NLMS), which made it stable against any scaling of the input (raw) signal.
Due to the high frequency content of the filtered signal, the threshold based algorithm of stage 1 was not suitable to determine the time parameters. As a consequence, a slope-based algorithm (see Figure 6b) was selected, where the estimation of the entry and exit points were obtained by intersecting the threshold level with the slope lines of the rising and falling edges of each peak.

4.1.3. Stage 3: Calibration and Correction Factor

At the final stage, a correction factor was added in order to compensate for systematic errors along the measurement chain. The main error contribution came from the microphone due to its slow response time at the exit of the cutting edge. The experimental procedure to determine the correction factors is described in Section 5.2.

4.2. Experimental Setup

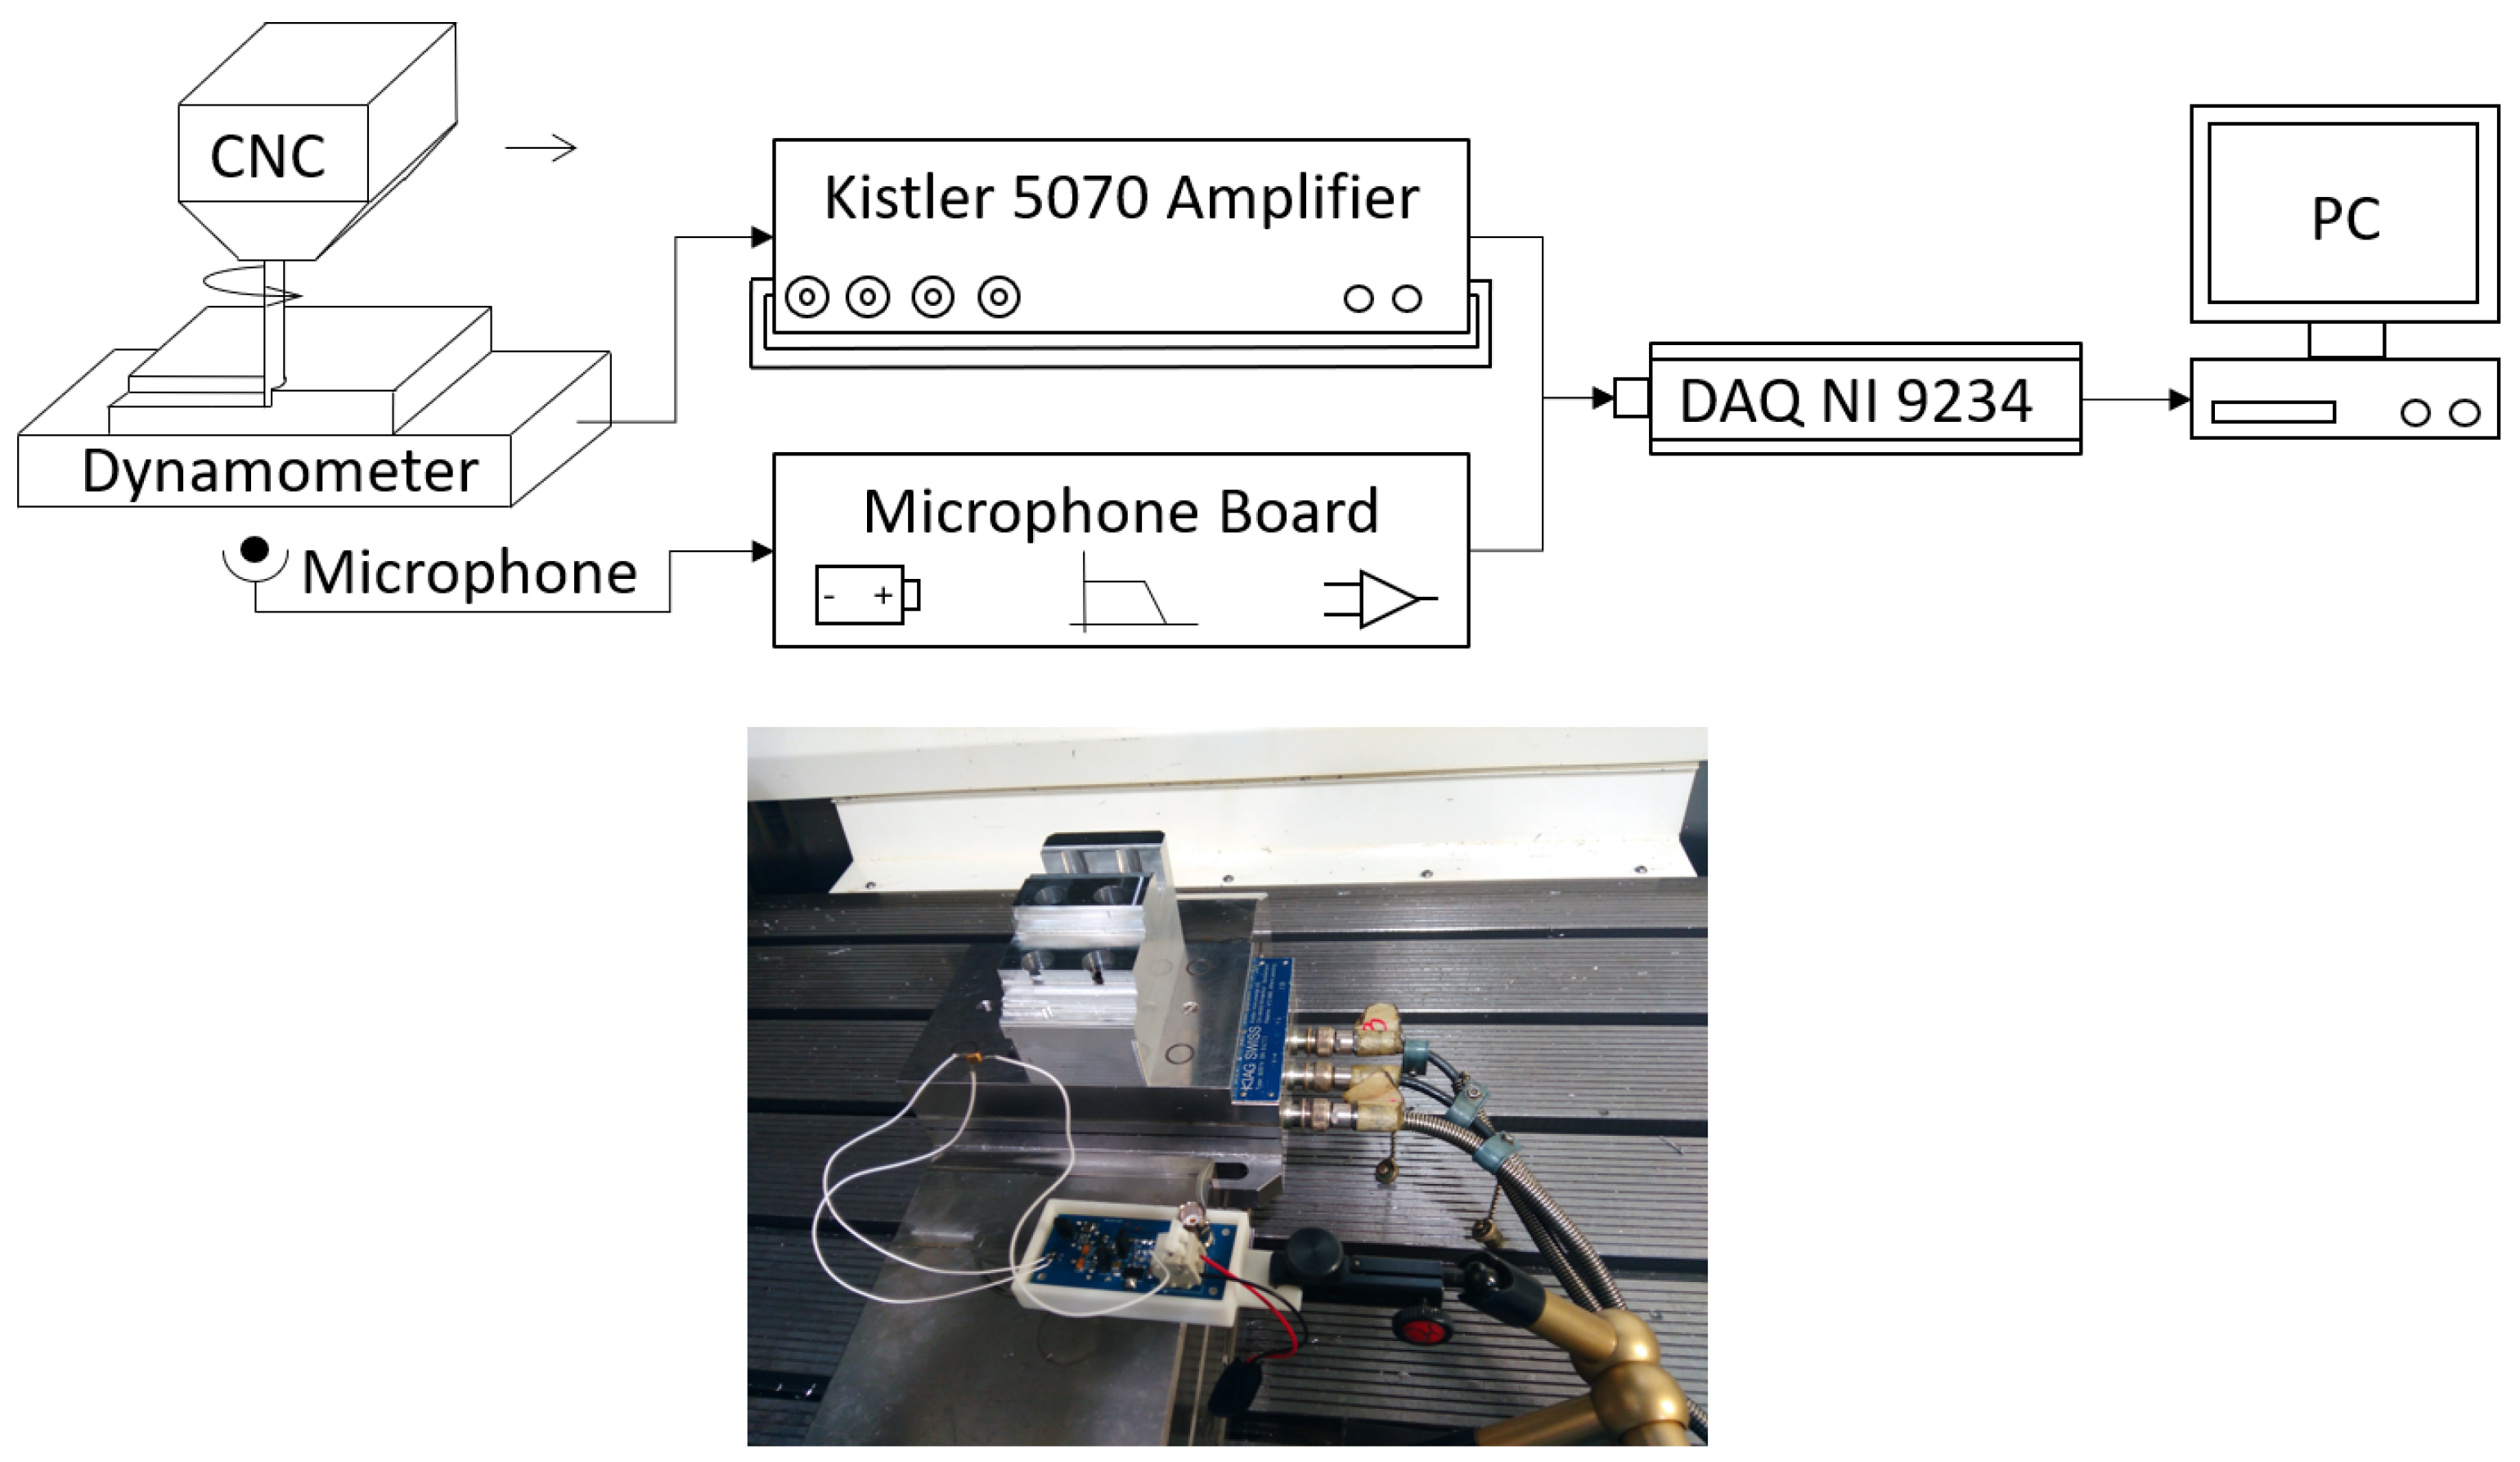
Experiments of an end-milling process were carried out in a DMG 1035 three-axis machining center. An 8 mm diameter three-flute cutter rotating at 1200 rpm was used to machine a 7075 aluminum workpiece. The cutting forces were measured on a Kistler 9257A dynamometric platform (see Table 2) connected to a Kistler 5070 amplifier unit. In addition, a Knowles SPU1410LR5H-QB non-contact MEMS microphone (see Table 1) and a custom made conditioning board (see Figure 4) were used in order to measure the airborne acoustic emissions. In all tests, the microphone was placed at a distance of 500 mm perpendicular to the center of the workpiece.
The data acquisition of both signals was performed by a NI-9234 module for dynamic signals attached to a personal computer. The sampling rate was 51.2 kHz configured for bipolar input with a dynamic range of 10 V and a resolution of 24 bits. It should be noted that this device had a crosstalking specification of −110 dB, which was especially suitable considering the difference in magnitude of the signals that were compared. This setup is represented schematically in Figure 7.

5. Results and Discussion

In this work, two sets of experiments were conducted. First, a comparison between the cutting forces and the acoustic emission signals. This can be considered a qualitative waveform analysis to validate the accuracy of the method in the detection of the time parameters fed into the geometric model. Then, the performance of the prototype measurement system was tested under different machining conditions during end-milling operations.

5.1. Qualitative Waveform Analysis

The cutting forces are considered a good descriptor of the physics behind machining processes. The latter remains valid in the case of the end-milling process, and therefore, this knowledge can be used to validate the predictions of the time parameters obtained from the acoustic emission signal.
In Figure 8a three different waveforms are presented, the cutting force signal, the raw AE signal and the filtered AE signal, respectively. Although the amplitude of the background noise in the raw AE signal hid most of the features of the process, the filtered AE signal resembled the pattern of the cutting force. Figure 8b shows a zoomed section of the cutting force and the filtered AE signals within the zone of uniform cut. This reveals that both signals captured in amplitude and time the most important attributes of the process, such as the entrance and exit of the three cutting edges on each revolution of the spindle. Additionally, one can notice that these three peaks had different amplitudes, which could be an indication of tool runout [58].

5.2. Performance of the Prototype Measurement System

After the previous validation stage, the performance of the prototype measurement system was tested under different machining conditions during end-milling operations as shown in Table 3. In all runs, only the axial depth of cut was changed from 2 to 10 mm, increasing this value in steps of 2 mm. An additional test was carried out, in order to evaluate the response to sudden changes by increasing the axial depth of cut from 2 to 10 mm in a single step.
The mean value and standard deviation of the estimated depth of cut are presented in Table 4. These results were obtained from the analysis of signals within the zone of uniform cut, with a period of 7 s, equivalent to 140 revolutions of the cutter. In most cases, the error of the estimated depth of cut was larger than the nominal value. However, the standard deviation was consistently independent of the size of depth of cut increment between two different runs.
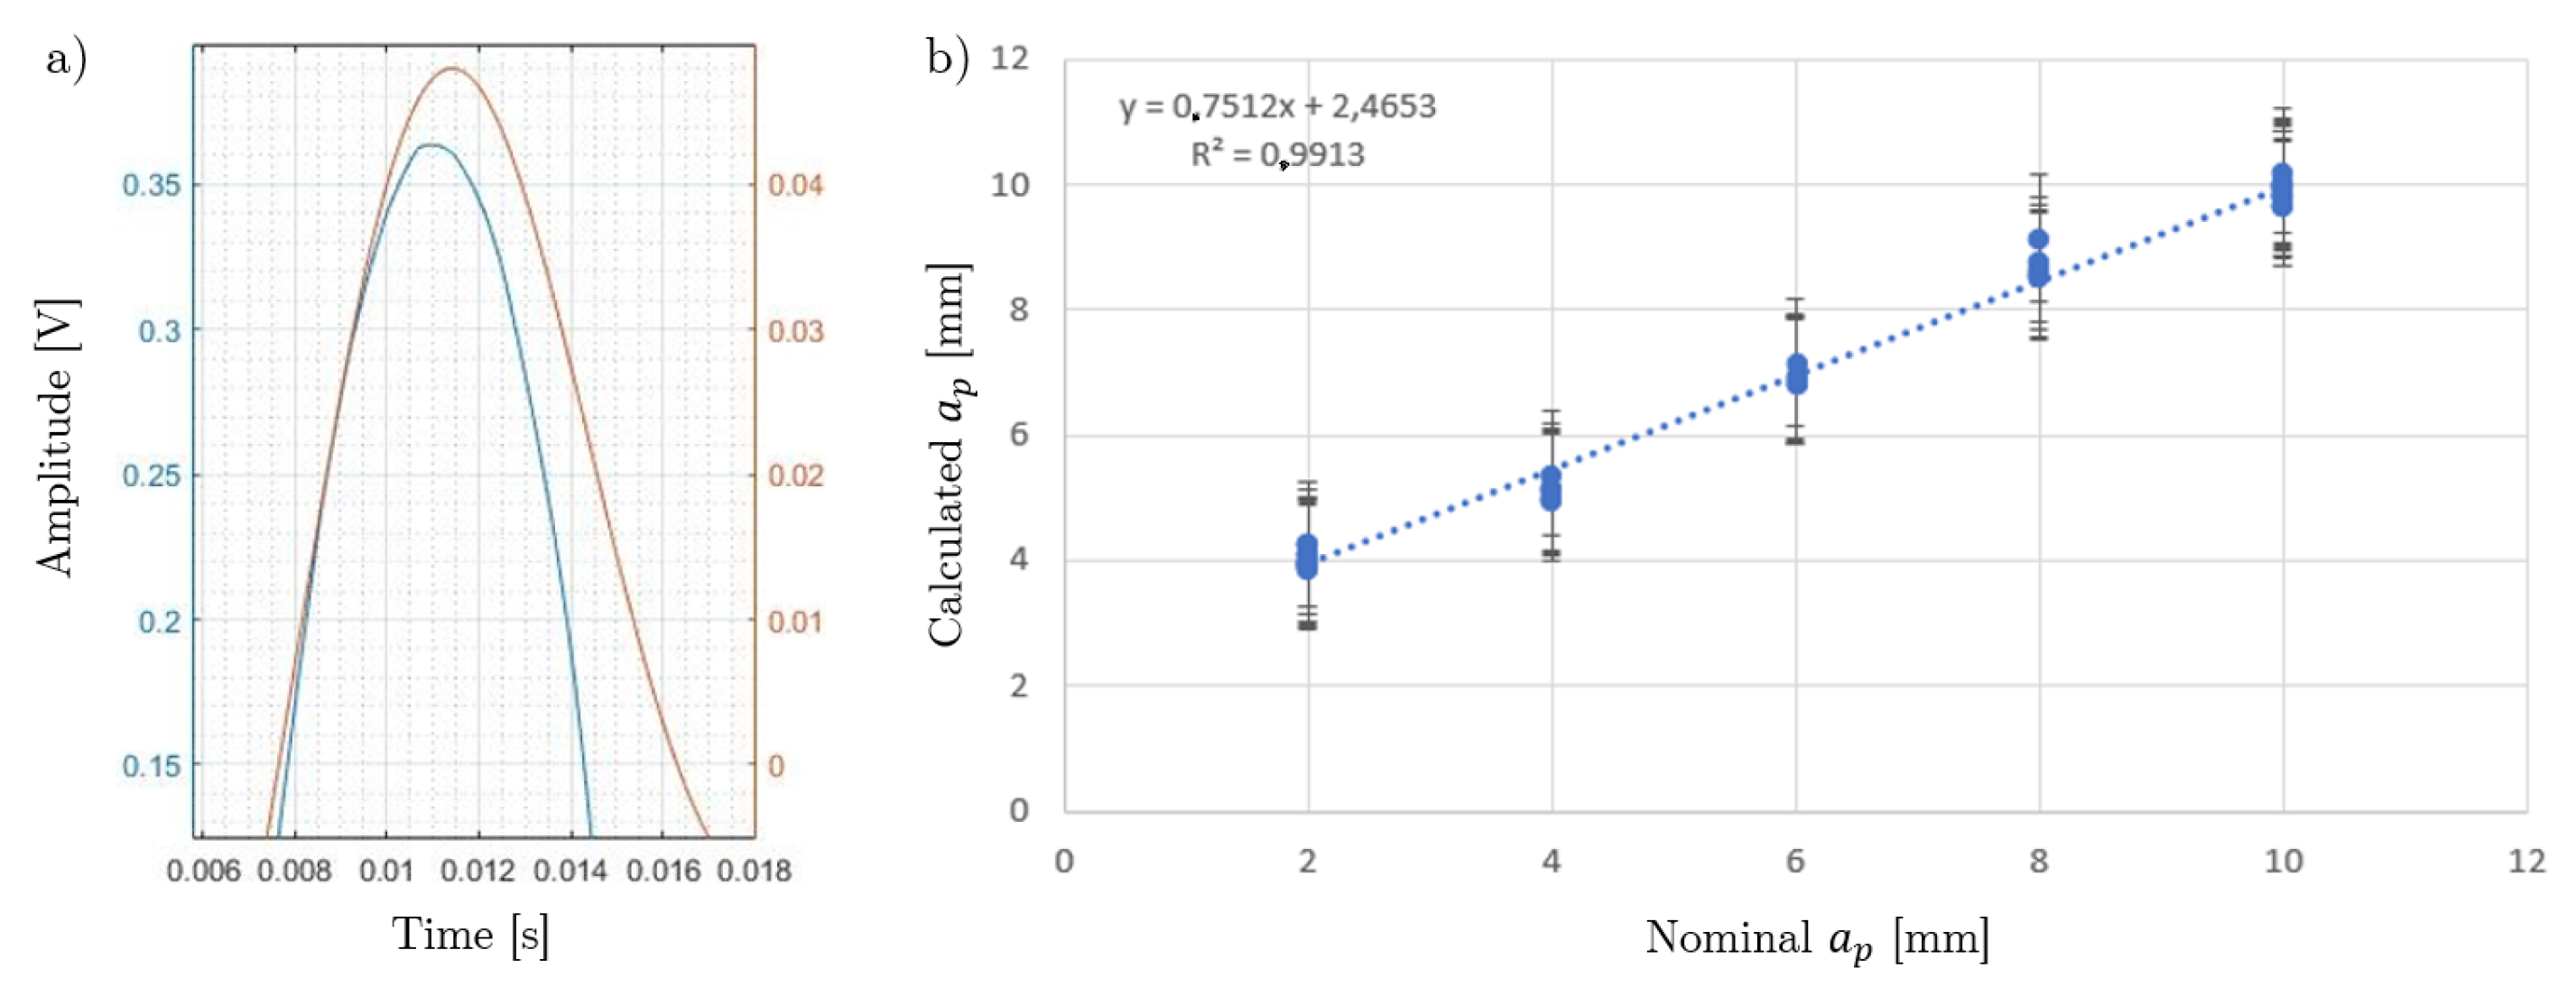
The presence of large errors was a direct consequence of the slow time response of the microphone, which gave a poor estimation of the exit time of the cutting edge (see Figure 9a). However, the exit time difference between the cutting force and the filtered AE signal remained relatively constant and therefore, the predicted value can be adjusted in terms of a correction factor obtained from a calibration curve as shown in Figure 9b. This calibration curve was valid for the test conditions listed in Table 3. Any new set of machining conditions requires its own calibration process, which is the main drawback of this methodology.
On the other hand, the use of an adaptive filter and the geometric model of the end-milling process offers the potential to estimate the depth of cut even if the depth of cut varies during the cutting operation. However, this property requires further study and testing.

5.3. Precision of the Proposed Method

The experimental results after the calibration stage are shown in Table 5. The corrected estimates of the depth of cut, obtained from the filtered AE signal, are of the same order to the reference values given by the cutting forces. The absolute difference between these estimates is slightly above 10%, which supports the feasibility of this prototype system as an alternative to the traditional methods with the advantage of reduced cost and low invasiveness.
Furthermore, it should be noted that this algorithm is capable of working completely independent of the CNC control. If the nominal value of the depth of cut is provided as an input to the system, the difference between the estimates of the filtered AE signal and the values of cutting force drops to less than 1%, as can be seen in Table 6.
The applicability of this method relies on controlling the presence of any external disturbance, and further analysis should be performed. As an example, Figure 10 shows the calculated depth of cut values for all the test runs listed in Table 3. Note that the effect of higher background noise level and impacts can be seen for ap = 2 mm and ap = 6 mm, respectively.

6. Conclusions

The present contribution discusses a prototype measurement system with the ability to estimate the axial depth of cut during end-milling operations. This is performed by the analysis of airborne acoustic emissions registered by a non-contact MEMS microphone. The advantage of this system is the reduced cost and low invasiveness, which might be considered as an alternative to traditional methods with contact-based transducers mounted rigidly to the workpiece.
Here, a geometric model of the machining process, an adaptive filter and a calibration stage has been used to estimate the depth of cut during end-milling operations. The feasibility of this method has been tested experimentally in a CNC machining center under laboratory conditions. The estimations of the depth of cut are compared with the reference values given by the cutting forces. These errors are slightly above 10% when the algorithm is working completely independent from the CNC control, and it drops to less than 1% if the nominal depth of cut is fed into the algorithm.
Extending this methodology to industrial applications requires further study. For instance, the accuracy of the predicted values should be assessed in terms of the background noise level of the input signal. Moreover, the calibration process and the analysis of overlapping in multi-flute cutters should also be considered in future work.

Author Contributions

Conceptualization, A.S.-S., G.d.A.-C. and A.V.-I.; methodology, A.S.-S., E.L.-M., G.d.A.-C. and A.V.-I.; software, A.S.-S. and J.M.L.-N.; validation, G.d.A.-C. and A.V.-I.; formal analysis, A.S.-S.; investigation, A.S.-S. and J.M.L.-N.; resources, A.V.-I., G.d.A.-C. and E.L.-M.; data curation, A.S.-S.; writing—original draft preparation, A.S.-S.; writing—review and editing, E.L.-M., R.A.-F., G.d.A.-C. and A.V.-I.; visualization, A.S.-S, E.L.-M. and R.A.-F.; supervision, G.d.A.-C., A.V.-I. and J.M.L.-N.; project administration, G.d.A.-C. and A.V.-I.; funding acquisition, G.d.A.-C. All authors have read and agreed to the published version of the manuscript.

Funding

This research was partially funded by the grant of the Comunidad de Madrid with reference PEJD-2018-PRE/IND-7963.

Acknowledgments

Authors also thank the support of Universidad de La Frontera through Project DIUFRO DI170020.

Conflicts of Interest

The authors declare no conflict of interest.

Correction Statement

This article has been republished with a minor correction to the existing affiliation information. This change does not affect the scientific content of the article.

Abbreviations

The following abbreviations are used in this manuscript:
AEAcoustic Emission
aeRadial depth of cut, mm 
aeiAxial depth of cut, mm 
apiAxial depth of cut of the flute i, mm 
apaActual axial depth of cut, mm 
φ enEntry angle, rad 
φ eniEntry angle of flute i, rad 
φ prProjected angle of the cutting edge, rad 
FxCutting force in X direction, N 
TPeriod of spindle rotation, s 
DTool diameter, mm 
fzFeed per tooth, mm 
nSpindle speed, rpm 
NTool flute number, -
λ sTool helix angle, rad 

References

  1. Yan, R.; Tang, X.; Peng, F.Y.; Wang, Y.; Qiu, F. The effect of variable cutting depth and thickness on milling stability for orthogonal turn-milling. Int. J. Adv. Manuf. Technol. 2016, 82, 765–777. [Google Scholar] [CrossRef]
  2. Zhang, Z.; Luo, M.; Zhang, D.; Wu, B. A force-measuring-based approach for feed rate optimization considering the stochasticity of machining allowance. Int. J. Adv. Manuf. Technol. 2018, 97, 2545–2556. [Google Scholar] [CrossRef]
  3. Leal-Muñoz, E.; Diez, E.; Perez, H.; Vizan, A. Accuracy of a new online method for measuring machining parameters in milling. Measurement 2018, 128, 170–179. [Google Scholar] [CrossRef]
  4. Prickett, P.W.; Siddiqui, R.A.; Grosvenor, R.I. Accuracy of a new online method for measuring machining parameters in milling. Int. J. Adv. Manuf. Technol. 2011, 52, 89–100. [Google Scholar] [CrossRef]
  5. Castaño, F.; Haber, R.E.; del Toro, R.M. Characterization of tool-workpiece contact during the micromachining of conductive materials. Mech. Syst. Signal Process. 2017, 83, 489–505. [Google Scholar] [CrossRef]
  6. Castaño, F.; Toro, R.M.; Del Haber, R.E.; Beruvides, G. Conductance sensing for monitoring micromechanical machining of conductive materials. Sens. Actuators A Phys. 2015, 232, 163–171. [Google Scholar]
  7. Marinescu, I.; Axinte, D.A. A critical analysis of effectiveness of acoustic emission signals to detect tool and workpiece malfunctions in milling operations. Int. J. Mach. Tools Manuf. 2008, 48, 1148–1160. [Google Scholar] [CrossRef]
  8. Axinte, D.; Marinescu, I. A time-frequency acoustic emission-based monitoring technique to identify workpiece surface malfunctions in milling with multiple teeth cutting simultaneously. Int. J. Mach. Tools Manuf. 2009, 41, 53–65. [Google Scholar]
  9. Sun, S.; Hu, X.; Zhang, W. Detection of tool breakage during milling process through acoustic emission. Int. J. Adv. Manuf. Technol. 2020, 109, 1409–1418. [Google Scholar] [CrossRef]
  10. Ahmed, S.; Arif, Y.; Veldhuis, A.F.M.; Clarence, S. Application of the wavelet transform to acoustic emission signals for built-up edge monitoring in stainless steel machining. Meas. J. Int. Meas. Confed. 2020, 154, 107478. [Google Scholar] [CrossRef]
  11. Seemuang, N.; McLeay, T.; Slatter, T. Using spindle noise to monitor tool wear in a turning process. Int. J. Adv. Manuf. Technol. 2016, 86, 2781–2790. [Google Scholar] [CrossRef]
  12. Shankar, S.; Mohanraj, T.; Rajasekar, R. Prediction of cutting tool wear during milling process using artificial intelligence techniques. Int. J. Comput. Integr. Manuf. 2019, 32, 174–182. [Google Scholar] [CrossRef]
  13. Prakash, K.; Samraj, A. Tool Flank Wears Estimation by Simplified SVD on Emitted Sound Signals. In Proceedings of the 2017 Conference on Emerging Devices and Smart Systems (ICEDSS), Tiruchengode, India, 3–4 March 2017; pp. 1–5. [Google Scholar]
  14. Lee, R.M.; Liu, P.T.; Wang, C.C. Investigation of milling stability under cutting fluid supply by microphone signal analysis. Sens. Mater. 2018, 30, 2419–2428. [Google Scholar] [CrossRef]
  15. Shrivastava, Y.; Singh, B. Estimation of stable cutting zone in turning based on empirical mode decomposition and statistical approach. J. Braz. Soc. Mech. Sci. Eng. 2018, 40, 77. [Google Scholar] [CrossRef]
  16. Kilic, Z.M.; Altintas, Y.; Caliskan, H. On-line energy-based milling chatter detection. J. Manuf. Sci. Eng. 2018, 140, 1–12. [Google Scholar]
  17. Lee, W.-C.; Cheng, H.-C.; Wei, C.-C. Development of a machining monitoring and chatter suppression device. In Proceedings of the 2018 IEEE Industrial Cyber-Physical Systems (ICPS), St. Petersburg, Russia, 15–18 May 2018; Volume 18, pp. 404–408. [Google Scholar]
  18. Lee, W.C.; Cheng, H.C.; Wei, C.C. Implementation of an Add-on Device that Monitors the Sound of a Machine Tool and Automatically Suppresses Chatter. Sens. Mater. 2019, 31, 3575–3582. [Google Scholar] [CrossRef]
  19. Zhu, L.; Liu, C. Recent progress of chatter prediction, detection and suppression in milling. Mech. Syst. Signal Process. 2020, 143, 106840. [Google Scholar] [CrossRef]
  20. Onwuka, G.; Abou-El-Hossein, K.T. Surface Roughness in Ultra-high Precision Grinding of BK7. Procedia CIRP 2016, 45, 143–146. [Google Scholar] [CrossRef]
  21. Ribeiro, K.S.B.; Venter, G.S.; Rodrigues, A.R. Experimental correlation between acoustic emission and stability in micromilling of different grain-sized materials. Int. J. Adv. Manuf. Technol. 2020, 109, 2173–2187. [Google Scholar] [CrossRef]
  22. Yan, G.; Wu, Y.; Cristea, D.; Liu, L.; Tierean, M.; Wang, Y.; Lu, F.; Wang, H.; Yuan, Z.; Munteanu, D.; et al. Mechanical properties and wear behavior of multi-layer diamond films deposited by hot-filament chemical vapor deposition. Appl. Surf. Sci. 2019, 494, 401–411. [Google Scholar] [CrossRef]
  23. Dong, C.; Mo, J.; Yuan, C.; Bai, X.; Tian, Y. Vibration and Noise Behaviors During Stick–Slip Friction. Tribol. Lett. 2019, 67. [Google Scholar] [CrossRef]
  24. Srinivasan, A.; Bhinge, R.; Dornfeld, D. Integrated vibration and acoustic data data fusion for chatter and tool classification in milling. In Proceedings of the ISFA 2016, 2016 International Symposium on Flexible Automation, Cleveland, OH, USA, 1–3 August 2016; pp. 263–266. [Google Scholar]
  25. Gaja, H.; Liou, F. Depth of cut monitoring for hybrid manufacturing using acoustic emission sensor. In Proceedings of the 26th Annual International Solid Freeform Fabrication Symposium, Austin, TX, USA, 10–12 August 2015. [Google Scholar]
  26. Zhang, X.; Chen, H.; Xu, J.; Song, X.; Wang, J.; Chen, X. A novel sound-based belt condition monitoring method for robotic grinding using optimally pruned extreme learning machine. J. Mater. Process. Technol. 2018, 260, 9–19. [Google Scholar] [CrossRef]
  27. Bejaxhin, A.B.H.; Paulraj, G. Experimental investigation of vibration intensities of CNC machining centre by microphone signals with the effect of TiN/epoxy coated tool holder. J. Mech. Sci. Technol. 2019, 33, 1321–1331. [Google Scholar] [CrossRef]
  28. Nasir, V.; Cool, J.; Sassani, F. Intelligent Machining Monitoring Using Sound Signal Processed with the Wavelet Method and a Self-Organizing Neural Network. IEEE Robot. Autom. Lett. 2019, 4, 3449–3456. [Google Scholar] [CrossRef]
  29. Shehadeh, M.F.; Elbatran, A.H.; Mehanna, A.; Steel, J.A.; Reuben, R.L.A. Evaluation of Acoustic Emission Source Location in Long Steel Pipes for Continuous and Semi-continuous Sources. J. Nondestruct. Eval. 2019, 38, 40. [Google Scholar] [CrossRef]
  30. Shanyavskiy, A.; Banov, M. Acoustic emission methods for lifetime estimations in aircraft structures. Theor. Appl. Fract. Mech. 2020, 109, 102719. [Google Scholar] [CrossRef]
  31. Liu, Z.; Wang, X.; Zhang, L. Fault Diagnosis of Industrial Wind Turbine Blade Bearing Using Acoustic Emission Analysis. IEEE Trans. Instrum. Meas. 2020, 69, 6630–6639. [Google Scholar] [CrossRef]
  32. Dai, Y.; Xue, Y.; Zhang, J. Bioinspired Integration of Auditory and Haptic Perception in Bone Milling Surgery. IEEE/ASME Trans. Mech. 2018, 23, 614–623. [Google Scholar] [CrossRef]
  33. Ianasaki, I.; Toensho, H.K. Sensors in Manufacturing. In Sensors in Manufacturing; Wiley-VCH: Weinheim, Germany, 2001. [Google Scholar]
  34. Faudzi, A.A.M.; Sabzehmeidani, Y.; Suzumori, K. Application of micro-electro-mechanical systems (MEMS) as sensors: A review. J. Robot. Mech. 2020, 32, 281–288. [Google Scholar] [CrossRef]
  35. Băjenescu, T.-M.I. Manufacturing, encapsulation and reliability of micro-and nano-sensors. EEA Electr. Electron. Autom. 2020, 68, 21–27. [Google Scholar]
  36. Kim, H.; Jung, W.-Y.; Choi, I.-G.; Ahn, S.-H. A Low-Cost Vision-Based Monitoring of Computer Numerical Control (CNC) Machine Tools for Small and Medium-Sized Enterprises (SMEs). Sensors 2019, 19, 4506. [Google Scholar] [CrossRef] [PubMed]
  37. Modica, F.; Basile, V.; Ruggeri, S.; Fontana, G.; Fassi, I. Can A Low Cost Sensing System Be Exploited for High Precision Machining? In Proceedings of the 15th CIRP Conference on Computer Aided Tolerancing, Milan, Italy, 11–13 June 2018; pp. 391–396. [Google Scholar]
  38. Narayanan, A.; Kanyuck, A.; Gupta, S.K.; Rachuri, S. Machine condition detection for milling operations using low cost ambient sensors. In Proceedings of the ASME 2016 International Manufacturing Science and Engineering Conference, Blacksburg, VA, USA, 27 June–1 July 2016. MSEC2016-8666. [Google Scholar]
  39. Biermann, D.; Zabel, A.; Brüggemann, T.; Barthelmey, A. A comparison of low cost structure-borne sound measurement and acceleration measurement for detection of workpiece vibrations in 5-axis simultaneous machining. Procedia CIRP 2013, 12, 1–96. [Google Scholar] [CrossRef]
  40. Kumar, P.; Morawska, L.; Martani, C.; Biskos, G.; Neophytou, M.; Di Sabatino, S.; Bell, M.; Norford, L.; Britter, R. The rise of low-cost sensing for managing air pollution in cities. Environ. Int. 2015, 75, 199–205. [Google Scholar] [CrossRef] [PubMed]
  41. Castell, N.; Dauge, F.R.; Schneider, P.; Vogt, M.; Lerner, U.; Fishbain, B.; Broday, D.; Bartonova, A. Can commercial low-cost sensor platforms contribute to air quality monitoring and exposure estimates? Environ. Int. 2017, 99, 293–302. [Google Scholar] [CrossRef]
  42. Sofia, D.; Giuliano, A.; Gioiella, F. Air quality monitoring network for tracking pollutants: The case study of Salerno city center. Chem. Eng. Trans. 2018, 68, 67–72. [Google Scholar]
  43. Ham, S.; Popovics, J.S. Application of micro-electro-mechanical sensors contactless NDT of concrete structures. Sensors 2015, 15, 9078–9096. [Google Scholar] [CrossRef]
  44. Reich, C.; Mansour, A.; Van Laerhoven, K. European Signal Processing Conference. In Proceedings of the European Signal Processing Conference, Roma, Italy, 3–7 September 2018; pp. 371–375. [Google Scholar]
  45. Kazari, H.; Ozevin, D. Multi frequency acoustic emission micromachined transducers for structural health monitoring. In Proceedings of the 12th International Workshop on Structural Health Monitoring, Stanford, CA, USA, 10–12 September 2019; Volume 1, pp. 72–79. [Google Scholar]
  46. Raviola, E.; Fiori, F. A Low-Cost, Small-Size, and Bluetooth-Connected Module to Detect Faults in Rolling Bearings. Appl. Sci. 2020, 10, 5645. [Google Scholar] [CrossRef]
  47. Fragiacomo, G.; Reck, K.; Lorenzen, L.; Thomsen, E.V. Novel designs for application specific MEMS pressure sensors. Sensors 2010, 110, 9541–9563. [Google Scholar] [CrossRef]
  48. Lee, D.E.; Hwang, I.; Valente, C.M.O.; Oliveira, J.F.G.; Dornfeld, D.A. Precision manufacturing process monitoring with acoustic emission. IEEE Robot. Autom. Lett. 2006, 46, 176–188. [Google Scholar]
  49. Möhring, H.-C.; Kimmelmann, M.; Eschelbacher, S.; Güzel, K.; Gauggel, C. Process monitoring on drilling fiber-reinforced plastics and aluminum stacks using acoustic emissions. Procedia Manuf. 2018, 18, 58–67. [Google Scholar] [CrossRef]
  50. Jemielniak, K.; Kossakowska, J.; Urbański, T. Application of wavelet transform of acoustic emission and cutting force signals for tool condition monitoring in rough turning of Inconel 625. Proc. Inst. Mech. Eng. Part B J. Eng. Manuf. 2011, 225, 123–129. [Google Scholar] [CrossRef]
  51. O’Donnell, G.; Dornfeld, D.; Teti, R.; Jemielniak, K. Advanced monitoring of machining operations. CIRP Ann. Manuf. Technol. 2010, 59, 717–739. [Google Scholar]
  52. Gaja, H.; Liou, F. Automatic detection of depth of cut during end milling operation using acoustic emission sensor. Int. J. Adv. Manuf. Technol. 2016, 86, 2913–2925. [Google Scholar] [CrossRef]
  53. Srdjovic, J.; Anicic, O.; Jovanovic, M. Adaptive neuro-fuzzy fusion of multi-sensor data for monitoring of CNC machining. Sens. Rev. 2017, 37, 78–81. [Google Scholar]
  54. Ren, Q.; Baron, L.; Balazinski, M.; Botez, R.; Bigras, P. Tool wear assessment based on type-2 fuzzy uncertainty estimation on acoustic emission. Appl. Soft Comput. J. 2015, 31, 14–24. [Google Scholar] [CrossRef]
  55. Miranda, H.I.; Rocha, C.A.; Oliveira, P.; Martins, C.; Aguiar, P.R.; Bianchi, E.C.P.R.; Bianchi, E.C. Monitoring single-point dressers using fuzzy models. Procedia CIRP 2015, 33, 281–286. [Google Scholar] [CrossRef]
  56. Aguiar, P.R.; Da Silva, R.B.; Gerônimo, T.M.; Franchin, M.N.; Bianchi, E.C. Estimating high precision hole diameters of aerospace alloys using artificial intelligence systems: A comparative analysis of different techniques. J. Braz. Soc. Mech. Sci. Eng. 2017, 39, 127–153. [Google Scholar] [CrossRef]
  57. Nakai, M.E.; Guillardi, H.; Aguiar, P.R.; Bianchi, E.C.; Da Silva, P.S. Evaluation of neural models to estimate the roughness of advanced ceramics in surface grinding. Int. J. Mach. Mach. Mater. 2015, 17, 454–479. [Google Scholar] [CrossRef]
  58. Pan, W.; Pan, W.; Wu, Y.; Guo, L. New method for the calibration of cutter runout parameters in milling process. IOP Conf. Ser. Mater. Sci. Eng. 2019, 688. [Google Scholar] [CrossRef]
Figure 1. Main parameters of the end-milling process. (a) Top view, (b) front view, and (c) time history of the cutting process.
Sensors 20 05326 g001
Figure 2. Phases of the end-milling process. (a) Cutting force signal, and (b) acoustic emission (AE) signal.
Sensors 20 05326 g002
Figure 3. Cutting force model for a single edge cutting tool, with D = 8 mm, ap = 8 mm, ae = 1 mm, fz = 0.08 mm and n = 1200 rpm.
Sensors 20 05326 g003
Figure 4. Schematic representation of the conditioning board.
Sensors 20 05326 g004
Figure 5. Block diagram of the system.
Sensors 20 05326 g005
Figure 6. Time parameters measurement. (a) Threshold-based algorithm. (b) Slope-based algorithm.
Sensors 20 05326 g006
Figure 7. Scheme of the setup (top) and image of the sensors and the piece being machined (bottom).
Sensors 20 05326 g007
Figure 8. Experimental signals under analysis. (a) Cutting force signal (top), raw AE signal (middle), and filtered AE signal (bottom). (b) Zoomed section of the cutting force and filtered AE signals within the zone of uniform cut.
Sensors 20 05326 g008
Figure 9. Experimental results. (a) Exit time delay between the cutting force signal (blue) and filtered AE signal (orange). (b) Calibration curve: estimated vs. nominal depth of cut.
Sensors 20 05326 g009
Figure 10. Effect of impacts and high level of background noise on the experimental results.
Sensors 20 05326 g010
Table 1. Technical specifications of the SPU1410LR5H-QB microphone.
Range10 Hz–10 kHz
DirectivityOmnidirectional
Sensitivity−38 dBV/Pa
Signal to Noise Ratio63 dB(A)
DC Output at V d d = 1.5 V0.73 V
Total Harmonic Distortion at 1 kHz0.15%
Table 2. Main characteristics of the dynamometer Kistler 9257A.
Dynamic range±5 kN
Threshold<0.01 N
Pretensioning directionVertical
Frequency range1 Hz–2 kHz
Linearity, all ranges<±1%
Table 3. Machining conditions of the experiment.
Depth of cutap [mm]2–10
Width of cutae [mm]1
Feed per toothfz [mm]0.08
Spindle speedn [rpm]1200
Tool flute numberN [-]1
Tool diameterD [mm]8
Tool helix angle λ s [°]30
Table 4. Experimental results for the estimated axial depth of cut.
Nominal ap [mm]Calculated ap [mm]STD [ μ m]Error [mm]
24.141742.14
45.211851.21
67.102801.10
88.703000.70
109.80259−0.20
24.121592.12
109.82241−0.18
Table 5. Comparison between the dynamometer and the microphone values.
DynamometerMicrophone
Nominal ap [mm]Calculated ap [mm]STD [ μ m]Calculated ap [mm]STD [ μ m]Difference [%]
22.0182.231749.87
44.03143.65185−10.41
65.99236.172802.92
88.04318.303003.13
1010.30399.76259−5.13
Table 6. Results with known nominal depth of cut.
DynamometerMicrophone
Nominal ap [mm]Calculated ap [mm]STD [ μ m]Calculated ap [mm]STD [ μ m]Difference [%]
22.0182.01140.50
44.03144.0025<0.01
65.99235.9938−0.17
88.04318.0062<0.01
1010.303910.01530.10