Article

A Paper-Based Near-Infrared Optical Biosensor for Quantitative Detection of Protease Activity Using Peptide-Encapsulated SWCNTs

1
Department of Plant Sciences and Genetics in Agriculture, Faculty of Agriculture, Food and Environment, The Hebrew University of Jerusalem, Rehovot 76100, Israel
2
Center for Nanoscience and Nanotechnology, Applied Physics Department, The Hebrew University of Jerusalem, Jerusalem 9190501, Israel
3
Department of Biomedical Engineering, Faculty of Engineering, Tel Aviv University, Tel Aviv 6997801, Israel
4
Institute of Biochemistry, Food Science and Nutrition, Faculty of Agriculture, Food and Environment, The Hebrew University of Jerusalem, Rehovot 76100, Israel
*
Authors to whom correspondence should be addressed.
Sensors 2020, 20(18), 5247; https://doi.org/10.3390/s20185247
Submission received: 28 July 2020 / Revised: 7 September 2020 / Accepted: 8 September 2020 / Published: 14 September 2020
(This article belongs to the Section Optical Sensors)

Abstract

:
A protease is an enzyme that catalyzes proteolysis of proteins into smaller polypeptides or single amino acids. As crucial elements in many biological processes, proteases have been shown to be informative biomarkers for several pathological conditions in humans, animals, and plants. Therefore, fast, reliable, and cost-effective protease biosensors suitable for point-of-care (POC) sensing may aid in diagnostics, treatment, and drug discovery for various diseases. This work presents an affordable and simple paper-based dipstick biosensor that utilizes peptide-encapsulated single-wall carbon nanotubes (SWCNTs) for protease detection. Upon enzymatic digestion of the peptide, a significant drop in the photoluminescence (PL) of the SWCNTs was detected. As the emitted PL is in the near-infrared region, the developed biosensor has a good signal to noise ratio in biological fluids. One of the diseases associated with abnormal protease activity is pancreatitis. In acute pancreatitis, trypsin concentration could reach up to 84 µg/mL in the urine. For proof of concept, we demonstrate the feasibility of the proposed biosensor for the detection of the abnormal levels of trypsin activity in urine samples.

1. Introduction

Disruption of enzymes’ homeostasis is associated with many pathological conditions. Upregulation or downregulation of enzyme expression is often used as a biomarker for disease diagnostics or as a drug target. A protease is an enzyme that hydrolyzes the amide bonds of proteins and breaks them into smaller polypeptides or single amino acids; thus, proteases play a crucial role in the maintenance of cells’ homeostasis. Proteases are classified into families based on their catalytic site, i.e., aspartic, cysteine, glutamic, metallo, serine, and threonine proteases [1]. They are involved in numerous intracellular and extracellular processes and are known to play an important role in cancer [2,3,4,5], cardiovascular disease [6,7], pancreatitis [8,9], diabetes [10], viral infections [11] (including the novel COVID-19 [12]), and microbial [13,14] infections. Almost 6% of the proteins in the human genome are proteases [15], and they can be found in biological fluids like saliva [16], serum [17], and urine [18,19]. Therefore, monitoring protease activity could aid in drug development, diagnostics, and treatment of various pathological conditions.
Biosensors can serve as compact, reliable, cost-effective, and easy-to-operate devices for point of care (POC) diagnostics. Depending on the method of the signal transducer, biosensors can be classified into five main categories: electrochemical, optical, piezoelectric, thermometric, and magnetic [20]. Optical biosensors are usually simpler in their configuration, maintenance, and handling compared to other types of biosensors [21]. The sensors themselves are physically separated from the detector, thus simplifying their replacement and preventing possible contamination of the device by biological samples. The detector itself, in many cases, could be a simple complementary metal oxide semiconductor (CMOS) camera—sometimes one that is integrated into a smartphone [22,23], thus significantly reducing the device cost. Optical biosensors that emit signals in the near-infrared (NIR) region are of particular interest in the biomedical field, as NIR wavelengths are less absorbed and scattered in biological tissues compared to visible wavelengths [24].
Semiconducting single-wall carbon nanotubes (SWCNTs) are one of the most promising nanoscale molecules for NIR photoluminescence (PL) and electrochemical-based sensing [25,26,27,28]. SWCNTs are characterized by two chiral indexes (n, m) according to their lattice structure [29]. NIR PL emission of SWCNTs depends on their chirality and falls between 900 and 1600 nm [9]. (6,5) chirality emits PL between 950 and 1100 nm [30], which enables creation of low-cost devices, as PL at around 1000 nm can be measured with the help of affordable silicon detectors instead of expensive and more complicated indium gallium arsenide (InGaAs) detectors [31,32].
It was demonstrated previously that SWCNTs can be dispersed in water using peptides [33], DNA [34], RNA [35], or various surfactants [36,37]. SWCNTs’ PL and conductivity were shown to be strongly influenced by changes in the local environment [38,39]. This exciting feature led to the development of various sensors. For example, SWCNT-based biosensors were developed for detection of small molecules [32,40,41], proteins [28,42,43,44], bacteria [45,46], ions [47], DNA [48,49], and RNA [50].
Trypsin protease is an extremely important serine protease found in the digestive system of humans and many other vertebrates [51]. It exclusively cleaves the C’-terminal of arginine and lysine residues [52]. Changes in trypsin activity are linked to pancreatic cancer [53] and pancreatitis [54,55]. It was reported that trypsin levels in serum and urine are dramatically increased during acute pancreatitis. While the normal range of trypsin concentration in the serum of a healthy person is 0.25 ± 0.1 μg/mL [56] and in the urine is about 115 to 350 ng/mL, patients with pancreatitis show maximum levels of 1.4 ± 0.6 [57] and 84.4  µg/mL, respectively [58]. One of the most frequently used methods for quantitative detection of proteins is enzyme-linked immunosorbent assay (ELISA) [59]. However, since proteases have catalytic activity, there is an interest in the quantification of enzyme activity and not only in its concentration [60,61,62]. The development of peptide-based assays to determine protease activity has advantages over conventional, non-specific protease assays using casein [63]. The success of the approach using magnetic nanoparticles [60], electrochemical sensing [64,65], calorimetry [66], mass spectrometry [67], quantum dots [68], and others was demonstrated for various proteases.
The current work presents a biosensor based on peptide-encapsulated (6,5) SWCNTs for the detection and quantification of protease activity. Detection of the active trypsin in urine samples was used as a model to demonstrate the capacities of the biosensor.

2. Materials and Methods

2.1. Chemicals and Reagents

N,N-diisopropylethylamine (DIEA), N,N-dimethylformamide (DMF), diethyl ether, Oxyma Pure, N,N-Diisopropylcarbodiimide (DIC), and trifluoroacetic acid (TFA) were purchased from Biolab (Jerusalem, Israel). Fmoc-AA-OH, 2-(1H-benzotriazole-1-yl)-1,1,3,3-tetramethyluronium hexafluorophosphate (HBTU), and rink amide resin (0.53 mmol/g) were purchased from Chem-Impex (Wood Dale, IL, USA). SWCNTs (CoMoCAT™ Signis® SG65), sodium cholate (SC), Bovine Serum Albumin (BSA) and poly (vinyl alcohol) were purchased from Sigma (Rehovot, Israel). Phosphate-buffered saline was purchased from Biological Industries (Beit HaEmek, Israel).

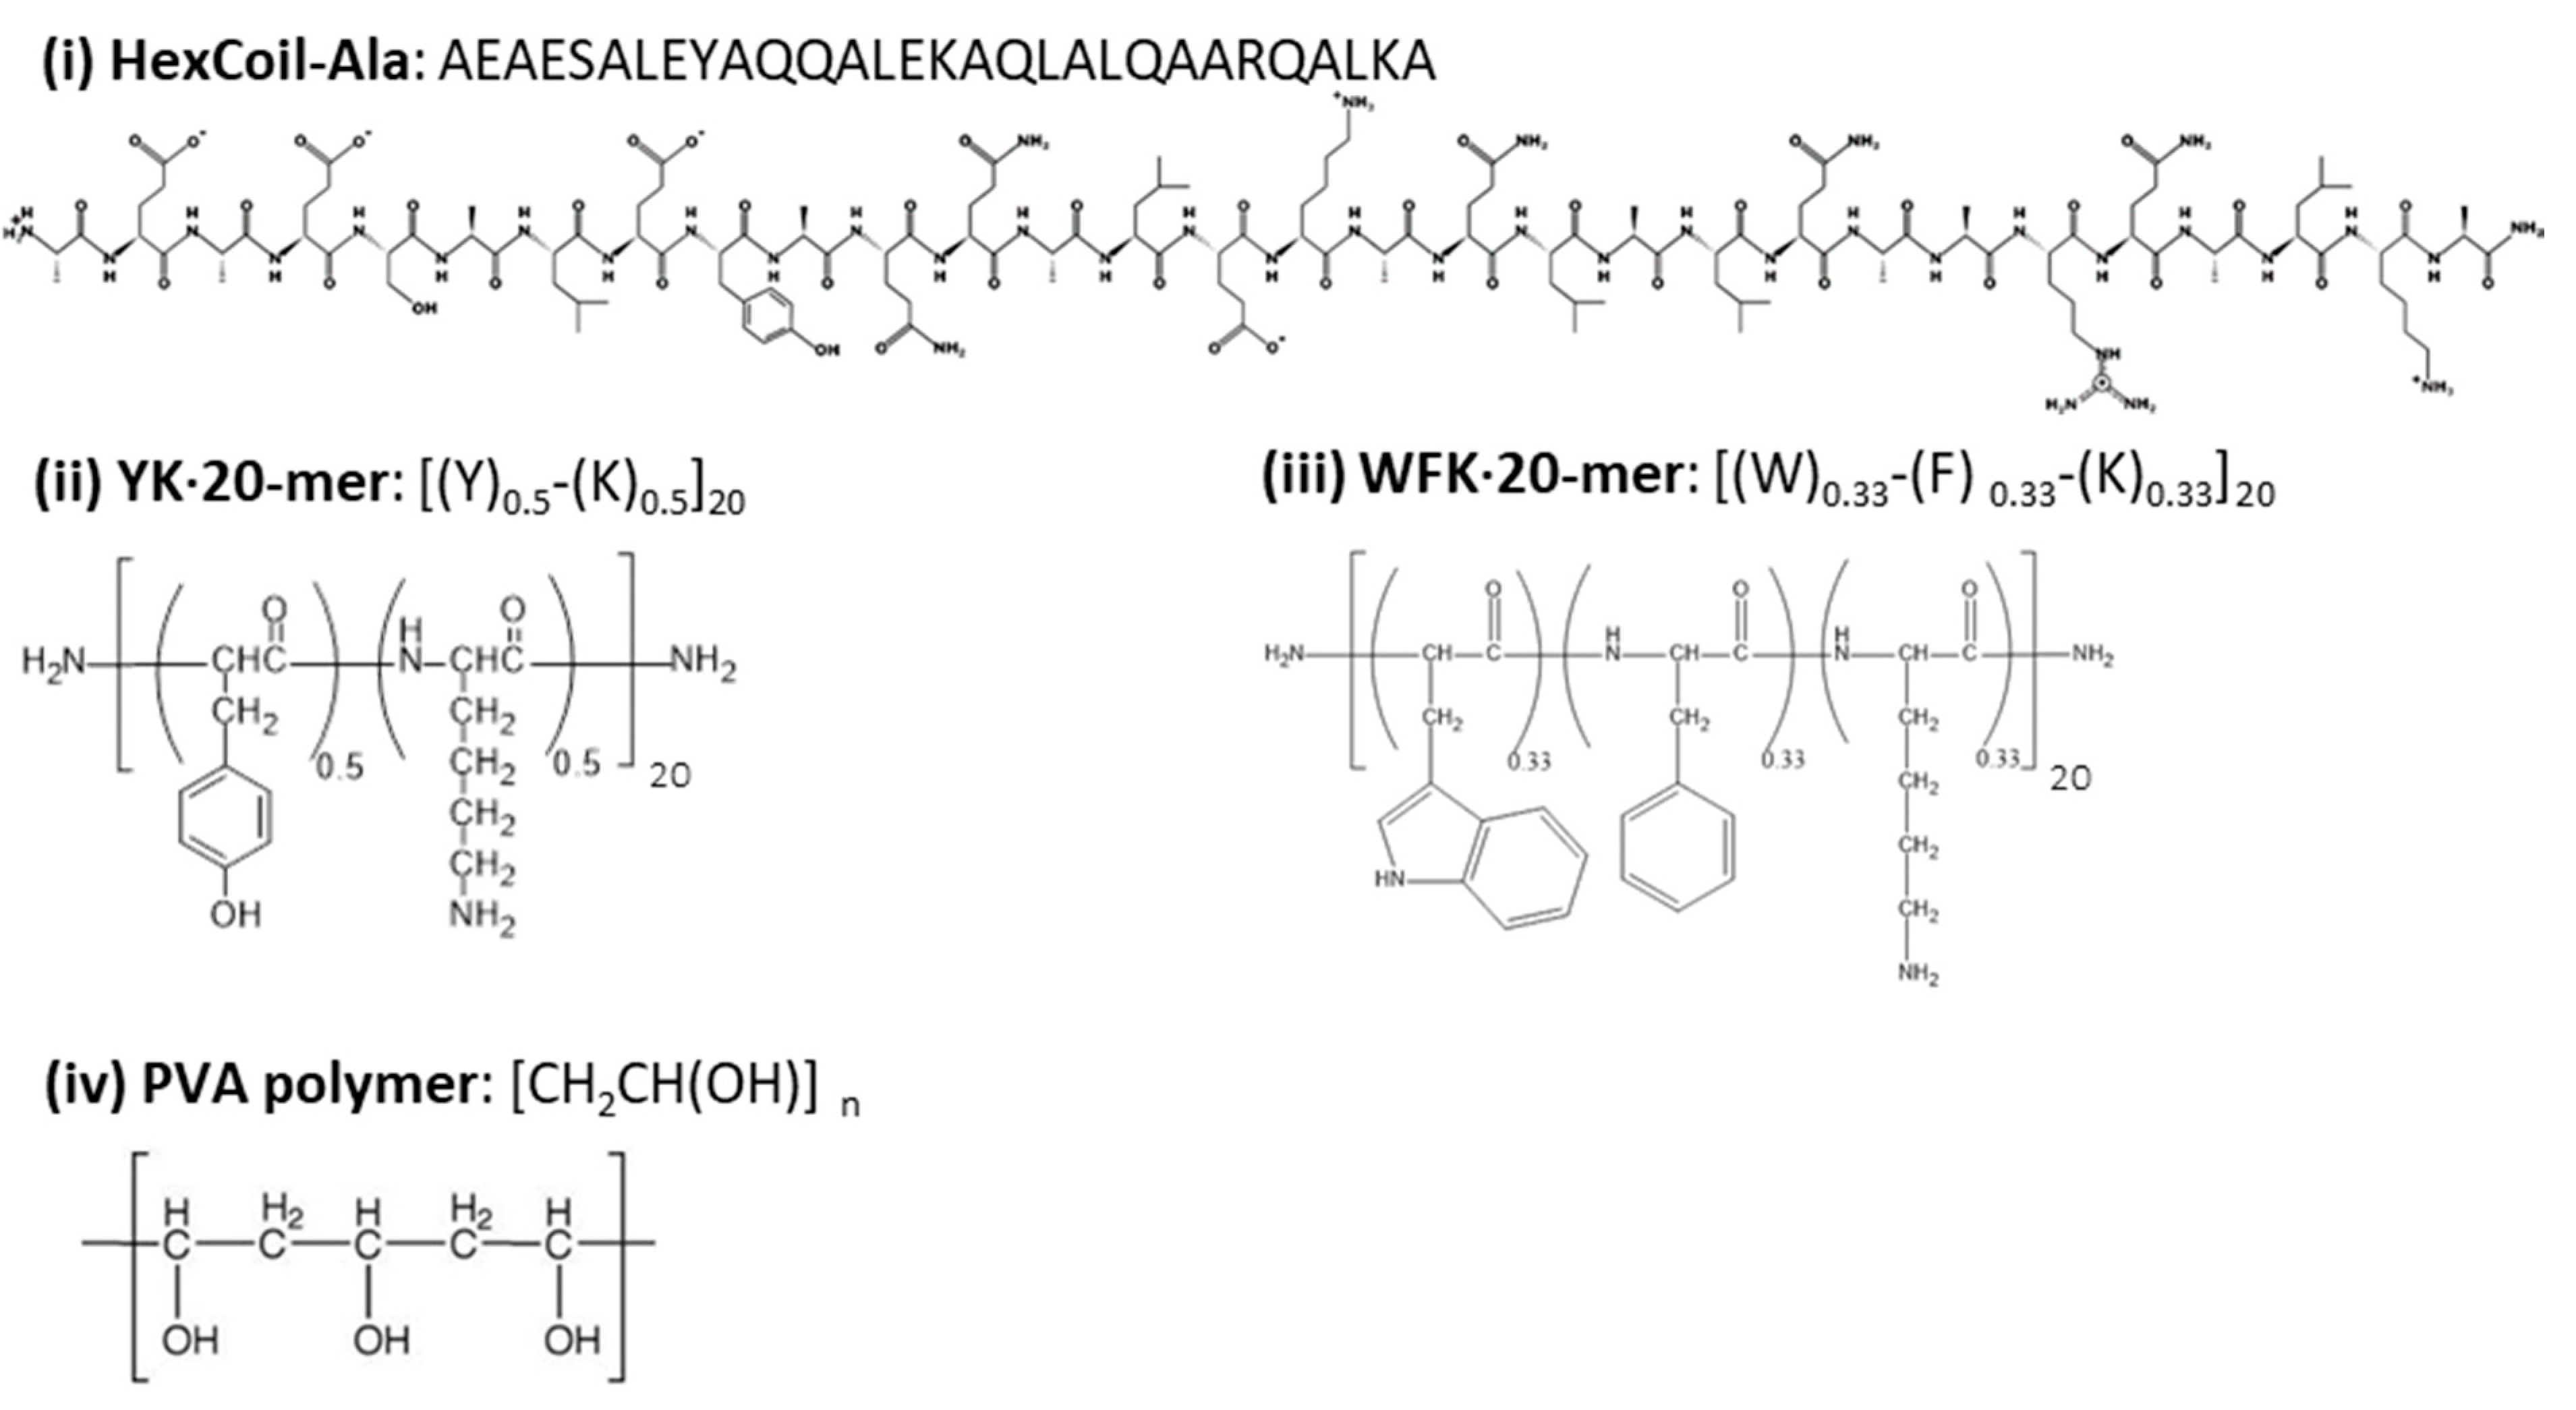
2.2. Peptide Synthesis

The HexCoil-Ala peptide developed by Grigoryan et al. [69,70] was synthesized with the CEM Liberty Blue™ Automated Microwave Peptide Synthesizer [71], on a 0.10 mmol scale, using rink amide resin (Chem Impex International Incorporated, Wood Dale, IL, USA), according to the manufacturer’s instructions. Briefly, 10% w/v piperidine was used as the Fmoc-deblocking reagent. Coupling was achieved using a 4-fold excess of Fmoc-AA-OH (0.2 M in DMF), DIC, and Oxyma Pure. The peptide was cleaved from the resin by a 3 h incubation in a 95% (v/v) TFA, 2.5% (v/v) in double-distilled water (DDW), and 2.5% (v/v) triisopropylsilane solution. The peptide was then precipitated by the addition of ether. After centrifugation (4 °C, 5000 RCF), the ether was aspirated, the pellet was frozen in liquid nitrogen, and lyophilized.
At random, peptides YK [(Y)0.5-(K)0.5]20 and WFK [(W)0.33-(F) 0.33-(K)0.33]20 were synthesized as previously described [72,73], using a MARS VI multimode microwave. Briefly, random peptide synthesis results in a mixture that contains up to 220 YK or 320 WFK peptides. Coupling reactions were conducted with binary combinations of L-Fmoc-protected amino acids. Before coupling, an aliquot containing four equivalents (100 μmol) of the 1:1 amino acid mixture was activated in DMF with four equivalents of HBTU and eight equivalents of DIEA. The activated amino acid solution was then added to the solid-phase synthesis resin, and the reaction mixture was heated to 70 °C in a MARS VI multimode microwave (2-min ramp to 70 °C, 4-min hold at 70 °C), with stirring. Deprotection was achieved by adding 20% piperidine in DMF and heating (2-min ramp to 80 °C, 3-min hold at 80 °C), with stirring. After each cycle, the resin was washed three times with DMF.
The synthesis was validated by MALDI-TOF mass spectrometry.
Peptides restriction sites were predicted using an ExPASy PeptideCutter tool [74].

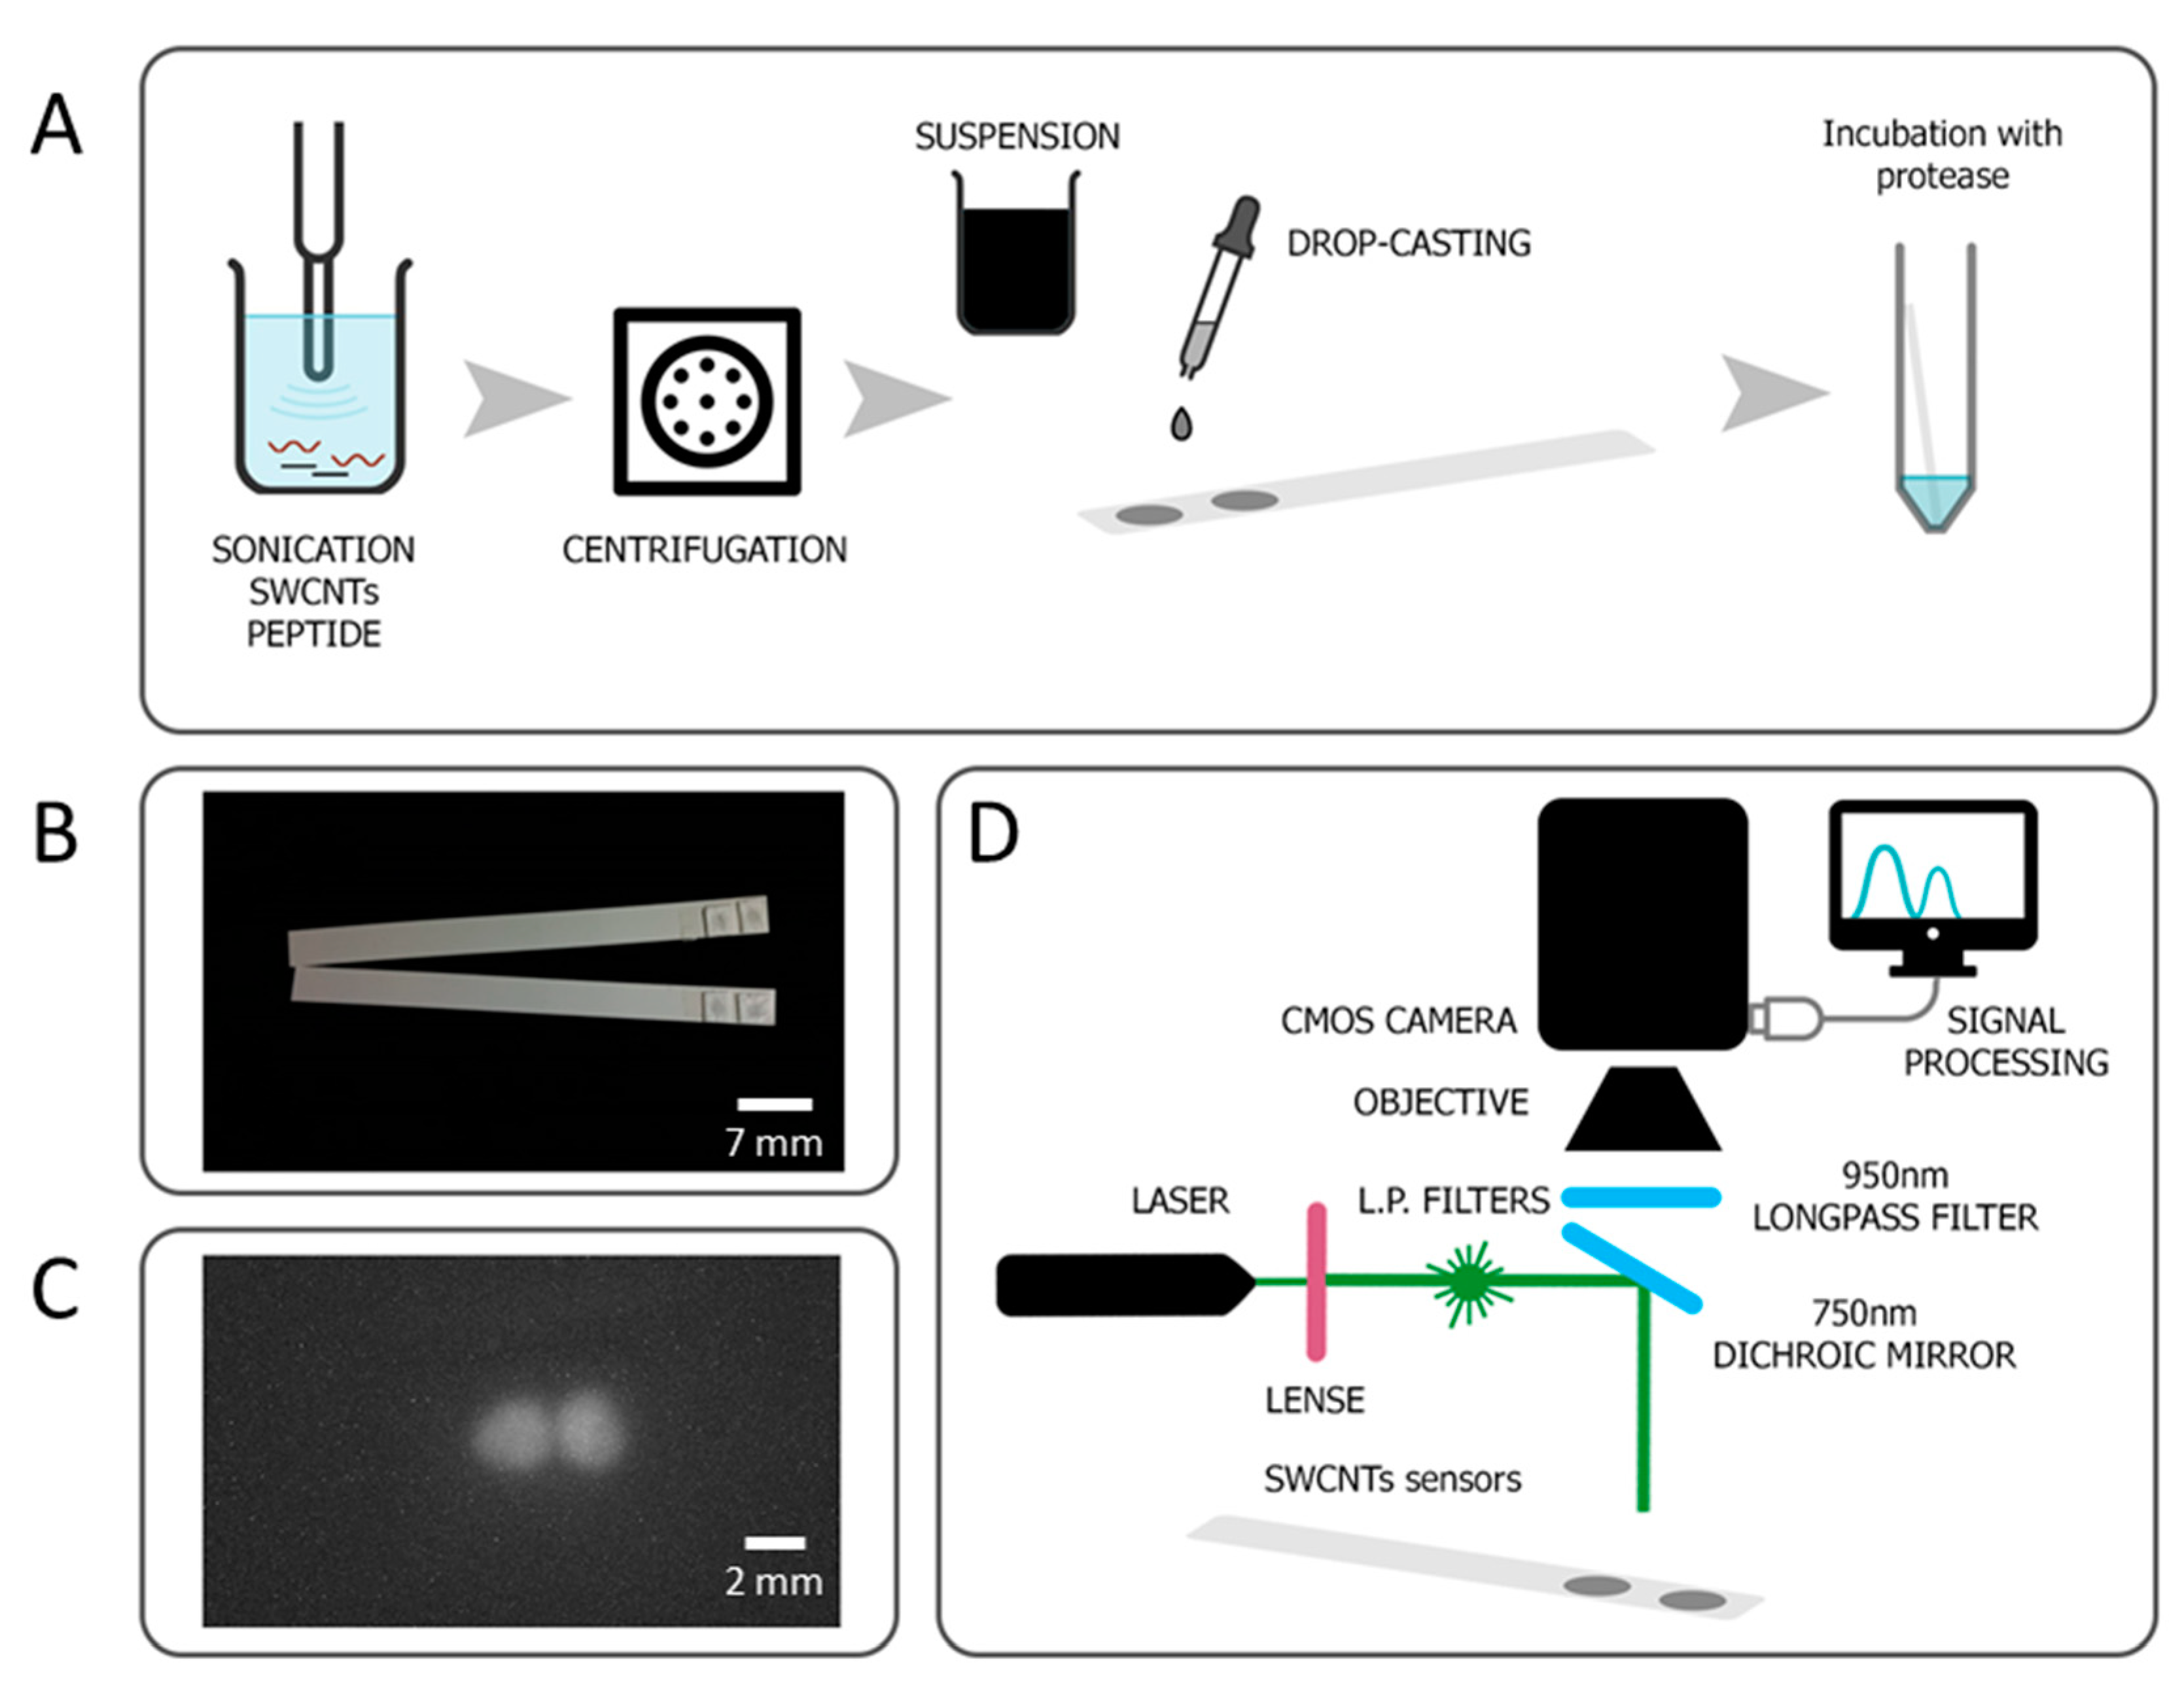
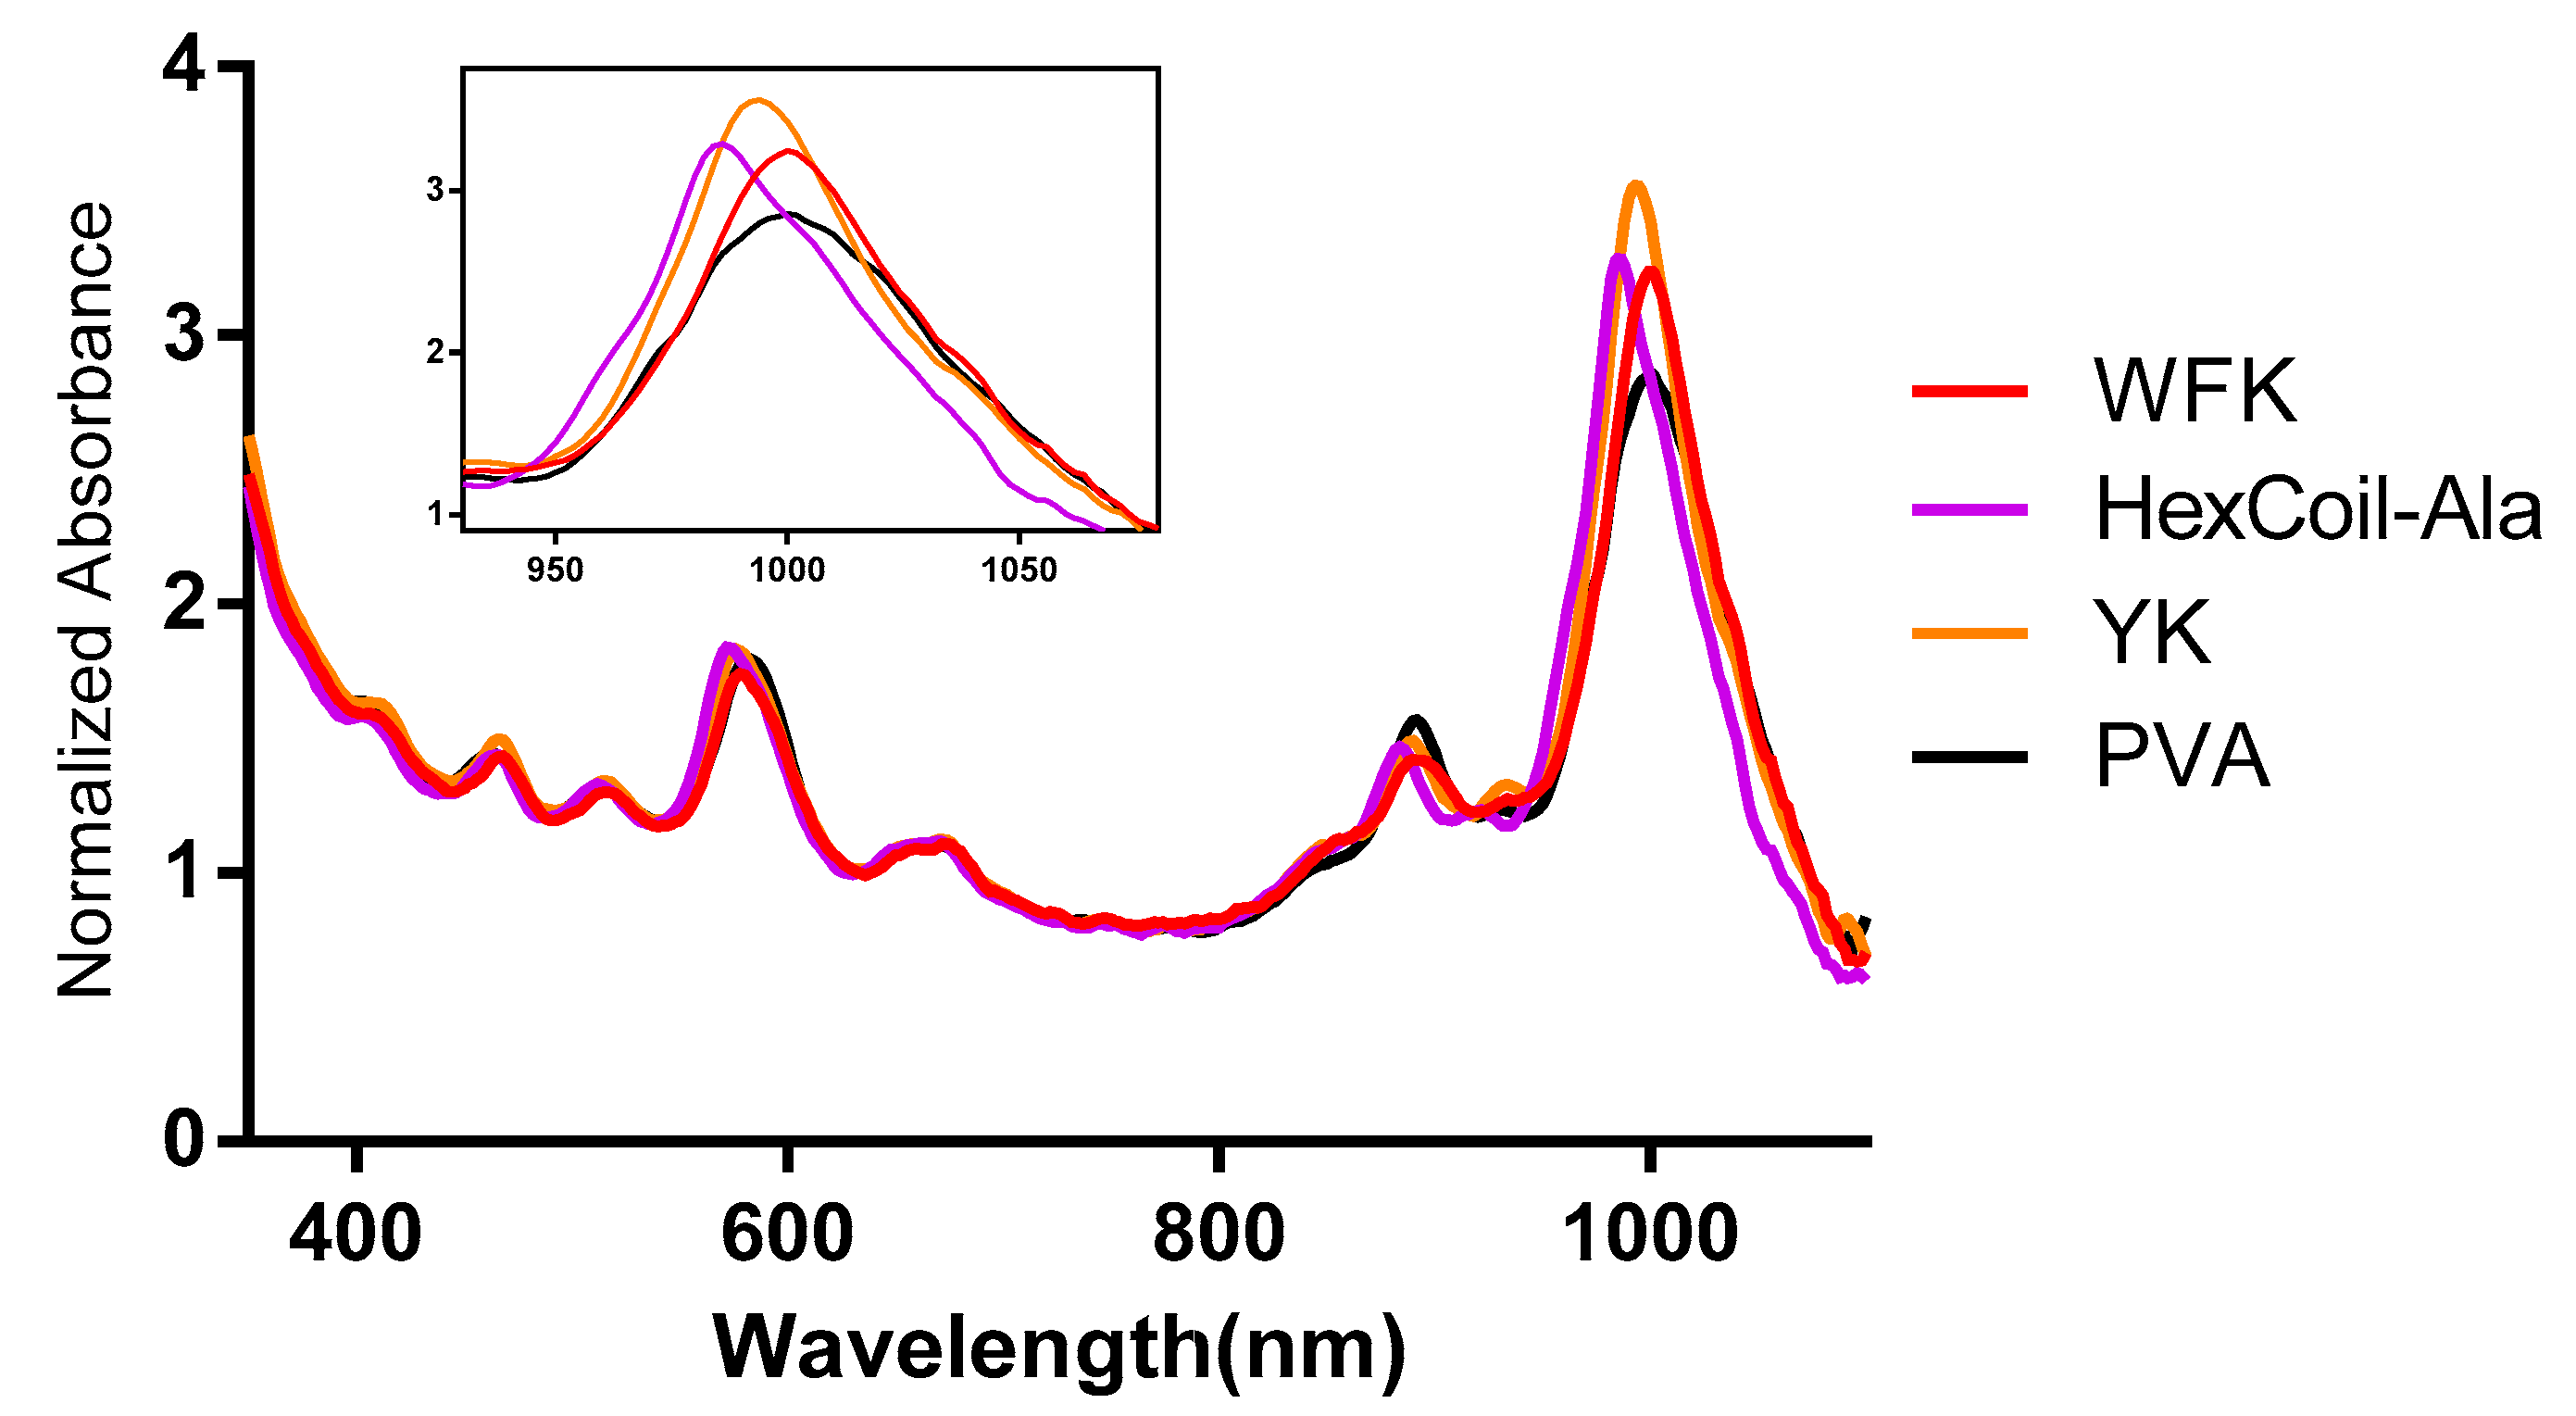
2.3. Preparation of Peptide-Encapsulated SWCNTs

Three peptide/SWCNTs and poly(vinyl alcohol)/SWCNTs (PVA/SWCNTs) suspensions were prepared using a protocol published elsewhere, with minor modifications [33]. Briefly, individual peptides and SWCNTs were mixed (1:1 mass ratio) in distilled water (DW) using a one-eighth-inch probe-tip sonicator, at 10 W, for 20 min. For the suspension of SWCNTs with PVA, SWCNTs were first dispersed in sodium cholate (SC), by sonicating SWCNTs in a 2 w/v% SC suspension at 10 W, for 1 h. The resulting solution was centrifuged twice for 40 min at 16,000× g, and the pellet was removed each time. PVA was added to a final concentration of 2%. The resulting suspension was dialyzed against DW for 24 h.
The SWCNTs’ concentration was calculated based on its absorbance at 632 nm, using the Beer-Lambert law with the extinction coefficient, ε632 = 0.036 L mg−1 cm−1 [75].

2.4. Sensor Preparation

SWCNTs/peptide or SWCNTs/PVA suspensions (25 mg/L) were drop-casted (0.5 μL) on Whatman GF/C Glass Fiber paper (TAMAR), which was then dried at 37 °C, for 25 min. Drying was performed on an aluminum block in a closed oven with ventilation. The paper was cut into cubes around the sensors, and two repeating sensors were placed side by side on the dipstick with the help of double-sided tape (Figure 1A,B).

2.5. Protease Sensing

A custom setup was constructed for SWCNTs’ PL measurements (Figure 1D). PL emission of the peptide-encapsulated SWCNTs sensors was recorded using a XIMEA CMOS camera with 900 nm long-pass filters (Thorlabs), and a 532 nm laser (100 mW output, PGL-V-H-532 CNI) was used for excitation. Figure 1C displays photoluminescence of the sensors fixed on a dipstick, as captured with a CMOS camera. The PL intensity was measured before and after incubation with trypsin using Fiji ImageJ distribution [76]. 3D PL profiles were analyzed using the Interactive 3D Surface Plot plugin [77].
Informed written consent was obtained from a healthy volunteer who provided urine specimens. Urine samples were diluted in phosphate-buffered saline (PBS) 1:12 before the assay. The final PBS concentration was 1×, pH 7.5.
Trypsin (Biological Industries, Beit HaEmek, Israel) 1 mg/mL stock was prepared from powder and diluted to 1, 5, or 20 μg/mL immediately before the assay. In the protease inhibitor assay, Soybean Trypsin Inhibitor (SBTI) 50× (Biological Industries, Beit HaEmek, Israel) was diluted 1:50 and added together with trypsin. Each dipstick was placed in a separate 15 mL tube containing a 3 mL sample, inside an incubator, under 37 °C. To observe kinetics, the dipstick was taken out, analyzed, and placed back into the incubator. To evaluate the effect of urea (U5378, SIGMA) on the sensors PL, 10 or 20 mg/mL urea was added to the PBS and incubated for 3 h.
Statistical analysis was performed using GraphPad Prism version 6 (GraphPad Software, Inc., San Diego, CA, USA) for Windows.

3. Experimental Results and Discussion

SWCNTs are extremely hydrophobic; thus, while they can be dispersed in organic solvents [78], they form insoluble aggregates in water. Aggregates diminish fluorescence [79] and do not enable interaction with proteins under physiological conditions. Covalent modification of SWCNTs may prevent aggregation but diminishes their optical properties [80]; thus, noncovalent conjugation is essential to create effective dispersion while preserving optical properties. Here, HexCoil-Ala [69], YK, and WFK peptides were used for noncovalent modification of SWCNTs (Figure 2). A PVA polymer was used as a control. YK and WFK peptides are rich in aromatic amino acids, which have been shown to exhibit remarkable affinity to SWCNTs [80]. Hydrophobic forces between the α-helical peptides and the sidewall of SWCNTs also enable their dispersion in water, and a number of possible peptide–SWCNT conformations were proposed [70,81]. Thus, a HexCoil-Ala was chosen as a feasible alternative to aromatic peptides.
YK and WFK were synthesized as a random mixture of peptides. The previously reported technique [7,8,82] involves the incorporation of a mixture of amino acids in a defined proportion at each coupling step. This approach leads to a vast number of different peptides, a mixture that contains up to 220 (for two types of amino acids) or 320 (for three types of amino acids), 20 mer-long sequences. This technique is expected to enhance the chances of a sensitive and robust biosensor response by increasing the variability of the peptides. Moreover, random peptide mixtures are easier and cheaper to synthesize than specific sequence peptides, while still enabling reproducibility [73]. All three peptides have trypsin restriction sites, while PVA served as a negative control that was not cleaved by trypsin. All four molecules encapsulated SWCNTs successfully and created a stable dispersion in DW. The UV–VIS absorption spectrum (Figure 3) showed peaks at a wavelength of ~570 and ~987 nm that indicates excitonic optical absorption bands S22 and S11, respectively [83], pointing out semiconducting (6,5) chirality-enriched SWCNTs. The slight differences in the absorption spectrum between different modifications could indicate dispersion quality.
One of the most useful methods used to transfer a laboratory-scale assay to a user-friendly kit, suitable for long-term storage, involves drying and fixing the sensing element to a paper, with well-known examples including home pregnancy tests and pH strips. Moreover, fixing sensors on the surface potentially prevents aggregation of SWCNTs upon reaction with buffer, trypsin, or urine. Therefore, SWCNTs suspensions were drop-cast on Whatman paper, dried in the oven at 37 °C, and then fixed on plastic strips (Figure 1A,B).
A custom optical setup was constructed; a schematic representation can be found in Figure 1D. As SWCNTs emit PL in the NIR region, an InGaAs-based detector is usually used for signal detection. Apart from the high costs of such devices, the InGaAs camera also has a lower resolution than silicon-based detectors. Choosing the (6,5) chirality of the SWCNTs, which has an emission peak at around 1000 nm, enabled use of a camera equipped with CMOS detector [32], which both boosts resolution and reduces costs. For (6,5) SWCNT excitation, we used a 532 nm laser [84]. Emission light was passed through a 900 nm long-pass filter and was captured by a 1.3 MP CMOS detector.
Next, we tested the potential of the developed sensors to detect trypsin activity. All three peptides contain trypsin restriction sites; thus, a PL change was expected upon trypsin digestion. SWCNTs/PVA served as a negative control. The random YK peptide has nine trypsin restriction sites on average, WFK has six on average, and HexCoil-Ala peptide has three restriction sites (Defined) (Figure 4A–C). However, upon incubation with 30 μg/mL trypsin, only the HexCoil-Ala sensor showed a significant change in PL, while the two other peptide-encapsulated SWCNTs sensors together with the negative control (PVA/SWCNTs) showed no response (Figure 5A). A possible explanation for the lack of response of YK and WFK sensors despite the existence of the restriction sites is schematically illustrated in Figure 4D. While WFK and YK peptides are rich in amino acids with aromatic residues, the HelixCoil-Ala has none. Aromatic amino acids readily attach to the SWCNTs’ sidewall [80,85]. As they were randomly distributed throughout the peptide chain, aromatic amino acids may have induced a much flatter conformation close to the SWCNTs’ surface [86,87] as compared to the helix peptide. In contrast, a helical peptide likely preserves its 3D structure on the sidewalls of SWCNTs [69,70,81] and is thus much farther from the SWCNTs’ sidewall, enabling protease binding and peptide restriction. The change in peptide upon restriction leads to modulation of PL.
In order to verify that the PL change was caused by peptide restriction and not because of protein absorption on the SWCNTs’ surface, we tested an addition of the BSA protein alone and of the trypsin inhibitor together with trypsin. The addition of BSA or trypsin inhibitor (SBTI) alone led to no PL change in the HexCoil-Ala sensor, while the addition of SBTI together with trypsin fully prevented the drop in PL during a 3 h incubation (Figure 5B).
The absorption spectrum of SWCNTs depends, among other parameters, on their chirality [88] and on the encapsulating molecules [36]. The UV–Vis absorption spectrum of HexCoil-Ala/SWCNTs sensors following incubation with trypsin (Figure 6) indicated a change in the 590, 885, and 990 nm peaks. These data, together with PL decrease, clearly demonstrate changes in the wrapping molecule upon exposure to trypsin.
Next, the sensitivity and kinetics of the sensor response to trypsin were evaluated (Figure 7A–C and Table 1), by measuring the PL every hour over the 3 h incubation period with 1, 5, or 20 µg/mL trypsin. After the first hour of incubation, 5 and 20 µg/mL trypsin induced a significant drop in HexCoil-Ala/SWCNTs’ PL, while 1 µg/mL trypsin did not cause a decrease in PL. However, after the second hour of incubation, 1 µg/mL trypsin also induced a significant decrease in PL signals, which further declined after 3 h of incubation. The 3D photoluminescence intensity plot (Figure 7G–I) presents PL distribution across the sensor geometry and displays a significant drop in PL in the middle of the dot, after incubation with trypsin. These results clearly show the dependence of SWCNTs’ PL both on the amount of trypsin and on the incubation time. Moreover, the intensity of PL changes correlated with trypsin concentrations, suggesting the proposed dipstick as a quantitative biosensor of trypsin activity under the tested conditions.
To examine the option of detecting trypsin activity in a more complex environment, the same assay was performed in urine samples. During acute pancreatitis, trypsin concentration in urine could reach up to 84.4 µg/mL. We added different concentrations of trypsin (12, 70, and 1 mg/mL) to human urine. The samples were diluted 1:12 (8.3% v/v) in PBS before the assay to final trypsin concentrations of 1, 5, and 20 µg/mL, respectively. Similar to the tests with pure trypsin samples, the 1 µg/mL trypsin added to urine led to a significant decline in SWCNTs’ PL only after 2 h, while the higher concentrations of protease already induced PL changes during the first hour of the assay (Figure 7D–F). Overall, however, the relative decline in PL after incubation with trypsin was weaker in the presence of urine as compared to tests performed in PBS. Moreover, the absolute PL intensity was influenced by the concentration of the urine added to the reaction (Figure 8A). In the presence of 8.3% urine alone, without trypsin, the PL intensity declined by 33%, while the addition of 33% urine (1:3) caused almost a 50% drop in PL. One of the main components of urine is urea, with human urine containing about 9.3 g/L urea [89]. However, even at higher urea concentrations of 10 and 20 g/L, no significant effect on PL was noted (Figure 8B). Thus, some other urine component or components seemingly impact the PL of SWCNTs as well as reduce biosensor response to trypsin.

4. Conclusions

In summary, this work presented a disposable, paper-based NIR optical biosensor based on peptide-encapsulated (6,5) SWCNTs for trypsin activity detection. The biosensor response was recorded using a CMOS camera, thus potentially reducing the cost of the final device. Three different peptides were tested for SWCNTs’ modification, i.e., WFK, YK, and HexCoil-Ala. While all three peptides effectively dispersed SWCNTs in an aqueous solution, only HexCoil-Ala was responsive to trypsin. The developed biosensor was able to detect activity of 1–20 μg/mL trypsin after a 2 h incubation at 37 °C. The proposed biosensor also detected different concentrations of active trypsin in urine, a complex biological liquid with concentrations relative to acute pancreatitis. Although the urine affected both the baseline PL of SWCNTs and the extent of the fluorescence response, we have demonstrated that our biosensor can detect trypsin and differentiate between trypsin concentrations. Recent studies have reported the development of trypsin biosensors with a limit of detection of 8.6 ng/mL using a quartz crystal microbalance (QCM) [59] and 60 ng/mL using interferometric reflectance spectroscopy (IRS) [58] under the optimum conditions. Although the minimal tested trypsin concentration in this work was 1 μg/mL, we assume that after further careful optimization, the sensitivity could be significantly enhanced. For a single sensor, we used as little as 12.5 ng of SWCNTs, making this assay very cost-effective. Moreover, here, we present a biosensor based on a single-use disposable paper dipstick and an affordable CMOS camera. On the other hand, in most cases, both QCM and IRS sensors are based on expensive substrates and complicated equipment. In addition, our paper-based optical biosensor enables remote measurements, thus significantly reducing the risks for equipment contamination. The presented technique may be applied in the development of optical biosensors designed to detect other proteases in complex environments, e.g., urine, blood, or saliva.

Author Contributions

Conceptualization, V.S., O.S., and Z.H.; methodology, V.S., O.S., Z.H., G.B., and Y.P.; formal analysis, V.S.; investigation, V.S.; resources, Z.H., G.B., and Y.P.; writing—original draft preparation, V.S.; writing—review and editing, V.S., O.S., Z.H., G.B., and Y.P.; visualization, V.S.; supervision, Z.H. and O.S.; project administration, O.S.; funding acquisition, O.S. All authors have read and agreed to the published version of the manuscript.

Funding

This research received no external funding.

Conflicts of Interest

The authors declare no conflict of interest.

References

  1. Rawlings, N.D. Protease families, evolution and mechanism of action. In Proteases: Structure and Function; Springer: Vienna, Austria, 2013; pp. 1–36. ISBN 9783709108857. [Google Scholar]
  2. Koblinski, J.E.; Ahram, M.; Sloane, B.F. Unraveling the role of proteases in cancer. Clin. Chim. Acta 2000, 291, 113–135. [Google Scholar] [CrossRef]
  3. Huang, H. Matrix Metalloproteinase-9 (MMP-9) as a Cancer Biomarker and MMP-9 Biosensors: Recent Advances. Sensors 2018, 18, 3249. [Google Scholar] [CrossRef] [PubMed] [Green Version]
  4. Chen, J.; Zhao, G.C.; Wei, Y.; Feng, D. A signal-on photoelectrochemical biosensor for detecting cancer marker type IV collagenase by coupling enzyme cleavage with exciton energy transfer biosensing. Anal. Methods 2019, 11, 5880–5885. [Google Scholar] [CrossRef]
  5. Choi, J.W.; Lee, H.; Lee, G.; Kim, Y.R.; Ahn, M.J.; Park, H.J.; Eom, K.; Kwon, T. Blood droplet-based cancer diagnosis via proteolytic activity measurement in cancer progression. Theranostics 2017, 7, 2878–2887. [Google Scholar] [CrossRef] [Green Version]
  6. Ryom, L.; Lundgren, J.D.; El-Sadr, W.; Reiss, P.; Kirk, O.; Law, M.; Phillips, A.; Weber, R.; Fontas, E.; d’Arminio Monforte, A.; et al. Cardiovascular disease and use of contemporary protease inhibitors: The D:A:D international prospective multicohort study. Lancet HIV 2018, 5, e291–e300. [Google Scholar] [CrossRef] [Green Version]
  7. Liu, C.-L.; Guo, J.; Zhang, X.; Sukhova, G.K.; Libby, P.; Shi, G.-P. Cysteine protease cathepsins in cardiovascular disease: From basic research to clinical trials. Nat. Rev. Cardiol. 2018, 15, 351. [Google Scholar] [CrossRef]
  8. Zhan, X.; Wan, J.; Zhang, G.; Song, L.; Gui, F.; Zhang, Y.; Li, Y.; Guo, J.; Dawra, R.K.; Saluja, A.K.; et al. Elevated intracellular trypsin exacerbates acute pancreatitis and chronic pancreatitis in mice. Am. J. Physiol. Gastrointest. Liver Physiol. 2019, 316, G816–G825. [Google Scholar] [CrossRef]
  9. Gui, F.; Zhang, Y.; Wan, J.; Zhan, X.; Yao, Y.; Li, Y.; Haddock, A.N.; Shi, J.; Guo, J.; Chen, J.; et al. Trypsin activity governs increased susceptibility to pancreatitis in mice expressing human PRSS1R122H. J. Clin. Investig. 2020, 130, 189–202. [Google Scholar] [CrossRef]
  10. Havale, S.H.; Pal, M. Medicinal chemistry approaches to the inhibition of dipeptidyl peptidase-4 for the treatment of type 2 diabetes. Bioorganic Med. Chem. 2009, 17, 1783–1802. [Google Scholar] [CrossRef]
  11. Haim, H.; Salas, I.; Sodroski, J. Proteolytic Processing of the Human Immunodeficiency Virus Envelope Glycoprotein Precursor Decreases Conformational Flexibility. J. Virol. 2013, 87, 1884–1889. [Google Scholar] [CrossRef] [Green Version]
  12. Zhang, L.; Lin, D.; Sun, X.; Curth, U.; Drosten, C.; Sauerhering, L.; Becker, S.; Rox, K.; Hilgenfeld, R. Crystal structure of SARS-CoV-2 main protease provides a basis for design of improved a-ketoamide inhibitors. Science 2020, 368, 409–412. [Google Scholar] [CrossRef] [Green Version]
  13. Suleman, L. Extracellular Bacterial Proteases in Chronic Wounds: A Potential Therapeutic Target? Adv. Wound Care 2016, 5, 455–463. [Google Scholar] [CrossRef] [Green Version]
  14. Marshall, N.C.; Finlay, B.B.; Overall, C.M. Sharpening host defenses during infection: Proteases cut to the chase. Mol. Cell. Proteom. 2017, 16, S161–S171. [Google Scholar] [CrossRef] [PubMed] [Green Version]
  15. Agbowuro, A.A.; Huston, W.M.; Gamble, A.B.; Tyndall, J.D.A. Proteases and protease inhibitors in infectious diseases. Med. Res. Rev. 2018, 38, 1295–1331. [Google Scholar] [CrossRef]
  16. Ilea, A.; Andrei, V.; Feurdean, C.N.; Bǎbtan, A.M.; Petrescu, N.B.; Câmpian, R.S.; Bosca, A.B.; Ciui, B.; Tertis, M.; Sǎndulescu, R.; et al. Saliva, a magic biofluid available for multilevel assessment and a mirror of general health-a systematic review. Biosensors 2019, 9, 27. [Google Scholar] [CrossRef] [Green Version]
  17. Diamandis, E.P.; Yousef, G.M.; Soosaipillai, A.R.; Bunting, P. Human kallikrein 6 (zyme/protease M/neurosin): A new serum biomarker of ovarian carcinoma. Clin. Biochem. 2000, 33, 579–583. [Google Scholar] [CrossRef]
  18. Bastos, P.; Magalhães, S.; Santos, L.L.; Ferreira, R.; Vitorino, R. The role of urinary proteases in bladder cancer. In Pathophysiological Aspects of Proteases; Springer: Singapore, 2017; pp. 89–118. ISBN 9789811061417. [Google Scholar]
  19. Xiao, X.; Zou, L.; Sun, W. Human urine proteome: A powerful source for clinical research. In Urine: Promising Biomarker Source for Early Disease Detection; Springer: Singapore, 2019; pp. 9–24. ISBN 9789811391095. [Google Scholar]
  20. Chon, C.H.; Li, D. Biosensors Using Magnetics. In Encyclopedia of Microfluidics and Nanofluidics; Springer: Boston, MA, USA, 2008; pp. 119–120. [Google Scholar]
  21. Khansili, N.; Rattu, G.; Krishna, P.M. Label-free optical biosensors for food and biological sensor applications. Sens. Actuators B Chem. 2018, 265, 35–49. [Google Scholar] [CrossRef]
  22. Soni, A.; Surana, R.K.; Jha, S.K. Smartphone based optical biosensor for the detection of urea in saliva. Sens. Actuators B Chem. 2018, 269, 346–353. [Google Scholar] [CrossRef]
  23. Yoo, S.M.; Lee, S.Y. Optical Biosensors for the Detection of Pathogenic Microorganisms. Trends Biotechnol. 2016, 34, 7–25. [Google Scholar] [CrossRef]
  24. Cao, J.; Zhu, B.; Zheng, K.; He, S.; Meng, L.; Song, J.; Yang, H. Recent Progress in NIR-II Contrast Agent for Biological Imaging. Front. Bioeng. Biotechnol. 2020, 7, 487. [Google Scholar] [CrossRef] [PubMed] [Green Version]
  25. Kruss, S.; Hilmer, A.J.; Zhang, J.; Reuel, N.F.; Mu, B.; Strano, M.S. Carbon nanotubes as optical biomedical sensors. Adv. Drug Deliv. Rev. 2013, 65, 1933–1950. [Google Scholar] [CrossRef] [PubMed]
  26. Jain, A.; Homayoun, A.; Bannister, C.W.; Yum, K. Single-walled carbon nanotubes as near-infrared optical biosensors for life sciences and biomedicine. Biotechnol. J. 2015, 10, 447–459. [Google Scholar] [CrossRef] [PubMed]
  27. Li, C.; Shi, G. Carbon nanotube-based fluorescence sensors. J. Photochem. Photobiol. C Photochem. Rev. 2014, 19, 20–34. [Google Scholar] [CrossRef]
  28. Hendler-Neumark, A.; Bisker, G. Fluorescent single-walled carbon nanotubes for protein detection. Sens. Switz. 2019, 19, 5403. [Google Scholar] [CrossRef] [PubMed] [Green Version]
  29. Yanagi, K. Differentiation of Carbon Nanotubes with Different Chirality. In Carbon Nanotubes and Graphene: Edition 2; Elsevier Inc.: Amsterdam, The Netherlands, 2014; pp. 19–38. ISBN 9780080982687. [Google Scholar]
  30. Chen, Y.; Wei, L.; Wang, B.; Lim, S.; Ciuparu, D.; Zheng, M.; Chen, J.; Zoican, C.; Yang, Y.; Haller, G.L.; et al. Low-Defect, Purified, Narrowly-Dispersed Single-Walled Carbon Nanotubes Grown from Cobalt-Incorporated MCM-41. ACS Nano 2007, 1, 327–336. [Google Scholar] [CrossRef]
  31. Iverson, N.M.; Bisker, G.; Farias, E.; Ivanov, V.; Ahn, J.; Wogan, G.N.; Strano, M.S. Quantitative tissue spectroscopy of near infrared fluorescent nanosensor implants. J. Biomed. Nanotechnol. 2016, 12, 1035–1047. [Google Scholar] [CrossRef] [Green Version]
  32. Wong, M.H.; Giraldo, J.P.; Kwak, S.Y.; Koman, V.B.; Sinclair, R.; Lew, T.T.S.; Bisker, G.; Liu, P.; Strano, M.S. Nitroaromatic detection and infrared communication from wild-type plants using plant nanobionics. Nat. Mater. 2017, 16, 264–272. [Google Scholar] [CrossRef]
  33. Heller, D.A.; Pratt, G.W.; Zhang, J.; Nair, N.; Hansborough, A.J.; Boghossian, A.A.; Reuel, N.F.; Barone, P.W.; Strano, M.S. Peptide secondary structure modulates single-walled carbon nanotube fluorescence as a chaperone sensor for nitroaromatics. Proc. Natl. Acad. Sci. USA 2011, 108, 8544–8549. [Google Scholar] [CrossRef] [Green Version]
  34. Zheng, M.; Jagota, A.; Semke, E.D.; Diner, B.A.; McLean, R.S.; Lustig, S.R.; Richardson, R.E.; Tassi, N.G. DNA-assisted dispersion and separation of carbon nanotubes. Nat. Mater. 2003, 2, 338–342. [Google Scholar] [CrossRef]
  35. Landry, M.P.; Vuković, L.; Kruss, S.; Bisker, G.; Landry, A.M.; Islam, S.; Jain, R.; Schulten, K.; Strano, M.S. Comparative Dynamics and Sequence Dependence of DNA and RNA Binding to Single Walled Carbon Nanotubes. J. Phys. Chem. C 2015, 119, 10048–10058. [Google Scholar] [CrossRef] [Green Version]
  36. Haggenmueller, R.; Rahatekar, S.S.; Fagan, J.A.; Chun, J.; Becker, M.L.; Naik, R.R.; Krauss, T.; Carlson, L.; Kadla, J.F.; Trulove, P.C.; et al. Comparison of the quality of aqueous dispersions of single wall carbon nanotubes using surfactants and biomolecules. Langmuir 2008, 24, 5070–5078. [Google Scholar] [CrossRef]
  37. Cosnier, S.; Ionescu, R.E.; Holzinger, M. Aqueous dispersions of SWCNTs using pyrrolic surfactants for the electro-generation of homogeneous nanotube composites. Application to the design of an amperometric biosensor. J. Mater. Chem. 2008, 18, 5129–5133. [Google Scholar] [CrossRef]
  38. Zhang, J.; Boghossian, A.A.; Barone, P.W.; Rwei, A.; Kim, J.H.; Lin, D.; Heller, D.A.; Hilmer, A.J.; Nair, N.; Reuel, N.F.; et al. Single molecule detection of nitric oxide enabled by d(AT)15 DNA adsorbed to near infrared fluorescent single-walled carbon nanotubes. J. Am. Chem. Soc. 2011, 133, 567–581. [Google Scholar] [CrossRef]
  39. Bala Sekhar, D.; Taube, W.R.; Kumar, A. Electrical Characteristics of SWCNT Chemiresistor; Springer: Cham, Switzerland, 2014; pp. 569–571. [Google Scholar]
  40. Wu, H.; Nißler, R.; Morris, V.; Herrmann, N.; Hu, P.; Jeon, S.J.; Kruss, S.; Giraldo, J.P. Monitoring Plant Health with Near-Infrared Fluorescent H2O2 Nanosensors. Nano Lett. 2020, 20, 2432–2442. [Google Scholar] [CrossRef]
  41. Bisker, G.; Bakh, N.A.; Lee, M.A.; Ahn, J.; Park, M.; O’Connell, E.B.; Iverson, N.M.; Strano, M.S. Insulin Detection Using a Corona Phase Molecular Recognition Site on Single-Walled Carbon Nanotubes. ACS Sens. 2018, 3, 367–377. [Google Scholar] [CrossRef]
  42. Nelson, J.T.; Kim, S.; Reuel, N.F.; Salem, D.P.; Bisker, G.; Landry, M.P.; Kruss, S.; Barone, P.W.; Kwak, S.; Strano, M.S. Mechanism of Immobilized Protein A Binding to Immunoglobulin G on Nanosensor Array Surfaces. Anal. Chem. 2015, 87, 8186–8193. [Google Scholar] [CrossRef] [Green Version]
  43. Bisker, G.; Dong, J.; Park, H.D.; Iverson, N.M.; Ahn, J.; Nelson, J.T.; Landry, M.P.; Kruss, S.; Strano, M.S. Protein-targeted corona phase molecular recognition. Nat. Commun. 2016, 7, 1–14. [Google Scholar] [CrossRef] [Green Version]
  44. Sobhan, A.; Oh, J.H.; Park, M.K.; Kim, S.W.; Park, C.; Lee, J. Single walled carbon nanotube based biosensor for detection of peanut allergy-inducing protein ara h1. Korean J. Chem. Eng. 2018, 35, 172–178. [Google Scholar] [CrossRef]
  45. Yamada, K.; Kim, C.-T.; Kim, J.-H.; Chung, J.-H.; Lee, H.G.; Jun, S. Single Walled Carbon Nanotube-Based Junction Biosensor for Detection of Escherichia coli. PLoS ONE 2014, 9, e105767. [Google Scholar] [CrossRef] [Green Version]
  46. Yoo, S.M.; Baek, Y.K.; Shin, S.; Kim, J.H.; Jung, H.T.; Choi, Y.K.; Lee, S.Y. Single walled carbon nanotube-based electrical biosensor for the label-free detection of pathogenic bacteria. J. Nanosci. Nanotechnol. 2016, 16, 6520–6525. [Google Scholar] [CrossRef]
  47. Forzani, E.S.; Li, X.; Zhang, P.; Tao, N.; Zhang, R.; Amlani, I.; Tsui, R.; Nagahara, L.A. Tuning the Chemical Selectivity of SWNT-FETs for Detection of Heavy-Metal Ions. Small 2006, 2, 1283–1291. [Google Scholar] [CrossRef] [PubMed]
  48. Clendenin, J.; Kim, J.W.; Tung, S. An aligned carbon nanotube biosensor for DNA detection. In Proceedings of the 2nd IEEE International Conference on Nano/Micro Engineered and Molecular Systems, Bangkok, Thailand, 16–19 January 2007; pp. 1028–1033. [Google Scholar]
  49. Weizmann, Y.; Chenoweth, D.M.; Swager, T.M. DNA-CNT nanowire networks for DNA detection. J. Am. Chem. Soc. 2011, 133, 3238–3241. [Google Scholar] [CrossRef] [PubMed] [Green Version]
  50. Harvey, J.D.; Baker, H.A.; Ortiz, M.V.; Kentsis, A.; Heller, D.A. HIV Detection via a Carbon Nanotube RNA Sensor. ACS Sens. 2019, 4, 1236–1244. [Google Scholar] [CrossRef] [PubMed]
  51. KAWASAKI, H.; YOSHIMURA, K.; HAMAGUCHI, K.; ARAKAWA, R. Trypsin-Stabilized Fluorescent Gold Nanocluster for Sensitive and Selective Hg2+ Detection. Anal. Sci. 2011, 27, 591. [Google Scholar] [CrossRef] [Green Version]
  52. Olsen, J.V.; Ong, S.E.; Mann, M. Trypsin cleaves exclusively C-terminal to arginine and lysine residues. Mol. Cell. Proteom. 2004, 3, 608–614. [Google Scholar] [CrossRef] [Green Version]
  53. Zhu, J.; Miao, X.R.; Tao, K.M.; Zhu, H.; Liu, Z.Y.; Yu, D.W.; Chen, Q.B.; Qiu, H.B.; Lu, Z.J. Trypsin-protease activated receptor-2 signaling contributes to pancreatic cancer pain. Oncotarget 2017, 8, 61810–61823. [Google Scholar] [CrossRef] [Green Version]
  54. Hegyi, E.; Sahin-Tóth, M. Genetic Risk in Chronic Pancreatitis: The Trypsin-Dependent Pathway. Dig. Dis. Sci. 2017, 62, 1692–1701. [Google Scholar] [CrossRef]
  55. Hirota, M.; Ohmuraya, M.; Hashimoto, D.; Suyama, K.; Sugita, H.; Ogawa, M. Roles of Autophagy and Pancreatic Secretory Trypsin Inhibitor in Trypsinogen Activation in Acute Pancreatitis. Pancreas 2020, 49, 493–497. [Google Scholar] [CrossRef]
  56. Artigas, J.M.G.; Faure, M.R.A.; Garcia, M.E.; Gimeno, A.M.B. Serum trypsin levels in acute pancreatic and non-pancreatic abdominal conditions. Postgrad. Med. J. 1981, 57, 219–222. [Google Scholar] [CrossRef] [Green Version]
  57. Xia, T.; Ma, Q.; Hu, T.; Su, X. A novel magnetic/photoluminescence bifunctional nanohybrid for the determination of trypsin. Talanta 2017, 170, 286–290. [Google Scholar] [CrossRef]
  58. Amouzadeh Tabrizi, M.; Ferré-Borrull, J.; Marsal, L.F. Remote biosensor for the determination of trypsin by using nanoporous anodic alumina as a three-dimensional nanostructured material. Sci. Rep. 2020, 10, 1–10. [Google Scholar] [CrossRef] [PubMed]
  59. Dong, Z.M.; Cheng, L.; Zhang, P.; Zhao, G.C. Label-free analytical performances of a peptide-based QCM biosensor for trypsin. Analyst 2020, 145, 3329–3338. [Google Scholar] [CrossRef] [PubMed]
  60. Adem, S.; Jain, S.; Sveiven, M.; Zhou, X.; O’Donoghue, A.J.; Hall, D.A. Giant magnetoresistive biosensors for real-time quantitative detection of protease activity. Sci. Rep. 2020, 10, 1–10. [Google Scholar] [CrossRef] [PubMed]
  61. Sabbagh, B.; Costina, V.; Buchheidt, D.; Reinwald, M.; Neumaier, M.; Findeisen, P. Functional protease profiling for laboratory based diagnosis of invasive aspergillosis. Int. J. Oncol. 2015, 47, 143–150. [Google Scholar] [CrossRef]
  62. Findeisen, P.; Neumaier, M. Functional protease profiling for diagnosis of malignant disease. Proteom. Clin. Appl. 2012, 6, 60–78. [Google Scholar] [CrossRef] [PubMed]
  63. Ong, I.L.H.; Yang, K.L. Recent developments in protease activity assays and sensors. Analyst 2017, 142, 1867–1881. [Google Scholar] [CrossRef] [Green Version]
  64. Staderini, M.; González-Fernández, E.; Murray, A.F.; Mount, A.R.; Bradley, M. A tripod anchor offers improved robustness of peptide-based electrochemical biosensors. Sens. ActuatorsB Chem. 2018, 274, 662–667. [Google Scholar] [CrossRef]
  65. Ucar, A.; González-Fernández, E.; Staderini, M.; Avlonitis, N.; Murray, A.F.; Bradley, M.; Mount, A.R. Miniaturisation of a peptide-based electrochemical protease activity sensor using platinum microelectrodes. Analyst 2020, 145, 975–982. [Google Scholar] [CrossRef] [Green Version]
  66. Ding, X.; Yang, K.L. Quantitative serine protease assays based on formation of copper(II)-oligopeptide complexes. Analyst 2015, 140, 340–345. [Google Scholar] [CrossRef]
  67. Hu, J.; Liu, F.; Ju, H. Peptide code-on-a-microplate for protease activity analysis via MALDI-TOF mass spectrometric quantitation. Anal. Chem. 2015, 87, 4409–4414. [Google Scholar] [CrossRef]
  68. Cheng, X.; McVey, B.F.P.; Robinson, A.B.; Longatte, G.; O’Mara, P.B.; Tan, V.T.G.; Thordarson, P.; Tilley, R.D.; Gaus, K.; Justin Gooding, J. Protease sensing using nontoxic silicon quantum dots. J. Biomed. Opt. 2017, 22, 087002. [Google Scholar] [CrossRef] [PubMed] [Green Version]
  69. Grigoryan, G.; Kim, Y.; Acharya, R.; Axelrod, K.; Jain, R.M.; Willis, L.; Drndic, M.; Kikkawa, J.M.; DeGrado, W.F. Computational design of virus-like protein assemblies on carbon nanotube surfaces. Science 2011, 332, 1071–1076. [Google Scholar] [CrossRef] [PubMed] [Green Version]
  70. Roxbury, D.; Zhang, S.Q.; Mittal, J.; Degrado, W.F.; Jagota, A. Structural stability and binding strength of a designed peptide-carbon nanotube hybrid. J. Phys. Chem. C 2013, 117, 26255–26261. [Google Scholar] [CrossRef] [Green Version]
  71. Collins, J.M.; Porter, K.A.; Singh, S.K.; Vanier, G.S. High-efficiency solid phase peptide synthesis (HE-SPPS). Org. Lett. 2014, 16, 940–943. [Google Scholar] [CrossRef] [PubMed]
  72. Stern Bauer, T.; Hayouka, Z. Random mixtures of antimicrobial peptides inhibit bacteria associated with pasteurized bovine milk. J. Pept. Sci. 2018, 24, e3088. [Google Scholar] [CrossRef]
  73. Hayouka, Z.; Chakraborty, S.; Liu, R.; Boersma, M.D.; Weisblum, B.; Gellman, S.H. Interplay among Subunit Identity, Subunit Proportion, Chain Length, and Stereochemistry in the Activity Profile of Sequence-Random Peptide Mixtures. J. Am. Chem. Soc. 2013, 135, 11748–11751. [Google Scholar] [CrossRef] [Green Version]
  74. Gasteiger, E.; Hoogland, C.; Gattiker, A.; Duvaud, S.; Wilkins, M.R.; Appel, R.D.; Bairoch, A. Protein Identification and Analysis Tools on the ExPASy Server. In The Proteomics Protocols Handbook; Humana Press: Totowa, NJ, USA, 2005; pp. 571–607. [Google Scholar]
  75. Kruss, S.; Landry, M.P.; Vander Ende, E.; Lima, B.M.A.; Reuel, N.F.; Zhang, J.; Nelson, J.; Mu, B.; Hilmer, A.; Strano, M. Neurotransmitter detection using corona phase molecular recognition on fluorescent single-walled carbon nanotube sensors. J. Am. Chem. Soc. 2014, 136, 713–724. [Google Scholar] [CrossRef] [Green Version]
  76. Schindelin, J.; Arganda-Carreras, I.; Frise, E.; Kaynig, V.; Longair, M.; Pietzsch, T.; Preibisch, S.; Rueden, C.; Saalfeld, S.; Schmid, B.; et al. Fiji: An open-source platform for biological-image analysis. Nat. Methods 2012, 9, 676–682. [Google Scholar] [CrossRef] [Green Version]
  77. Barthel, K.U. 3D-data representation with ImageJ. In Proceedings of the 1st ImageJ User & Developer Conference, CRP Henri Tudor, Luxembourg, 18–19 May 2006. [Google Scholar]
  78. Ausman, K.D.; Piner, R.; Lourie, O.; Ruoff, R.S.; Korobov, M. Organic solvent dispersions of single-walled carbon nanotubes: Toward solutions of pristine nanotubes. J. Phys. Chem. B 2000, 104, 8911–8915. [Google Scholar] [CrossRef]
  79. Battigelli, A.; Ménard-Moyon, C.; Da Ros, T.; Prato, M.; Bianco, A. Endowing carbon nanotubes with biological and biomedical properties by chemical modifications. Adv. Drug Deliv. Rev. 2013, 65, 1899–1920. [Google Scholar] [CrossRef]
  80. Antonucci, A.; Kupis-Rozmysłowicz, J.; Boghossian, A.A. Noncovalent Protein and Peptide Functionalization of Single-Walled Carbon Nanotubes for Biodelivery and Optical Sensing Applications. ACS Appl. Mater. Interfaces 2017, 9, 11321–11331. [Google Scholar] [CrossRef] [PubMed] [Green Version]
  81. Balamurugan, K.; Gopalakrishnan, R.; Raman, S.S.; Subramanian, V. Exploring the changes in the structure of α-helical peptides adsorbed onto a single walled carbon nanotube using classical molecular dynamics simulation. J. Phys. Chem. B 2010, 114, 14048–14058. [Google Scholar] [CrossRef] [PubMed]
  82. Amso, Z.; Hayouka, Z. Antimicrobial random peptide cocktails: A new approach to fight pathogenic bacteria. Chem. Commun. 2019, 55, 2007–2014. [Google Scholar] [CrossRef]
  83. Kuwahara, S.; Kuwahara, Y.; Shinohara, H. Quantitative analysis of isolated single-wall carbon nanotubes with their molar absorbance coefficients. J. Nanomater. 2014, 2014. [Google Scholar] [CrossRef] [Green Version]
  84. Jena, P.V.; Shamay, Y.; Shah, J.; Roxbury, D.; Paknejad, N.; Heller, D.A. Photoluminescent carbon nanotubes interrogate the permeability of multicellular tumor spheroids. Carbon N. Y. 2016, 97, 99–109. [Google Scholar] [CrossRef] [Green Version]
  85. Wang, C.; Li, S.; Zhang, R.; Lin, Z. Adsorption and properties of aromatic amino acids on single-walled carbon nanotubes. Nanoscale 2012, 4, 1146–1153. [Google Scholar] [CrossRef]
  86. Karunwi, O.; Baldwin, C.; Griesheimer, G.; Sarupria, S.; Guiseppi-Elie, A. Molecular dynamics simulations of peptide-swcnt interactions related to enzyme conjugates for biosensors and biofuel cells. Nano Life 2013, 3, 1343007. [Google Scholar] [CrossRef]
  87. Cheng, Y.; Liu, G.R.; Li, Z.R.; Lu, C. Computational analysis of binding free energies between peptides and single-walled carbon nanotubes. Phys. A Stat. Mech. Its Appl. 2006, 367, 293–304. [Google Scholar] [CrossRef]
  88. Pfohl, M.; Tune, D.D.; Graf, A.; Zaumseil, J.; Krupke, R.; Flavel, B.S. Fitting Single-Walled Carbon Nanotube Optical Spectra. ACS Omega 2017, 2, 1163–1171. [Google Scholar] [CrossRef] [Green Version]
  89. Xu, W.; Zhang, H.; Li, G.; Wu, Z. Nickel-cobalt bimetallic anode catalysts for direct urea fuel cell. Sci. Rep. 2014, 4, 1–6. [Google Scholar] [CrossRef]
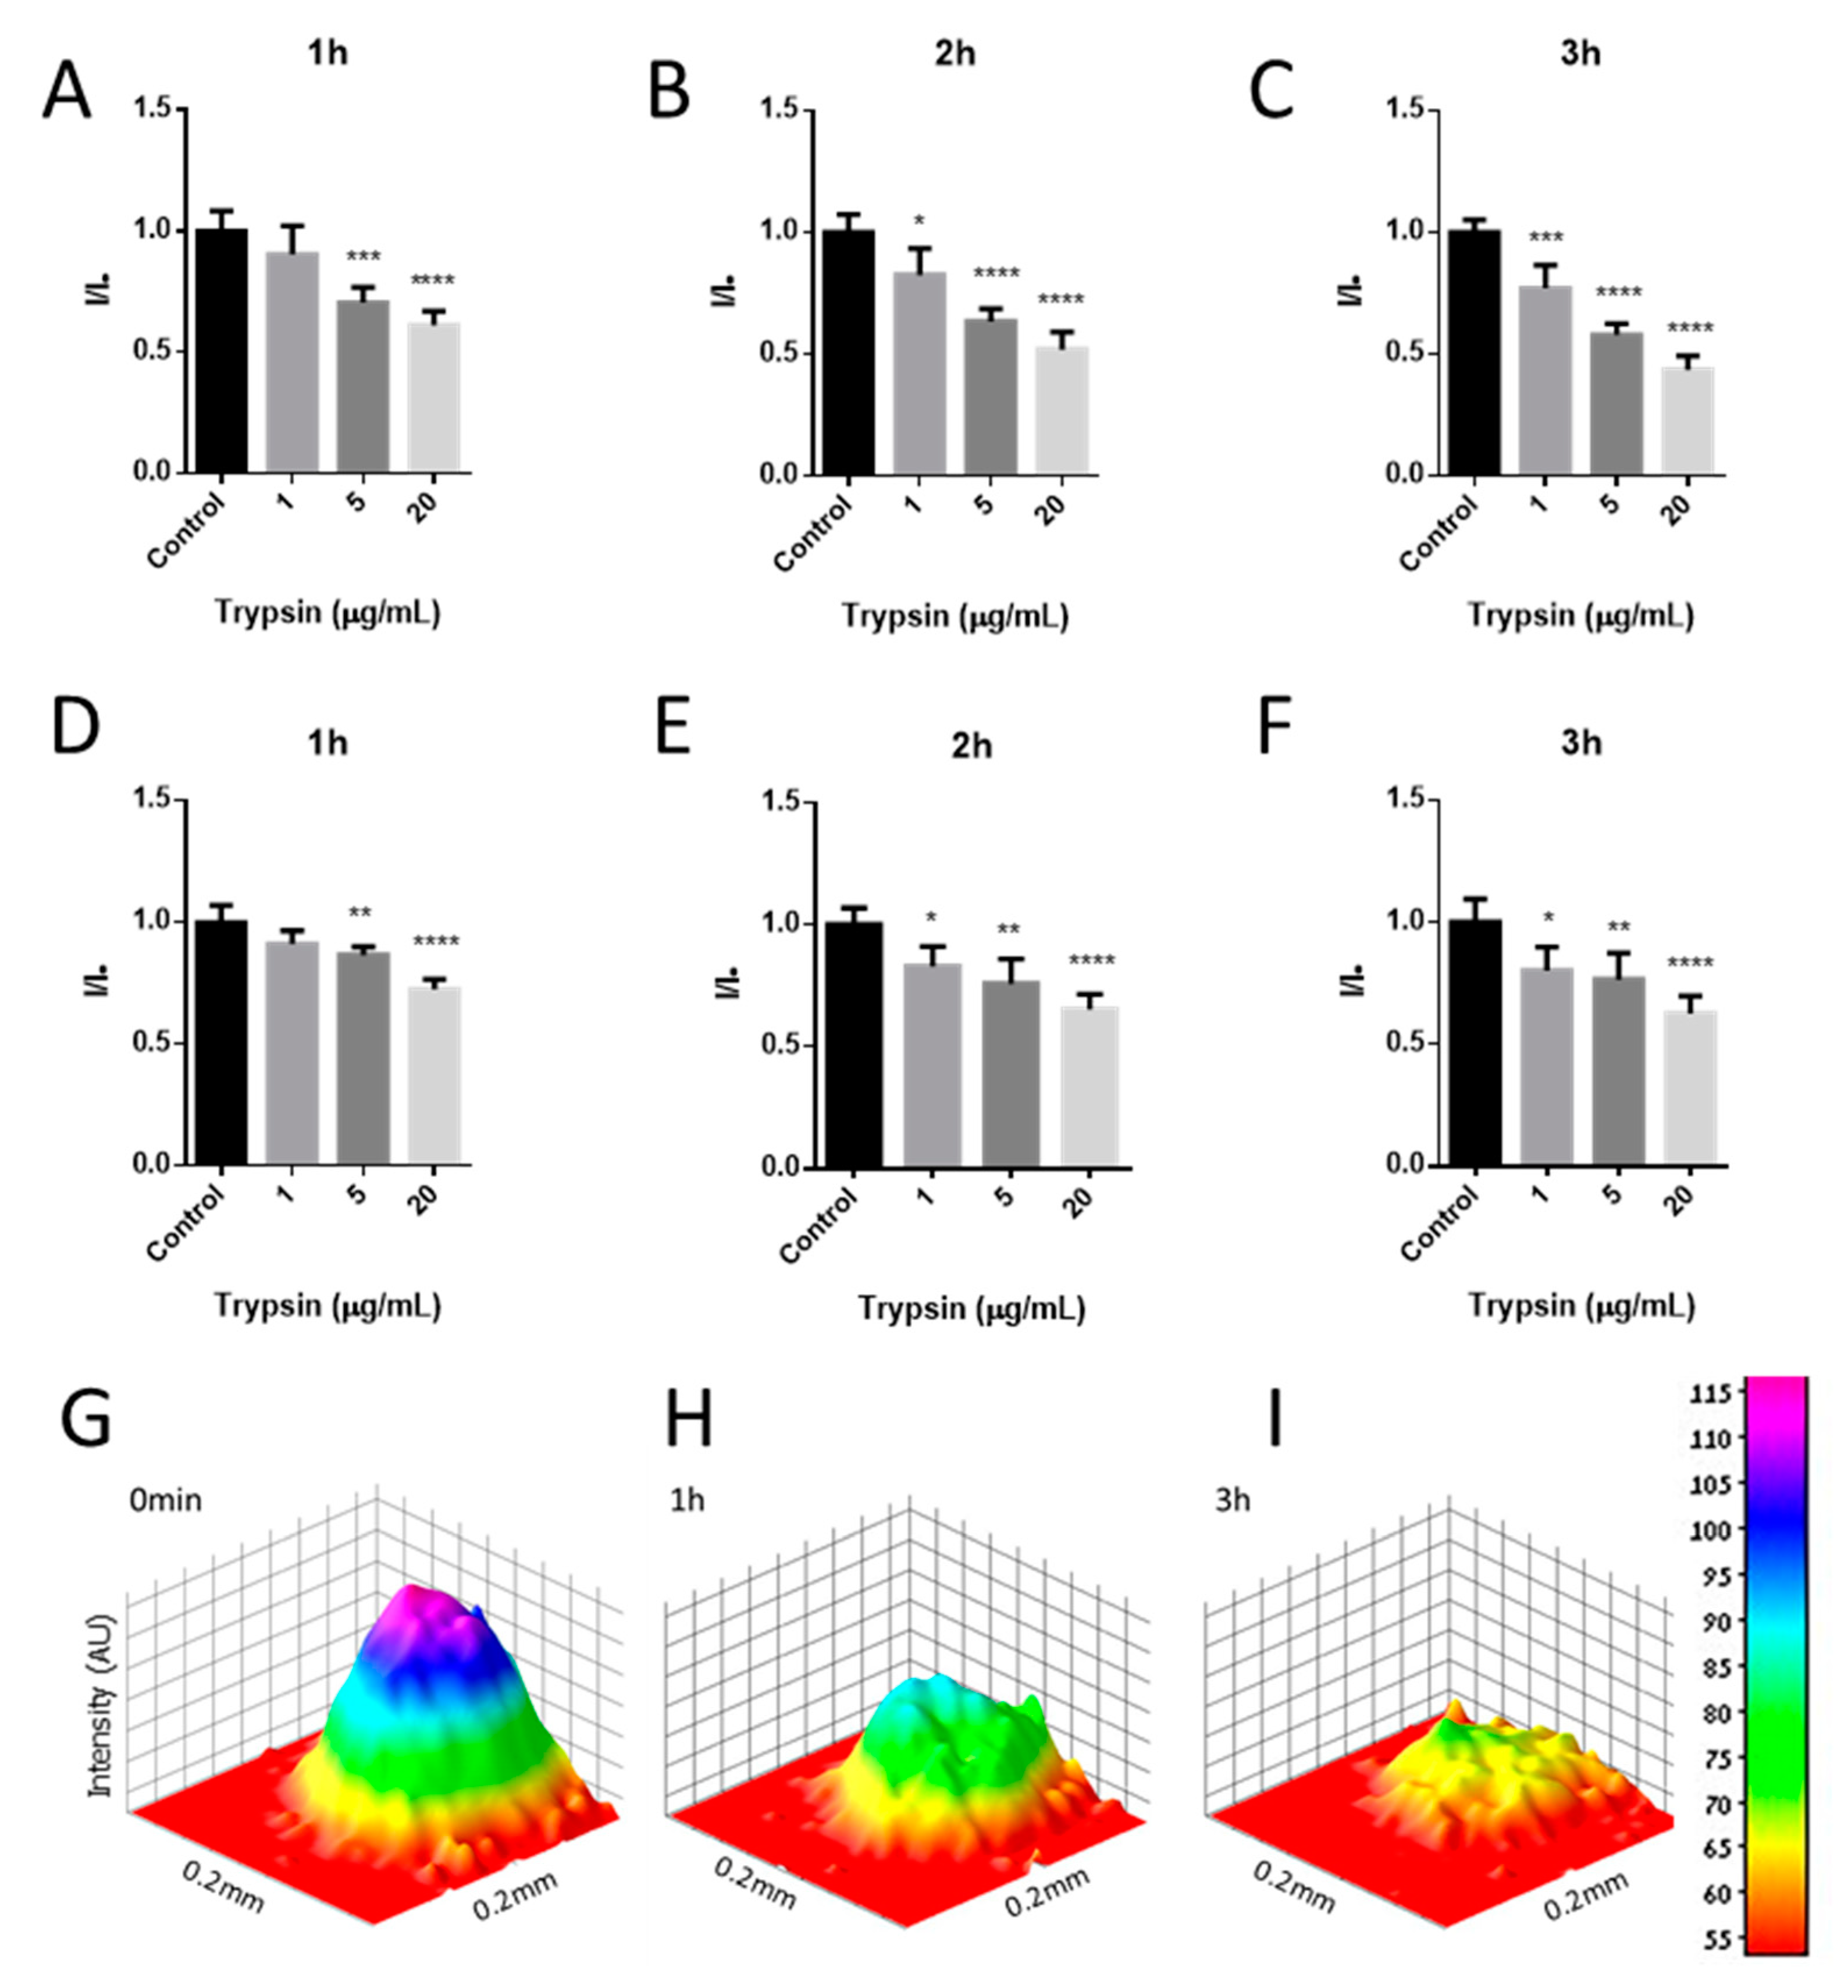
Figure 1. Developed sensor for trypsin detection. (A) Sensor preparation scheme, where two replicates of the same sensor are deposited on the same strip. (B) Photo of the prepared sensors strips. (C) Photoluminescence of the sensors, as captured with a CMOS camera. (D) Scheme of the optical setup for signal detection. Not to scale.
Sensors 20 05247 g001
Figure 2. The structures of the three peptides and poly(vinyl alcohol) (PVA) polymer that were used for single-wall carbon nanotube (SWCNT) dispersion.
Sensors 20 05247 g002
Figure 3. UV–visible absorption spectra of WFK, YK, HexCoil-Ala, and PVA-encapsulated (6,5) SWCNTs. The insert presents the 950–1050 nm part of the spectrum.
Sensors 20 05247 g003
Figure 4. A map of the trypsin restriction sites on (A) YK, (B) HexCoil-Ala, and (C) WFK. (D) Schematic presentation of possible mechanisms that could account for the lack of trypsin reaction of YK and WFK sensors.
Sensors 20 05247 g004
Figure 5. Trypsin effect on the sensors PL. (A) The PL levels of four different SWCNTs sensors after incubation with 20 μg/mL trypsin for 3 h as compared to initial PL value (p < 0.05, n = 5). (B) Comparing change in PL after incubation of the Helix sensor with 20 μg/mL trypsin for 3 h, in the presence or absence of trypsin inhibitor (SBTI). A total of 30 μg/mL of BSA served as a negative control. (One-way ANOVA, p < 0.05, n = 4.) Error bars represent standard deviation (SD).
Sensors 20 05247 g005
Figure 6. UV–Vis absorption spectra of HexCoil-Ala-encapsulated (6,5) SWCNTs before (blue) and after (red) incubation with 20 μg/mL trypsin. Left insert presents an enlarged 835–935 nm part of the spectrum, right insert the 975–1015 nm. Dashed lines represent SD, n = 4.
Sensors 20 05247 g006
Figure 7. Time- and concentration-dependent changes in HexCoil-Ala-SWCNTs photoluminescence after incubation with trypsin or without trypsin (control); in (A–C) phosphate-buffered saline (PBS) or in 8.3% (D–F) urine. 3D photoluminescence intensity plot (G) immediately after addition, (H) 1 h after the addition, and (I) 3 h after the addition of 20 μg/mL trypsin. Error bars represent SD. One-way ANOVA, p < 0.05, n = 4.
Sensors 20 05247 g007
Figure 8. Effect of the urine and urea concentration on the sensors’ PL. Response of the biosensor to addition of (A) 8.3% or 33% urine and (B) 10 or 20 mg/mL urea. Error bars represent SD. One-way ANOVA, p < 0.05, n = 4.
Sensors 20 05247 g008
Table 1. A table representation of the relative intensity values ± SD of time- and concentration-dependent changes in HexCoil-Ala-SWCNTs’ photoluminescence after incubation with trypsin in PBS or in 8.3% v/v urine. p < 0.05, n = 4.
Control1 µg/mL5 µg/mL20 µg/mL
PBS
1 h1 ± 0.08450.905 ± 0.1180.706 ± 0.05760.612 ± 0.0623
2 h1 ± 0.07460.826 ± 0.1080.636 ± 0.07090.521 ± 0.0502
3 h1 ± 0.05120.770 ± 0.09520.580 ± 0.05770.435 ± 0.0456
8.3% Urine
1 h1 ± 0.06940.911 ± 0.05540.866 ± 0.04320.724 ± 0.0336
2 h1 ± 0.07000.829 ± 0.08180.759 ± 0.06110.654 ± 0.101
3 h1 ± 0.09530.802 ± 0.09650.766 ± 0.07050.627 ± 0.109

