The Effect of Magnet-to-Coil Distance on the Performance Characteristics of EMATs

Abstract
1. Introduction
2. Theory
3. Results of Simulation and Discussion
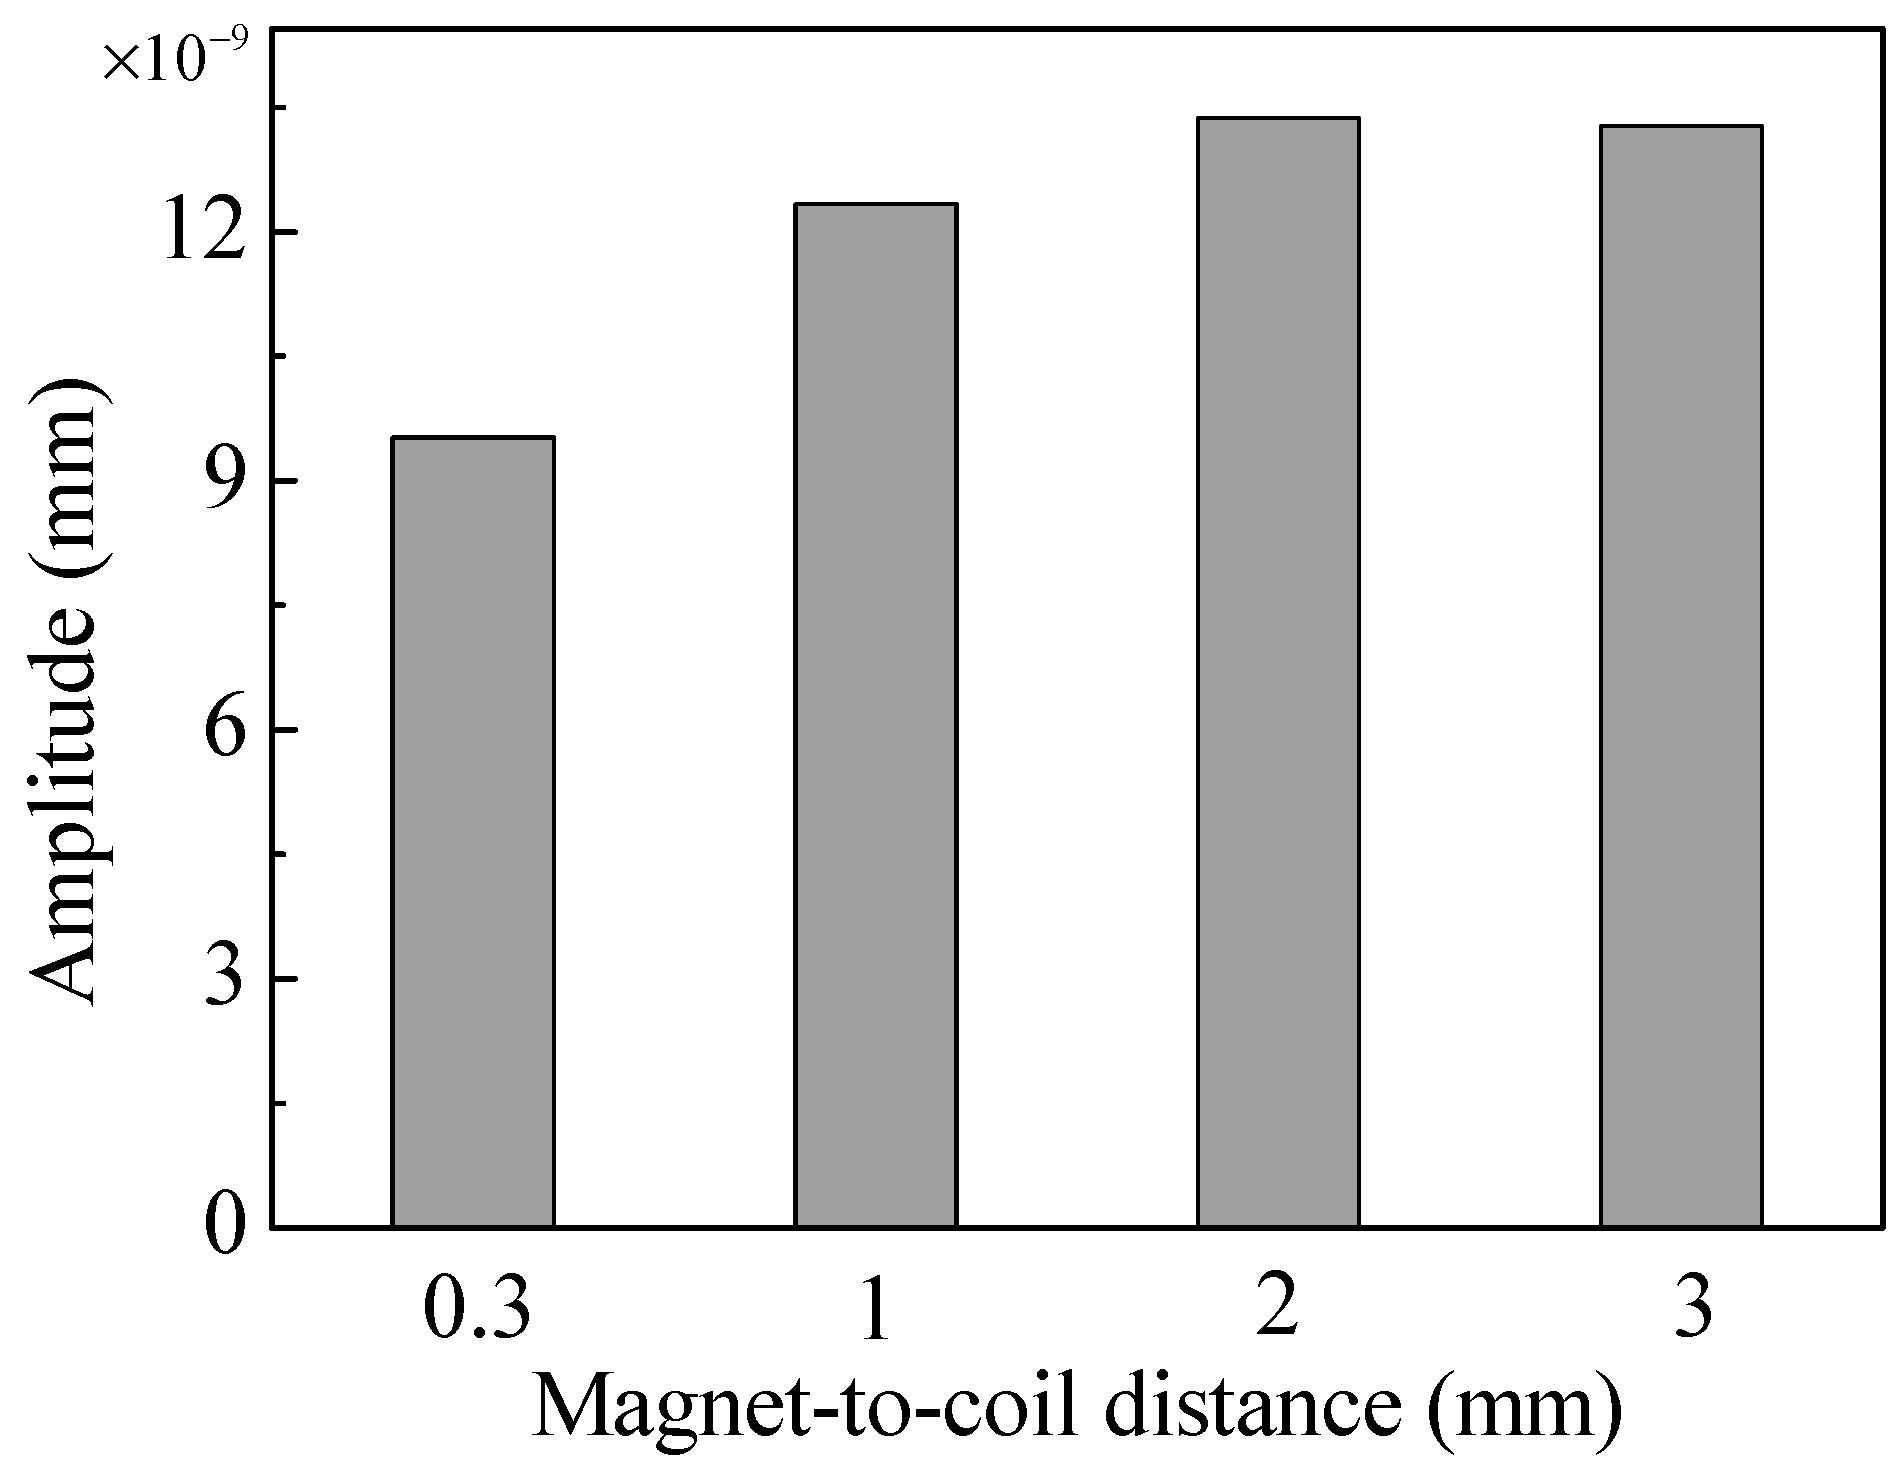
3.1. Effect of Magnet-to-Coil Distance on Conversion Efficiency
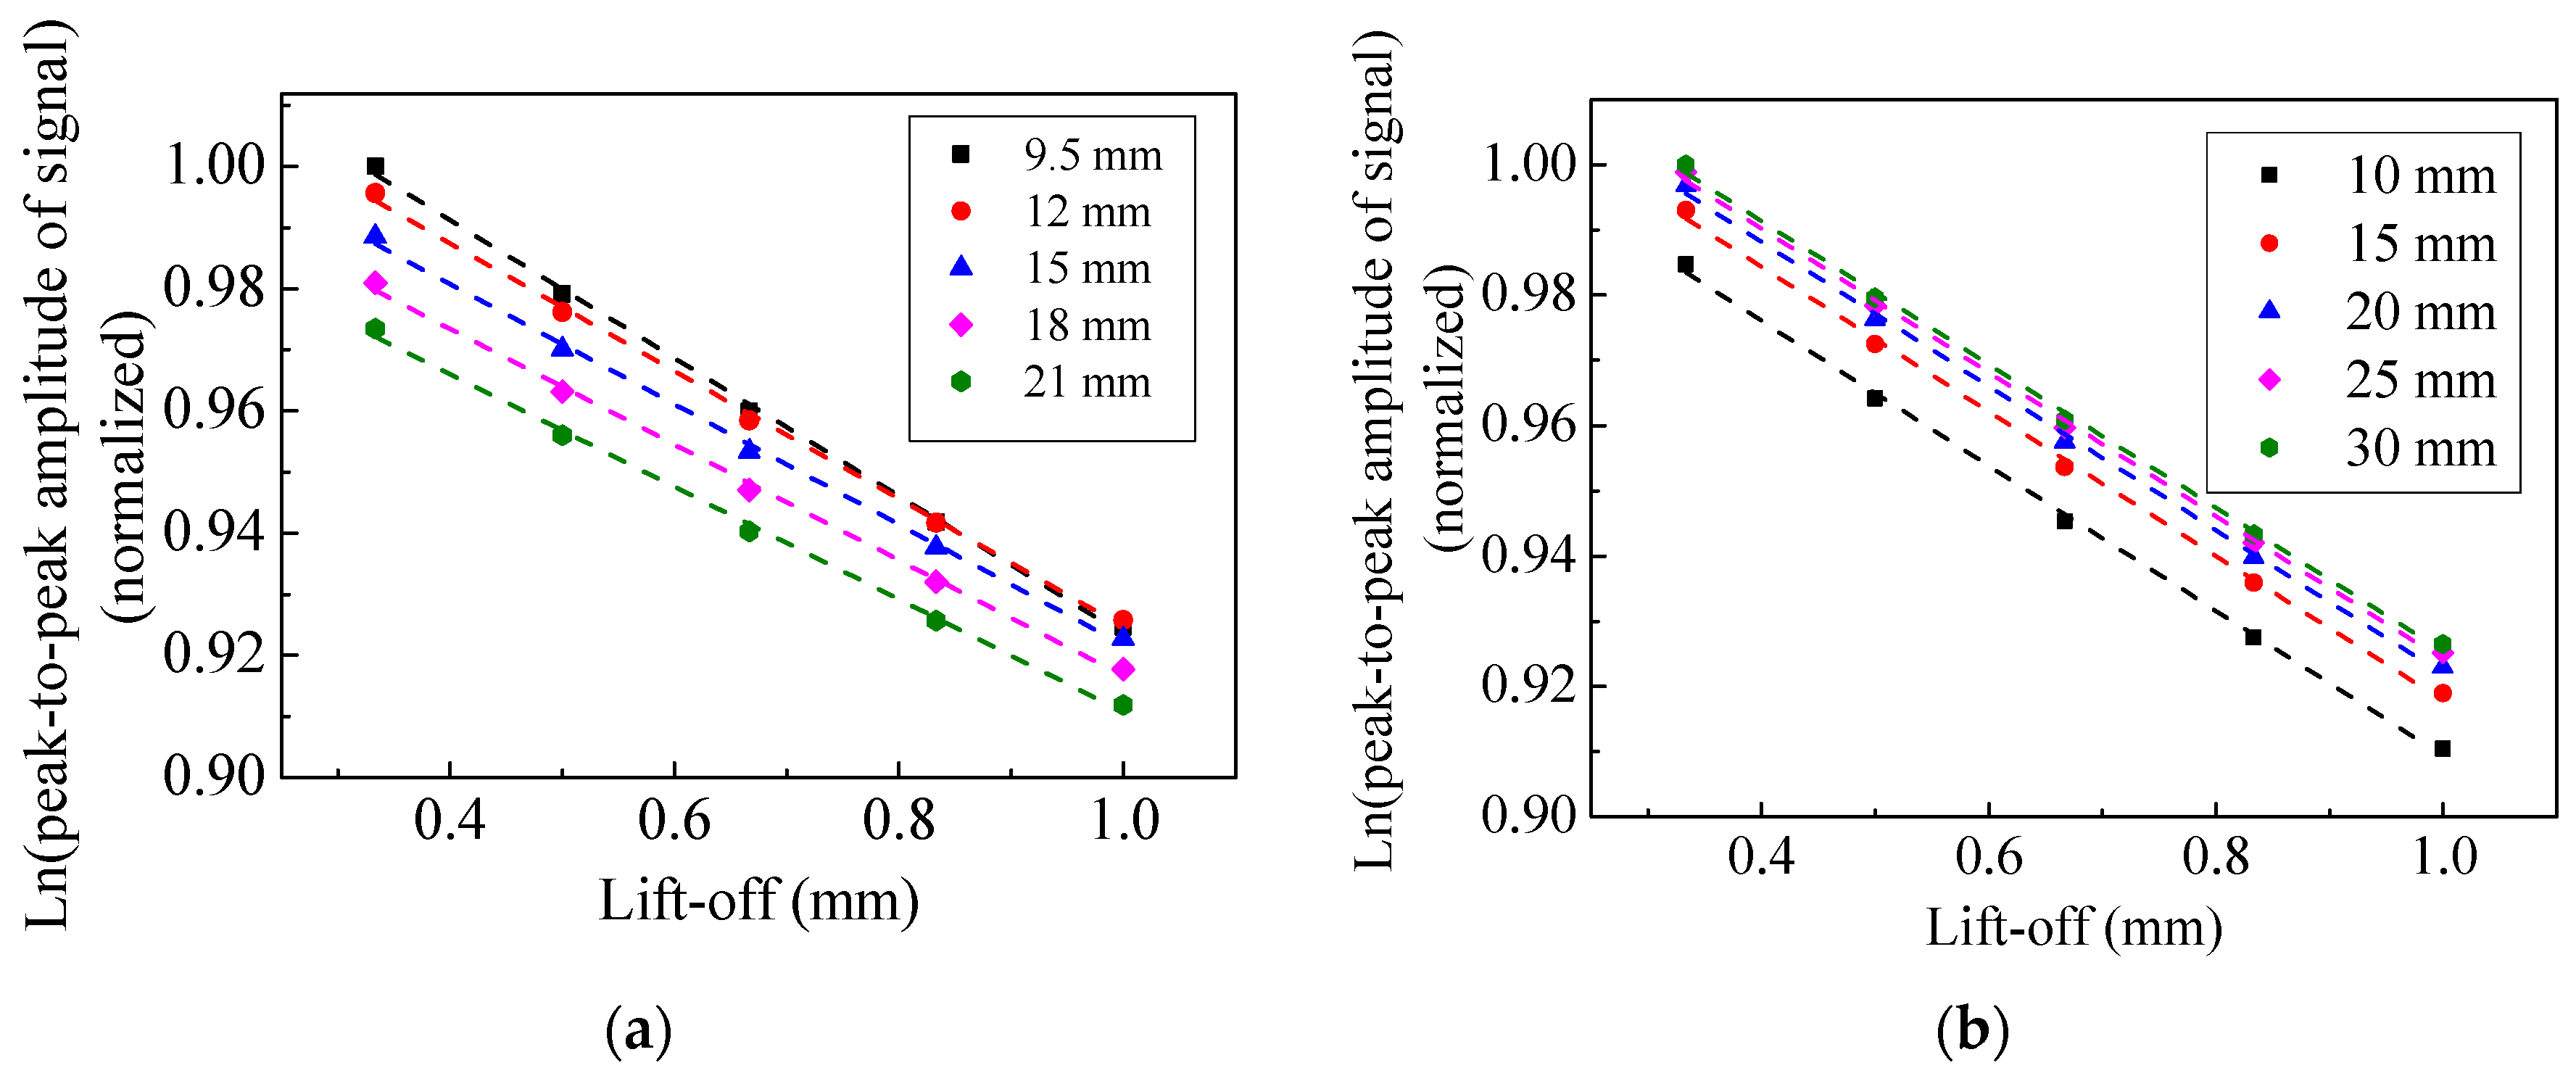
3.2. Influence of Magnet-to-Coil Distance on Lift-Off Effect
4. Experimental Validation
5. Conclusions
Author Contributions
Funding
Conflicts of Interest
References
- Yu, Y.; Gao, K.; Liu, B.; Li, L. Semi-analytical method for characterization slit defects in conducting metal by Eddy current nondestructive technique. Sens. Actuators A Phys. 2020, 301, 111739. [Google Scholar] [CrossRef]
- Yin, W.; Tang, J.; Lu, M.; Xu, H.; Huang, R.; Zhao, Q.; Zhang, Z.; Peyton, A. An Equivalent-Effect Phenomenon in Eddy Current Non-Destructive Testing of Thin Structures. IEEE Access 2019, 7, 70296–70307. [Google Scholar] [CrossRef]
- James, R.; Haider, M.F.; Giurgiutiu, V.; Lilienthal, D. A simulative and experimental approach towards eddy current non-destructive evaluation of manufacturing flaws and operational damage in CFRP composites. J. Nondestruct. Eval. Diagn. Progn. Eng. Syst. 2019, 3, 011002. [Google Scholar] [CrossRef]
- Xie, S.; Duan, Z.; Li, J.; Tong, Z.; Tian, M.; Chen, Z. A novel magnetic force transmission eddy current array probe and its application for nondestructive testing of defects in pipeline structures. Sens. Actuators A Phys. 2020, 309, 112030. [Google Scholar] [CrossRef]
- Azaman, K.N.; Sophian, A.; Nafiah, F. Effects of coil diameter in thickness measurement using pulsed eddy current non-destructive testing. Conf. Ser. Mater. Sci. Eng. 2017, 260, 012001. [Google Scholar] [CrossRef]
- Jia, X.; Ouyang, Q.; Zhang, X. An Improved Design of the Spiral-Coil EMAT for Enhancing the Signal Amplitude. Sensors 2017, 17, 1106. [Google Scholar] [CrossRef]
- Pei, C.; Zhao, S.; Xiao, P.; Chen, Z. A modified meander-line-coil EMAT design for signal amplitude enhancement. Sens. Actuators A Phys. 2016, 247, 539–546. [Google Scholar] [CrossRef]
- Clough, M.; Fleming, M.; Dixon, S. Circumferential guided wave EMAT system for pipeline screening using shear horizontal ultrasound. NDT E Int. 2017, 86, 20–27. [Google Scholar] [CrossRef]
- Thring, C.; Fan, Y.; Edwards, R.S. Focused Rayleigh wave EMAT for characterisation of surface-breaking defects. NDT E Int. 2016, 81, 20–27. [Google Scholar] [CrossRef]
- Thring, C.; Fan, Y.; Edwards, R.S. Multi-coil focused EMAT for characterisation of surface-breaking defects of arbitrary orientation. NDT E Int. 2017, 88, 1–7. [Google Scholar] [CrossRef]
- Sun, W.-X.; Liu, G.-Q.; Xia, H.; Xia, Z.-W. Lamb wave signal selective enhancement by an improved design of meander-coil electromagnetic acoustic transducer. Chin. Phys. B 2018, 27, 084301. [Google Scholar] [CrossRef]
- Ren, W.; He, J.; Dixon, S.; Xu, K. Enhancement of EMAT’s efficiency by using silicon steel laminations back-plate. Sens. Actuators A Phys. 2018, 274, 189–198. [Google Scholar] [CrossRef]
- Boonsang, S.; Dewhurst, R. Signal enhancement in Rayleigh wave interactions using a laser-ultrasound/EMAT imaging system. Ultrasonics 2005, 43, 512–523. [Google Scholar] [CrossRef] [PubMed]
- Kang, L.; Dixon, S.; Wang, K.; Dai, J. Enhancement of signal amplitude of surface wave EMATs based on 3-D simulation analysis and orthogonal test method. NDT E Int. 2013, 59, 11–17. [Google Scholar] [CrossRef]
- Thompson, R. A Model for the Electromagnetic Generation and Detection of Rayleigh and Lamb Waves. IEEE Trans. Sonics Ultrason. 1973, 20, 340–346. [Google Scholar] [CrossRef]
- Huang, S.; Zhao, W.; Zhang, Y.; Wang, S. Study on the lift-off effect of EMAT. Sens. Actuators A Phys. 2009, 153, 218–221. [Google Scholar] [CrossRef]
- Green, R.E. Non-contact ultrasonic techniques. Ultrasonics 2004, 42, 9–16. [Google Scholar] [CrossRef]
- Wang, S.-J.; Su, R.; Chen, X.; Kang, L.; Zhai, G. Numerical and experimental analysis of unidirectional meander-line coil electromagnetic acoustic transducers. IEEE Trans. Ultrason. Ferroelectr. Freq. Control. 2013, 60, 2657–2664. [Google Scholar] [CrossRef] [PubMed]
- Jian, X.; Dixon, S.; Edwards, R.S. Modelling ultrasonic generation for Lorentz force EMATs. Insight-Non-Destr. Test. Cond. Monit. 2004, 46, 671–673. [Google Scholar] [CrossRef]
- Ribichini, R.; Nagy, P.B.; Ogi, H. The impact of magnetostriction on the transduction of normal bias field EMATs. NDT E Int. 2012, 51, 8–15. [Google Scholar] [CrossRef]
- Isla, J.; Cegla, F. Optimization of the Bias Magnetic Field of Shear Wave EMATs. IEEE Trans. Ultrason. Ferroelectr. Freq. Control. 2016, 63, 1148–1160. [Google Scholar] [CrossRef]
- Dhayalan, R.; Balasubramaniam, K. A hybrid finite element model for simulation of electromagnetic acoustic transducer (EMAT) based plate waves. NDT E Int. 2010, 43, 519–526. [Google Scholar] [CrossRef]
- Xie, Y.; Liu, Z.; Yin, L.; Wu, J.; Deng, P.; Yin, W. Directivity analysis of meander-line-coil EMATs with a wholly analytical method. Ultrasonics 2017, 73, 262–270. [Google Scholar] [CrossRef] [PubMed]
- Ogi, H.; Hirao, M.; Ohtani, T. Line-focusing electromagnetic acoustic transducers for the detection of slit defects. IEEE Trans. Ultrason. Ferroelectr. Freq. Control. 1999, 46, 341–346. [Google Scholar] [CrossRef]


| Description, Symbol | Value, Unit |
|---|---|
| Remanent flux density, Br | 1.2 T |
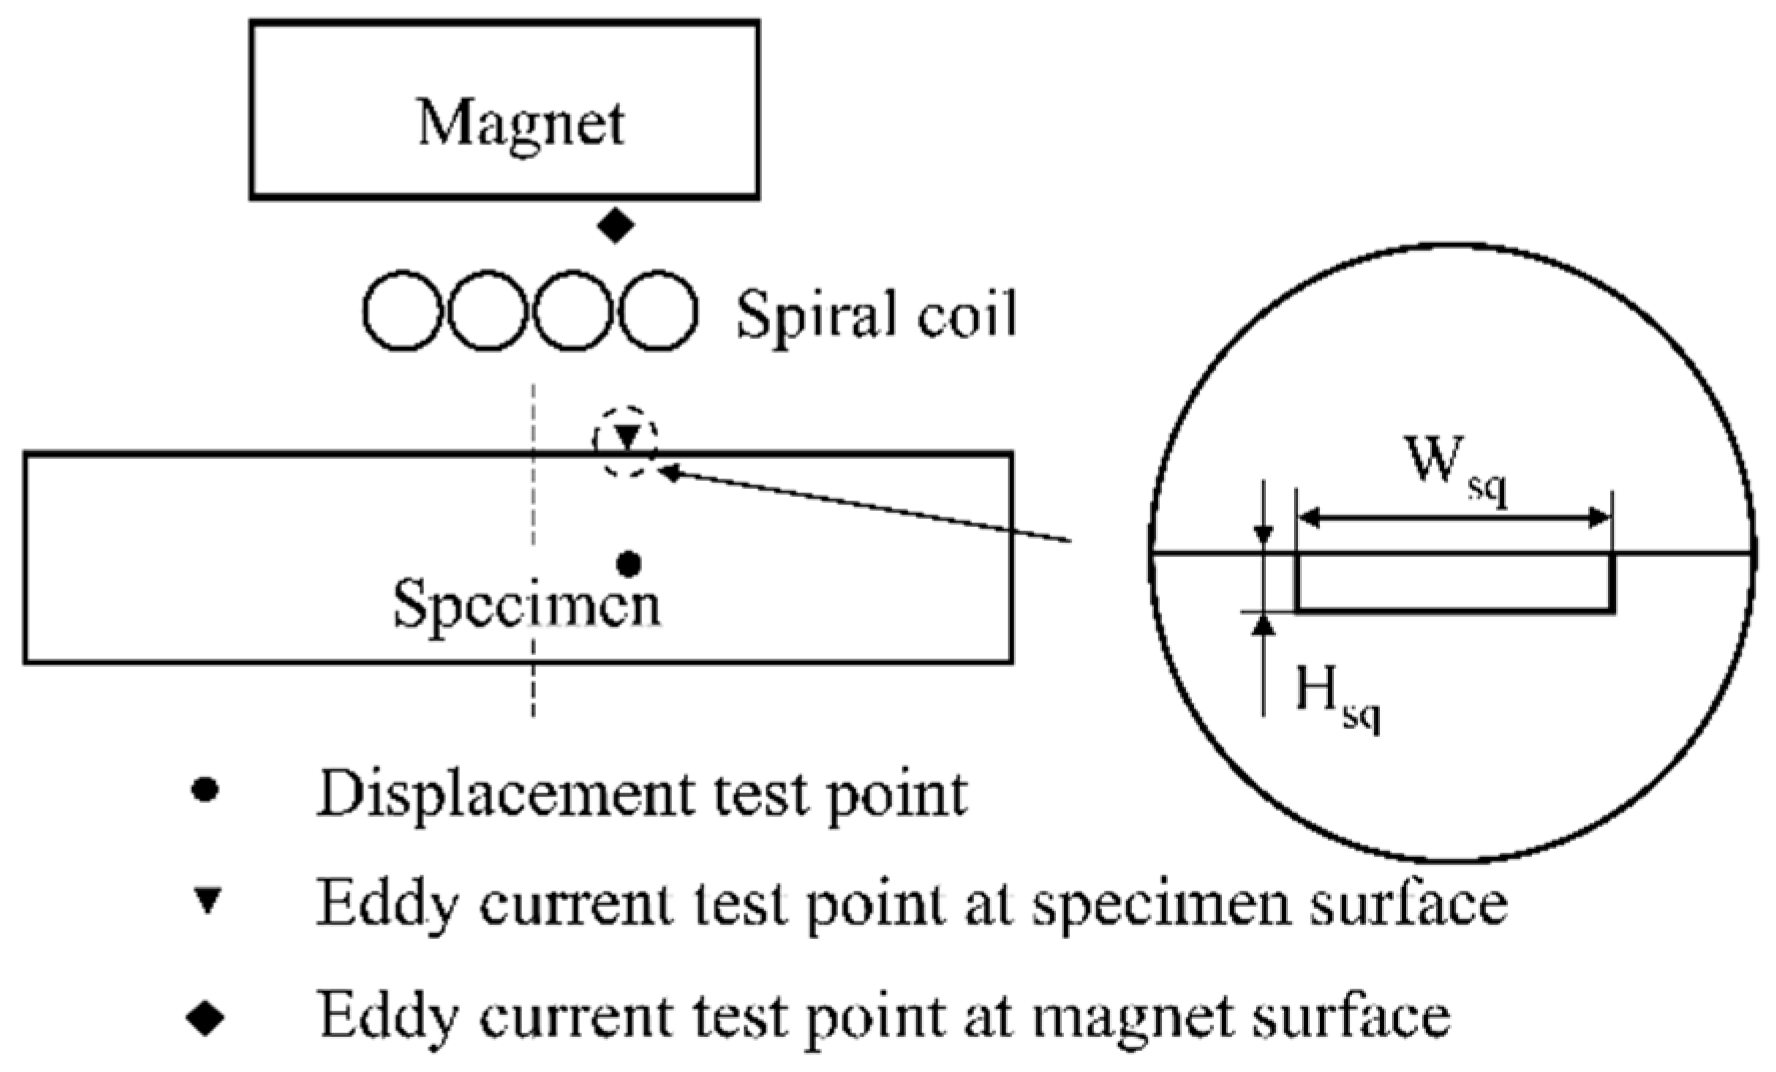
| Magnet size | 20 mm × 10 mm |
| Aluminum specimen size | 100 mm × 10 mm |
| Lift-off | 0.5 mm |
| Electrical conductivity, Al | 3.774 × 10⁷ s/m |
| Electrical conductivity, NdFeB Magnet | 6.25 × 10⁵ s/m |
| Electrical conductivity, coil | 2.667 × 10⁷ s/m |
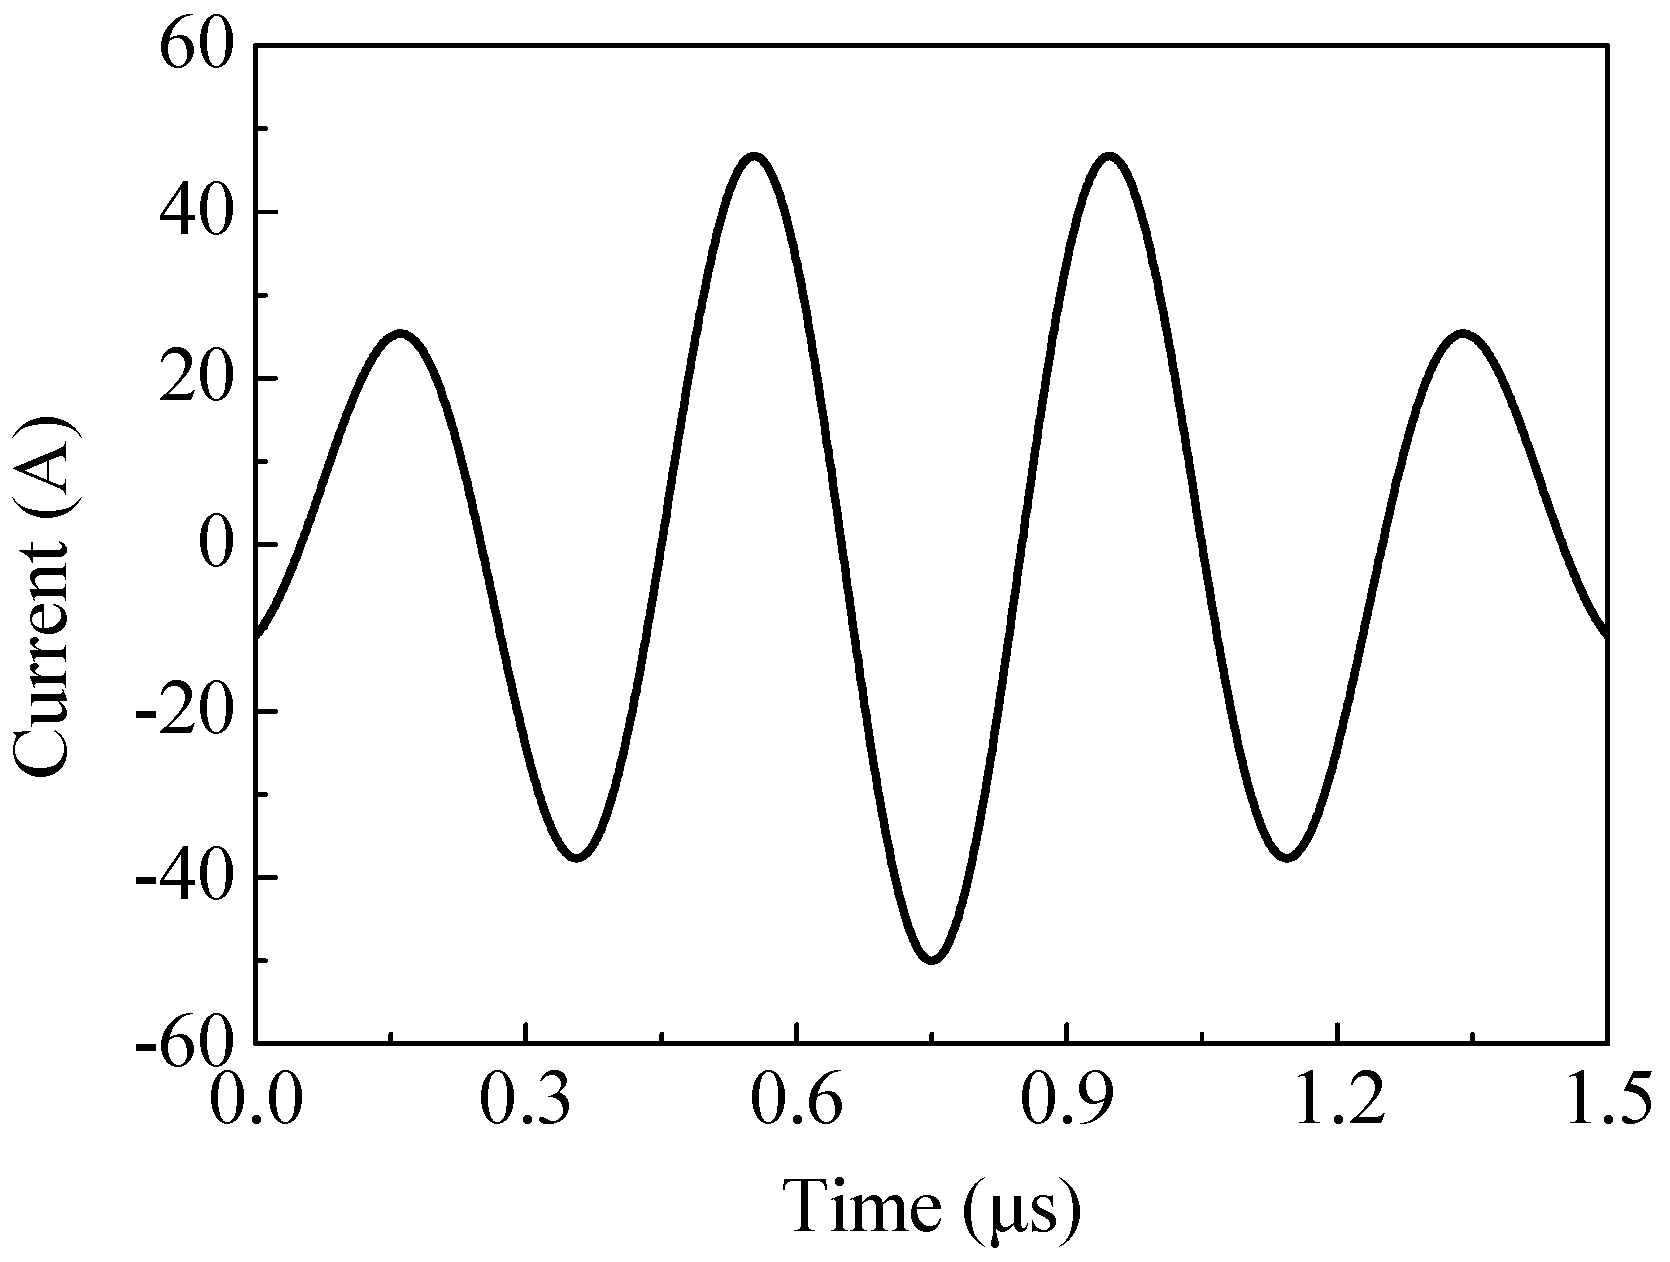
| Excitation current frequency | 2.5 MHz |
| Magnet-to-Coil Distance (mm) | k | Correlation Coefficient |
|---|---|---|
| 0.3 | −0.8615 | −0.9986 |
| 1 | −0.6016 | −0.9990 |
| 2 | −0.4603 | −0.9996 |
| 3 | −0.4041 | −0.9998 |
© 2020 by the authors. Licensee MDPI, Basel, Switzerland. This article is an open access article distributed under the terms and conditions of the Creative Commons Attribution (CC BY) license (http://creativecommons.org/licenses/by/4.0/).
Share and Cite
Wu, Y.; Wu, Y. The Effect of Magnet-to-Coil Distance on the Performance Characteristics of EMATs. Sensors 2020, 20, 5096. https://doi.org/10.3390/s20185096
Wu Y, Wu Y. The Effect of Magnet-to-Coil Distance on the Performance Characteristics of EMATs. Sensors. 2020; 20(18):5096. https://doi.org/10.3390/s20185096
Chicago/Turabian StyleWu, Yutang, and Yunxin Wu. 2020. "The Effect of Magnet-to-Coil Distance on the Performance Characteristics of EMATs" Sensors 20, no. 18: 5096. https://doi.org/10.3390/s20185096
APA StyleWu, Y., & Wu, Y. (2020). The Effect of Magnet-to-Coil Distance on the Performance Characteristics of EMATs. Sensors, 20(18), 5096. https://doi.org/10.3390/s20185096