A Study on the Effect of Contact Pressure during Physical Activity on Photoplethysmographic Heart Rate Measurements


 ,
,  ,
,  and
and
Abstract
1. Introduction
2. Materials and Methods
2.1. Measurement Device
2.2. Human Study Protocol
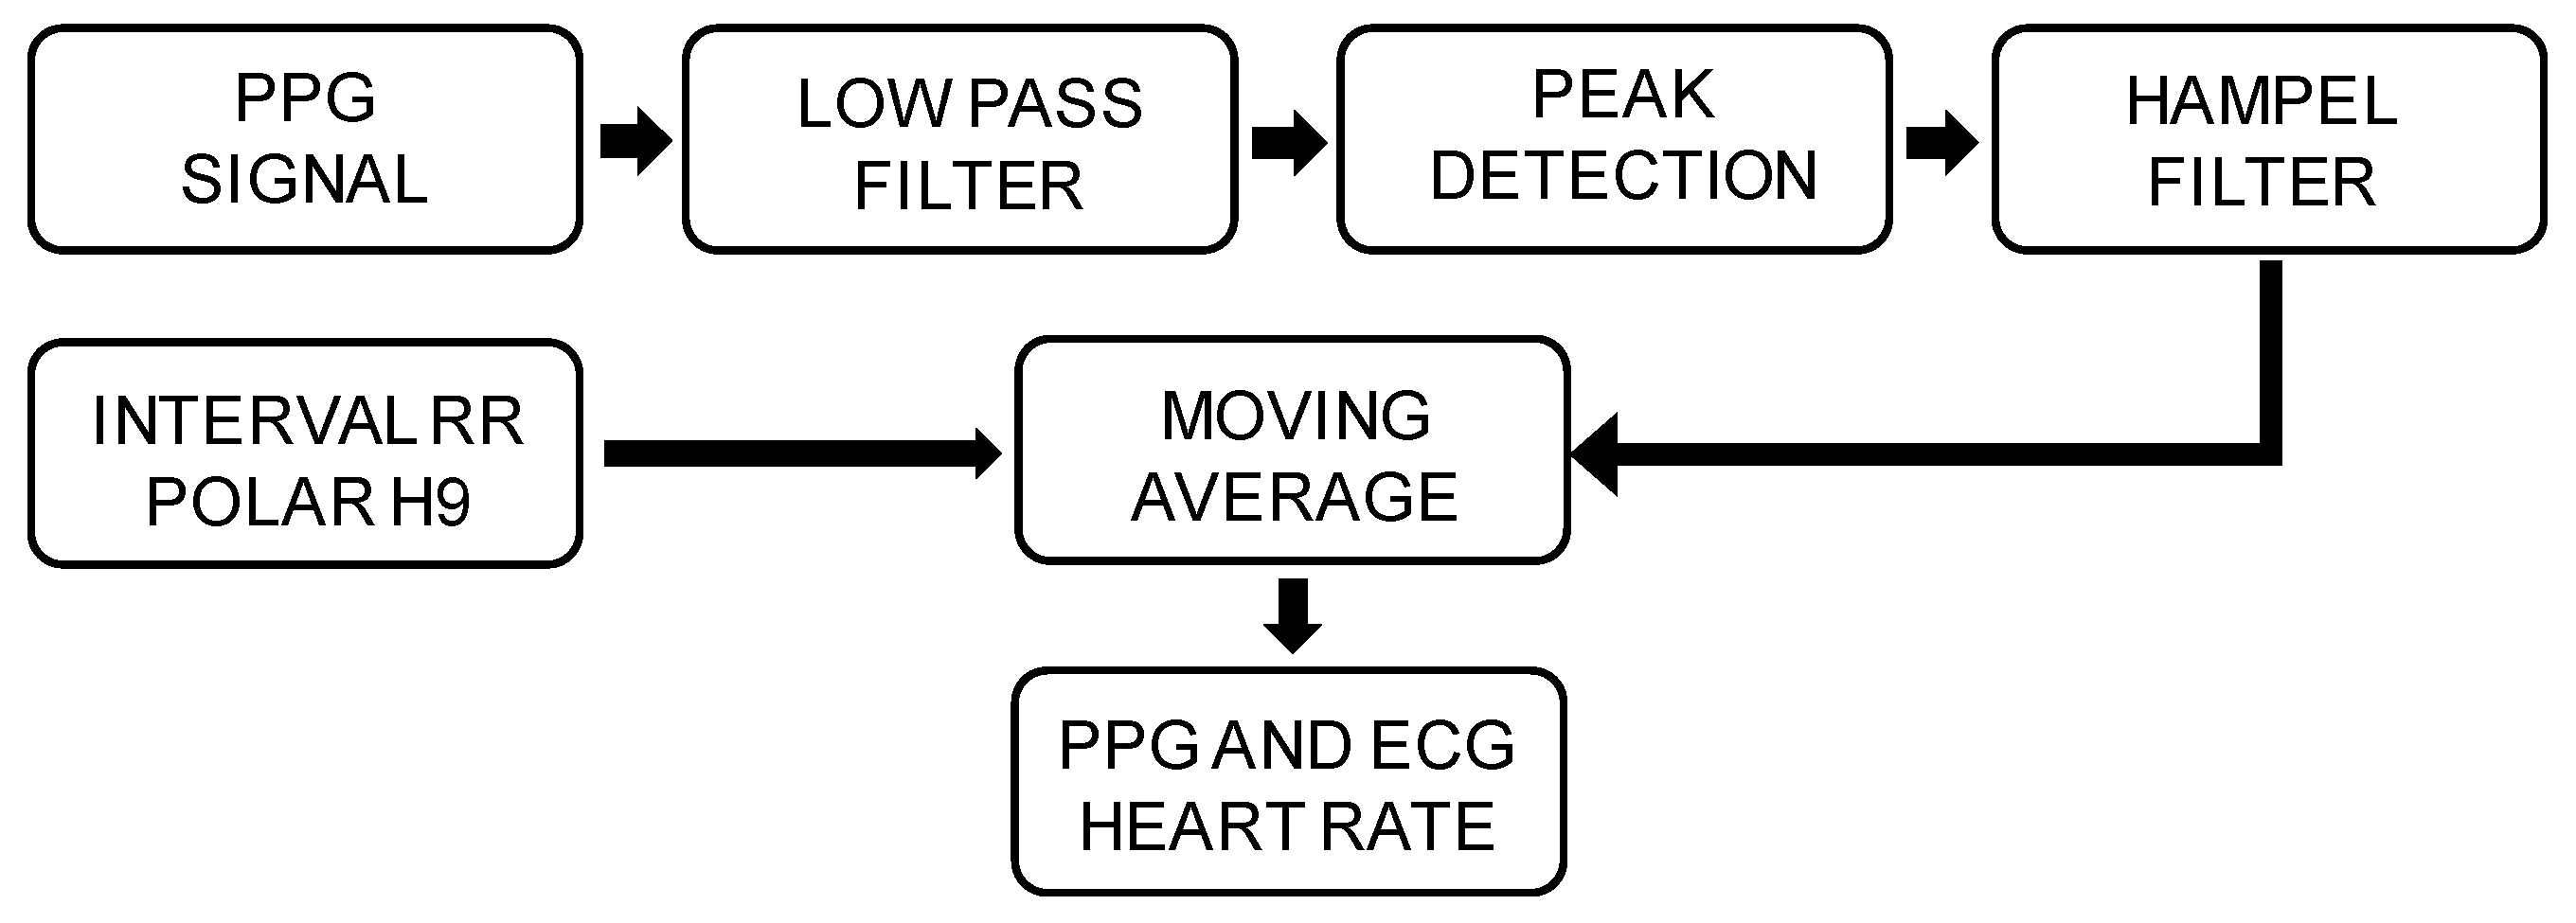
2.3. Data Analysis
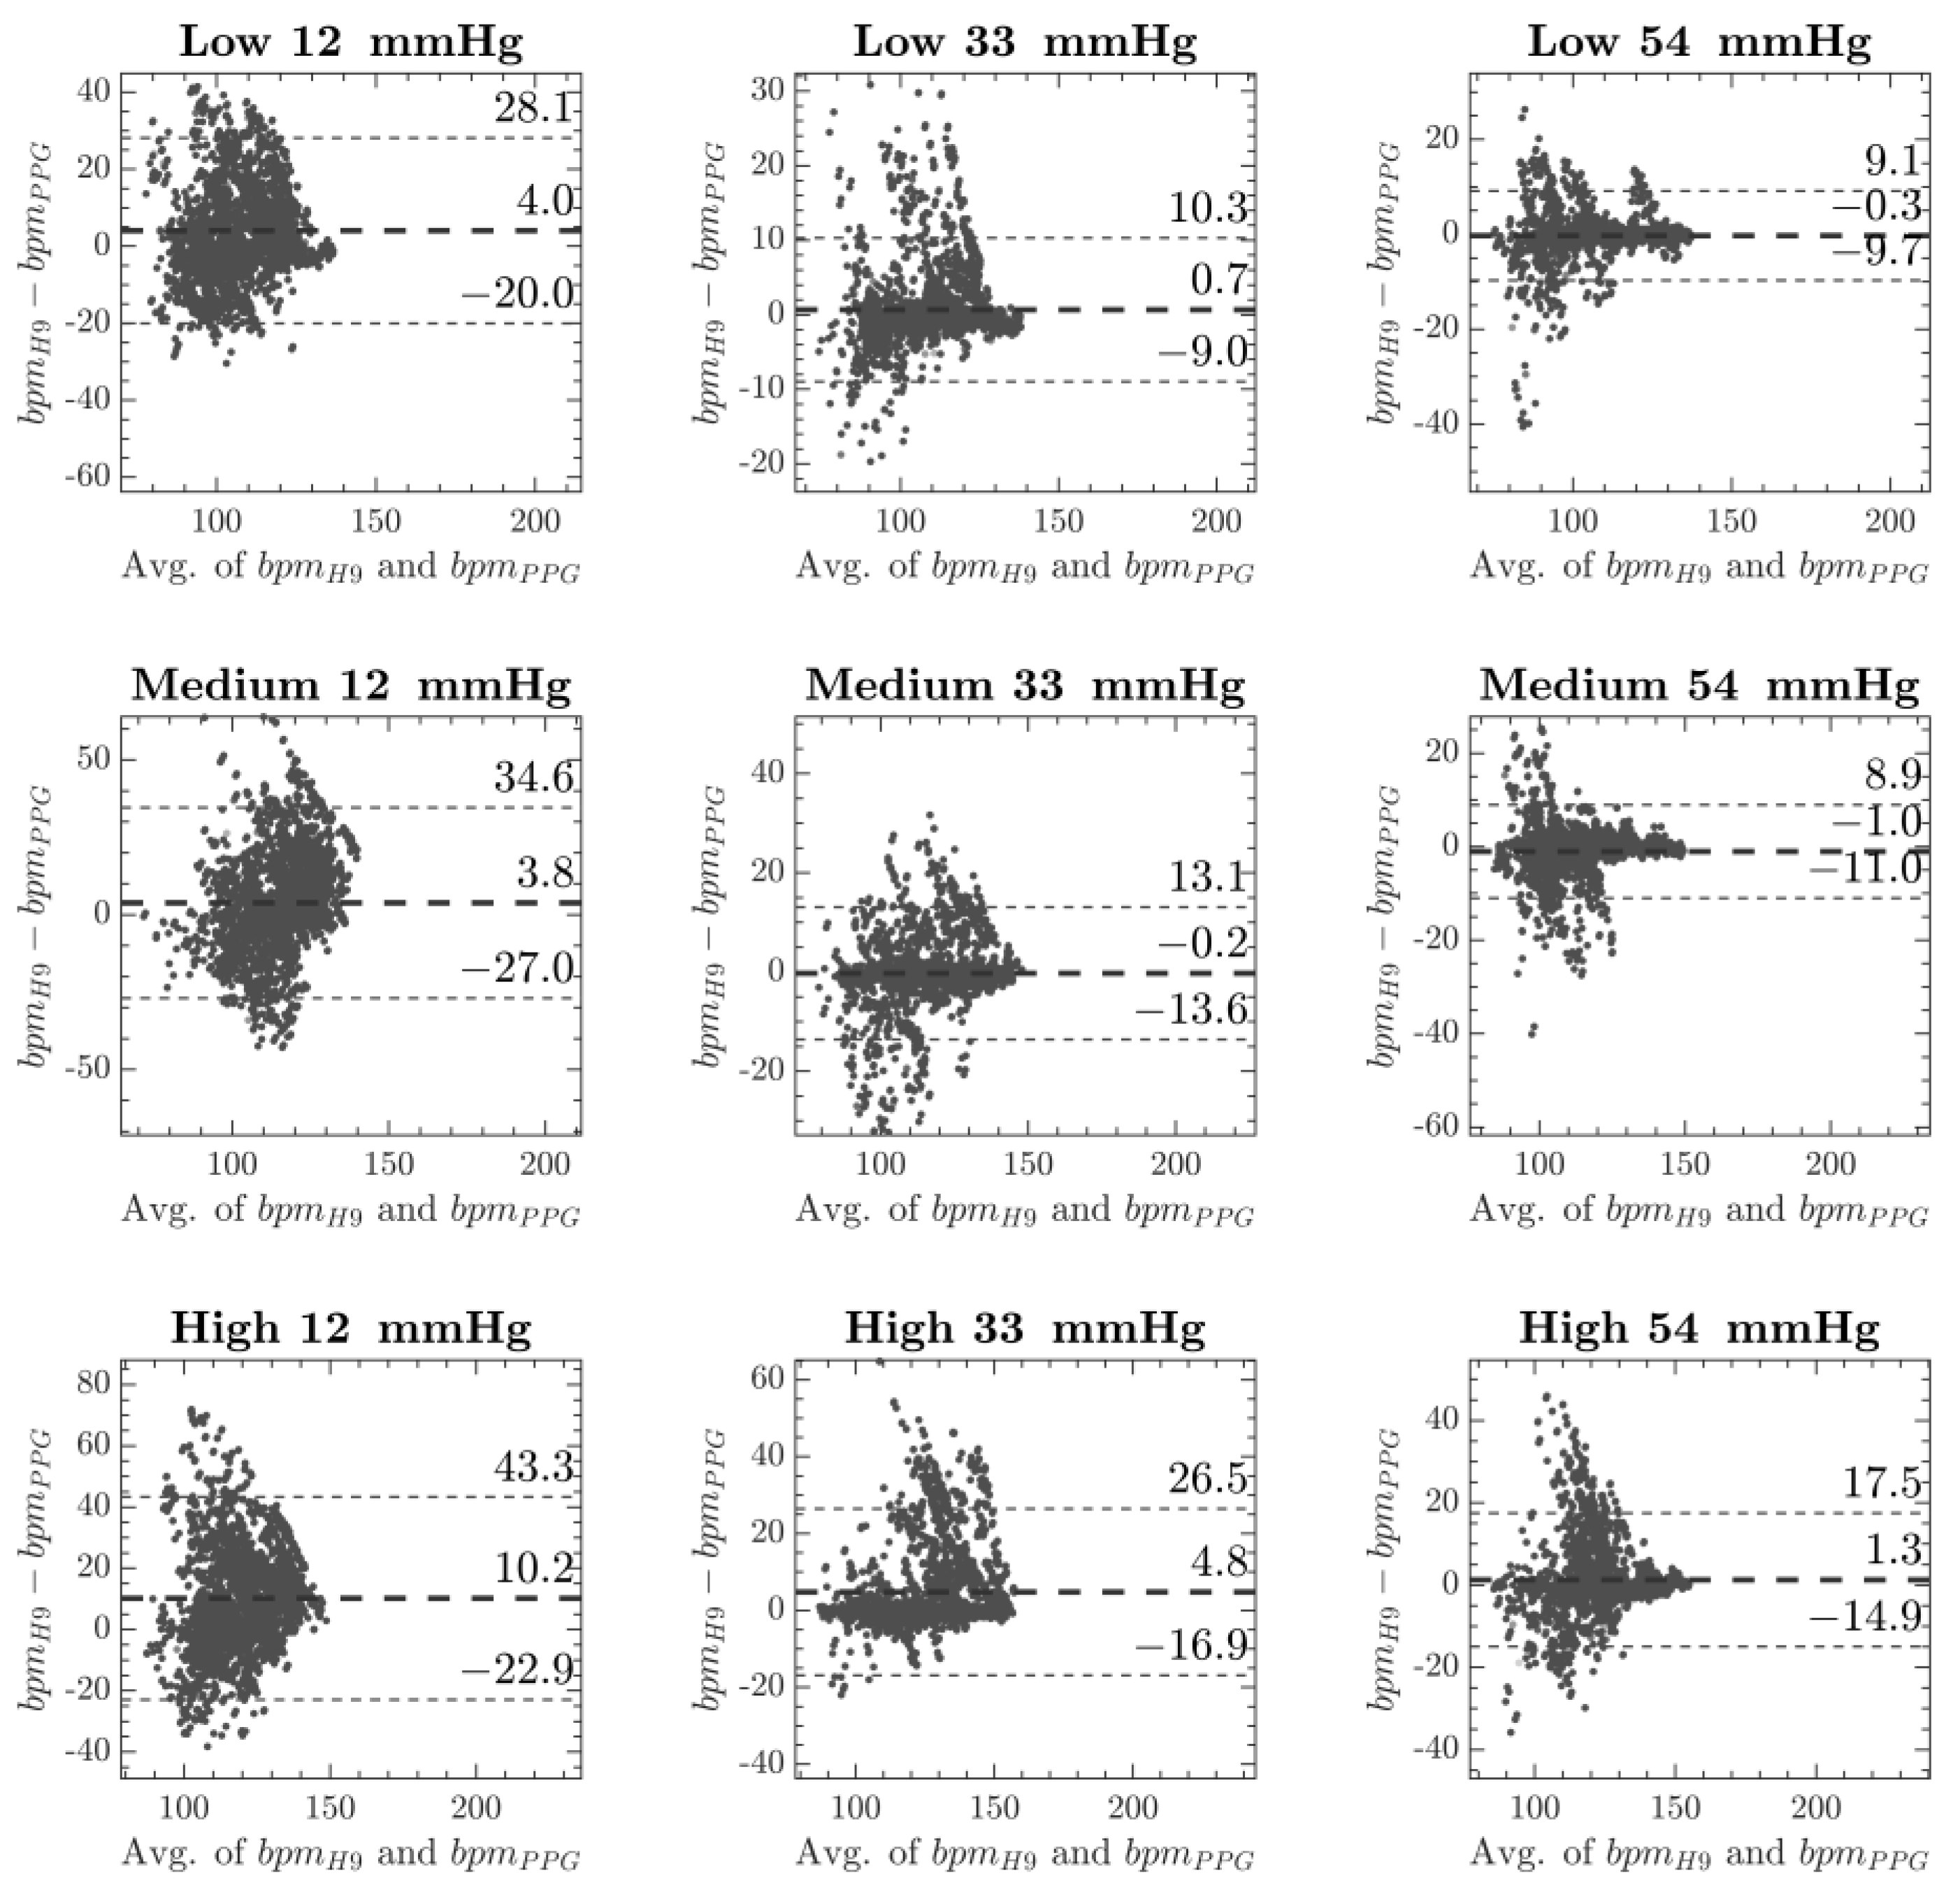
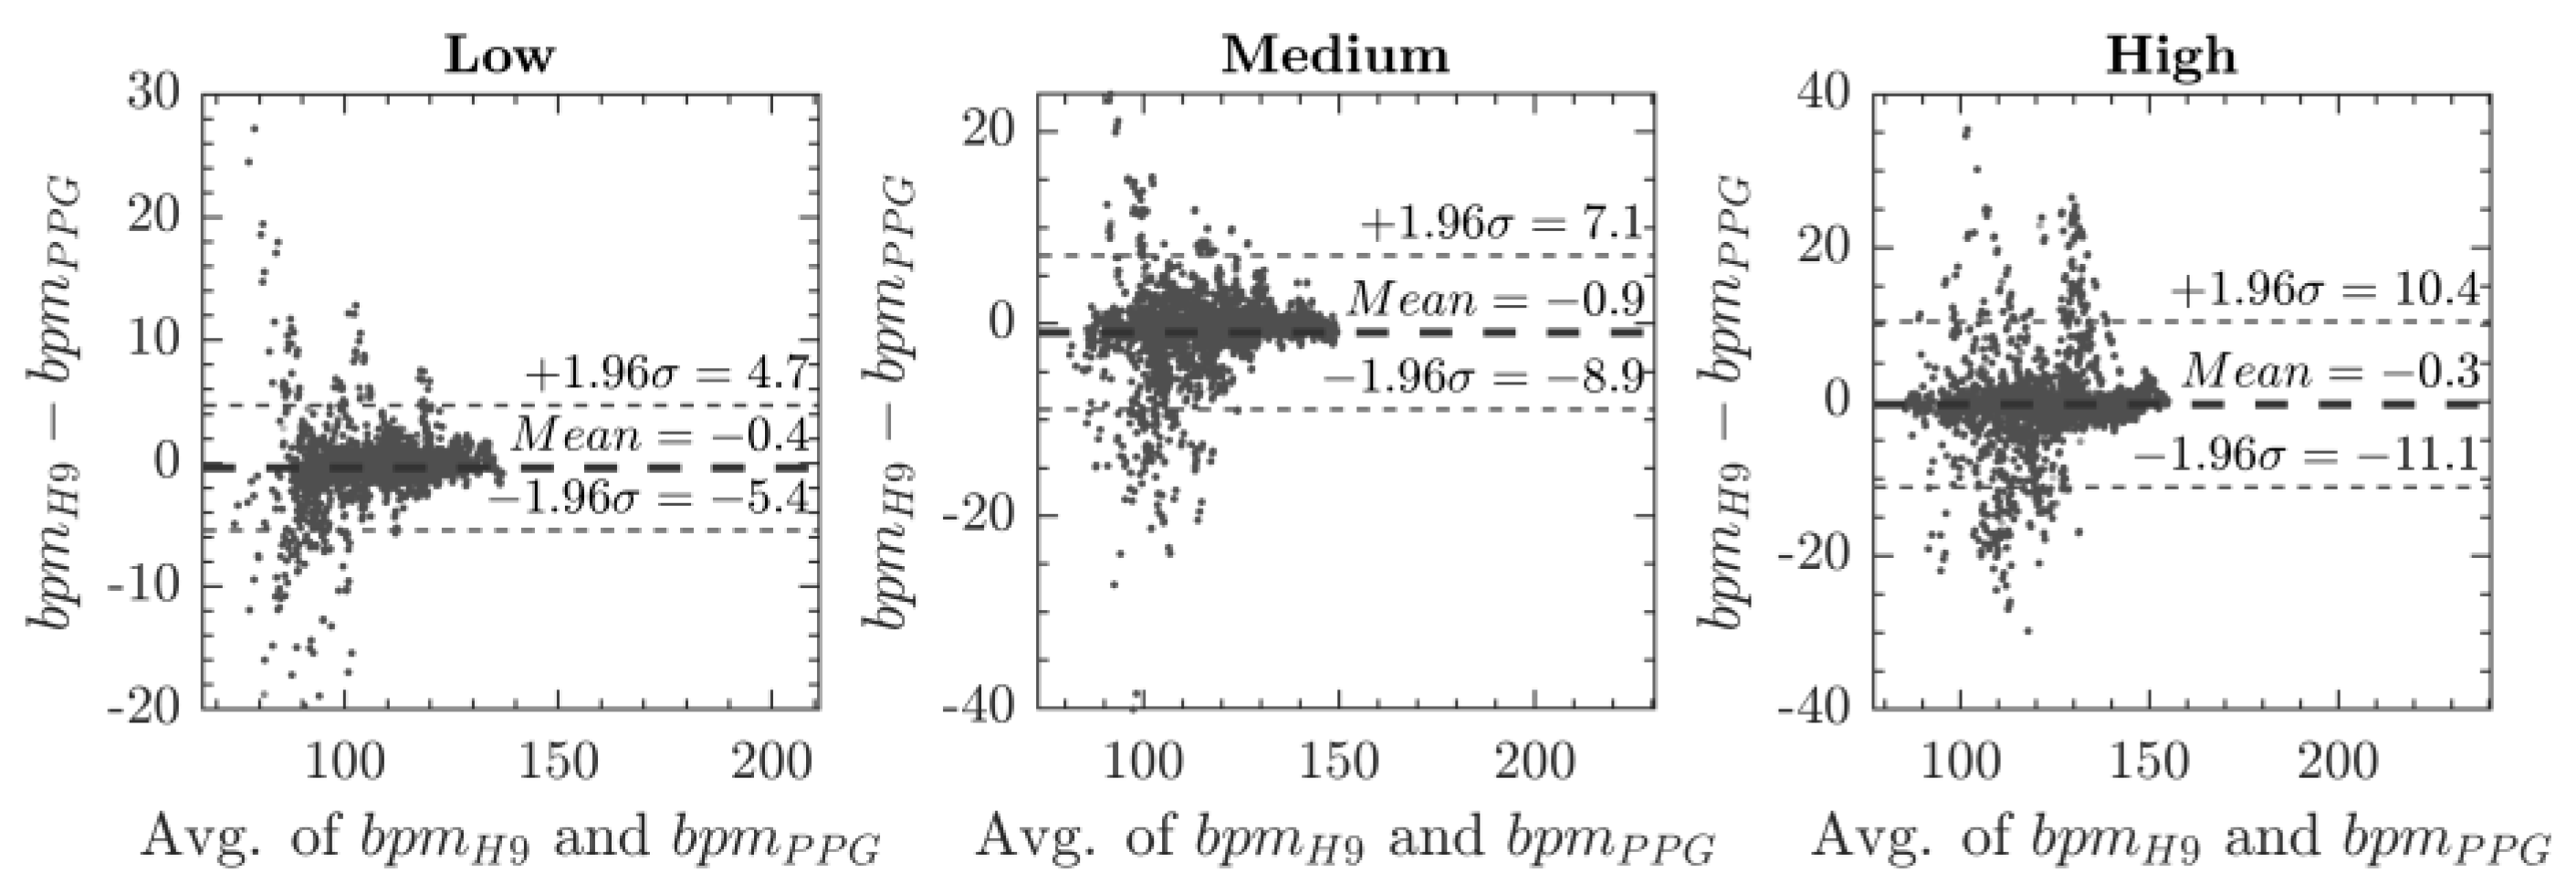
3. Results
4. Discussion
5. Conclusions
Author Contributions
Funding
Acknowledgments
Conflicts of Interest
Abbreviations
| AC | Alternating Component |
| BMI | Body Mass Index |
| CP | Contact Pressure |
| DC | Direct Component |
| ECG | ElectroCardioGraphy |
| HR | Heart Rate |
| LoA | Limit of Agreement |
| MAPE | Mean Average Percentage Error |
| PPG | PhotoPlethysmoGraphy |
| SpO2 | Peripheral oxygen saturation |
References
- Rawassizadeh, R.; Price, B.A.; Petre, M. Wearables: Has The age of smartwatches finally arrived? Commun. ACM 2015, 58, 45–47. [Google Scholar] [CrossRef]
- Piwek, L.; Ellis, D.A.; Andrews, S.; Joinson, A. The Rise of Consumer Health Wearables: Promises and Barriers. PLoS Med. 2016, 13. [Google Scholar] [CrossRef] [PubMed]
- Nascimento, B.; Oliveira, T.; Tam, C. Wearable technology: What explains continuance intention in smartwatches? J. Retail. Consum. Serv. 2018, 43, 157–169. [Google Scholar] [CrossRef]
- Pantelopoulos, A.; Bourbakis, N.G. A survey on wearable sensor-based systems for health monitoring and prognosis. IEEE Trans. Syst. Man Cybern. Part C Appl. Rev. 2010, 40, 1–12. [Google Scholar] [CrossRef]
- Park, S.; Jayaraman, S. Enhancing the Quality of Life Through Wearable Technology. IEEE Eng. Med. Biol. Mag. 2003, 22, 41–48. [Google Scholar] [CrossRef]
- Heikenfeld, J.; Jajack, A.; Rogers, J.; Gutruf, P.; Tian, L.; Pan, T.; Li, R.; Khine, M.; Kim, J.; Wang, J. Wearable sensors: Modalities, challenges, and prospects. Lab Chip 2018, 18, 217–248. [Google Scholar] [CrossRef]
- Ahmad Tarar, A.; Mohammad, U.; Srivastava, S.K. Wearable Skin Sensors and Their Challenges: A Review of Transdermal, Optical, and Mechanical Sensors. Biosensors 2020, 10, 56. [Google Scholar] [CrossRef]
- Camomilla, V.; Bergamini, E.; Fantozzi, S.; Vannozzi, G. Trends supporting the in-field use of wearable inertial sensors for sport performance evaluation: A systematic review. Sensors 2018, 18, 873. [Google Scholar] [CrossRef] [PubMed]
- Tamura, T.; Maeda, Y.; Sekine, M.; Yoshida, M. Wearable photoplethysmographic sensors—Past and present. Electronics 2014, 3, 282–302. [Google Scholar] [CrossRef]
- Ghamari, M. A review on wearable photoplethysmography sensors and their potential future applications in health care. Int. J. Biosens. Bioelectron. 2018, 4, 195–202. [Google Scholar] [CrossRef]
- Alharbi, S.; Hu, S.; Mulvaney, D.; Barrett, L.; Yan, L.; Blanos, P.; Elsahar, Y.; Adema, S. Oxygen saturation measurements from green and orange illuminations of multi-wavelength optoelectronic patch sensors. Sensors 2019, 19, 118. [Google Scholar] [CrossRef] [PubMed]
- Zhang, Y.; Liu, B.; Zhang, Z. Combining ensemble empirical mode decomposition with spectrum subtraction technique for heart rate monitoring using wrist-type photoplethysmography. Biomed. Signal Process. Control 2015, 21, 119–125. [Google Scholar] [CrossRef]
- Schäfer, A.; Vagedes, J. How accurate is pulse rate variability as an estimate of heart rate variability?: A review on studies comparing photoplethysmographic technology with an electrocardiogram. Int. J. Cardiol. 2013, 166, 15–29. [Google Scholar] [CrossRef] [PubMed]
- Gil, E.; Orini, M.; Bailón, R.; Vergara, J.M.; Mainardi, L.; Laguna, P. Photoplethysmography pulse rate variability as a surrogate measurement of heart rate variability during non-stationary conditions. Physiol. Meas. 2010, 31, 9. [Google Scholar] [CrossRef] [PubMed]
- Bolanos, M.; Nazeran, H.; Haltiwanger, E. Comparison of heart rate variability signal features derived from electrocardiography and photoplethysmography in healthy individuals. In Proceedings of the Annual International Conference of the IEEE Engineering in Medicine and Biology Society, New York, NY, USA, 30 August–3 September 2006. [Google Scholar]
- Shelley, K.H. Photoplethysmography: Beyond the calculation of arterial oxygen saturation and heart rate. Anesth. Analg. 2007, 6, 31–36. [Google Scholar] [CrossRef]
- Kasbekar, R.S.; Mendelson, Y. Evaluation of key design parameters for mitigating motion artefact in the mobile reflectance PPG signal to improve estimation of arterial oxygenation. Physiol. Meas. 2018, 39, 7. [Google Scholar] [CrossRef]
- Nye, R.; Zhang, Z.; Fang, Q. Continuous non-invasive blood pressure monitoring using photoplethysmography: A review. In Proceedings of the 4th International Symposium on Bioelectronics and Bioinformatics, Beijing, China, 14–17 October 2015. [Google Scholar]
- Ding, X.R.; Zhang, Y.T.; Liu, J.; Dai, W.X.; Tsang, H.K. Continuous Cuffless Blood Pressure Estimation Using Pulse Transit Time and Photoplethysmogram Intensity Ratio. IEEE Trans. Biomed. Eng. 2016, 63, 964–972. [Google Scholar] [CrossRef]
- Peter, L.; Noury, N.; Cerny, M. A review of methods for non-invasive and continuous blood pressure monitoring: Pulse transit time method is promising? IRBM 2014, 35, 271–282. [Google Scholar] [CrossRef]
- Allen, J. Photoplethysmography and its application in clinical physiological measurement. Physiol. Meas. 2007, 28, 3. [Google Scholar] [CrossRef]
- Pilt, K.; Meigas, K.; Ferenets, R.; Temitski, K.; Viigimaa, M. Photoplethysmographic signal waveform index for detection of increased arterial stiffness. Physiol. Meas. 2014, 35, 10. [Google Scholar] [CrossRef]
- DeVore, A.D.; Wosik, J.; Hernandez, A.F. The Future of Wearables in Heart Failure Patients. JACC Hear. Fail. 2019, 7, 922–932. [Google Scholar] [CrossRef]
- Parak, J.; Korhonen, I. Evaluation of wearable consumer heart rate monitors based on photopletysmography. In Proceedings of the 2014 36th Annual International Conference of the IEEE Engineering in Medicine and Biology Society, Chicago, IL, USA, 26–30 August 2014. [Google Scholar]
- Hwang, S.; Seo, J.O.; Jebelli, H.; Lee, S.H. Feasibility analysis of heart rate monitoring of construction workers using a photoplethysmography (PPG) sensor embedded in a wristband-type activity tracker. Autom. Constr. 2016, 71, 371–381. [Google Scholar] [CrossRef]
- Postema, P.G.; De Jong, J.S.S.G.; Van der Bilt, I.A.C.; Wilde, A.A.M. Accurate electrocardiographic assessment of the QT interval: Teach the tangent. Hear. Rhythm 2008, 5, 1015–1018. [Google Scholar] [CrossRef]
- Lee, Y.K.; Shin, H.S.; Jo, J.; Lee, Y.K. Development of a wristwatch-type PPG array sensor module. In Proceedings of the Digest of Technical Papers - IEEE International Conference on Consumer Electronics, Berlin, Germany, 6–8 September 2011. [Google Scholar]
- Thomas, S.S.; Nathan, V.; Zong, C.; Soundarapandian, K.; Shi, X.; Jafari, R. BioWatch: A Noninvasive Wrist-Based Blood Pressure Monitor That Incorporates Training Techniques for Posture and Subject Variability. IEEE J. Biomed. Heal. Informatics 2016, 20, 1291–1300. [Google Scholar] [CrossRef] [PubMed]
- Lee, H.; Ko, H.; Jeong, C.; Lee, J. Wearable Photoplethysmographic Sensor Based on Different LED Light Intensities. IEEE Sens. J. 2017, 17, 587–588. [Google Scholar] [CrossRef]
- Kim, B.S.; Yoo, S.K. Motion artifact reduction in photoplethysmography using independent component analysis. IEEE Trans. Biomed. Eng. 2006, 53, 566–568. [Google Scholar] [CrossRef] [PubMed]
- Ram, M.R.; Madhav, K.V.; Krishna, E.H.; Komalla, N.R.; Reddy, K.A. A novel approach for motion artifact reduction in PPG signals based on AS-LMS adaptive filter. Proc. IEEE Trans. Instrum. Meas. 2012, 61, 1445–1457. [Google Scholar] [CrossRef]
- Chan, K.W.; Zhang, Y.T. Adaptive Reduction of Motion Artifact from Photoplethysmographic Recordings using a Variable Step-Size LMS Filter. Proc. IEEE Sensors 2002, 2, 1343–1346. [Google Scholar]
- Yan, L.; Hu, S.; Alzahrani, A.; Alharbi, S.; Blanos, P. A multi-wavelength opto-electronic patch sensor to effectively detect physiological changes against human skin types. Biosensors 2017, 7, 22. [Google Scholar] [CrossRef]
- Alzahrani, A.; Hu, S.; Azorin-Peris, V.; Barrett, L.; Esliger, D.; Hayes, M.; Akbare, S.; Achart, J.; Kuoch, S. A multi-channel opto-electronic sensor to accurately monitor heart rate against motion artefact during exercise. Sensors 2015, 15, 25681–25702. [Google Scholar] [CrossRef]
- Cosoli, G.; Spinsante, S.; Scalise, L. Wrist-worn and chest-strap wearable devices: Systematic review on accuracy and metrological characteristics. Meas. J. Int. Meas. Confed. 2020, 159, 107789. [Google Scholar] [CrossRef]
- Sim, J.K.; Ahn, B.; Doh, I. A contact-force regulated photoplethysmography (PPG) platform. AIP Adv. 2018, 8, 045210. [Google Scholar] [CrossRef]
- Hsiu, H.; Hsu, C.L.; Wu, T.L. Effects of different contacting pressure on the transfer function between finger photoplethysmographic and radial blood pressure waveforms. Proc. Inst. Mech. Eng. Part H J. Eng. Med. 2011, 225, 575–583. [Google Scholar] [CrossRef] [PubMed]
- Dresher, R.P.; Mendelson, Y. Reflectance forehead pulse oximetry: Effects of contact pressure during walking. In Proceedings of the Annual International Conference of the IEEE Engineering in Medicine and Biology, New York, NY, USA, 30 August–3 September 2006. [Google Scholar]
- Grabovskis, A.; Marcinkevics, Z.; Rubins, U.; Kviesis-Kipge, E. Effect of probe contact pressure on the photoplethysmographic assessment of conduit artery stiffness. J. Biomed. Opt. 2013, 18, 2. [Google Scholar] [CrossRef] [PubMed]
- Teng, X.F.; Zhang, Y.T. Theoretical study on the effect of sensor contact force on pulse transit time. IEEE Trans. Biomed. Eng. 2007, 54, 1490–1498. [Google Scholar] [CrossRef] [PubMed]
- D’Acquisto, L.; Scardulla, F.; Montinaro, N.; Pasta, S.; Zangla, D.; Bellavia, D. A preliminary investigation of the effect of contact pressure on the accuracy of heart rate monitoring by wearable PPG wrist band. In Proceedings of the 2019 IEEE International Workshop on Metrology for Industry 4.0 and IoT, MetroInd 4.0 and IoT, Naples, Italy, 4–6 June 2019. [Google Scholar]
- Temko, A. Accurate Heart Rate Monitoring during Physical Exercises Using PPG. IEEE Trans. Biomed. Eng. 2017, 64, 2016–2024. [Google Scholar] [CrossRef]
- Teng, X.F.; Zhang, Y.T. The effect of contacting force on photoplethysmographic signals. Physiol. Meas. 2004, 25, 1323. [Google Scholar] [CrossRef]
- Santos, P.; Almeida, V.; Cardoso, J.; Correia, C. Photoplethysmographic logger with contact force and hydrostatic pressure monitoring. In Proceedings of the 3rd Portuguese Bioengineering Meeting, ENBENG, Braga, Portugal, 20–23 February 2013. [Google Scholar]
- Kaur, A.; Arora, A. A Review on Reliability, Security and Future Aspects of Photoplethysmography. In Proceedings of the 2019 2nd International Conference on Intelligent Computing, Instrumentation and Control Technologies, ICICICT, Kannur, Kerala, India, 5–6 July 2019. [Google Scholar]
- Pasta, S.; Blanos, P.; Yan, L.; Hu, S.; Scardulla, F.S.; D’Acquisto, L.; Barrett, L. A novel multi-wavelength procedure for blood pressure estimation using opto-physiological sensor at peripheral arteries and capillaries. In Proceedings of the os SPIE, Design and Quality for Biomedical Technologies XI, San Francisco, CA, USA, 19 February 2018. [Google Scholar]
- Fallow, B.A.; Tarumi, T.; Tanaka, H. Influence of skin type and wavelength on light wave reflectance. J. Clin. Monit. Comput. 2013, 27, 313–317. [Google Scholar] [CrossRef]
- Liu, H.; Shah, S.; Jiang, W. On-line outlier detection and data cleaning. Comput. Chem. Eng. 2004, 28, 1635–1647. [Google Scholar] [CrossRef]
- Pearson, R.K. Outliers in process modeling and identification. IEEE Trans. Control Syst. Technol. 2002, 10, 55–63. [Google Scholar] [CrossRef]
- Martin Bland, J.; Altman, D.G. Statistical Methods for Assessing Agreement Between Two Methods of Clinical Measurement. Lancet 1986, 327, 307–310. [Google Scholar] [CrossRef]
- Lee, C.M.; Gorelick, M.; Mendoza, A. Accuracy of an infrared led device to measure heart rate and energy expenditure during rest and exercise. J. Sports Sci. 2011, 29, 1645–1653. [Google Scholar] [CrossRef] [PubMed]
- Stahl, S.E.; An, H.-S.; Dinkel, D.M.; Noble, J.M.; Lee, J.-M. How accurate are the wrist-based heart rate monitors during walking and running activities? Are they accurate enough? BMJ Open Sport Exerc. Med. 2016, 2, 1. [Google Scholar] [CrossRef]
- Tamura, T.; Sekine, M.; Maeda, Y.; Mizutani, K. The Effect of Contact Pressure to the Photoplethysmographic Sensor During Walking. Trans. Jpn. Soc. Med. Biol. Eng. 2013, 51, 307. [Google Scholar]
- Zhang, Z.; Pi, Z.; Liu, B. TROIKA: A general framework for heart rate monitoring using wrist-type photoplethysmographic signals during intensive physical exercise. IEEE Trans. Biomed. Eng. 2015, 62, 522–531. [Google Scholar] [CrossRef] [PubMed]
- Gatti, U.C.; Schneider, S.; Migliaccio, G.C. Physiological condition monitoring of construction workers. Autom. Constr. 2014, 44, 227–233. [Google Scholar] [CrossRef]
- Johnstone, J.A.; Ford, P.A.; Hughes, G.; Watson, T.; Mitchell, A.C.S.; Garrett, A.T. Field based reliability and validity of the bioharness™ multivariable monitoring device. J. Sport. Sci. Med. 2012, 11, 643–652. [Google Scholar]
- Brookes, C.N.; Whittaker, J.D.; Moulton, C.; Dodds, D. The PEP respiratory monitor: A validation study. Emerg. Med. J. 2003, 20, 326–328. [Google Scholar] [CrossRef]
- Nelson, B.W.; Low, C.A.; Jacobson, N.; Areán, P.; Torous, J.; Allen, N.B. Guidelines for wrist-worn consumer wearable assessment of heart rate in biobehavioral research. NPJ Digit. Med. 2020, 3, 90. [Google Scholar] [CrossRef]


| Pearson Correlation Coefficient | |||
|---|---|---|---|
| Exercise Rate | CP1 | CP2 | CP3 |
| 90 bpm | 0.56 | 0.93 | 0.95 |
| 120 bpm | 0.32 | 0.89 | 0.94 |
| 140 bpm | 0.28 | 0.76 | 0.81 |
| MAPE (σ) | |||
|---|---|---|---|
| Exercise Rate | CP1 | CP2 | CP3 |
| 90 bpm | 8.9% (4.4) | 2.4% (2.7) | 2.4% (3.2) |
| 120 bpm | 10.3% (4.9) | 3.5% (3.5) | 2.7% (3.0) |
| 140 bpm | 11.8% (6.2) | 4.6% (5.3) | 3.8% (3.8) |
| Lowest Individual MAPE | |||
|---|---|---|---|
| Exercise Rate | CP1 | CP2 | CP3 |
| 90 bpm | n = 0 | n = 9 | n = 8 |
| 120 bpm | n = 1 | n = 4 | n = 12 |
| 140 bpm | n = 0 | n = 6 | n = 11 |
| Bland–Altman Mean (± 1.96 σ) | MAPE Err % (σ) | |||
|---|---|---|---|---|
| Exercise Rate | CP3 | Optimal CP | CP3 | Optimal CP |
| 90 bpm | −0.3 (±9.4) | −0.4 (±5.0) | 2.4% (3.2) | 1.3% (1.9) |
| 120 bpm | −1.0 (±10.0) | −0.9 (±8.0) | 2.7% (3.0) | 2.1% (2.5) |
| 140 bpm | 1.3 (±16.2) | 0.3 (±10.7) | 3.8% (3.8) | 2.3% (2.6) |
© 2020 by the authors. Licensee MDPI, Basel, Switzerland. This article is an open access article distributed under the terms and conditions of the Creative Commons Attribution (CC BY) license (http://creativecommons.org/licenses/by/4.0/).
Share and Cite
Scardulla, F.; D’Acquisto, L.; Colombarini, R.; Hu, S.; Pasta, S.; Bellavia, D. A Study on the Effect of Contact Pressure during Physical Activity on Photoplethysmographic Heart Rate Measurements. Sensors 2020, 20, 5052. https://doi.org/10.3390/s20185052
Scardulla F, D’Acquisto L, Colombarini R, Hu S, Pasta S, Bellavia D. A Study on the Effect of Contact Pressure during Physical Activity on Photoplethysmographic Heart Rate Measurements. Sensors. 2020; 20(18):5052. https://doi.org/10.3390/s20185052
Chicago/Turabian StyleScardulla, Francesco, Leonardo D’Acquisto, Raffaele Colombarini, Sijung Hu, Salvatore Pasta, and Diego Bellavia. 2020. "A Study on the Effect of Contact Pressure during Physical Activity on Photoplethysmographic Heart Rate Measurements" Sensors 20, no. 18: 5052. https://doi.org/10.3390/s20185052
APA StyleScardulla, F., D’Acquisto, L., Colombarini, R., Hu, S., Pasta, S., & Bellavia, D. (2020). A Study on the Effect of Contact Pressure during Physical Activity on Photoplethysmographic Heart Rate Measurements. Sensors, 20(18), 5052. https://doi.org/10.3390/s20185052