The Probability of Ischaemic Stroke Prediction with a Multi-Neural-Network Model


Abstract
1. Introduction
1.1. Related Work
1.2. Novelty and Contributions
2. Materials and Method
2.1. Dataset
2.2. Experimental Design
2.2.1. Overall Architecture of Proposed Model
2.2.2. The First Part: Feature Extraction
2.2.3. The Second Part: Prediction of Incidence Probability of Stroke
3. Results
3.1. Results of Training a Model for Extracting Features from Streaming Data
3.2. Results of Training a Model for Extracting Features from Structured Data
3.3. Results of Training a Model for Feature Fusion
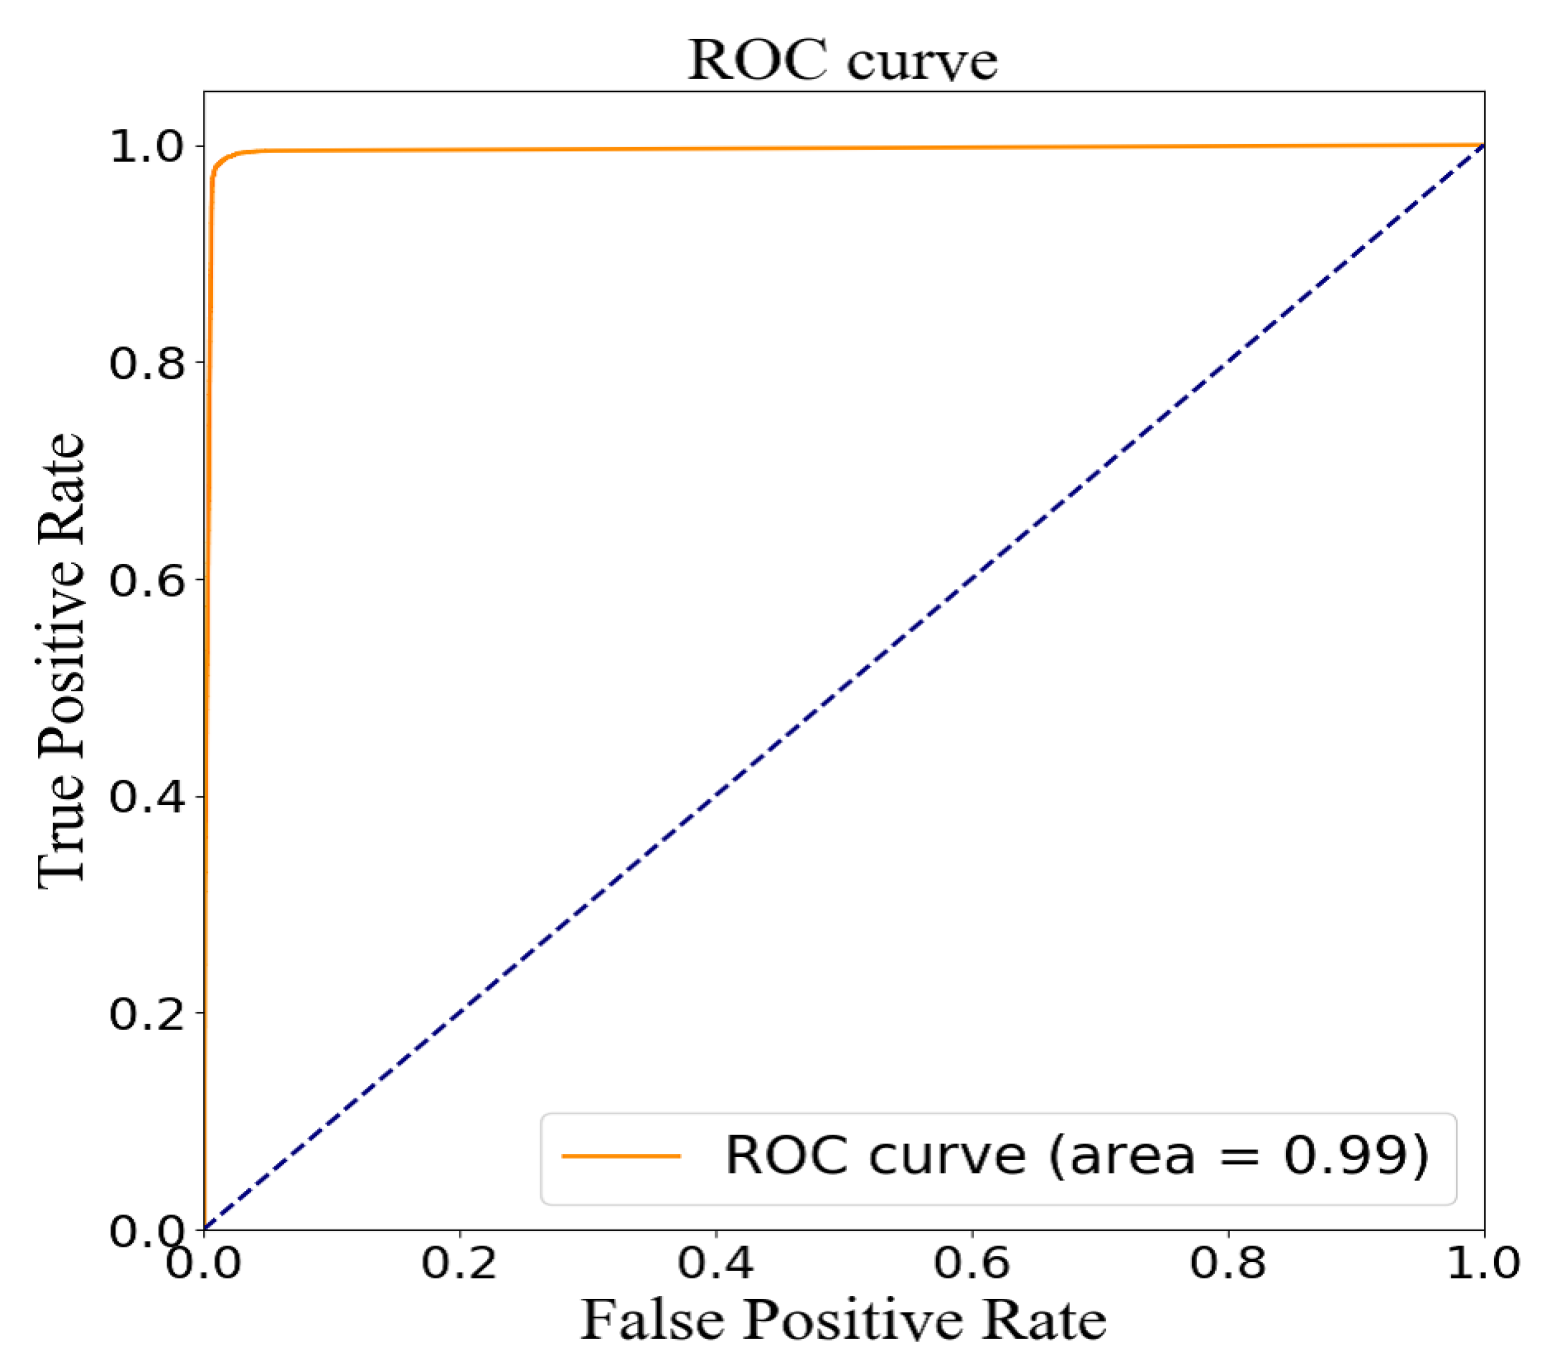
3.4. Model Evaluation
4. Discussion
5. Conclusions
Author Contributions
Funding
Conflicts of Interest
Appendix A. Additional Tables

| Subject Number | HTN Patient Medical History | Group | Age | Height | Mass | BMI | Gender | Race | DM/Non-DM STROKE |
|---|---|---|---|---|---|---|---|---|---|
| S0030 | YES | CONTROL | 64 | 1.6256 | 72.5747792 | 27.46365545 | F | White | Non-DM |
| S0064 | YES | CONTROL | 76 | 1.7018 | 68.0388555 | 23.49308018 | M | White | Non-DM |
| S0068 | NO | CONTROL | 79 | 1.5748 | 64.86370891 | 26.15477364 | F | White | Non-DM |
| S0121 | NO | CONTROL | 65 | 1.8288 | 72.5747792 | 21.69967838 | M | White | Non-DM |
| S0153 | NO | CONTROL | 71 | 1.7018 | 66.67807839 | 23.02321858 | F | White | Non-DM |
| S0154 | YES | CONTROL | 71 | 1.7526 | 80.73944186 | 26.28573518 | M | White | Non-DM |
| S0160 | NO | CONTROL | 72 | 1.8288 | 106.594207 | 31.87140263 | F | White | Non-DM |
| S0163 | YES | CONTROL | 73 | 1.651 | 84.82177319 | 31.11810921 | F | White | Non-DM |
| S0164 | NO | CONTROL | 60 | 1.651 | 63.5029318 | 23.29698015 | F | White | Non-DM |
| S0165 | YES | CONTROL | 75 | 1.7018 | 53.97749203 | 18.63784361 | F | White | Non-DM |
| S0166 | NO | CONTROL | 76 | 1.651 | 73.48196394 | 26.95793418 | M | White | Non-DM |
| S0172 | NO | CONTROL | 71 | 1.49 | 58.9670081 | 26.56051894 | F | Asian | Non-DM |
| S0174 | YES | CONTROL | 71 | 1.7018 | 67.58526313 | 23.33645965 | M | White | Non-DM |
| S0175 | YES | STROKE | 64 | 1.778 | 77.1107029 | 24.39220991 | M | White | STROKE |
| S0176 | NO | CONTROL | 68 | 1.778 | 90.718474 | 28.69671754 | M | White | Non-DM |
| S0183 | NO | CONTROL | 60 | 1.6256 | 64.41011654 | 24.37399422 | F | White | Non-DM |
| S0184 | NO | CONTROL | 68 | 1.7018 | 64.41011654 | 22.24011591 | F | White | Non-DM |
| S0185 | YES | STROKE | 72 | 1.778 | 77.1107029 | 24.39220991 | M | White | STROKE |
| S0187 | NO | CONTROL | 65 | 1.6002 | 60.78137758 | 23.73679105 | F | White | Non-DM |
| S0194 | NO | CONTROL | 64 | 1.778 | 95.2543977 | 30.13155341 | M | White | Non-DM |
| S0197 | NO | CONTROL | 65 | 1.5494 | 58.9670081 | 24.56303288 | F | White | Non-DM |
| S0199 | YES | STROKE | 77 | 1.7526 | 87.08973504 | 28.35315255 | M | White | STROKE |
| S0200 | NO | CONTROL | 70 | 1.8034 | 76.20351816 | 23.43100365 | M | White | Non-DM |
| S0203 | YES | CONTROL | 72 | 1.8034 | 70.30681735 | 21.61789027 | M | White | Non-DM |
| S0204 | YES | CONTROL | 80 | 1.7653 | 67.13167076 | 21.54221785 | M | White | Non-DM |
| S0205 | YES | STROKE | 63 | 1.6002 | 53.97749203 | 21.07968757 | F | Asian | STROKE |
| S0207 | YES | CONTROL | 75 | 1.6764 | 54.88467677 | 19.52971055 | F | AA | Non-DM |
| S0208 | NO | CONTROL | 67 | 1.651 | 70.30681735 | 25.79308517 | F | White | Non-DM |
| Subject | HTN Patient | Group | Age | Height | Mass | BMI | Gender | Race | DM/Non-DM |
|---|---|---|---|---|---|---|---|---|---|
| Number | Medical History | STROKE | |||||||
| S0210 | NO | CONTROL | 72 | 1.6256 | 71.66759446 | 27.12035976 | F | White | Non-DM |
| S0212 | YES | CONTROL | 65 | 1.6002 | 53.97749203 | 21.07968757 | F | White | Non-DM |
| S0213 | NO | CONTROL | 71 | 1.8542 | 95.2543977 | 27.70587572 | M | White | Non-DM |
| S0214 | YES | STROKE | 62 | 1.7018 | 61.23496995 | 21.14377217 | F | White | STROKE |
| S0215 | YES | CONTROL | 61 | 1.6002 | 90.718474 | 35.42804634 | F | White | Non-DM |
| S0218 | NO | CONTROL | 70 | 1.6002 | 90.718474 | 35.42804634 | F | White | Non-DM |
| S0221 | NO | CONTROL | 71 | 1.6 | 54.88467677 | 21.43932686 | F | White | Non-DM |
| S0225 | NO | CONTROL | 66 | 1.524 | 64.41011654 | 27.73218897 | F | AA | Non-DM |
| S0227 | YES | CONTROL | 66 | 1.5494 | 67.13167076 | 27.9640682 | F | AA | Non-DM |
| S0228 | NO | CONTROL | 61 | 1.8034 | 79.37866475 | 24.40729546 | M | White | Non-DM |
| S0230 | YES | STROKE | 76 | 1.7272 | 72.5747792 | 24.32766712 | M | White | STROKE |
| S0231 | YES | STROKE | 64 | 1.6764 | 76.20351816 | 27.11563117 | M | White | STROKE |
| S0232 | YES | STROKE | 70 | 1.6256 | 63.5029318 | 24.03069852 | F | White | STROKE |
| S0239 | YES | STROKE | 77 | 1.7018 | 70.30681735 | 24.27618286 | M | White | STROKE |
| S0240 | NO | STROKE | 60 | 1.6764 | 99.7903214 | 35.50856463 | F | White | STROKE |
| S0242 | YES | CONTROL | 61 | 1.778 | 77.1107029 | 24.39220991 | M | AA | Non-DM |
| S0243 | YES | CONTROL | 62 | 1.7 | 77.11 | 26.6816609 | M | Asian | Non-DM |
| S0244 | NO | STROKE | 71 | 1.57 | 72.57 | 29.44135665 | F | AA | STROKE |
| S0247 | YES | STROKE | 79 | 1.695 | 72.25 | 25.14771017 | M | White | STROKE |
| S0248 | YES | STROKE | 80 | 1.68 | 69.85 | 24.74844104 | F | White | STROKE |
| S0277 | YES | STROKE | 67 | 1.6 | 99.6 | 38.90625 | F | AA | STROKE |
| S0305 | NO | CONTROL | 52 | 1.63 | 83.65 | 31.48406037 | M | Asian | Non-DM |
| S0321 | NO | STROKE | 54 | 1.75 | 112.35 | 36.68571429 | M | White | STROKE |
| S0322 | YES | STROKE | 78 | 1.61 | 65.9 | 25.42340187 | F | White | STROKE |
| S0324 | YES | STROKE | 62 | 1.7 | 84.5 | 29.23875433 | M | White | STROKE |
| S0332 | YES | STROKE | 73 | 1.67 | 66.5 | 23.84452652 | F | White | STROKE |
| S0334 | NO | STROKE | 59 | 1.57 | 63 | 25.5588462 | F | White | STROKE |
| S0337 | NO | STROKE | 67 | 1.68 | 78.45 | 27.7954932 | M | White | STROKE |
| S0340 | NO | STROKE | 50 | 1.68 | 75.85 | 26.87429138 | F | AA | STROKE |
| S0343 | YES | CONTROL | 66 | 1.63 | 66.2 | 24.91625579 | F | White | Non-DM |
| S0348 | YES | STROKE | 72 | 1.68 | 51.5 | 18.24688209 | M | white | STROKE |
| S0351 | YES | STROKE | 53 | 1.66 | 85.9 | 31.17288431 | M | white | STROKE |
| S0352 | NO | STROKE | 66 | 1.47 | 49.89 | 23.08760239 | F | white | STROKE |
| S0353 | YES | STROKE | 65 | 1.56 | 79.25 | 32.56492439 | F | white | STROKE |
| S0354 | NO | STROKE | 54 | 1.65 | 66.3 | 24.35261708 | F | white | STROKE |
| S0355 | YES | STROKE | 67 | 1.75 | 83.91 | 27.39918367 | M | AA | STROKE |
| S0358 | YES | STROKE | 80 | 1.57 | 61.2 | 24.82859345 | F | white | STROKE |
| S0361 | YES | STROKE | 71 | 1.74 | 81.45 | 26.90249703 | M | WHITE | STROKE |
| S0363 | YES | STROKE | 55 | 1.56 | 94.55 | 38.85190664 | F | white | STROKE |
| S0364 | NO | CONTROL | 63 | 1.8 | 106.55 | 32.88580247 | M | WHITE | Non-DM |
| S0371 | YES | STROKE | 66 | 1.67 | 96.2 | 34.49388648 | M | WHITE | STROKE |
| S0374 | YES | STROKE | 64 | 1.57 | 61 | 24.74745426 | F | WHITE | STROKE |
| S0376 | YES | CONTROL | 70 | 1.83 | 77.27 | 23.07324793 | M | WHITE | Non-DM |
| S0378 | NO | STROKE | 58 | 1.68 | 78.2 | 27.7069161 | M | WHITE | STROKE |
| S0379 | YES | STROKE | 58 | 1.74 | 75.38 | 24.89760867 | M | AA | STROKE |
| S0380 | YES | STROKE | 69 | 1.74 | 85.15 | 28.12458713 | M | WHITE | STROKE |
| S0388 | YES | STROKE | 61 | 1.62 | 67.9 | 25.8725804 | F | WHITE | STROKE |
| S0389 | YES | STROKE | 50 | 1.67 | 107.2 | 38.43809387 | F | WHITE | STROKE |
| S0397 | YES | STROKE | 74 | 1.83 | 90.7 | 27.08351996 | M | WHITE | STROKE |
| S0399 | NO | CONTROL | 51 | 1.81 | 68.75 | 20.98531791 | F | WHITE | Non-DM |
| S0402 | NO | STROKE | 54 | 1.82 | 96.45 | 29.11786016 | M | WHITE | STROKE |
| Subject | Previous | Current | Pack Years | Previous | Alcohol | Neuropathy |
|---|---|---|---|---|---|---|
| Number | Tobacco Use | Tobacco Use | Alcohol Use | Dose (Week) | Symptoms | Autonomic Symptoms |
| S0030 | NO | NO | 0 | YES | 0 | NO |
| S0064 | NO | NO | 0 | YES | 0 | NO |
| S0068 | NO | NO | 0 | NO | 0 | NO |
| S0121 | NO | NO | 0 | YES | 3 | NO |
| S0153 | NO | NO | 0 | NO | 0 | NO |
| S0154 | NO | NO | 0 | NO | 0 | NO |
| S0160 | NO | NO | 0 | NO | 0 | NO |
| S0163 | NO | NO | 0 | YES | 0 | NO |
| S0164 | YES | NO | 0 | YES | 15 | NO |
| S0165 | YES | NO | 0 | YES | 7 | NO |
| S0166 | NO | NO | 0 | NO | 0 | NO |
| S0172 | NO | NO | 0 | NO | 0 | NO |
| S0174 | NO | NO | 0 | NO | 0 | NO |
| S0175 | YES | NO | 35 | YES | 20 | NO |
| S0176 | YES | NO | 15 | YES | 5 | NO |
| S0183 | YES | YES | 41 | NO | 0 | NO |
| S0184 | NO | NO | 0 | YES | 0 | NO |
| S0185 | YES | NO | 60 | YES | 70 | NO |
| S0187 | NO | NO | 0 | YES | 0 | NO |
| S0194 | NO | NO | 0 | YES | 3 | YES |
| S0197 | NO | NO | 0 | NO | 0 | NO |
| S0199 | YES | NO | 56 | NO | 0 | NO |
| S0200 | NO | NO | 0 | NO | 0 | NO |
| S0203 | NO | NO | 0 | NO | 0 | NO |
| S0204 | NO | NO | 0 | YES | 7 | NO |
| S0205 | YES | NO | 0 | YES | 0 | NO |
| S0207 | NO | NO | 0 | YES | 1 | NO |
| S0208 | YES | NO | 27 | YES | 0 | NO |
| S0210 | YES | NO | 160 | NO | 0 | YES |
| S0212 | NO | NO | 0 | YES | 0 | YES |
| S0213 | YES | NO | 9 | YES | 0 | NO |
| S0214 | YES | NO | 28.57 | YES | 7 | NO |
| S0215 | YES | NO | 30 | YES | 0 | NO |
| S0218 | YES | YES | 11 | NO | 0 | YES |
| S0221 | NO | NO | 0 | YES | 7 | NO |
| S0225 | NO | NO | 0 | YES | 0 | NO |
| S0227 | NO | NO | 0 | YES | 1 | NO |
| S0228 | NO | NO | 0 | YES | 0 | NO |
| S0230 | YES | NO | 8.6 | YES | 4 | NO |
| S0231 | NO | NO | 0 | YES | 3 | NO |
| S0232 | NO | NO | 0 | YES | 2 | NO |
| S0239 | NO | NO | 0 | NO | 0 | NO |
| S0240 | YES | NO | 48 | NO | 0 | YES |
| S0242 | NO | NO | 0 | YES | 2 | NO |
| S0243 | YES | NO | 1 | YES | 1 | NO |
| S0244 | NO | NO | 0 | YES | 1 | NO |
| S0247 | YES | YES | 60 | YES | 2.5 | NO |
| S0248 | NO | NO | 0 | NO | 0 | NO |
| S0277 | NO | NO | 0 | YES | 0 | NO |
| S0305 | NO | NO | 0 | NO | 0 | NO |
| S0321 | NO | YES | 30.86 | YES | 7 | YES |
| S0322 | NO | NO | 0 | YES | 4 | NO |
| S0324 | YES | NO | 86 | YES | 0 | NO |
| S0332 | YES | NO | 30 | YES | 2 | NO |
| S0334 | YES | NO | 60 | NO | 0 | NO |
| S0337 | YES | NO | 66 | YES | 49 | NO |
| S0340 | YES | NO | 0.1667 | YES | 2 | NO |
| S0343 | YES | NO | 10.5 | YES | 0 | NO |
| Subject | Dizziness | Numbness | Painful Feet | Syncope |
|---|---|---|---|---|
| Number | Autonomic Symptoms | Autonomic Symptoms | Autonomic Symptoms | Autonomic Symptoms |
| S0030 | NO | NO | NO | NO |
| S0064 | NO | NO | NO | NO |
| S0068 | NO | NO | NO | NO |
| S0121 | YES | YES | NO | NO |
| S0153 | NO | NO | NO | YES |
| S0154 | NO | NO | NO | YES |
| S0160 | NO | NO | NO | NO |
| S0163 | NO | NO | NO | NO |
| S0164 | NO | NO | YES | NO |
| S0165 | NO | NO | NO | NO |
| S0166 | NO | YES | NO | NO |
| S0172 | NO | NO | NO | NO |
| S0174 | NO | NO | NO | NO |
| S0175 | YES | NO | NO | NO |
| S0176 | YES | NO | NO | NO |
| S0183 | NO | NO | NO | NO |
| S0184 | YES | NO | NO | NO |
| S0185 | YES | NO | NO | NO |
| S0187 | NO | NO | NO | NO |
| S0194 | YES | YES | YES | NO |
| S0197 | NO | NO | NO | NO |
| S0199 | NO | NO | NO | NO |
| S0200 | YES | NO | NO | NO |
| S0203 | NO | NO | NO | NO |
| S0204 | NO | NO | NO | NO |
| S0205 | NO | NO | NO | NO |
| S0207 | NO | NO | NO | NO |
| S0208 | NO | NO | NO | YES |
| S0210 | NO | NO | NO | NO |
| S0212 | NO | NO | NO | NO |
| S0213 | YES | NO | NO | NO |
| S0214 | NO | NO | NO | NO |
| S0215 | NO | NO | NO | NO |
| S0218 | YES | NO | NO | YES |
| S0221 | YES | NO | NO | YES |
| S0225 | NO | NO | NO | NO |
| S0227 | NO | NO | NO | NO |
| S0228 | NO | NO | NO | NO |
| S0230 | YES | NO | NO | NO |
| S0231 | YES | NO | NO | NO |
| S0232 | YES | NO | NO | NO |
| S0239 | NO | NO | NO | NO |
| S0240 | YES | YES | NO | NO |
| S0242 | NO | NO | NO | NO |
| S0243 | NO | NO | NO | NO |
| S0244 | NO | NO | NO | NO |
| S0247 | NO | NO | NO | NO |
| S0248 | NO | NO | NO | NO |
| S0277 | YES | NO | NO | NO |
| S0305 | NO | NO | NO | NO |
| S0321 | NO | YES | NO | NO |
| S0322 | YES | NO | NO | NO |
| S0324 | YES | NO | NO | NO |
| S0332 | NO | NO | NO | NO |
| S0334 | NO | NO | NO | NO |
| S0337 | YES | NO | NO | YES |
| S0340 | NO | NO | NO | NO |
| S0343 | NO | NO | NO | NO |
| Subject | OH Autonomic | Cancer Family | CancSpec | HeartDisease | Hdspecific | HTN Family |
|---|---|---|---|---|---|---|
| Number | Symptoms | History | Family History | Family History | Family History | History |
| S0030 | NO | 0 | 0 | 0 | ||
| S0064 | NO | 0 | 2 | b | 0 | |
| S0068 | NO | 3 | f, m, si | 0 | 0 | |
| S0121 | NO | 0 | 0 | 1 | ||
| S0153 | YES | 2 | gp, f | 1 | m | 0 |
| S0154 | YES | 0 | 0 | 0 | ||
| S0160 | YES | 0 | 4 | gp | 0 | |
| S0163 | NO | 0 | 1 | f | 2 | |
| S0164 | NO | 1 | f | 1 | gp | 0 |
| S0165 | YES | 0 | 1 | f | 2 | |
| S0166 | YES | 1 | gp | 0 | 0 | |
| S0172 | YES | 0 | 0 | 0 | ||
| S0174 | YES | 0 | 0 | 0 | ||
| S0175 | NO | 2 | f, si | 0 | 0 | |
| S0176 | YES | 3 | f, m, si | 1 | gp | 0 |
| S0183 | YES | 1 | m | 1 | f | 1 |
| S0184 | YES | 2 | gp, si | 1 | f | 1 |
| S0185 | YES | 0 | 1 | f | 0 | |
| S0187 | NO | 0 | 0 | 1 | ||
| S0194 | YES | 3 | f, m, si | 1 | b | 0 |
| S0197 | YES | 1 | f | 1 | f | 0 |
| S0199 | YES | 0 | 0 | 0 | ||
| S0200 | YES | 1 | si | 1 | f | 0 |
| S0203 | YES | 0 | 1 | f | 1 | |
| S0204 | YES | 0 | 1 | f | 1 | |
| S0205 | YES | 1 | m | 1 | gp | 0 |
| S0207 | NO | 0 | 1 | m | 3 | |
| S0208 | NO | 0 | 1 | gp | 1 | |
| S0210 | NO | 2 | gp,m | 1 | gp | 0 |
| S0212 | NO | 1 | gp | 1 | gp | 2 |
| S0213 | NO | 0 | 1 | f | 0 | |
| S0214 | NO | 2 | gp,si | 1 | m | 3 |
| S0215 | NO | 0 | 0 | 0 | ||
| S0218 | NO | 2 | gp,m | 1 | gp | 0 |
| S0221 | NO | 1 | gp | 1 | f | 1 |
| S0225 | NO | 0 | 0 | 1 | ||
| S0227 | NO | 0 | 1 | m | 1 | |
| S0228 | NO | 1 | m | 0 | 0 | |
| S0230 | NO | 0 | 0 | 0 | ||
| S0231 | YES | 3 | f, m, si | 1 | gp | 2 |
| S0232 | YES | 0 | 1 | f | 0 | |
| S0239 | NO | 0 | 0 | 0 | ||
| S0240 | YES | 0 | 1 | b | 0 | |
| S0242 | NO | 0 | 0 | 1 | ||
| S0243 | NO | 0 | 1 | b | 1 | |
| S0244 | NO | 1 | b | 1 | si | 1 |
| S0247 | NO | 0 | 0 | 0 | ||
| S0248 | NO | 0 | 1 | f | 0 | |
| S0277 | NO | 1 | gp | 1 | f | 2 |
| S0305 | NO | 0 | 0 | 0 | ||
| S0321 | NO | 0 | 0 | 1 | ||
| S0322 | YES | 1 | m | 1 | f | 2 |
| S0324 | NO | 0 | 1 | gp | 1 | |
| S0332 | NO | 0 | 1 | f | 0 | |
| S0334 | NO | 0 | 1 | f | 0 | |
| S0337 | NO | 2 | si,si | 1 | si | 0 |
| S0340 | NO | 0 | 1 | gp | 1 | |
| S0343 | NO | 2 | b,si | 1 | gp | 2 |
| Subject | HTNspecific | DM Family | Dmspecific | StrokeFAMILY | StrokeSpecific | HTN Years Patient |
|---|---|---|---|---|---|---|
| Number | Family History | History | Family History | Family History | Family History | Medical History |
| S0030 | 0 | 0 | 4 | |||
| S0064 | 0 | 0 | 0 | |||
| S0068 | 0 | 0 | 0 | |||
| S0121 | b | 1 | f | 1 | f | 0 |
| S0153 | 0 | 0 | 0 | |||
| S0154 | 1 | f | 0 | 2 | ||
| S0160 | 0 | 0 | 0 | |||
| S0163 | f, m | 0 | 0 | 50 | ||
| S0164 | 0 | 0 | 0 | |||
| S0165 | gp, m | 0 | 1 | f | 4 | |
| S0166 | 2 | gp, b | 0 | 0 | ||
| S0172 | 0 | 0 | 0 | |||
| S0174 | 0 | 0 | 15 | |||
| S0175 | 0 | 0 | 0 | |||
| S0176 | 0 | 1 | si | 0 | ||
| S0183 | m | 1 | m | 0 | 0 | |
| S0184 | si | 0 | 0 | 0 | ||
| S0185 | 0 | 1 | m | 3 | ||
| S0187 | m | 0 | 1 | m | 0 | |
| S0194 | 1 | gp | 0 | 0 | ||
| S0197 | 1 | m | 0 | 0 | ||
| S0199 | 0 | 0 | 0 | |||
| S0200 | 0 | 0 | 0 | |||
| S0203 | f | 0 | 1 | m | 8 | |
| S0204 | so | 1 | so | 0 | 6 | |
| S0205 | 0 | 0 | 0 | |||
| S0207 | gp,f,m | 2 | gp,m | 3 | f,b,si | 10 |
| S0208 | f | 0 | 0 | 0 | ||
| S0210 | 1 | gp | 0 | 0 | ||
| S0212 | gp,si | 0 | 1 | si | 3 | |
| S0213 | 0 | 0 | 0 | |||
| S0214 | f,m,si | 1 | b | 1 | f | 0 |
| S0215 | 0 | 0 | 3 | |||
| S0218 | 1 | gp | 0 | 0 | ||
| S0221 | m | 2 | gp,f | 0 | 0 | |
| S0225 | gp | 0 | 1 | gp | 0 | |
| S0227 | m | 0 | 1 | m | 16 | |
| S0228 | 1 | f | 1 | f | 0 | |
| S0230 | 0 | 0 | 0 | |||
| S0231 | m, si | 1 | si | 2 | m, si | 6 |
| S0232 | 3 | f, b, si | 0 | 6 | ||
| S0239 | 0 | 0 | 21 | |||
| S0240 | 0 | 1 | gp | 0 | ||
| S0242 | b | 0 | 0 | 25 | ||
| S0243 | b | 0 | 0 | 26 | ||
| S0244 | b | 4 | m,b,so,si | 1 | m | 0 |
| S0247 | 0 | 0 | 1 | |||
| S0248 | 0 | 0 | 2 | |||
| S0277 | f,m | 1 | m | 0 | 24 | |
| S0305 | 1 | f | 0 | 0 | ||
| S0321 | f | 0 | 1 | f | 0 | |
| S0322 | m,b | 0 | 1 | b | 20 | |
| S0324 | gp | 0 | 0 | 47 | ||
| S0332 | 0 | 0 | 1 | |||
| S0334 | 1 | gp | 0 | 0 | ||
| S0337 | 0 | 1 | m | 0 | ||
| S0340 | m | 1 | f | 1 | m | 0 |
| S0343 | gp,m | 1 | gp | 0 | 1 |
| Subject | Cancer Patient | Stroke Patient | Stroke | Atrial Fibtrillation | Heart Failure = CHF | DM Patient |
|---|---|---|---|---|---|---|
| Number | Medical History | Medical History | Years | Patient Medical | /Ifarction = -MI Patient | Medical History |
| History | Medical History | |||||
| S0030 | NO | NO | 0 | NO | NO | NO |
| S0064 | NO | NO | 0 | NO | NO | NO |
| S0068 | NO | NO | 0 | NO | NO | NO |
| S0121 | NO | NO | 0 | NO | NO | NO |
| S0153 | NO | NO | 0 | NO | NO | NO |
| S0154 | NO | NO | 0 | NO | NO | NO |
| S0160 | YES | NO | 0 | NO | NO | NO |
| S0163 | NO | NO | 0 | NO | NO | NO |
| S0164 | NO | NO | 0 | NO | NO | NO |
| S0165 | NO | NO | 0 | NO | NO | NO |
| S0166 | NO | NO | 0 | NO | NO | NO |
| S0172 | NO | NO | 0 | NO | NO | NO |
| S0174 | NO | NO | 0 | NO | NO | NO |
| S0175 | NO | YES | 16 | NO | NO | NO |
| S0176 | NO | NO | 0 | NO | NO | NO |
| S0183 | NO | NO | 0 | NO | NO | NO |
| S0184 | NO | NO | 0 | NO | NO | NO |
| S0185 | NO | YES | 3 | NO | NO | NO |
| S0187 | NO | NO | 0 | NO | NO | NO |
| S0194 | NO | NO | 0 | NO | NO | NO |
| S0197 | NO | NO | 0 | NO | NO | NO |
| S0199 | YES | YES | 16 | NO | NO | NO |
| S0200 | NO | NO | 0 | NO | NO | NO |
| S0203 | NO | NO | 0 | NO | NO | NO |
| S0204 | YES | NO | 0 | NO | NO | NO |
| S0205 | NO | YES | 11 | YES | NO | NO |
| S0207 | NO | NO | 0 | NO | NO | NO |
| S0208 | NO | NO | 0 | NO | NO | NO |
| S0210 | NO | NO | 0 | NO | NO | NO |
| S0212 | NO | NO | 0 | NO | NO | NO |
| S0213 | YES | NO | 0 | NO | NO | NO |
| S0214 | NO | NO | 0 | NO | NO | NO |
| S0215 | NO | NO | 0 | NO | NO | NO |
| S0218 | NO | NO | 0 | NO | NO | NO |
| S0221 | NO | NO | 0 | NO | NO | NO |
| S0225 | NO | NO | 0 | NO | NO | NO |
| S0227 | NO | NO | 0 | NO | NO | NO |
| S0228 | NO | NO | 0 | NO | NO | NO |
| S0230 | YES | YES | 1 | YES | NO | NO |
| S0231 | YES | YES | 6 | NO | NO | YES |
| S0232 | NO | YES | 1 | NO | NO | NO |
| S0239 | NO | YES | 4 | NO | NO | NO |
| S0240 | NO | YES | 12 | NO | NO | NO |
| S0242 | YES | NO | 0 | NO | NO | NO |
| S0243 | NO | NO | 0 | NO | NO | NO |
| S0244 | NO | YES | 1 | NO | NO | NO |
| S0247 | YES | YES | 8 | NO | NO | NO |
| S0248 | NO | YES | 2 | NO | NO | NO |
| S0277 | NO | YES | 4 | NO | NO | NO |
| S0305 | NO | NO | 0 | NO | NO | NO |
| S0321 | NO | YES | 2 | NO | NO | NO |
| S0322 | NO | YES | 5 | NO | NO | NO |
| S0324 | NO | YES | 1 | NO | YES | NO |
| S0332 | NO | YES | 1 | NO | NO | NO |
| S0334 | NO | YES | 8 | NO | NO | NO |
| S0337 | NO | YES | 16 | NO | NO | NO |
| S0340 | NO | YES | 2 | NO | NO | NO |
| S0343 | NO | NO | 0 | NO | NO | YES |
| Subject | Previous | Current | Pack Years | Previous | Alcohol | Neuropathy |
|---|---|---|---|---|---|---|
| Number | Tobacco Use | Tobacco Use | Alcohol Use | Dose (Week) | Symptoms | Autonomic Symptoms |
| S0348 | YES | YES | 0 | YES | 0.5 | NO |
| S0351 | NO | NO | 0 | YES | 7 | NO |
| S0352 | YES | NO | 33 | YES | 2 | NO |
| S0353 | YES | NO | 15 | YES | 0.25 | YES |
| S0354 | YES | YES | 0 | YES | 3 | NO |
| S0355 | YES | NO | 10 | NO | 0 | YES |
| S0358 | NO | NO | 0 | YES | 1 | NO |
| S0361 | YES | NO | 42 | YES | 0 | NO |
| S0363 | YES | NO | 33 | YES | 0 | NO |
| S0364 | YES | NO | 12 | YES | 3 | NO |
| S0371 | YES | YES | 57 | YES | 42 | YES |
| S0374 | YES | NO | 10 | YES | 2 | NO |
| S0376 | YES | NO | 60 | YES | 3 | NO |
| S0378 | YES | YES | 96 | YES | 24 | YES |
| S0379 | YES | YES | 14 | YES | 0 | NO |
| S0380 | YES | NO | 70 | YES | 20 | YES |
| S0388 | YES | YES | 6.75 | YES | 0 | NO |
| S0389 | YES | NO | 24 | YES | 1 | NO |
| S0397 | YES | NO | 15 | YES | 7 | YES |
| S0399 | NO | NO | 0 | YES | 0 | NO |
| S0402 | YES | YES | 0 | YES | 4 | NO |
| Subject | Dizziness | Numbness | Painful Feet | Syncope |
|---|---|---|---|---|
| Number | Autonomic Symptoms | Autonomic Symptoms | Autonomic Symptoms | Autonomic Symptoms |
| S0348 | YES | NO | YES | NO |
| S0351 | NO | NO | NO | NO |
| S0352 | NO | YES | NO | NO |
| S0353 | YES | YES | NO | NO |
| S0354 | YES | NO | NO | NO |
| S0355 | NO | YES | NO | NO |
| S0358 | YES | NO | NO | NO |
| S0361 | NO | NO | NO | NO |
| S0363 | NO | NO | NO | NO |
| S0364 | NO | NO | NO | NO |
| S0371 | YES | YES | NO | YES |
| S0374 | NO | NO | NO | YES |
| S0376 | YES | NO | NO | YES |
| S0378 | YES | YES | YES | YES |
| S0379 | NO | YES | NO | YES |
| S0380 | NO | NO | YES | NO |
| S0388 | YES | NO | NO | NO |
| S0389 | NO | NO | NO | NO |
| S0397 | YES | YES | NO | YES |
| S0399 | NO | NO | NO | NO |
| S0402 | NO | YES | NO | NO |
| Subject | OH Autonomic | Cancer Family | CancSpec | HeartDisease | Hdspecific | HTN Family |
|---|---|---|---|---|---|---|
| Number | Symptoms | History | Family History | Family History | Family History | History |
| S0348 | NO | 1 | b | 1 | b | 0 |
| S0351 | NO | 2 | gp,f | 2 | gp | 3 |
| S0352 | NO | 1 | si | 1 | f | 0 |
| S0353 | NO | 0 | 1 | m | 1 | |
| S0354 | NO | 3 | gp, m, b | 1 | gp | 0 |
| S0355 | NO | 0 | 1 | f | 0 | |
| S0358 | YES | 2 | b, si | 0 | 0 | |
| S0361 | NO | 2 | gp, m | 1 | f | 0 |
| S0363 | NO | 2 | gp, f | 1 | b | 1 |
| S0364 | YES | 0 | 1 | f | 1 | |
| S0371 | NO | 1 | m | 1 | gp | 0 |
| S0374 | YES | 0 | 3 | gp | 3 | |
| S0376 | YES | 0 | 3 | gp | 3 | |
| S0378 | NO | 1 | gp | 1 | m | 0 |
| S0379 | NO | 5 | gp, m, si, so, d | 1 | f | 4 |
| S0380 | NO | 0 | 1 | gp | 3 | |
| S0388 | YES | 1 | f | 0 | 1 | |
| S0389 | NO | 1 | gp | 2 | f | 0 |
| S0397 | NO | 0 | 1 | b | 3 | |
| S0399 | NO | 1 | m | 0 | 0 | |
| S0402 | NO | 1 | m | 0 | 0 |
| Subject | HTNspecific | DM Family | Dmspecific | StrokeFAMILY | StrokeSpecific | HTN Years Patient |
|---|---|---|---|---|---|---|
| Number | Family History | History | Family History | Family History | Family History | Medical History |
| S0348 | 0 | 0 | 3 | |||
| S0351 | gp,f,m | 1 | f | 1 | gp | 12 |
| S0352 | 0 | 2 | gp, m | 0 | ||
| S0353 | b | 0 | 2 | gp, f | 4 | |
| S0354 | 0 | 0 | 0 | |||
| S0355 | 0 | 0 | 13 | |||
| S0358 | 0 | 0 | 7 | |||
| S0361 | 2 | gp, b | 1 | gp | 36 | |
| S0363 | b | 3 | gp, m, f | 1 | b | 0 |
| S0364 | f | 1 | f | 0 | 0 | |
| S0371 | 1 | d | 0 | 4 | ||
| S0374 | gp, m, b | 0 | 1 | gp | 3 | |
| S0376 | gp, f, m | 0 | 2 | gp, f | 4 | |
| S0378 | 2 | m, si | 0 | 0 | ||
| S0379 | f, m, b, si | 0 | 1 | si | 1 | |
| S0380 | m,b,si | 0 | 2 | f,m | 39 | |
| S0388 | m | 1 | m | 1 | m | 1 |
| S0389 | 0 | 0 | 1 | |||
| S0397 | f,m,b | 0 | 2 | f,m | 0 | |
| S0399 | 0 | 0 | 0 | |||
| S0402 | 0 | 1 | f | 0 |
| Subject | Cancer Patient | Stroke Patient | Stroke | Atrial Fibtrillation | Heart Failure = CHF | DM Patient |
|---|---|---|---|---|---|---|
| Number | Medical History | Medical History | Years | Patient Medical | /Ifarction = -MI Patient | Medical History |
| History | Medical History | |||||
| S0348 | YES | YES | 5 | NO | NO | NO |
| S0351 | NO | YES | 8 | NO | NO | NO |
| S0352 | NO | YES | 6 | NO | NO | NO |
| S0353 | NO | YES | 2 | NO | NO | NO |
| S0354 | NO | YES | 2 | NO | NO | NO |
| S0355 | NO | YES | 13 | NO | NO | NO |
| S0358 | NO | YES | 5 | NO | NO | NO |
| S0361 | NO | YES | 1 | NO | NO | NO |
| S0363 | NO | YES | 1 | NO | NO | NO |
| S0364 | YES | NO | 0 | NO | NO | NO |
| S0371 | NO | YES | 1 | NO | NO | NO |
| S0374 | YES | YES | 1 | NO | NO | NO |
| S0376 | NO | NO | 0 | YES | NO | NO |
| S0378 | NO | YES | 1 | NO | NO | NO |
| S0379 | NO | YES | 1 | NO | NO | NO |
| S0380 | NO | YES | 1 | NO | NO | NO |
| S0388 | NO | YES | 1 | NO | NO | NO |
| S0389 | NO | YES | 1 | NO | NO | NO |
| S0397 | NO | YES | 1 | YES | NO | NO |
| S0399 | NO | NO | 0 | NO | NO | NO |
| S0402 | NO | YES | 1 | NO | YES | NO |
Appendix B. Additional Figures


References
- Mijajlovic, M.; Aleksic, V.; Sternic, N.; Mirkovic, M.; Bornstein, N. Role of prediabetes in stroke. Neuropsychiatr. Dis. Treat. 2017, 13, 259–267. [Google Scholar] [CrossRef]
- Ackerley, S.J.; Stinear, C.M.; Barber, P.A.; Byblow, W.D. Priming sensorimotor cortex to enhance task-specific training after subcortical stroke. Clin. Neurophysiol. Off. J. Int. Fed. Clin. Neuro-Physiol. 2017, 125, 1451–1458. [Google Scholar] [CrossRef] [PubMed]
- Michele, A.; Robol, E.; Fiaschi, A.; Manganotti, P. A double blind placebo RCT to investigate the effects of serotonergic modulation on brain excitability and motor recovery in stroke patients. J. Neurol. 2009, 256, 1152. [Google Scholar] [CrossRef]
- Zhang, X.; Zhao, Q.; Zuo, Q.; Cheng, S.; Ma, J.; Liu, S.; Wang, Y. The development, valitidy and reliability of Stroke Premonitory Symptoms Alert Questionnaire. Chin. Nurs. Manag. 2015, 15, 416–419. [Google Scholar]
- Goldstein, L.B.; Adams, R.; Alberts, M.J.; Appel, L.J.; Brass, C.D.; Culebras, A.; DeGraba, T.J.; Gorelick, P.B.; Guyton, J.R.; Hart, R.G.; et al. Primary prevention of ischemic stroke: A guideline from the American Heart Association/American Stroke Association Stroke Council: Cosponsored by the Atherosclerotic Peripheral Vascular Disease Interdisciplinary Working Group; Cardiovascular Nursing Council; Clinical Cardiology Council; Nutrition, Physical Activity, and Metabolism Council; and the Quality of Care and Outcomes Research Interdisciplinary Working Group. Circulation 2006, 113, e873–e923. [Google Scholar] [CrossRef] [PubMed]
- Liebeskind, D.S.; Albers, G.W.; Crawford, K.; Derdeyn, C.P.; George, M.S.; Palesch, Y.Y.; Toga, A.W.; Warach, S.; Zhao, W.; Brott, T.G.; et al. Imaging in strokenet: Realizing the potential of big data. Stroke J. Cereb. Circ. 2015, 125, 2000–2006. [Google Scholar] [CrossRef]
- He, F.; Hu, Z.; Zhang, W.; Cai, L.; Cai, G.; Aoyagi, K. Construction and evaluation of two computational models for predicting the incidence of influenza in Nagasaki Prefecture, Japan. Sci. Rep. 2017, 7, 7192. [Google Scholar] [CrossRef]
- Czabanski, R.; Horoba, K.; Wrobel, J.; Matonia, A.; Martinek, R.; Kupka, T.; Jezewski, M.; Kahankova, R.; Jezewski, J.; Leski, J.M. Detection of atrial fibrillation episodes in long-term heart rhythm signals using a support vector machine. Sensors 2020, 20, 765. [Google Scholar] [CrossRef]
- Osman, A.H.; Alzahrani, A.A. New approach for automated epileptic disease diagnosis using an integrated self-organization map and radial basis function neural network algorithm. IEEE Access. 2019, 7, 4741–4747. [Google Scholar] [CrossRef]
- Cheon, S.; Kim, J.; Lim, J. The use of deep learning to predict stroke patient mortality. Int. J. Env. Res. Public. Health. 2019, 16, 1876. [Google Scholar] [CrossRef]
- Hung, C.; Chen, W.; Lai, P.; Lin, C.; Lee, C. Comparing deep neural network and other machine learning algorithms for stroke prediction in a large-scale population-based electronic medical claims database. In Proceedings of the 39th Annual International Conference of the IEEE Engineering in Medicine and Biology Society (EMBC), Seogwipo, South Korea, 11–15 July 2017. [Google Scholar]
- Flint, A.C.; Conell, C.; Ren, X.; Banki, N.M.; Bhatt, D.L. Effect of systolic and diastolic blood pressure on cardiovascular outcomes. N. Engl. J. Med. 2019, 381, 243–251. [Google Scholar] [CrossRef] [PubMed]
- Wesley, T.O.; Mohamed, F.A.; Waqas, T.Q.; Elsayed, Z.S. Electrocardiographic and echocardiographic left ventricular hypertrophy in the prediction of stroke in the elderly. J. Stroke Cerebrovasc. Dis. 2015, 24, 1991–1997. [Google Scholar] [CrossRef][Green Version]
- Ao, D.; Sun, R.; Tong, K.Y.; Song, R. Characterization of stroke- and aging-related changes in the complexity of EMG signals during tracking tasks. J. Ann. Biomed. Eng. 2015, 43, 990–1002. [Google Scholar] [CrossRef] [PubMed]
- Bodapati, R.K.; Kizer, J.R.; Kop, W.J.; Kamel, H.; Stein, P.K. Addition of 24-hour heart rate variability parameters to the cardiovascular health study stroke risk score and prediction of incident stroke: The cardiovascular health study. J. Am. Heart Assoc. 2017, 6, e004305. [Google Scholar] [CrossRef] [PubMed]
- Chantamit-O-Pas, P.; Goyal, M. Long short-term memory recurrent neural network for stroke prediction. Springer Int. Publ. 2018, 312–323. [Google Scholar] [CrossRef]
- Novak, V.; Hu, K.; Desrochers, L.; Novak, P.; Caplan, L. Cerebral flow velocities during daily activities depend on blood pressure in patients with chronic ischemic infarctions. Stroke 2009, 41, 61–66. [Google Scholar] [CrossRef] [PubMed]
- Goldberger, A.L.; Amaral, L.A.N.; Glass, L.; Hausdorff, J.M.; Ivanov, P.C.; Mark, R.G.; Mietus, J.E.; Moody, G.B.; Peng, C.-K.; Stanley, H.E. PhysioBank, physiotoolkit, and physionet: Components of a new research resource for complex physiologic signals. Circulation 2000, 101, e215–e220. [Google Scholar] [CrossRef]
- Larsson, S.C.; Burgess, S.; Michaëlsson, K. Smoking and stroke: A mendelian randomization study. Ann. Neurol. 2019, 86, 468–471. [Google Scholar] [CrossRef]
- Yang, S.; Zhao, Y.; Chen, X.; Lu, X.; Chen, Y.; Zhao, X.; Zhu, L.; Fang, Z.; Zhao, H.; Yao, Y.; et al. The ACTB Variants and Alcohol Drinking Confer Joint Effect to Ischemic Stroke in Chinese Han Population. J. Atheroscler. Thromb. 2019, 27. [Google Scholar] [CrossRef]
- Shah, T.G.; Sutaria, J.M.; Vyas, M.V. The association between pulmonary hypertension and stroke: A systematic review and meta-analysis. Int. J. Cardiol. 2019, 7, S0167527319310757. [Google Scholar] [CrossRef]
- Subha, P.P.; Pillai Geethakumari, S.M.; Athira, M.; Nujum, Z.T. Pattern and risk factors of stroke in the young among stroke patients admitted in medical college hospital, Thiruvananthapuram. Ann. Indian Acad. Neurol. 2015, 18, 20–23. [Google Scholar] [CrossRef]
- Pham, D.H.; Le, A.C. Exploiting multiple word embeddings and one-hot character vectors for aspect-based sentiment analysis. Int. J. Approx. Reason. 2018, 103, S0888613X17304139. [Google Scholar] [CrossRef]
- Gu, J.; Wang, Z.; Kuen, J.; Ma, L.; Shahroundy, A.; Shuai, B.; Liu, T.; Wang, X.; Wang, G.; Cai, J.; et al. Recent advances in convolutional neural networks. arXiv 2015, arXiv:1512.07108. [Google Scholar] [CrossRef]
- Simonyan, K.; Zisserman, A. Very deep convolutional networks for large-scale image recognition. Comput. Sci. 2014, arXiv:1409.1556. [Google Scholar]
- Malek, S.; Melgani, F.; Bazi, Y. One-dimensional convolutional neural networks for spectroscopic signal regression. J. Chemom. 2017, 5, e2977. [Google Scholar] [CrossRef]
- Eitel, A.; Springenberg, J.T.; Spinello, L.; Riedmiller, M.; Burgard, W. Multimodal deep learning for robust rgb-d object recognition. Oalib J. 2015, 681–687. [Google Scholar] [CrossRef]


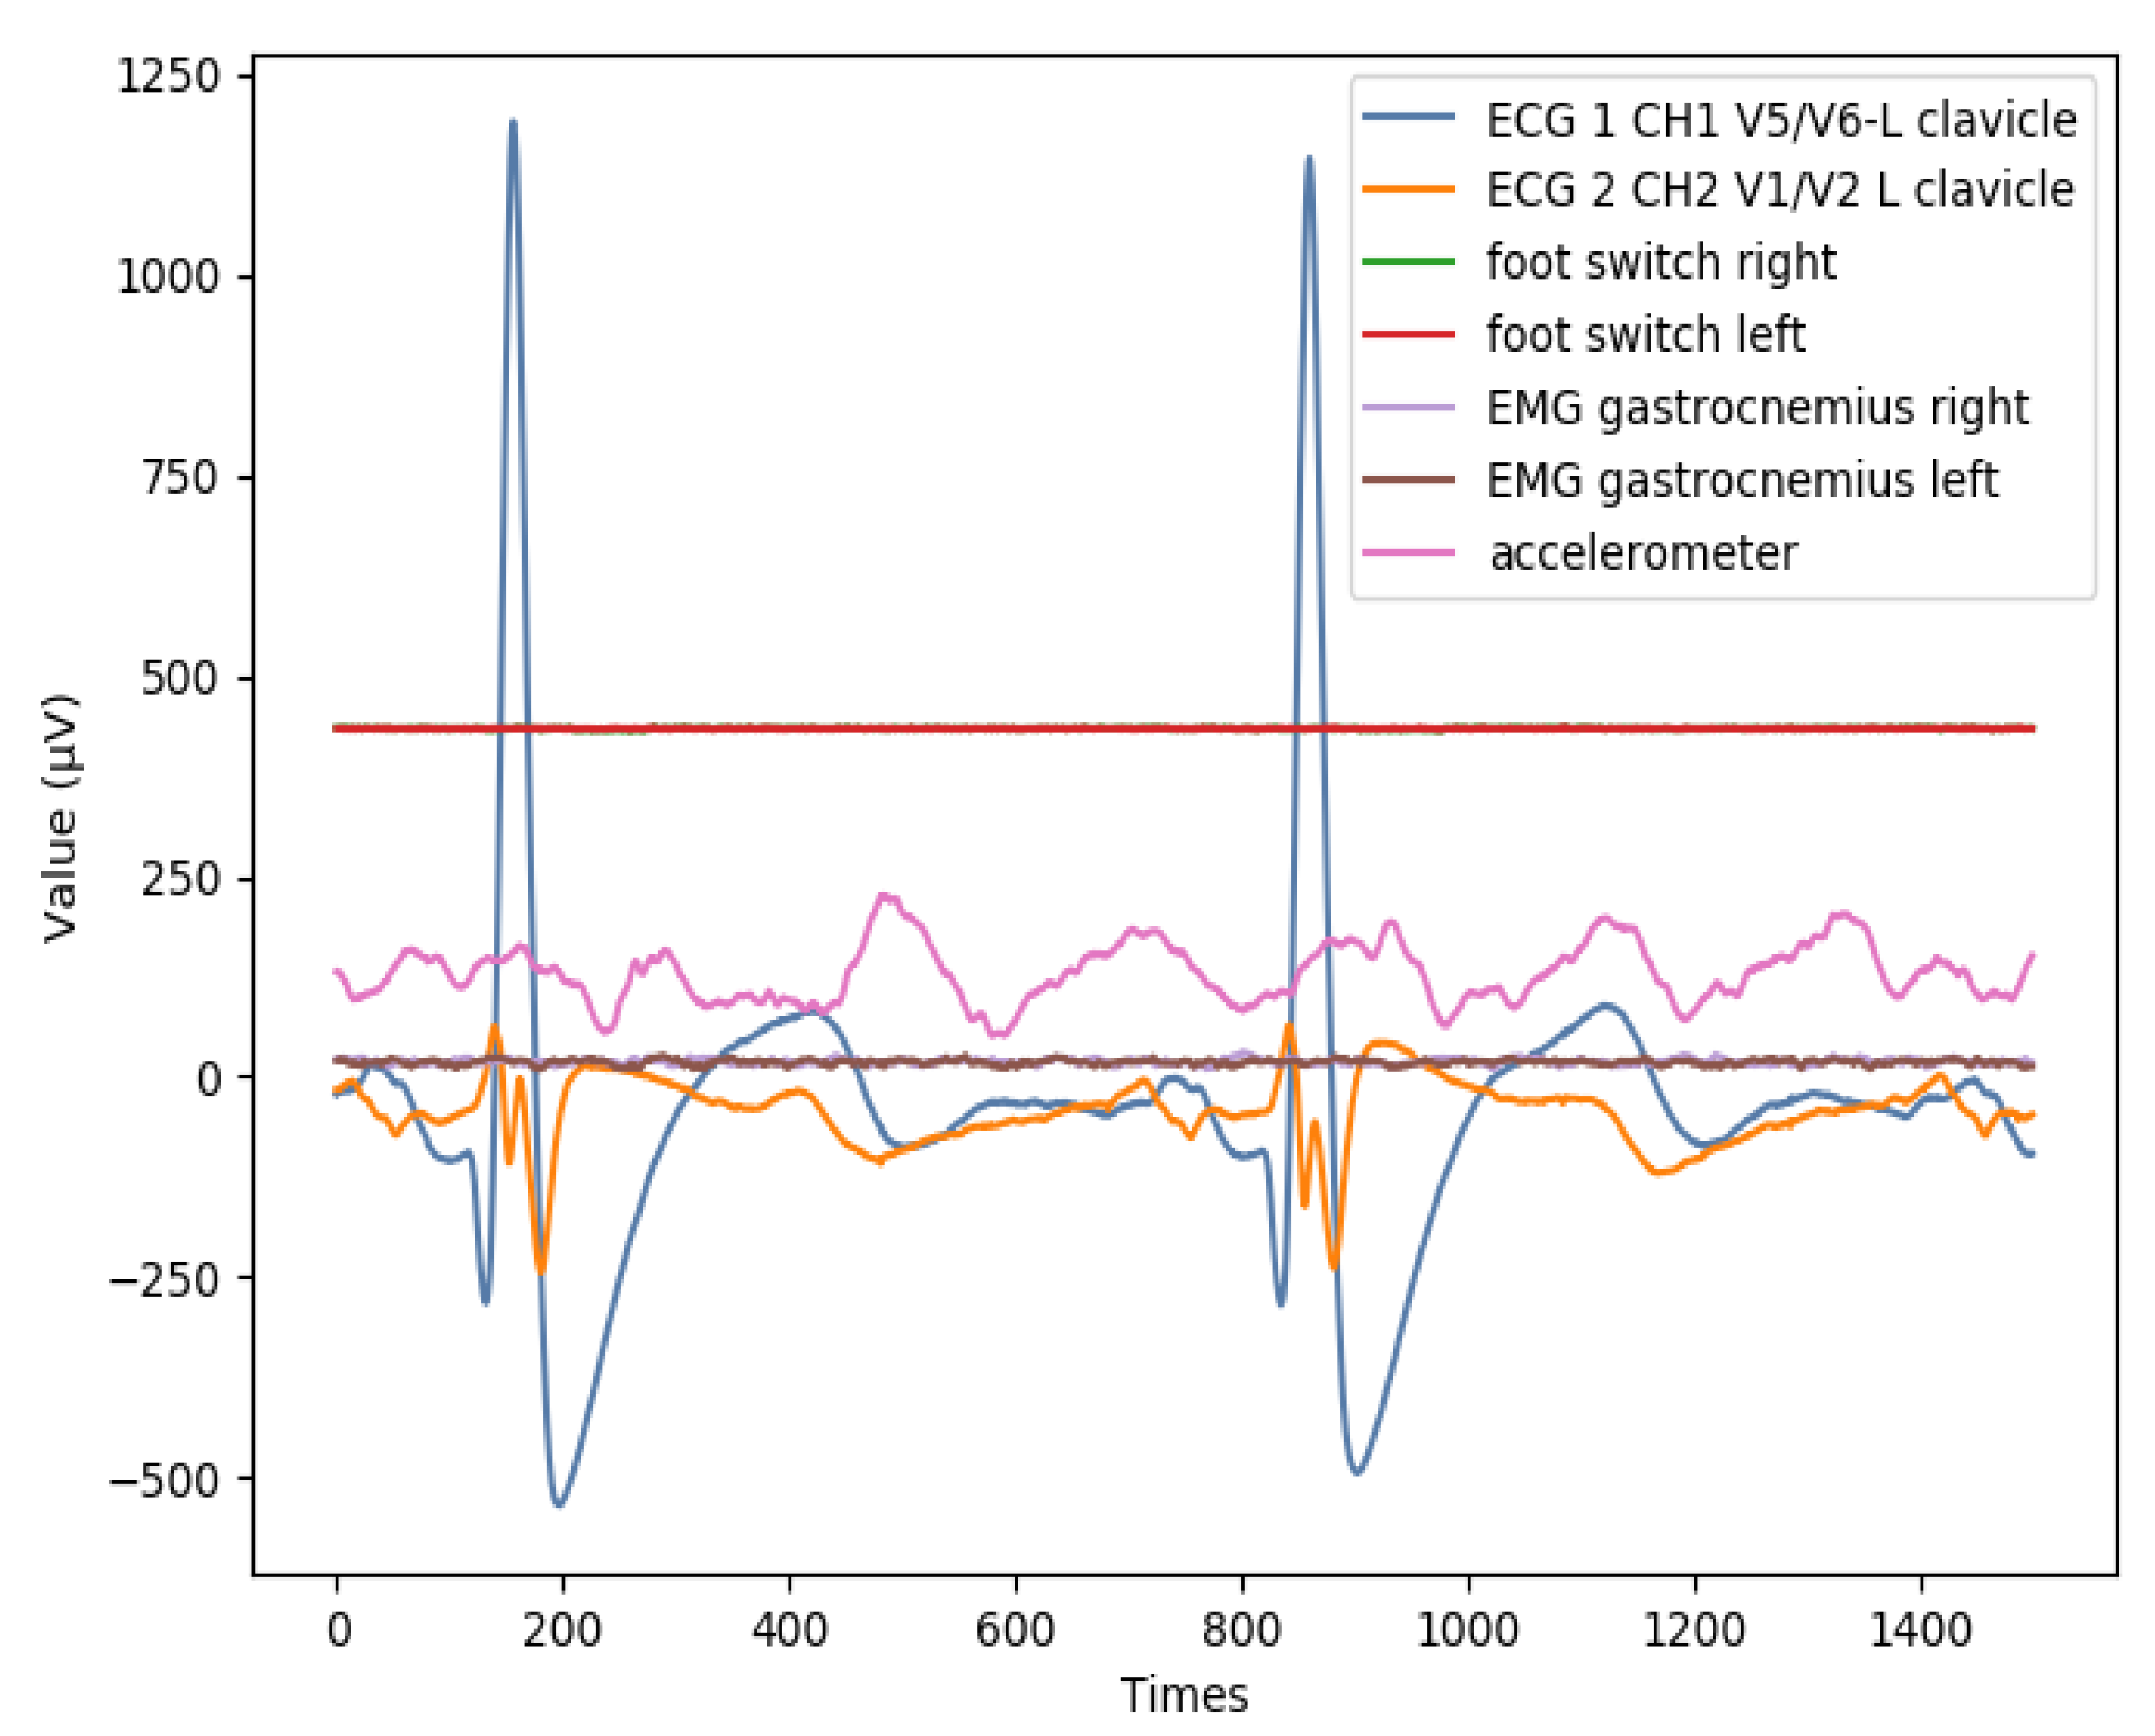
| Type | Position |
|---|---|
| ECG 1 | CH1 V5/V6-L clavicle |
| ECG 2 | CH2 V1/V2 L clavicle |
| EMG 1 | gastrocnemius right |
| EMG 2 | gastrocnemius left |
| Group | Stroke | Control | p |
|---|---|---|---|
| Age (years) | 64.21 (±8.94) | 64.48 (±8.07) | 0.87 |
| Sex (male, female) | 20, 19 (39) | 17, 23 (40) | N = 79 |
| Race (W, A, AA) | 33, 1, 5 | 33, 3, 4 | |
| Body mass index (kg/m2) | 27.53 (±4.74) | 27.59 (±6.48) | 0.95 |
| Years after stroke | 6.05 (±4.88) | - | - |
| Stroke side (right, left) | 24, 19 | - | - |
| Infarct volume (cm3) | 18.69 (±34.06) | - | - |
| NIHSS | 2.71 (±2.72) | - | - |
| MRS | 1.2 (±1.14) | - | - |
| Human Characteristic Data | Age Mass/kg Gender | Height/m BMI Race |
|---|---|---|
| Personal medical history | Htn patient medical history | Neuropathy autonomic symptoms |
| Dizziness autonomic symptoms | Numbness autonomic symptoms | |
| DM/on-DM stroke | Syncope autonomic symptoms | |
| OHspecific autonomic symptoms | Atrial fibirillation patient medical history | |
| HTN years patient medical history | Cancer patient medical history | |
| Stroke patient medical history | DM patient medical history | |
| Heart failure = CHF /ifaction = -MI | ||
| patient medical history | ||
| Behavioral | Current tobacco use | Pevious tobacco use |
| Previous alcohol use | Pack tobacco years | |
| ALCOHOL Dose/Week | ||
| Family medical history | Cancer family history | Cancerspecific family history |
| HeartDisease family history | Hdspecific family history | |
| HTN family history | HTNspecific family history | |
| DM family history | Dmspecific family history | |
| Stroke family history | StrokeSpecific family history | |
| Life sign parameters | Heart rate | blood pressure |
| ECG | EMG |
| Index | Value | |||||||||
|---|---|---|---|---|---|---|---|---|---|---|
| 0–9 | 1.0 | 0.0 | 64.0 | 1.63 | 72.6 | 27.5 | 0.0 | 1.0 | 0.0 | 0.0 |
| 10–19 | 0.0 | 0.0 | 0.0 | 0.0 | 1.0 | 0.0 | 0.0 | 0.0 | 0.0 | 0.0 |
| 20–29 | 0.0 | 0.0 | 0.0 | 0.0 | 0.0 | 0.0 | 0.0 | 0.0 | 0.0 | 0.0 |
| 30–39 | 0.0 | 0.0 | 0.0 | 0.0 | 0.0 | 0.0 | 0.0 | 0.0 | 0.0 | 0.0 |
| 40–49 | 0.0 | 0.0 | 0.0 | 0.0 | 0.0 | 0.0 | 0.0 | 0.0 | 0.0 | 0.0 |
| 50–59 | 0.0 | 0.0 | 0.0 | 0.0 | 0.0 | 0.0 | 0.0 | 0.0 | 0.0 | 0.0 |
| 60–69 | 0.0 | 0.0 | 4.0 | 0.0 | 0.0 | 0.0 | 0.0 | 0.0 | 0.0 | 0.0 |
| Factor | Value | Used One-Hot |
|---|---|---|
| Htn patient medical history | YES | NO |
| Age | 70 | NO |
| Alcohol Dose/Week | 0 | NO |
| Neuropathy autonomic symptoms | YES | NO |
| Previous Tobacco Use | YES | NO |
| Current Tobacco Use | NO | NO |
| HeartDisease family history | 1 | NO |
| HdspeciFIc family history | f | YES |
| Stroke year patient medical history | 0 | NO |
| Atrial FIbtrillation patient medical history | NO | NO |
| BMI | 26.7 | NO |
| Gender | F | NO |
| Painful feet autonomic symptoms | NO | NO |
| Syncope autonomic symptoms | NO | NO |
| cancSpec family history | NULL | NO |
| HTN years patient medical history | 4 | NO |
| DM patient history | 0 | NO |
| DmspeciFIc patient history | NULL | YES |
| DM patient medical history | NO | NO |
| Height/m | 1.64 | NO |
| Mass/kg | 71.67 | NO |
| Dizziness autonomic symptoms | NO | NO |
| Numbness autonomic symptoms | NO | NO |
| Pack years | 20 | NO |
| Previous alcohol use | YES | NO |
| HTN family history | 0 | YES |
| HTNspeciFIc family history | NULL | YES |
| Heart failure = CHF/ifaction = -MI patient medical history | NO | NO |
| Race | White | YES |
| DM Non-DM stroke | Non-DM | NO |
| OH autonomic symptoms | NO | NO |
| Cancer family history | 0 | YES |
| Cancer patient medical history | NO | NO |
| Stroke patient medical history | NO | NO |
| Stroke family history | 0 | NO |
| Stroke Specific family history | NULL | YES |
| TP | FN | FP | TN | Precision | Recall | Accuracy | AUC | f1-Score (0) | f1-Score (1) |
|---|---|---|---|---|---|---|---|---|---|
| 18863 | 285 | 270 | 18390 | 98.59% | 98.51% | 98.53% | 0.99 | 0.96 | 0.96 |
| Accuracy | Training Time (Second) | Total Parameters | |
|---|---|---|---|
| VGG19 | 0.96 | 1678 | 122122049 |
| DenseNet201 | 0.97 | 34271 | 26186817 |
| ResNet50 | 0.97 | 20162 | 23638913 |
| VGG16 | 0.97 | 12689 | 16812353 |
| Methods | Input Data | Model Structure | AUC |
|---|---|---|---|
| DNN with scaled PCA | Medical service use and health behavior data | DNN | 83.48% |
| Deep neural network | Electronic medical claims (EMCs) | DNN | 91.5% |
| Multi model | Streaming data (Blood pressure etc.), structured data (EHRs) | Multi model fusion | 99% |
© 2020 by the authors. Licensee MDPI, Basel, Switzerland. This article is an open access article distributed under the terms and conditions of the Creative Commons Attribution (CC BY) license (http://creativecommons.org/licenses/by/4.0/).
Share and Cite
Liu, Y.; Yin, B.; Cong, Y. The Probability of Ischaemic Stroke Prediction with a Multi-Neural-Network Model. Sensors 2020, 20, 4995. https://doi.org/10.3390/s20174995
Liu Y, Yin B, Cong Y. The Probability of Ischaemic Stroke Prediction with a Multi-Neural-Network Model. Sensors. 2020; 20(17):4995. https://doi.org/10.3390/s20174995
Chicago/Turabian StyleLiu, Yan, Bo Yin, and Yanping Cong. 2020. "The Probability of Ischaemic Stroke Prediction with a Multi-Neural-Network Model" Sensors 20, no. 17: 4995. https://doi.org/10.3390/s20174995
APA StyleLiu, Y., Yin, B., & Cong, Y. (2020). The Probability of Ischaemic Stroke Prediction with a Multi-Neural-Network Model. Sensors, 20(17), 4995. https://doi.org/10.3390/s20174995