1. Introduction
Water is a widely used solvent in chemical and biological processes. Researchers have used optical fiber sensors and water as the solvent for sensing various chemicals such as ethanol [
1], isopropanol [
2], nitrates [
3], and ammonia [
4] in aqueous solutions. The sensing is based on a change of the refractive index (RI) of the aqueous solution. Microcomponents such as ammonia nitrogen in water provide important information about water quality in rivers and water supply processing plants as well as in drinking water [
5]. High concentration of ammonia nitrogen in water can increase eutrophication which contributes to adverse effects for humans and aquatic life [
6]. Moreover, concentrations ranging as low as 0.2–2.0 ppm can be lethal to fish species [
7]. Major industries such as the pharmaceutical and chemical industries, fertilizer production, sewage treatment plants, and cattle excrement are some of the sources of ammonia nitrogen released into the environment [
8]. In this regard, control of ammonia nitrogen effluent discharge limits to the environment is critical. Stipulated effluent discharge limit for ammonia nitrogen varies from one country to another. For example, in Malaysia, the acceptable discharge limits for ammonia nitrogen are 5 and 10 ppm for enclosed water bodies and rivers, respectively [
9]. Therefore, a high sensitivity sensor is required for detecting a low concentration of ammonia nitrogen in water for environmental, health, and industrial safety.
Microfiber interferometer (MFI) sensors have been drawing the attention of researchers in the scientific community due to their outstanding properties such as excellent geometry, material uniformity, high index contrast between the optical fiber and the surrounding environment, strong evanescent field, and high sensitivity [
10]. These features make them an ideal candidate for detecting slight changes in RI of an aqueous solution. In recent years, various configurations of MFI-based sensors have been used in determining RI changes in various aqueous solutions. These configurations include thin-core fiber (TCF) interferometer [
11], grating-based MFI [
3], single-mode multimode single-mode (SMS) MFI [
12], photonic crystal fiber-based interferometer [
13], and as-drawn taper-based interferometers [
14]. Zhao et al. designed a SMS fiber structure for RI sensing with a measured sensitivity of 286.2 nm/RIU. Zhoa et al. [
13] designed a tapered photonic crystal fiber (PCF)-based interferometer for RI measurement with a sensitivity of 281.6 nm/RIU. In 2017, Pham et al. [
15] used etched fiber Bragg grating (e-FBG) to detect nitrate concentration in water with a limit of detection (LOD) of 3.0 ppm. Recently, Huang et al. [
16] presented MFI realized by splicing a section of TCF between two SMS coated with a PAH/PAA multilayer film for ammonia nitrogen monitoring in water with a sensitivity of 0.031 nm/ppm. However, the TCF and SMS-based devices involve a complicated fabrication technique and PCFs are expensive. The as-drawn tapered MFI structure is simpler, straightforward, and cost-effective compared to grating-based MFI, TCF, PCF, and SMS based devices.
In this paper, an ultrasensitive MFI sensor based on a standard single-mode optical fiber (SMF) for monitoring low concentration of ammonia nitrogen (5–50 ppm) in water is experimentally demonstrated. The sensor is investigated in a wide wavelength range of 1500–1800 nm. The results presented here indicate that the MFI sensor can detect a low concentration of ammonia nitrogen in water with a 0.5 ppm limit of detection.
2. Fabrication and Principle
The MFI is fabricated by heating and pulling SMF (SMF-28, Lucent tech., NJ, USA) using a Vytran
TM glass-processing machine (GPX-3400, Morganville, NJ, USA). First, a section of the SMF fiber is fixed on two translational stages by a fiber holder. While the center of the SMF is heated by a filament, the two translational stages simultaneously move in the opposite direction to stretch the fiber down from the initial diameter to the final diameter.
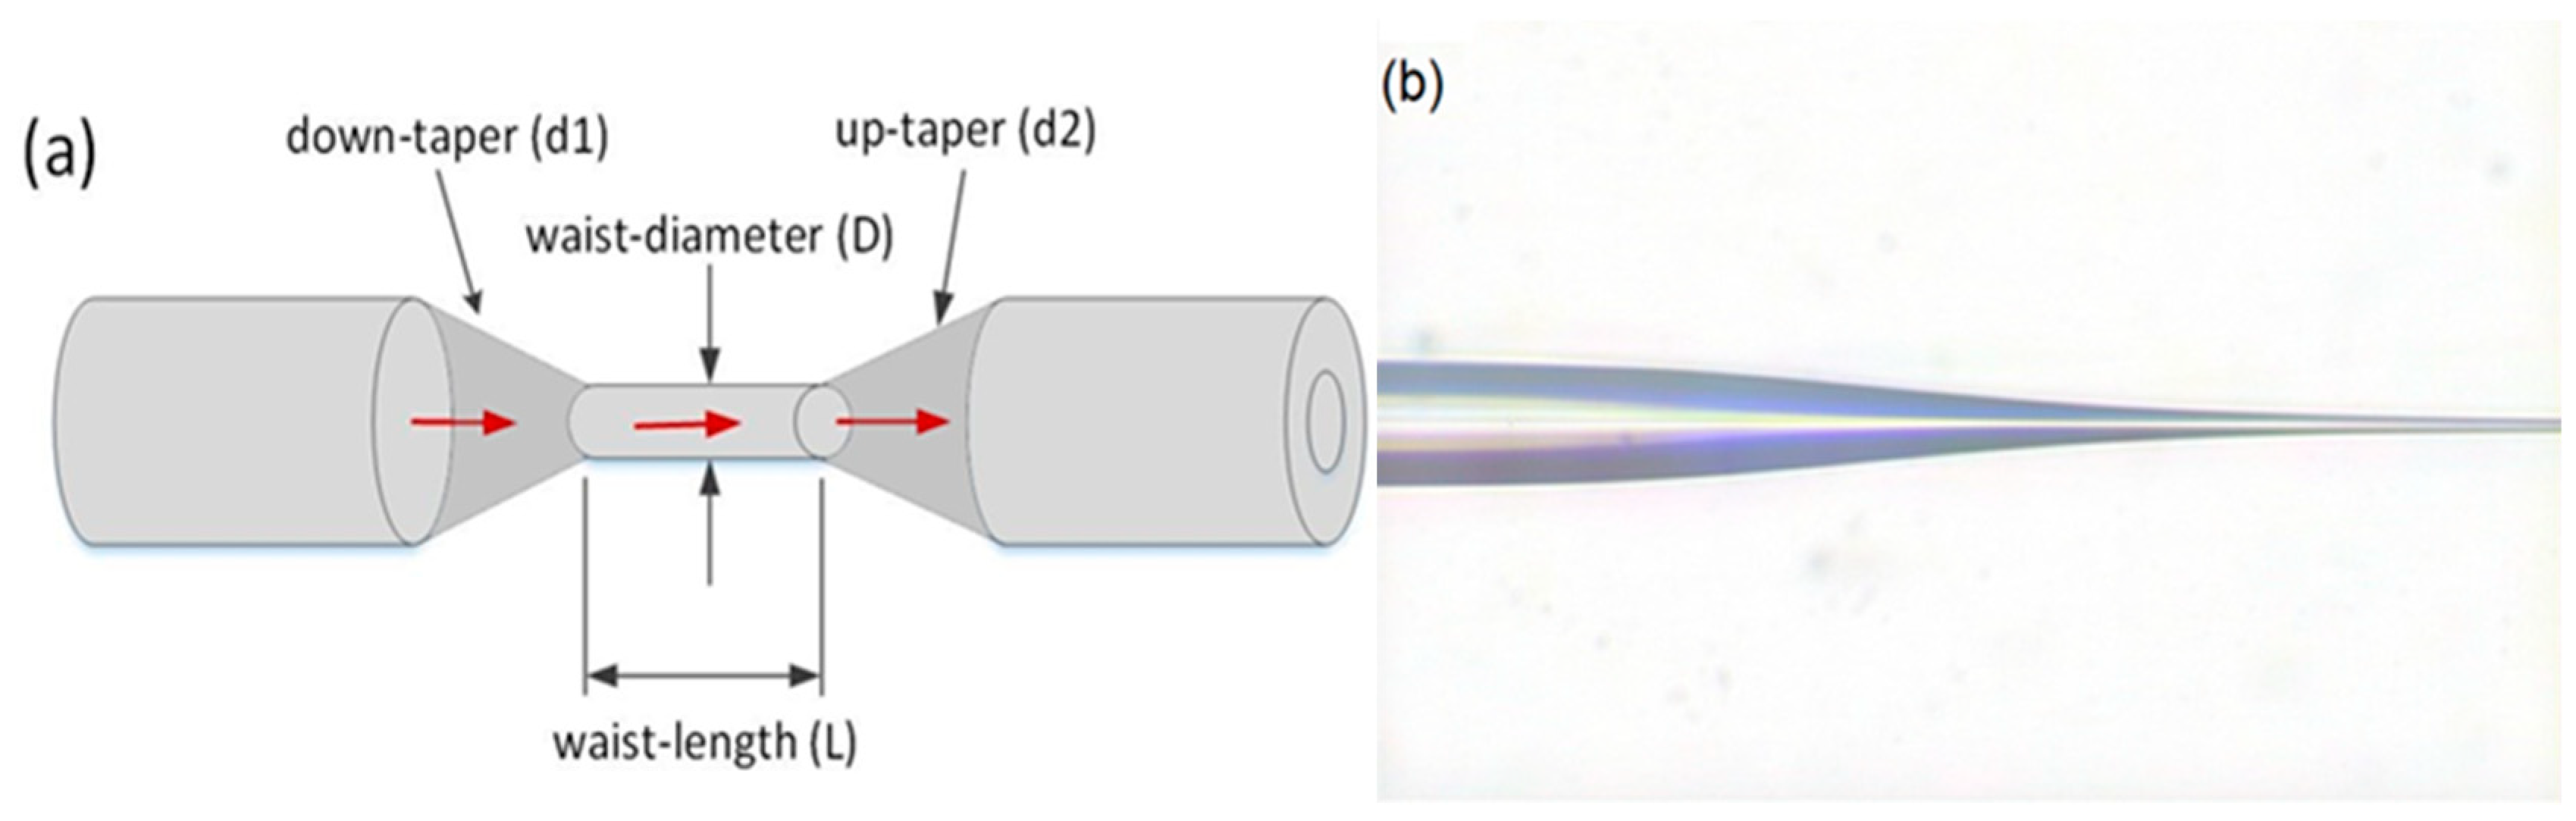
Figure 1a shows the schematic structure of the proposed MFI fabricated from standard SMF. The MFI consists of down-taper section d1, waist-length L, waist-diameter D, and up-taper section d2.
Figure 1b shows the microscopic image of the down-taper, and part of the waist length of the MFI. Tapered SMF can be either adiabatic or non-adiabatic depending on the taper angle. An adiabatic taper has a very small local change in the taper radius (small taper angle) leading to the main portion of the power remaining in the fundamental mode, and therefore it does not couple to higher-order modes as it propagates through the fiber. On the other hand, the non-adiabatic taper has an abrupt taper angle and is capable of transferring energy from the fundamental mode propagating through the normal fiber to the cladding modes in the down-taper region [
17]. As can be seen in
Figure 1b, the fabricated taper is non-adiabatic because of its sharper taper angle. This coupled the fundamental mode to cladding mode thus creating a strong interference pattern that behaves as a modal interferometer.
When light propagates through the down-taper and due to its relatively sharp taper angle, the fundamental mode will be coupled to the high-order cladding mode. Hence, more than one mode will be propagating along the taper waist. In the up-taper region, parts of the cladding modes are coupled back to the core, resulting in interference patterns. Output light intensity I of the transmission is given by [
18,
19]:
where I
1 and I
2 are the light intensity of the fundamental mode and cladding mode, respectively. Δ∅ is the phase difference between the interfering modes and is expressed as:
where λ is the central wavelength of the light source, L is the waist length of the tapered region, and
is the effective refractive index difference between the fundamental and cladding mode
. When Δ∅ = 2mπ, an interference maximum could be observed at the m-order peak wavelength given by:
A change in the behavior of the surrounding environment will influence the effective refractive indices between the fundamental and cladding mode,
will correspondingly change to
. Consequently, peak wavelength shifts
in the position of the m-order peak could be observed in the interference spectrum. The peak wavelength shifts and the associated phase shift δ∅ can be expressed as follows respectively:
3. Experiment and Results
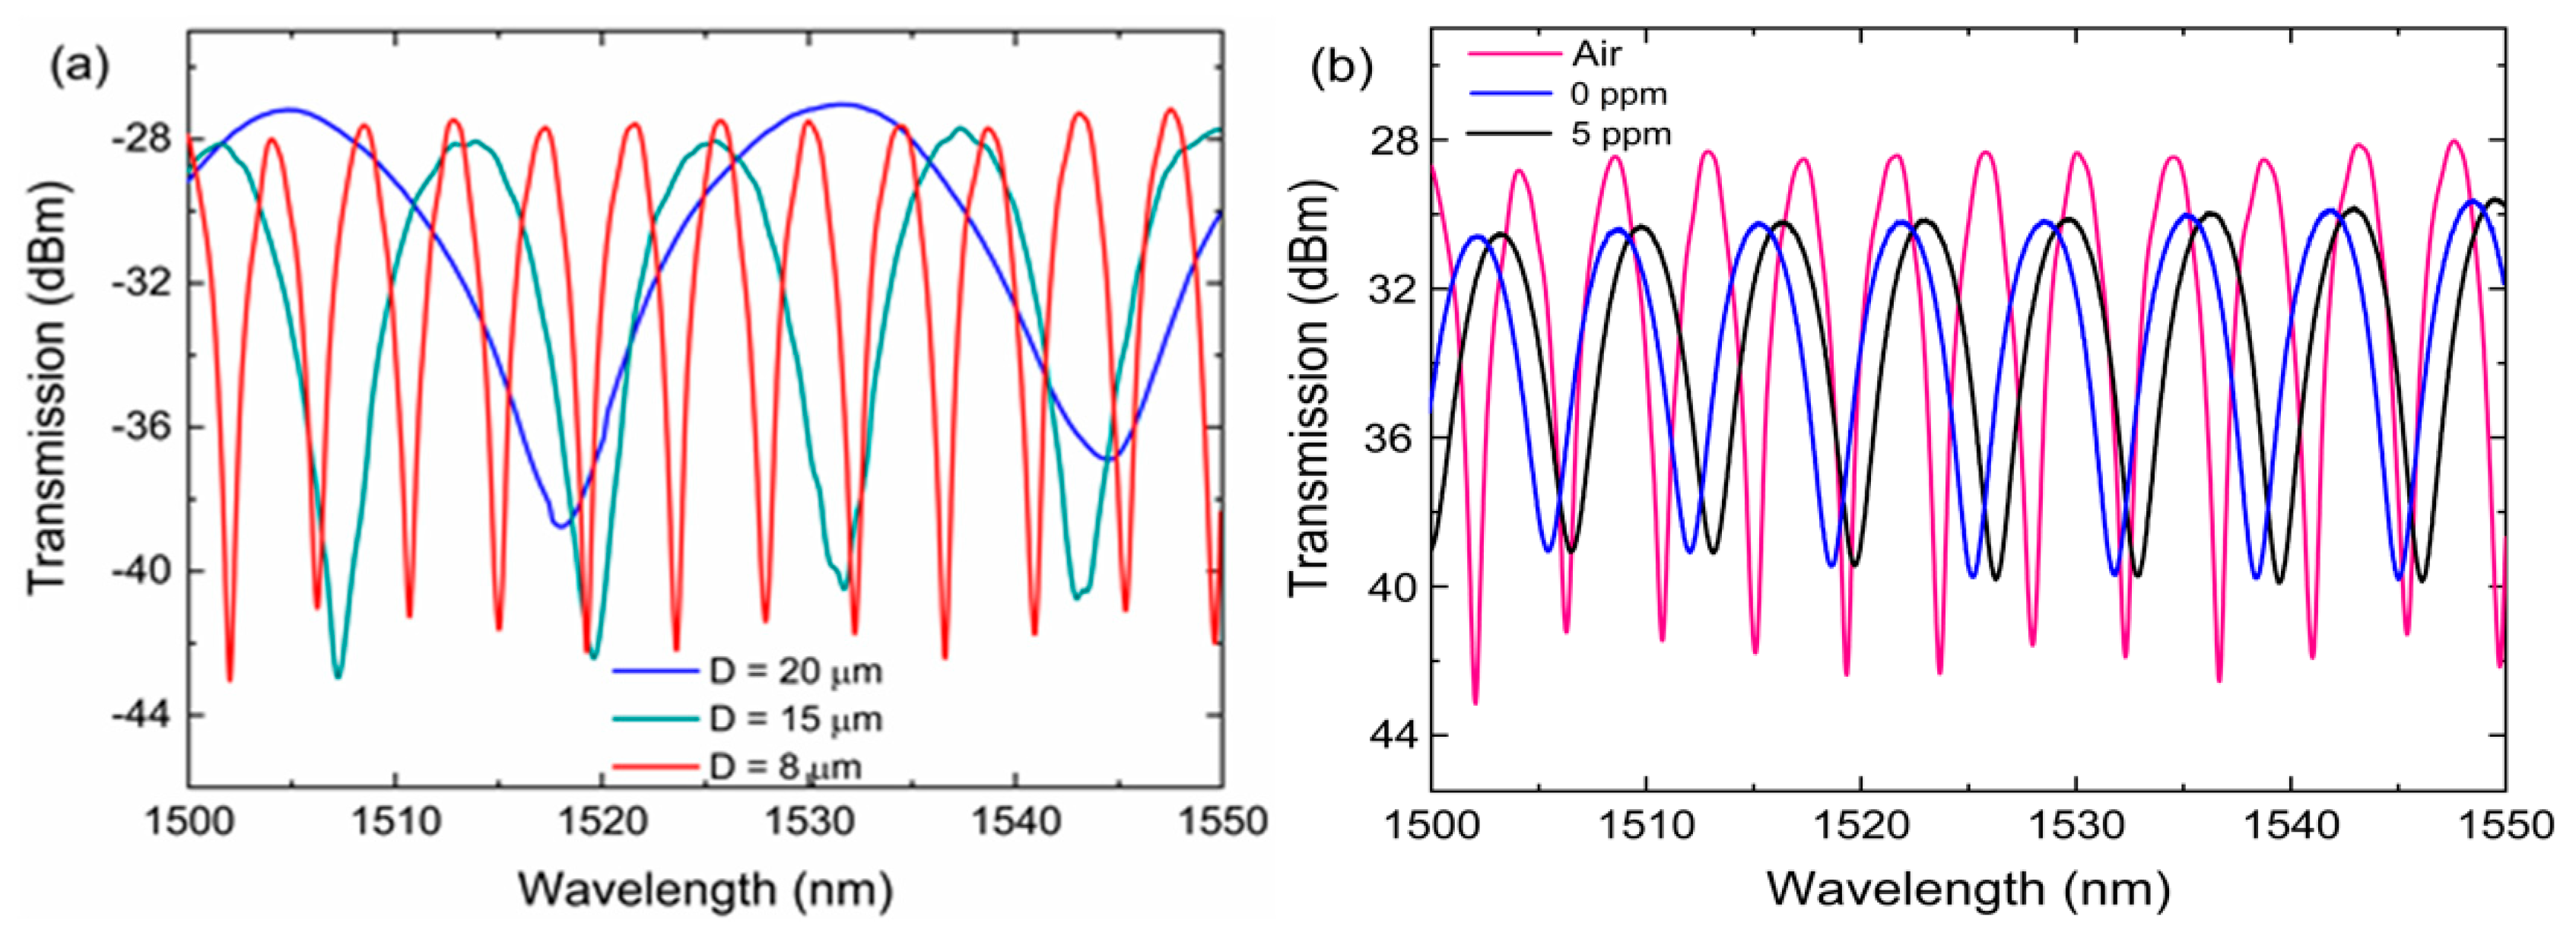
Figure 2a shows the transmission spectra of MFI in air in the wavelength range of 1500–1550 nm with different waist diameter (D), waist-length (L) = 15 mm, up-taper = down-taper = 3 mm. The spectra were obtained by optical spectrum analyzer (OSA, AQ6375, Yokogawa, Tokyo, Japan) and broadband supercontinuum light source. As can be seen from
Figure 2a, the trend of the spectrum shows that the free spectral range (FSR) decreases as the waist diameter decreases. The MFI with waist-diameter 20, 15, 8 µm has a FSR of 26.60, 12.38, and 4.86 nm, respectively. The MFI with D = 8 µm exhibited close fringes and has narrow dips with the highest extinction ratio of around 15.12 dB. These features are important for sensing application because they help to improve the accuracy and resolution of any sensor [
20].
Figure 2b shows the spectrum of the 8 µm MFI in air and immersed in 5 ppm ammonia nitrogen. Comparing the spectrum in air and 5 ppm ammonia nitrogen, the intensity power loss after immersion is estimated to be ~2.0 dB with extinction ration reduced to around 10.0 dB which is suitable for sensing. The FSR of the spectrum after immersion in solution has increased from 4.86 nm to 6.58 nm, with reference to Equation (4), this occurrence is reasoned with the reduction of
when
increases. The spectrum still exhibited narrow dips, which are critical for monitoring wavelength shift changes with high accuracy. For this reason, the MFI with D = 8 µm was chosen for this experiment. The interference pattern of the spectrum is due to mode coupling between the fundamental mode and cladding modes.
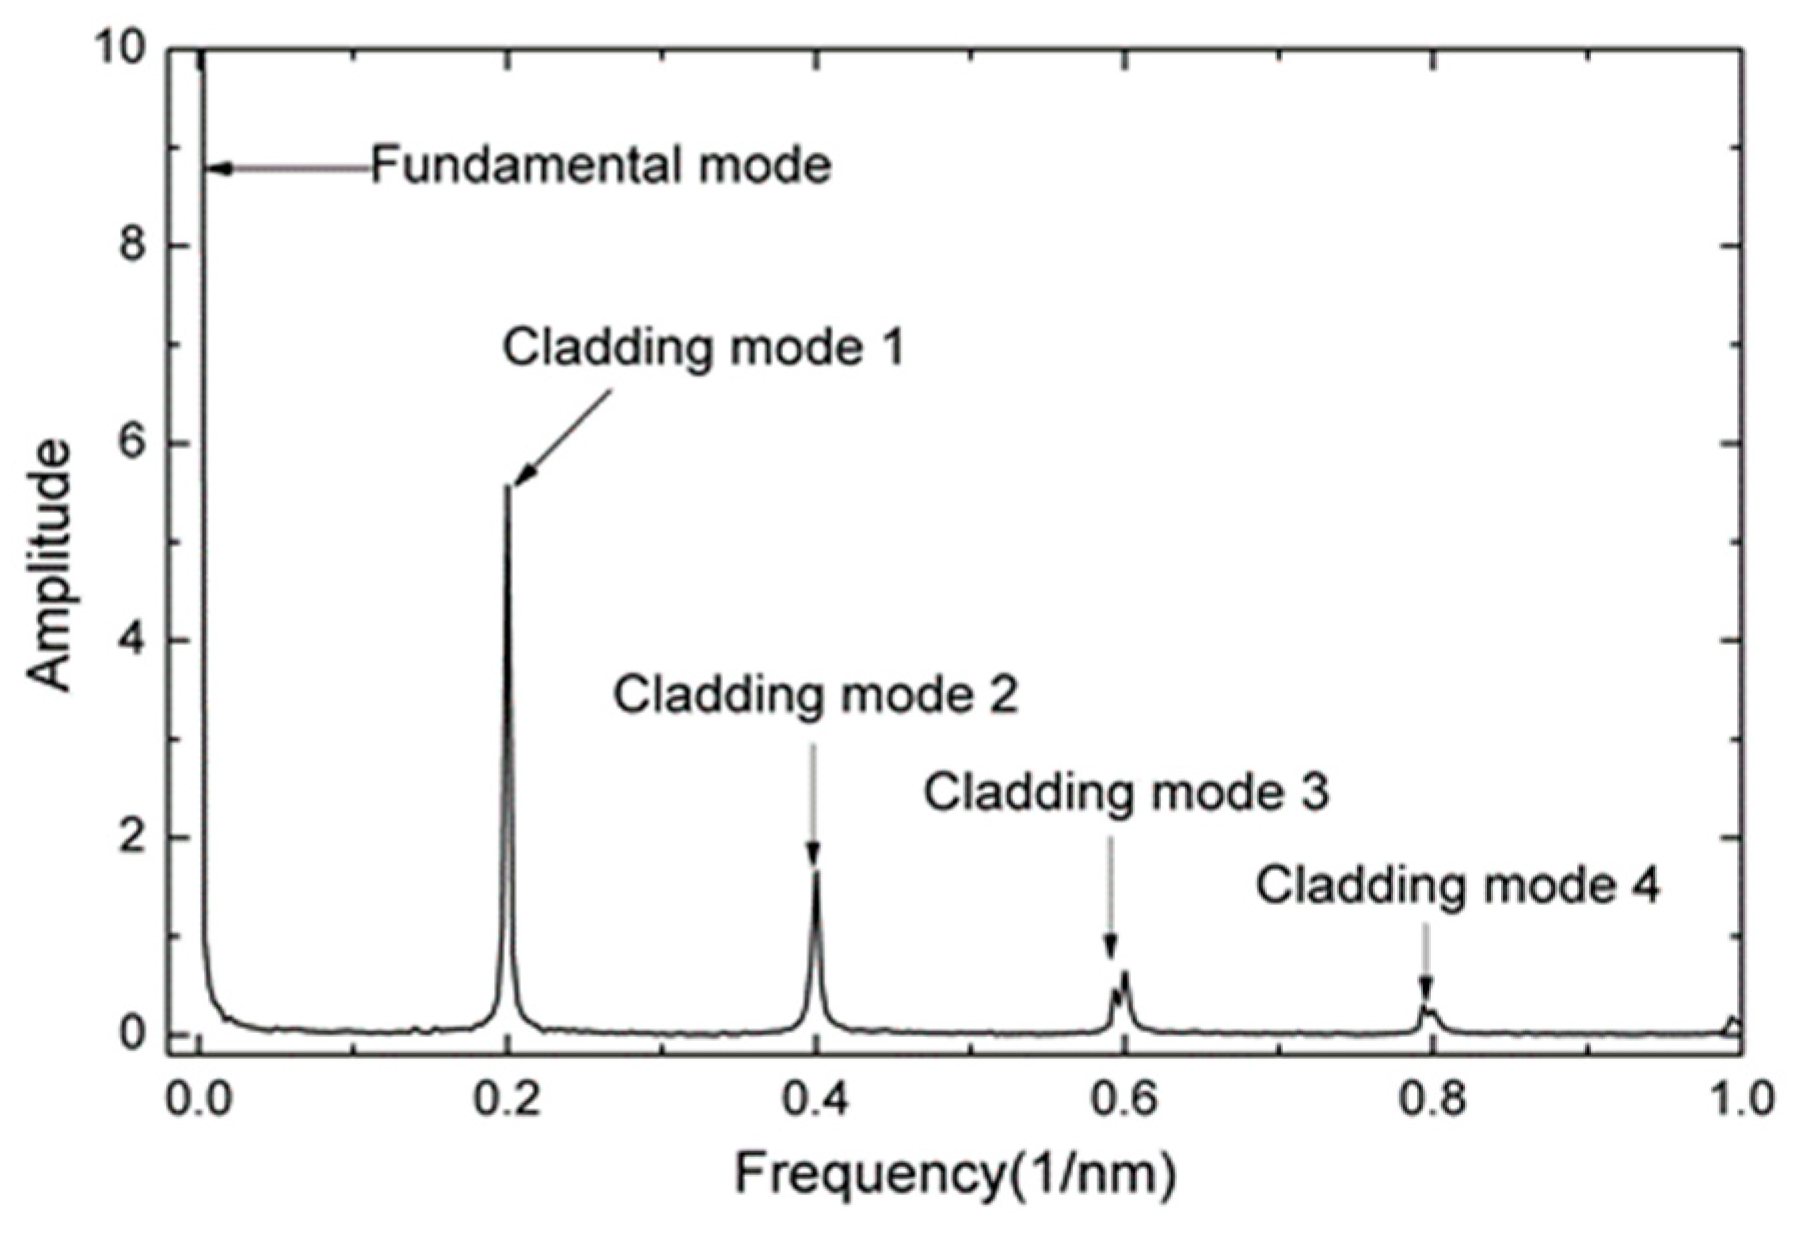
To determine information on mode distribution and its effects on the interferometric spectrum, Fast Fourier Transform (FFT) formula is used on the measured spectrum to obtain the spatial frequency spectrum of the MFI, as shown in
Figure 3. It can be observed that, apart from the fundamental mode, dominantly excited cladding mode (cladding mode 1) and weakly excited cladding mode (cladding mode 2, 3, and 4) were also stimulated in the spatial frequency spectrum. It is believed that interference occurs mainly between the fundamental mode and dominantly excited mode (cladding mode 1). The other cladding mode also contributes to the interference but is negligible due to relatively low light intensity propagates in the cladding. Thus, it can be concluded that the interference pattern is due to the combined action of the fundamental mode and cladding mode 1.
Figure 4 shows the schematic diagram of the experimental setup used for the ammonia nitrogen measurement. A high-power supercontinuum source (SC-5, YSL Photonics) covering a broad spectrum range (470–2400 nm) is used to launch light into the tapered MFI. The other end of the MFI was connected to OSA (AQ6375, Yokogawa, Tokyo, Japan). Ammonia nitrogen solution with different concentrations was obtained by diluting ammonia nitrogen standard solution (NH3-N) with pure water. The MFI was fixed and tautened on a narrow channel made from Perspex® glass. The narrow channel had a volume of 1000 µl where the MFI as a whole was immersed into the ammonia nitrogen solution at a concentration from 5–50 ppm with 5 ppm increment. The ammonia nitrogen solution is pumped slowly into the narrow channel through an inlet opening by a micro-injection pump. The solution is drained out through an outlet opening by an automated syringe pump. In each concentration, the measurement of the spectral shift from OSA was recorded after the MFI sensor was submerged in the solution for 5 min.
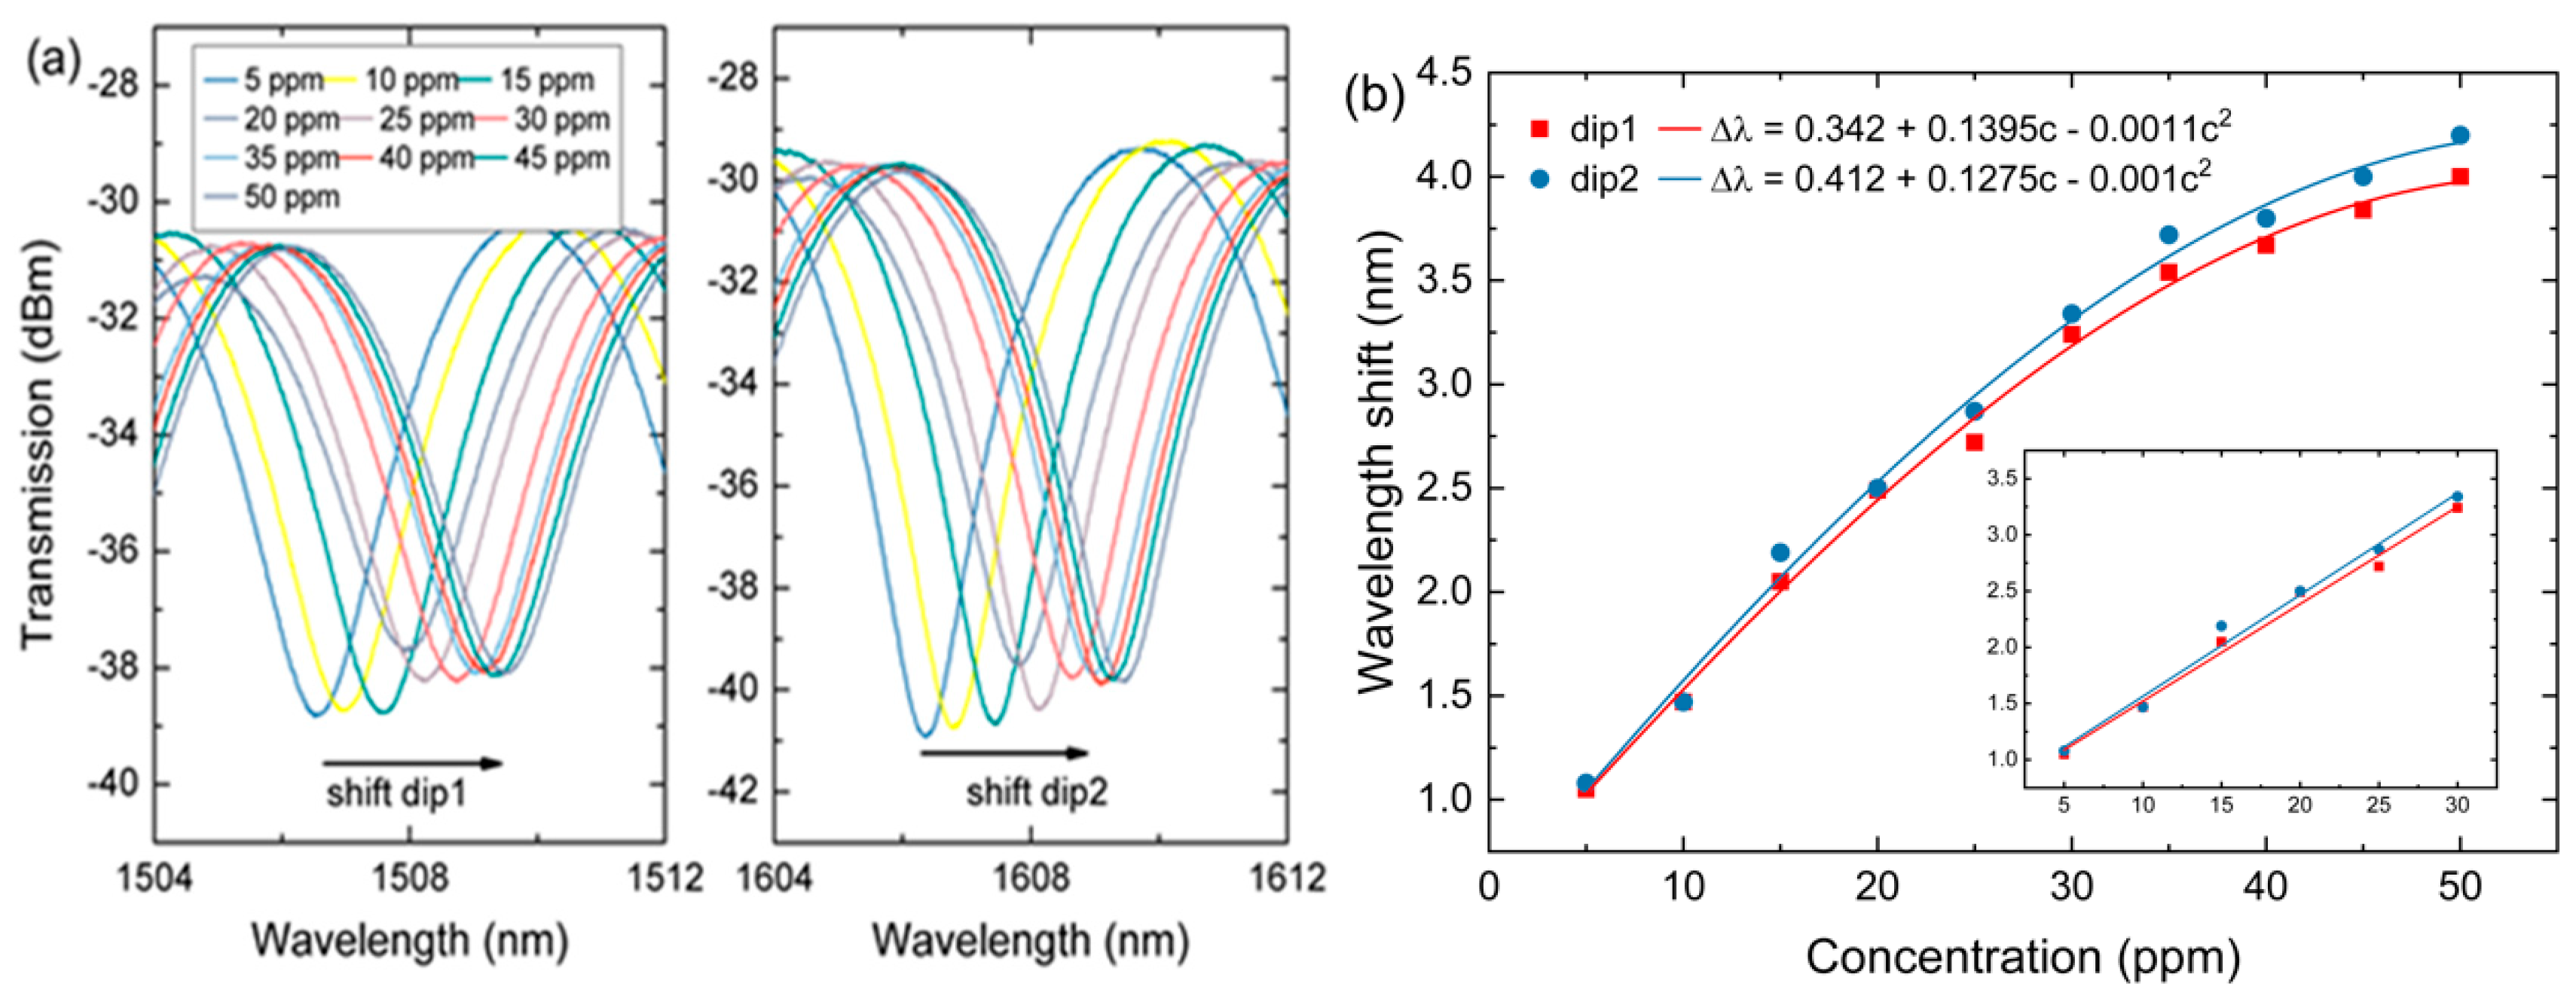
The transmission spectra of the MFI sensor that monitored around 1505 nm (dip1) and around 1605 nm (dip2) is shown in
Figure 5a. As can be seen, the dips in dip1 and dip2 shift toward longer wavelengths as ammonia nitrogen concentration increases from 5–50 ppm. For example, a concentration of 10 ppm produces a wavelength shift of 0.42 nm and 0.39 nm to the right at dip1 and dip2, respectively. The RI of the core,
, does not change and therefore continuous increase in the refractive index of the cladding,
, will lead to an increase in
. Consequently, according to Equation (3), a larger δλ is obtained which explains the redshift observation.
Figure 5b shows a nonlinear relation between dip shift (dip1 and dip2) and ammonia nitrogen concentration. The sensitivity of the sensor decreases with the increase of ammonia nitrogen concentration. The saturation of the sensitivity might be attributed to the limited tapered fiber sites for the interaction, particularly at higher ammonia nitrogen concentrations. As a result, an increase of ammonia nitrogen concentrations produces lesser optical response magnitude [
20]. Their respective sensitivities obtained at dip1 and dip2 are 0.0666 nm/ppm and 0.0703 nm/ppm. The nonlinearity curve of the transmission wavelength versus ammonia nitrogen concentration at dip1 is fitted as:
For dip2, the nonlinearity curve is fitted as:
where
is the change in wavelength shift and
c is the ammonia nitrogen concentration. As can be observed, the sensor starts to reach saturation at a concentration of 35 ppm. The inset in
Figure 5b shows the linear fit plot for low concentrations from 5–30 ppm for dip1 and dip2.
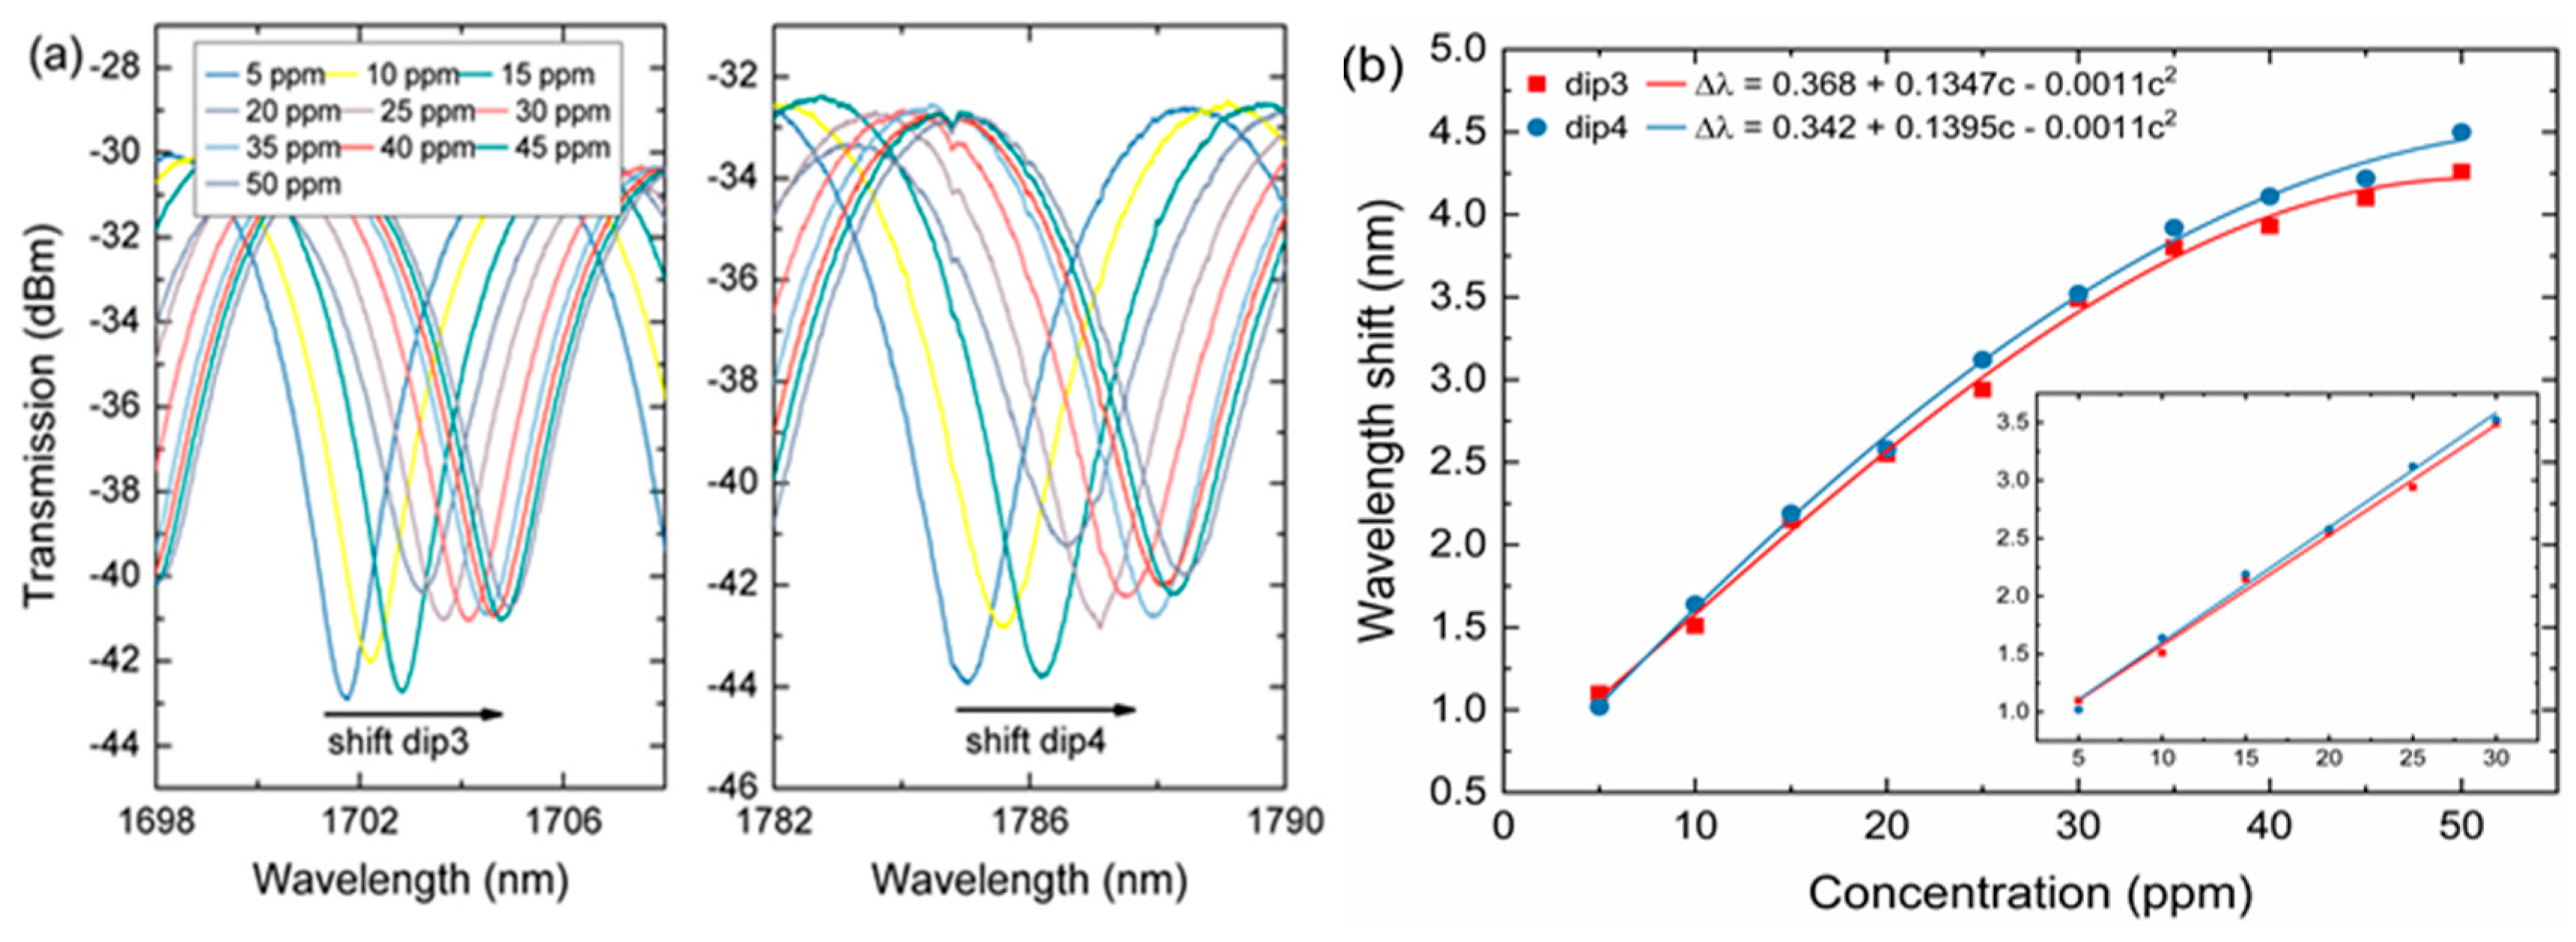
Figure 6a shows the transmission spectra of the interference dips around 1705 nm (dip3) and 1785 nm (dip4) of the MFI sensor. Similarly, it is easy to see the transmission spectra have undergone a redshift.
Figure 6b shows the measured data and plot for the nonlinear fitting for dip3 and dip4 indicating the sensitivities of 0.0724 nm/ppm and 0.0768 nm/ppm. The nonlinearity curve of the transmission wavelength versus ammonia nitrogen concentration at dip3 is fitted as:
For dip4, the nonlinearity curve is fitted as:
where
is the change in wavelength shift, and
c is the ammonia nitrogen concentration. The inset in
Figure 6b shows the response of the proposed MFI in the low concentration range of 5–30 ppm. At the interference dip3, the sensitivity obtained is 0.0951 nm/ppm, for which the linear fit is 0.995. At interference dip4, the sensitivity obtained is 0.099 nm/ppm, for which the linear fit is 0.994. The high sensitivity of the MFI sensor is due to the excitation of higher-order cladding mode, which is the key in the formation of a strong interference pattern. Compared with the other dips (dip1, dip2, dip3), dip4 exhibits a slightly higher dip shift under the same amount of changes in ammonia nitrogen concentration in water. This shows that the interference peaks have different sensitivities on the same RI changes [
19]. This might have resulted from the behavior of several cladding modes whose effective index might have a different dependency on any environmental changes.
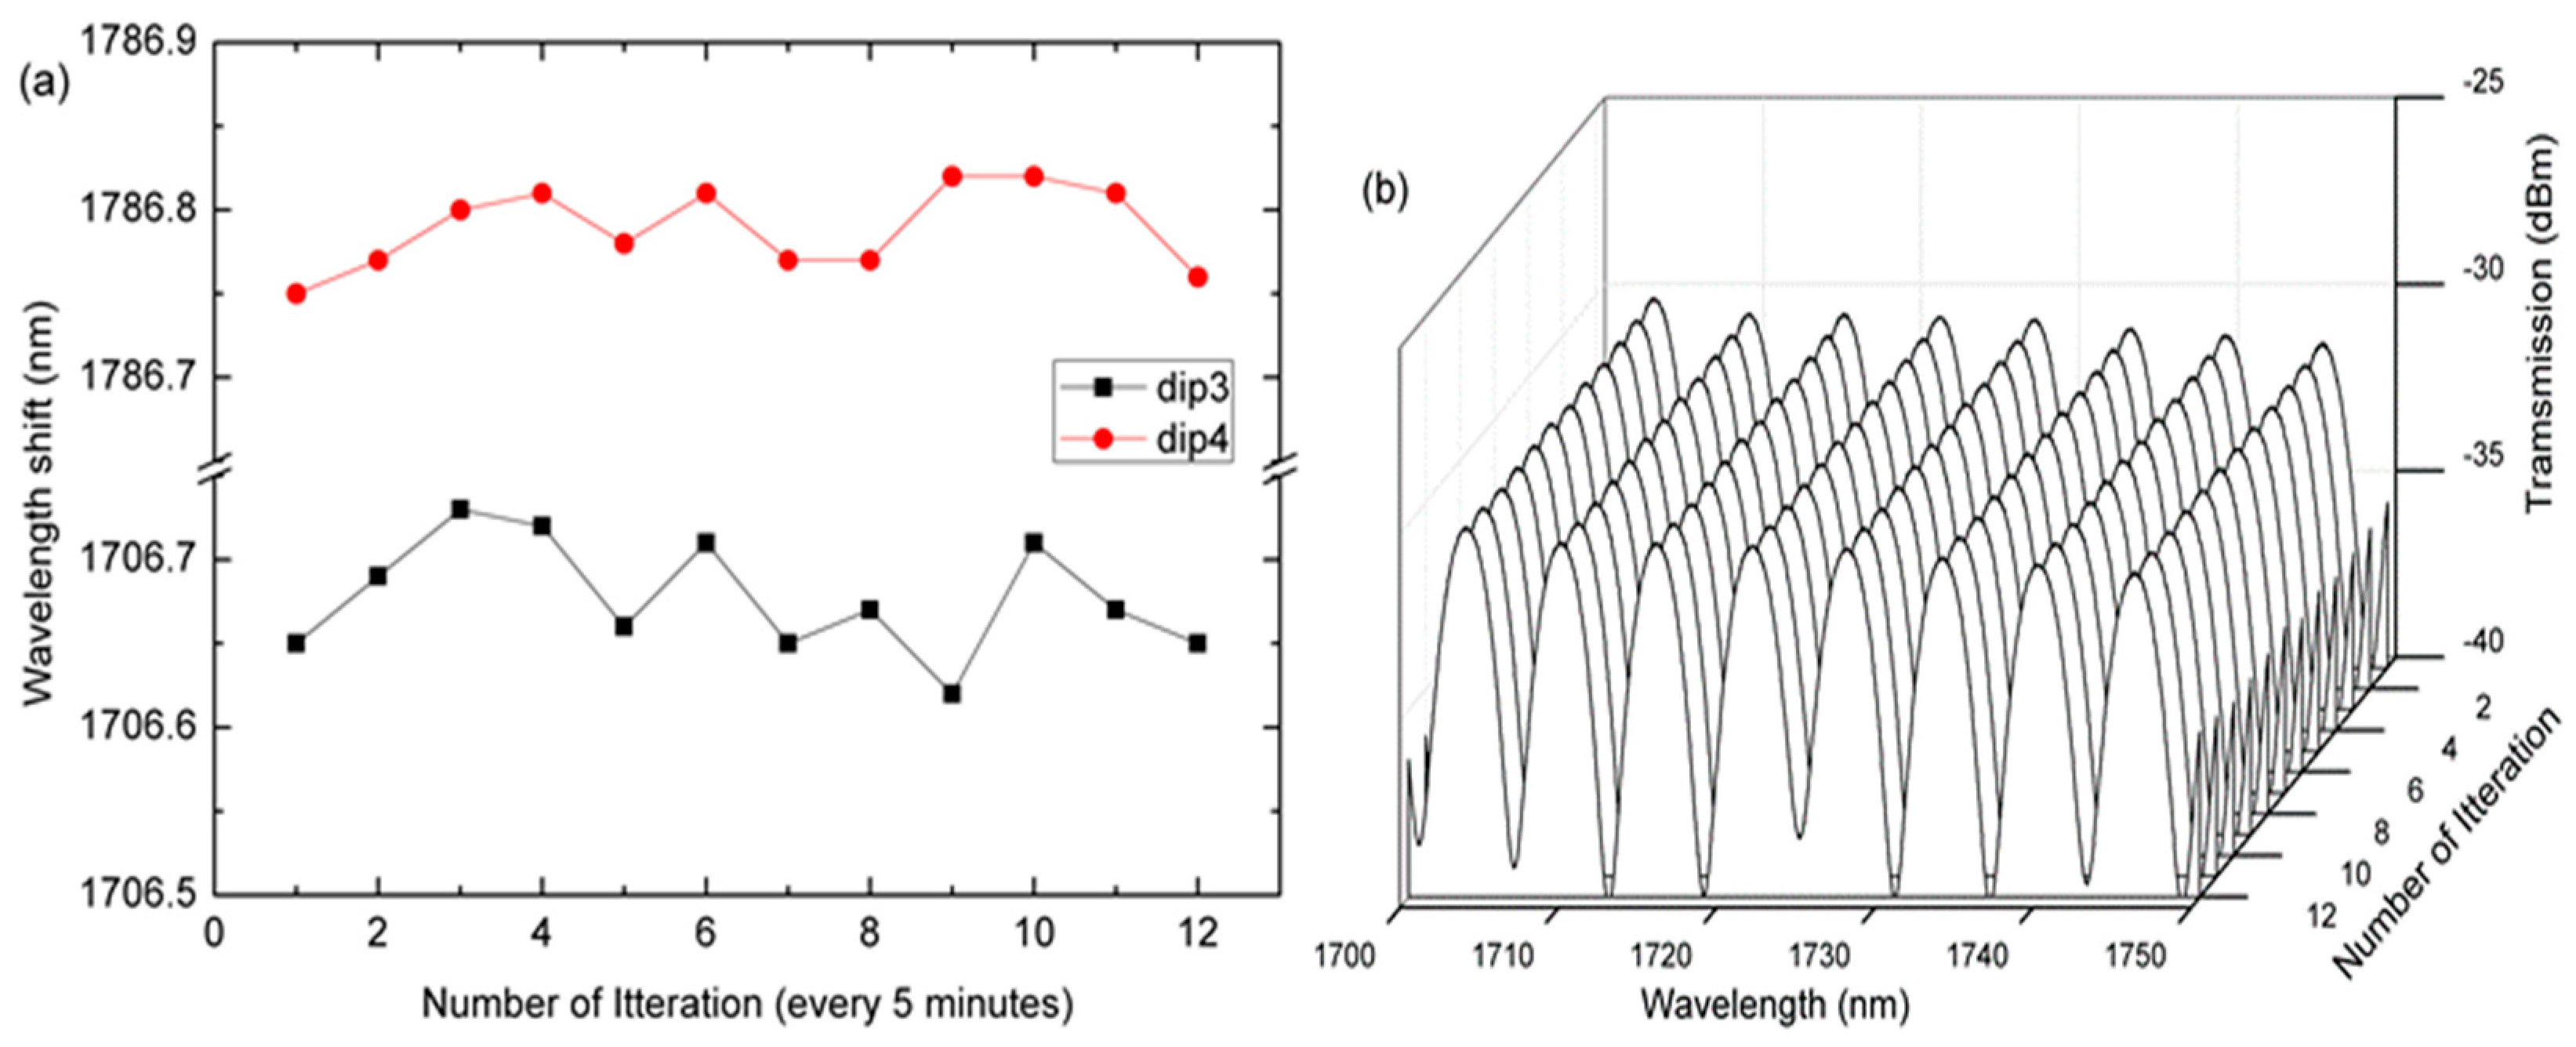
We also evaluated the stability of the sensor by immersing it into ammonia nitrogen for one hour.
Figure 7a shows the stability of the MFI sensor at 20 ppm for dip 3 and dip4. The standard deviation of the wavelength transmission spectrum at dip3 and dip4 was 0.03 nm and 0.02 nm, respectively.
Figure 7b shows the stability of the MFI transmission spectrum for the one-hour period during which the ammonia nitrogen remained relatively unchanged at 20 ppm.

 ,
, 


