1. Introduction
Chemical products contained in plants have been used in traditional medicine, pharmaceutic and perfumery products, and as a source of antioxidant treatments. Essential oils (EOs) contained in aromatic plants may, therefore, be valuable products provided that they are economically extracted.
In Spain, the biomass of common plants, such as cypress or rockrose, may be a good source of EO extraction since they are commonly available after forest enhancement treatments, such as pruning and clearing and sustainable logging exploitation, increasing the added value of silviculture. EO and methanol extracted from Mediterranean cypress (
Cupressus sempervirens L.) possess antimicrobial and antibiofilm properties, and therefore can be used as natural preservative ingredients in food and/or pharmaceuticals [
1]. Rockrose (
Cistus ladanifer) is also widely spread in the Mediterranean area, and may be a good source of natural antioxidants since extracts from this plant show methanolic, phenolic, and flavonoid contents as described in [
2]
Microwave-assisted extraction (MAE) of EOs and other valuable chemical compounds from aromatic herbs, and its variants, has been actively investigated during the last decades since it promises substantial cost and time savings and provides greater yields than conventional procedures. In [
3,
4], for instance, MAE was applied to basil, garden mint, thyme, and other species, such as ajowan, cumin, and star anise, without using any solvent to collect those essential oils.
MAE of phenolic substances from aromatic plants was also studied in [
5] by using different solvents. The results in this work show that time and solvent use were reduced and the extraction of phenolic compounds was increased versus conventional techniques.
The modelling and optimization of energy consumption for conventional and different MAE extraction procedures in many aromatic plants were proposed and tested in [
6]. In this work, the authors showed that MAE consumed less energy than conventional treatments in almost all studied cases and that a compromise between the employed energy and extraction efficiency exists.
Microwave-assisted hydro-distillation (MAHD) was used for the extraction of essential oil from
O. vulgare L. ssp. Hirtum [
7]. MAHD proved to be a technique with many advantages compared to conventional hydro-distillation, such as a shorter extraction time, better yields of essential oil, higher content of oxygenated compounds, and lower electrical consumption figures.
MAE processes’ efficiency greatly depends on the relative permittivity of aromatic plants and the microwave applicator design, and therefore the characterization of the dielectric constant and loss factor as a function of the temperature, density, and moisture content must be carried out in order to properly design industrial microwave applicators capable of obtaining high energy efficiency values and extraction yields.
Dielectric properties’ determination for every kind of material has been a widely researched issue for many years in the area of microwave applications. When materials are to be treated with microwaves for different purposes, such as drying, online moisture measurements, disinfestation, remote sensing, and others, thorough knowledge of the material’s dielectric properties becomes extremely important.
These measurements are commonly carried out as a function of the moisture content and microwave frequency. Additionally, in the area of biological and organic materials, an extensive activity, for determining dielectric properties, has been published in the literature and, specifically, many studies are about plants [
8,
9,
10,
11,
12,
13,
14,
15,
16,
17,
18,
19].
In [
8,
9], an application of microwave measurement techniques for determining the permittivity was proposed in the field of agricultural products. A similar technique is presented in [
10,
11] for fresh leaves from different plant species. In [
12,
13], dielectric models that only require measurement of the moisture content (MC) were investigated for alfalfa within different frequency ranges. In [
14], the dielectric response of corn leaves to water stress was analyzed for radar applications. Other plants like wheat [
15], two types of conifers [
16], apples [
17], and holly leaves in frozen environments [
18] have also been investigated. Other authors dealt with the issue of seasonal differences in the dielectric properties of dwarf woody tundra vegetation [
19].
For other specific plants, there are not yet many studies published about their dielectric properties. It is, in general, the case of aromatic plants like rockrose and cypress. An application to low-moisture rosemary can be found in [
20]. Nevertheless, the extraction of EO from aromatic herbs is an industrial process that can be conducted with the aid of microwave energy as an alternative to conventional hydro-distillation [
21], and permittivity measurements are necessary for equipment design.
The frequency range is, generally, one of the main aspects regarding dielectric measurements of materials. The different studies mentioned range from an extremely low frequency (<1 kHz) [
17], going by 1–1000 Hz [
10], 1.4 GHz [
19], 2.45 GHz [
20], 3.5 GHz [
14,
15], 5.5–7.5 GHz [
21], 7.5–8.5 GHz [
15], 1–10 GHz [
3], 300 MHz–11 GHz [
17], 300 MHz–18 GHz [
12,
13], 0.5–40 GHz [
18], and up to 100 GHz [
11].
To the best knowledge of the authors, however, there are not any works that describe the dielectric properties of cypress or rockrose biomass as a function of the temperature, density, or moisture content. Therefore, in this work, we present permittivity measurements for the biomass of these aromatic plants so that it can be further used in order to properly design efficient microwave applicators.
There are many techniques to obtain the permittivity of any kind of material. Additionally, there is a wide extension of literature containing data with the electrical properties of materials at different frequencies. Available techniques can be divided into resonant and non-resonant [
22]. Resonant methods can also be subdivided into resonant cavities, open resonators, and dielectric resonators [
23]. Additionally, sensing electromagnetic structures can be implemented using different transmission lines. Coaxial, waveguide, and microstrip lines are some usual examples to implement the measuring circuit [
24].
Some of these techniques use open configurations, where part of the energy is radiated into the ambient like in the free-space measurements, coaxial probes, or microstrip lines, while others show closed configurations, where the energy is confined in the measurement device like in a waveguide setup. Another classification can be made attending to the use of one port (reflection measurement) or two ports (transmission measurement) [
24]. In most of the cases, the sample is placed in a holder and this requires adapting the sample, or destructing it, to exactly fit it into its dimensions. Consequently, techniques can also be divided into destructive or non-destructive.
The rationale behind selecting one measuring technique in between the number of existing ones lies in the working frequency, the expected electrical losses of the material under test (MUT), and its homogeneity, shape, and adaptability to the holder. If the study must be carried out by varying the temperature, the existing techniques must be adapted with this purpose and some of them can be more easily adapted than others.
The conditions of the measurement process prevented authors from using other techniques like Nicholson Ross Weir in a closed waveguide configuration or open coaxial probes with available commercial kits from the brands SPEAG or Keysight. These last ones were unsuitable due to the material’s shape and its heterogeneity.
The selected device for the measurements uses a resonant technique that provides results nearby the frequency of interest, 2.45 GHz, and the sample was placed in a Pyrex vial that fits into a cylindrical cavity. The sample can be previously heated to obtain its properties while the temperature decreases. Resonant techniques use the frequency shift to provide the dielectric constant of the sample and the quality factor Q to obtain the loss factor. Although this technique is usually preferred for low-loss materials, it has been adapted, including the de-embedding of the feeding network to be suitable for high-loss materials [
23].
The obtained results show that, as a general trend, the permittivity of cypress and rockrose biomass increases with increasing values of the moisture content and density, whereas the biomass loss factor increases when the temperature rises.
2. Materials and Methods
2.1. Permittivity Measurement Equipment
The heterogeneous composition of the biomass used in this study (fine twigs with leaves) and its handling limit the techniques suitable for its permittivity measurement. For instance, the coaxial probe technique may produce important errors due to the air gaps present in the biomass composition. As temperature variation is also important to predict the behavior of the biomass complex permittivity during MAE procedures, waveguide techniques are complex to implement. Additionally, the impedance technique is limited in frequency and sample thickness. Therefore, resonant procedures seem to be the best ones to suit the conditions of heterogeneity, temperature, density, and moisture content during the permittivity measurement of cypress and rockrose biomass.
Thus, a Dielectric Kit for Vials (DKV) from ITACA institute [
25] was used to perform all the relative complex permittivity measurements. This equipment can determine the dielectric constant and loss factor of a wide range of liquid, granular, or powdered materials around 2.45 GHz. Its measurement procedure is based on a resonant technique and, therefore, the real and imaginary part of the relative permittivity are estimated by measuring the changes of the resonant frequency and quality factor of the instrument with and without material. This standalone equipment implements a resonant coaxial bi-reentrant microwave cavity, where the material under test is placed inside a vial and the complex permittivity is obtained by using numerical methods based on mode-matching and circuit analysis. Although resonant techniques are usually preferred for low-loss materials, the technique employed by DKV includes the de-embedding of the feeding network to be suitable for high-loss materials [
22].
The DKV operates in a frequency bandwidth ranging from 1.5 to 2.6 GHz. It can provide dielectric constant values lower than 100 and loss factor values ranging from 0.001 to 15. The accuracy for the measurements is around 1% for the dielectric constant and a minimum of 5% accuracy is ensured for the loss factor. Repeatability and linearity values provided by manufacturer are around 0.2%.
During the permittivity measurements of both cypress and rockrose biomass samples, the resonant frequencies of the equipment ranged from 2.464 to 2.561 GHz and from 2.390 to 2.562 GHz, respectively. It must be noticed that the selected device provides the permittivity result for just one frequency nearby 2.45 GHz and cannot provide a wide-band characterization, which would be more useful. However, since the purpose of the study was to obtain the permittivity of the material for microwave-heating purposes at the specified ISM frequency, its use seemed reasonable.
Obviously, this becomes a disadvantage if the characterization for other interesting ISM frequencies like 915 or 27 MHz is needed. In this case, another measuring alternative should be evaluated.
2.2. Biomass Sample Preparation
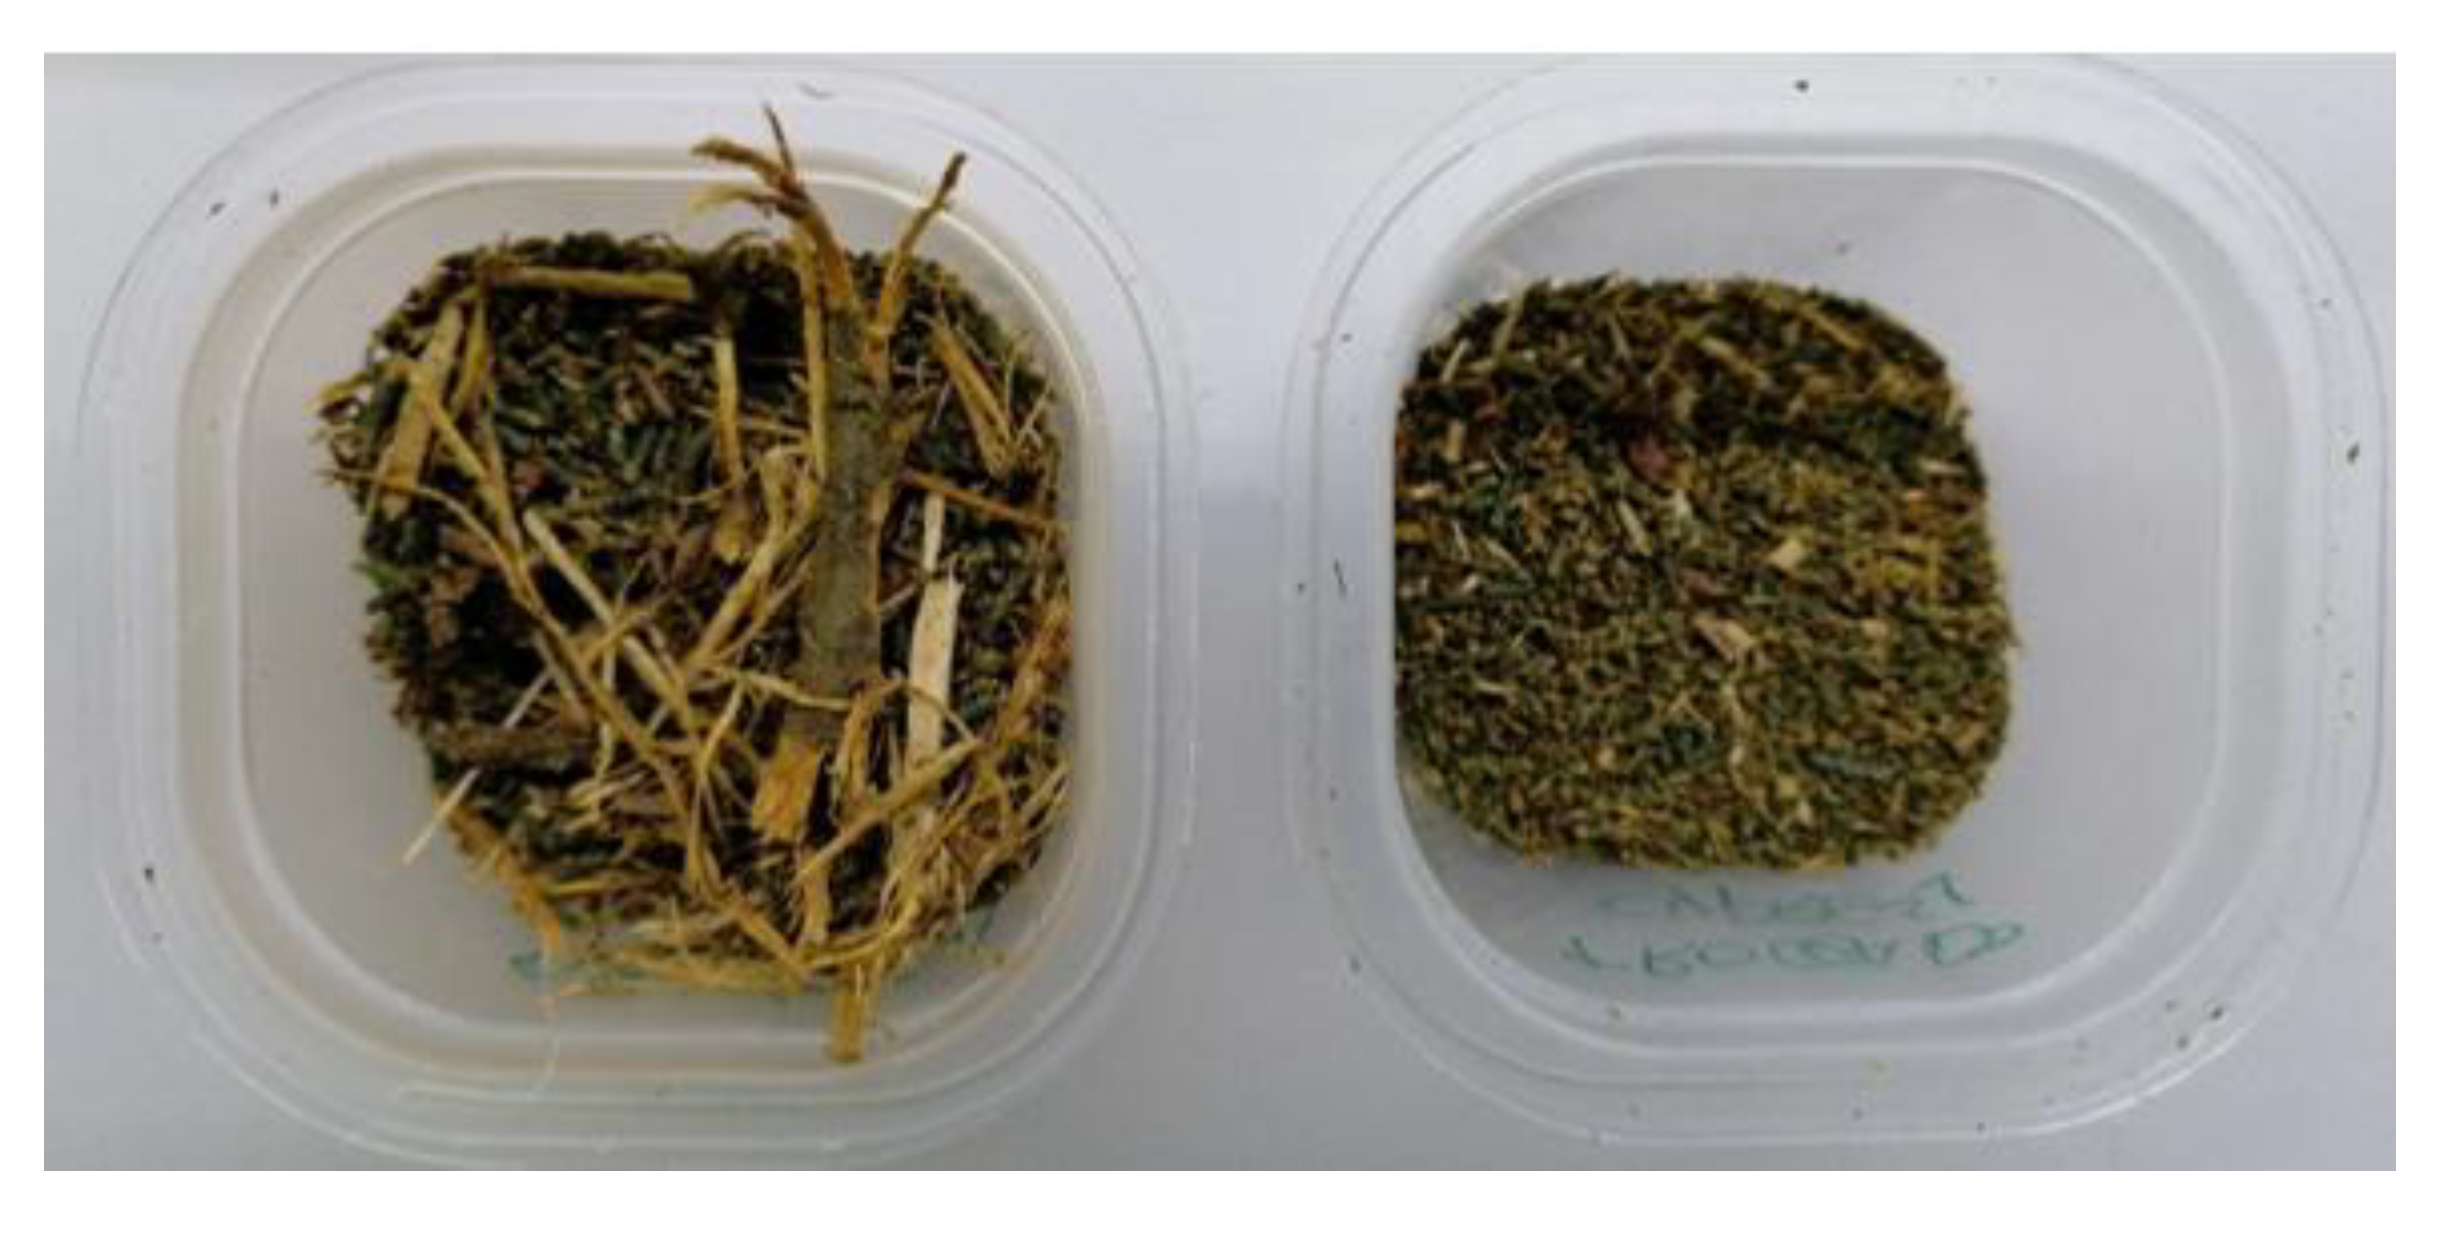
Two sorts of biomass were studied in this work: Mediterranean cypress and rockrose plants collected in the province of Soria (Spain). For each kind of plant, the samples were prepared by introducing a biomass of cypress or rockrose ranging from 1 to 1.8 g in 6-mL quasi-cylindric polypropylene test tubes (Deltalab Ref. 400400) with an internal diameter of 10.3 mm and a height of 96.9.
Biomass materials (twigs) were collected manually and were prepared by milling 10 kg in a hammermill with a screen pore size of 10 mm.
Each sample of cypress and rockrose biomass contained leaves, small limbs, stalks, etc. in a heterogeneous mixture, where the largest pieces had a length of up to 40 mm and the shortest pieces did not even reach 2 mm. In order to avoid the uncertainty generated by this heterogeneity and to reduce airgaps, the largest pieces were chopped in pieces with a maximum length of 5 mm as shown in
Figure 1 and then introduced in the polypropylene tubes. This sample conditioning is a compromise between the biomass milling process carried out before the microwave-assisted hydro-distillation process and the granulate specifications of the DKV instrument.
For each biomass sample, three different permittivity measurements were carried out and the average value of the three measurements was used as the valid measurement. This procedure was done in order to reduce the uncertainty of the procedure.
Additionally, the permittivity measurements depending on the temperature, moisture content, and density were carried out by averaging the results of three different samples as explained in the next sections.
2.3. Measurement Procedure for Temperature Dependence of Biomass Complex Permittivity
The procedure for measuring the permittivity of biomass samples as a function of temperature is similar to the one described in [
26].
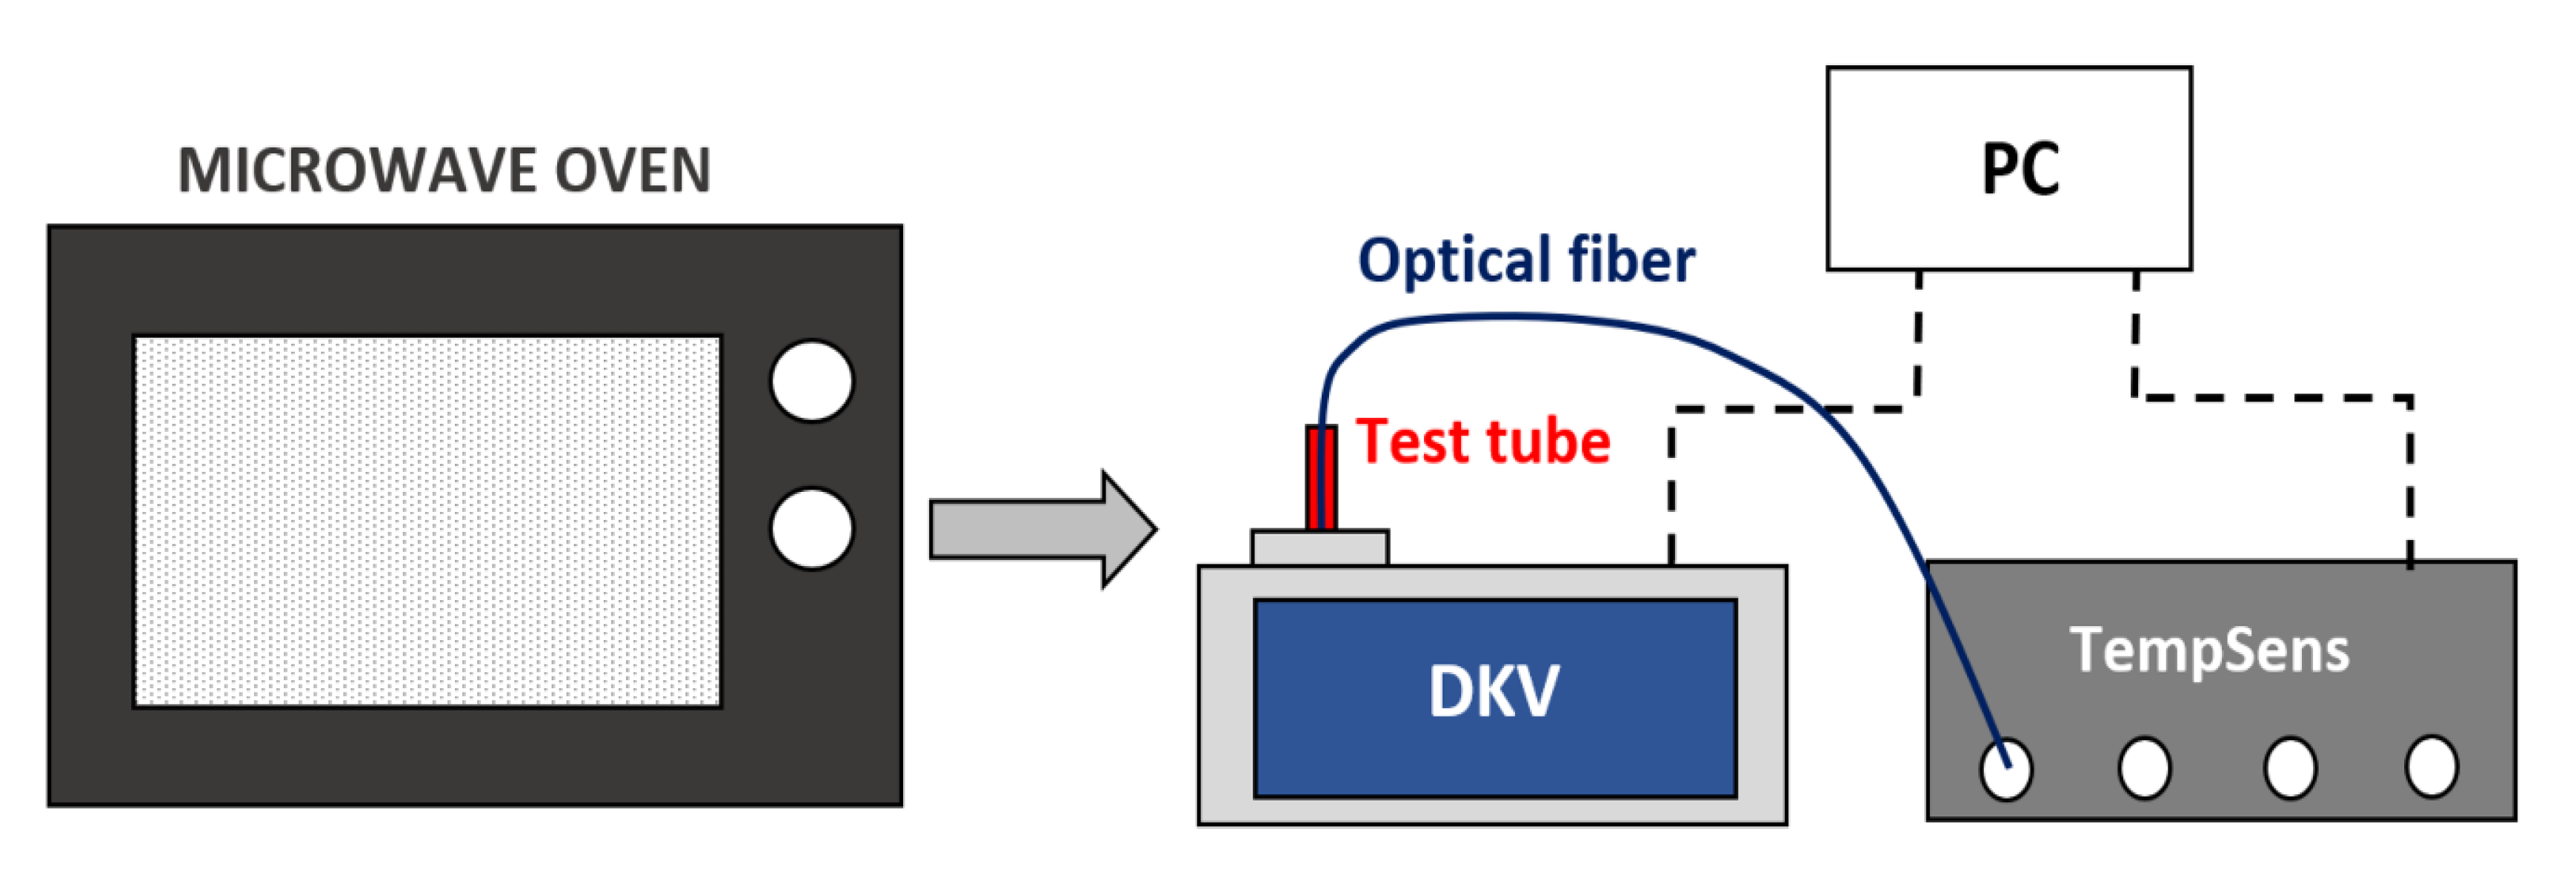
Figure 2 shows a scheme of the setup employed for measurements. The sample to be measured was introduced in a 150-mL glass of water and then was heated in a conventional microwave oven until the water boiled.
The polypropylene test tube was then rapidly dried in order to avoid any presence of little drops on its external surface that might ruin the measured dielectric properties and then it was introduced in the sample container of the DKV. An optical fiber was then introduced in the biomass sample in order to collect the temperature data. A Labview program was used to control the TempSens thermometer from OpSens and to collect both the biomass temperature and time data [
27]. The TempSens temperature accuracy is equal to ±0.8 °C or better for temperatures higher than 45 °C and equal to ±0.3 °C or better for temperatures lower than 45 °C.
At the same time, the DKV saved the relative complex permittivity and the time data in a txt file. Both temperature and permittivity text files were processed in Matlab to assign the dielectric properties to the measured temperature data by comparing temperature and permittivity time vectors. It must be remarked that data from the three tests for every biomass sample were collected and averaged for each complex permittivity value.
The sample temperature was measured following Newton’s law of cooling and therefore more permittivity data were obtained for lower temperatures than for higher ones since the sampling rate for DKV cannot be modified and temperature decreases faster for higher temperatures. Therefore, in order to average the permittivity measurements with the similar temperature, we grouped the biomass permittivity data obtained for the 9 tests, corresponding to 3 samples and 3 tests per sample, within 1 °C ranges and averaged them in each temperature range.
For both cypress and rockrose biomass measurements, the first temperature measurement group was contained between 84.5 and 85.5 °C and the averaged obtained values were assigned to 85 °C, and the final temperature group was contained between 29.5 and 30.5 °C and the averaged values were assigned to 30 °C.
The moisture content and the density of all samples were kept constant during these measurements. For the cypress biomass permittivity measurements depending on temperature, the dry-basis moisture content for samples was around 100% and the density was close to 0.34 g/cm3. In the case of the rockrose permittivity measurements depending on temperature, those values were 100% and 0.3 g/cm3 for the moisture content (dry basis) and density, respectively.
2.4. Measurement Procedure for Biomass Permittivity Variation Versus Density
The variation of the cypress and rockrose permittivity versus density was also studied in this work. The volume of biomass for all samples was kept constant while the mass ranged from 1 to 1.8 g. The mass sample was measured by means of a weighing scales from GRAM, model SV, with an accuracy of 0.1 g. The sample volume of 4.17 cm3 was obtained considering a cylindrical volume of a 10.3 mm diameter (the test tube specification) and a filling height of 4.8 cm.
The test tubes were filled slowly with biomass driblets while shaking the tube after each load in order to reduce as many air gaps within the sample as possible. The first set of samples had 1 g of mass, and some pressure was applied on them until their filling level reached a mark on the test tube, matching the required initial density of 0.24 g/cm3. Higher densities were sequentially achieved by increments of 0.2 g and compacting the biomass until reaching the same height level as before, so its volume was kept constant.
The studied values of density for both cypress and rockrose biomass are shown in
Table 1.
The minimum density obtained for both cypress and rockrose samples was 0.24 g/cm3, whereas the maximum density was 0.43 g/cm3. The permittivity versus density results were computed as the average of three samples per density value and three measurements per sample.
During density-dependent measurements, the sample temperature was fixed to 28 °C (environment temperature). The dry-basis moisture content was 100% for both cypress and rockrose during all measurements.
2.5. Measurement of the Influence of Moisture Content over the Biomass Permittivity
Another study carried out in this work consisted of measuring the dielectric properties versus the moisture content of biomass samples. In order to reduce the moisture content, three biomass samples of both cypress and rockrose with densities of 0.43 gr/cm3 were introduced in test tubes and then they were gradually dried.
The process of drying was accomplished as follows: All biomass samples were introduced in a traditional electrical oven during one hour at a fixed temperature of 105 °C. After each drying period, we extracted the samples and waited until they reached the room temperature of 28 °C. Then, the mass of each sample was weighted in order to know the amount of evaporated water and the dielectric properties were measured in the DKV. This procedure was repeated until all test tubes were completely dried, i.e., the mass of each test tube was the same after two consecutive drying periods in the traditional oven. The dry mass of each sample was then obtained as the last sample mass measured in this procedure.
In this work, the moisture content,
X, was expressed as a dry basis as shown in Equation (1):
where
mw (gr) is the sample mass with some moisture inside and
md (gr) is the mass of the dried sample. Please be aware that
represents the mass of the water content, and therefore
X accounts for the mass water versus the dried solid mass.
The results of the permittivity values as a function of the moisture content were computed using the averaged values from three samples of each biomass type (cypress and rockrose) with a density of 0.43 g/cm3.
4. Discussion
Permittivity measurements for biomass samples of cypress and rockrose were presented in this work. They were carried out with resonant techniques near the 2.45 GHz ISM frequency. The dependence of both the dielectric constant and loss factor versus temperature, density, and moisture content was shown.
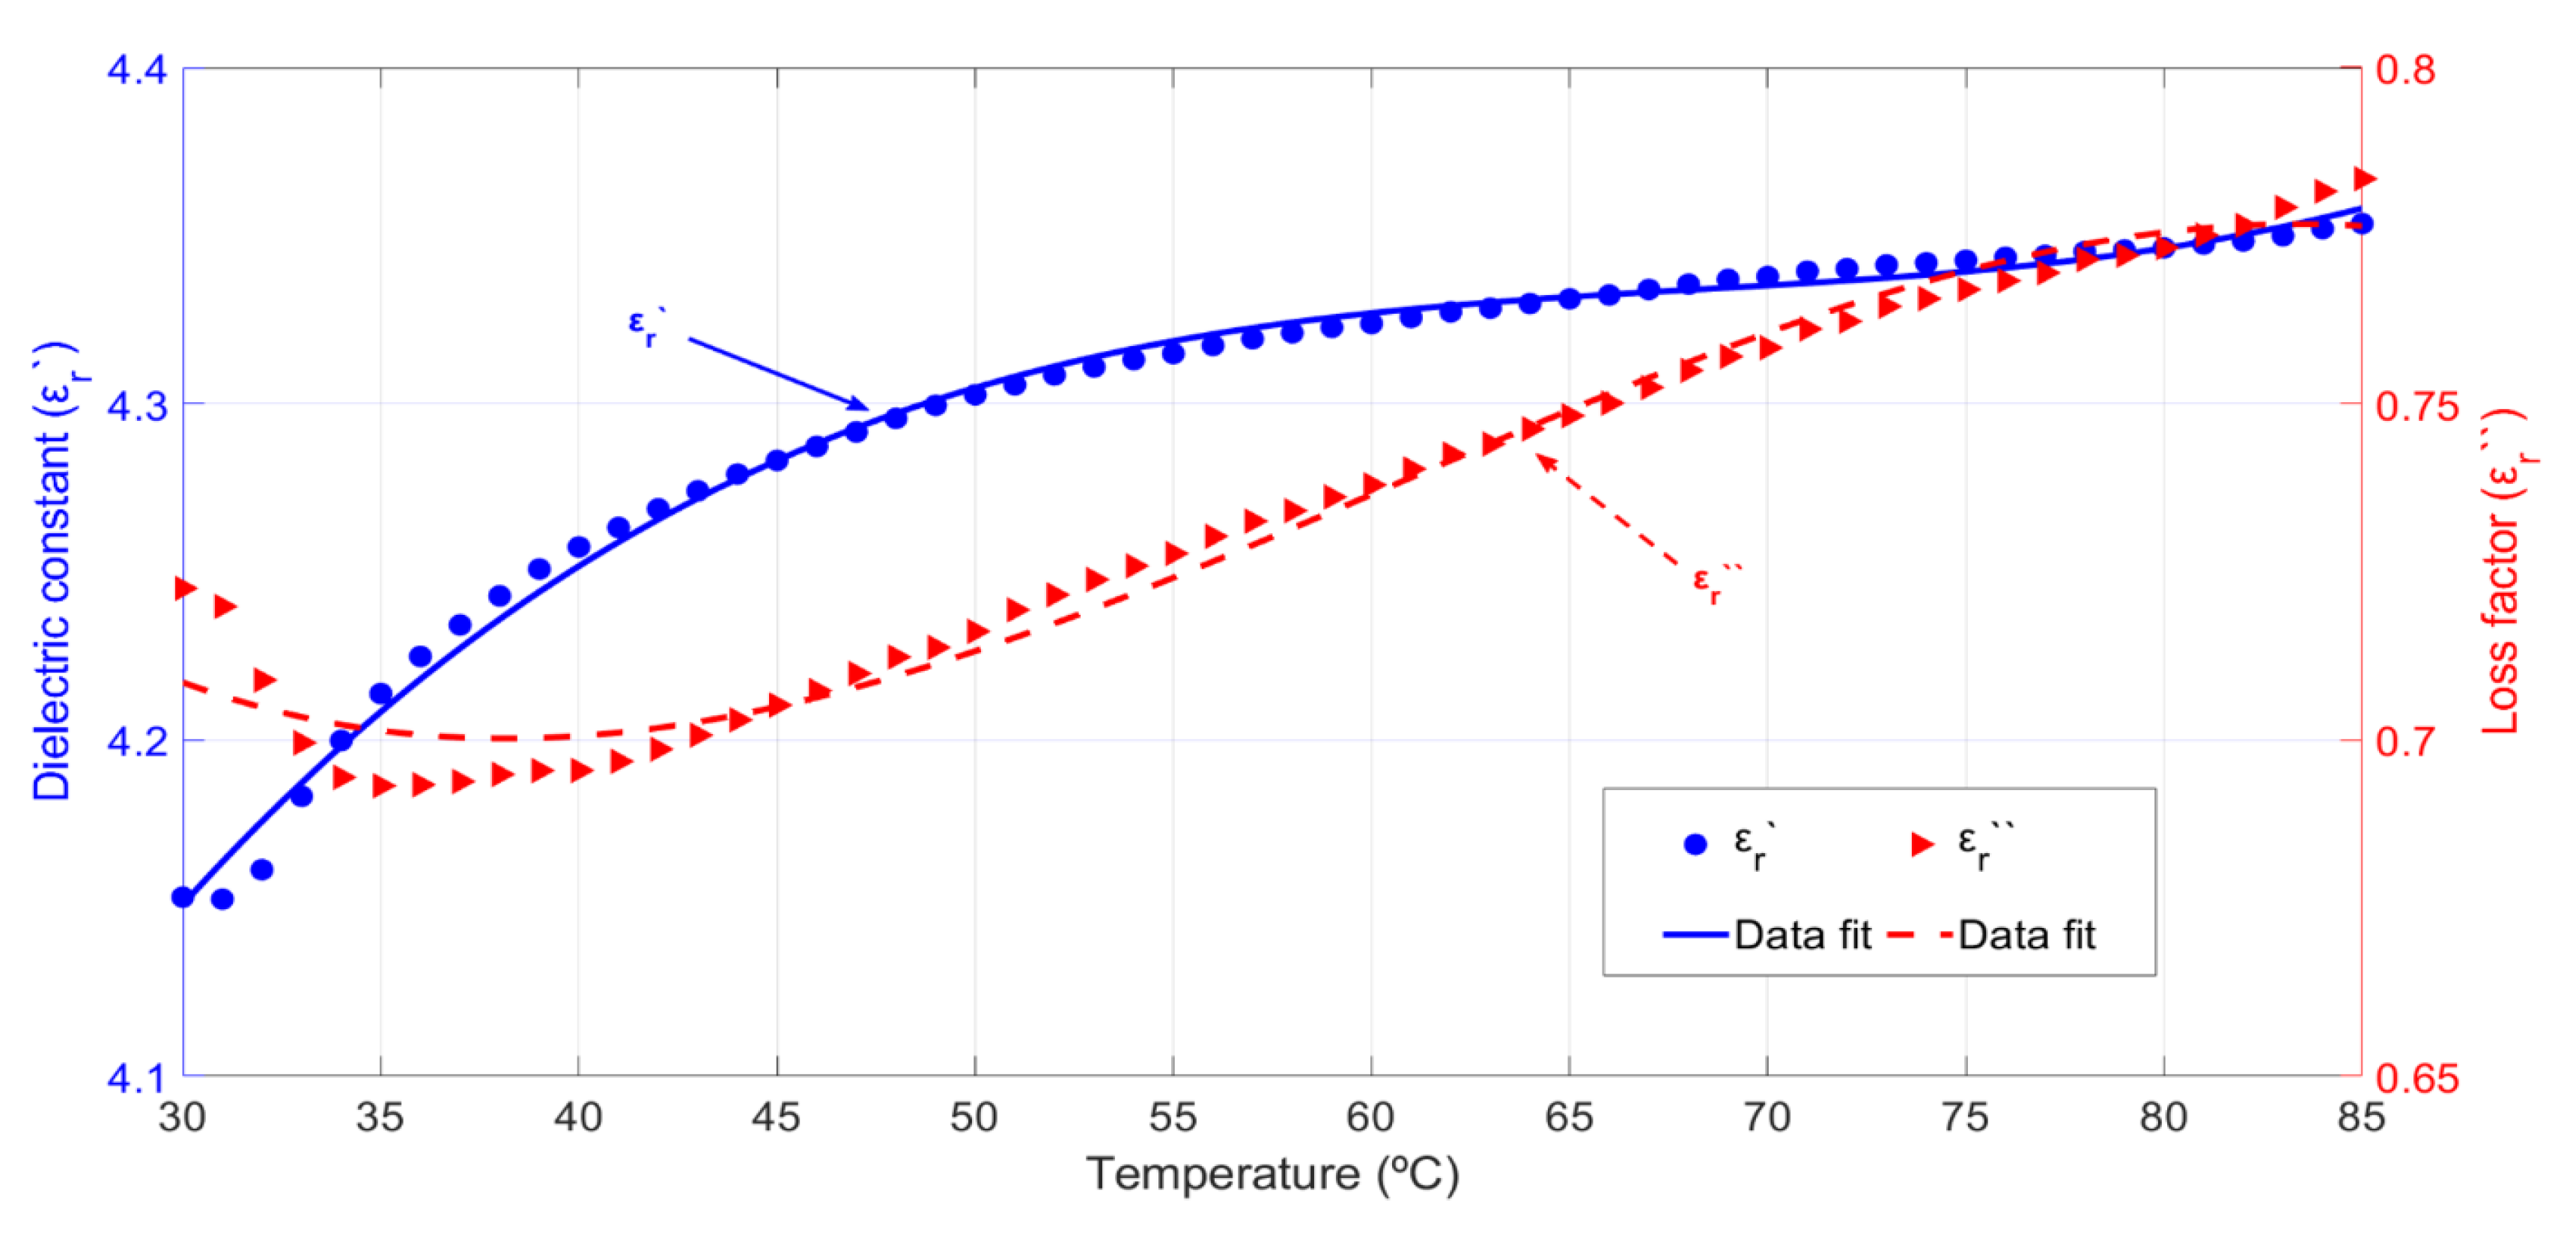
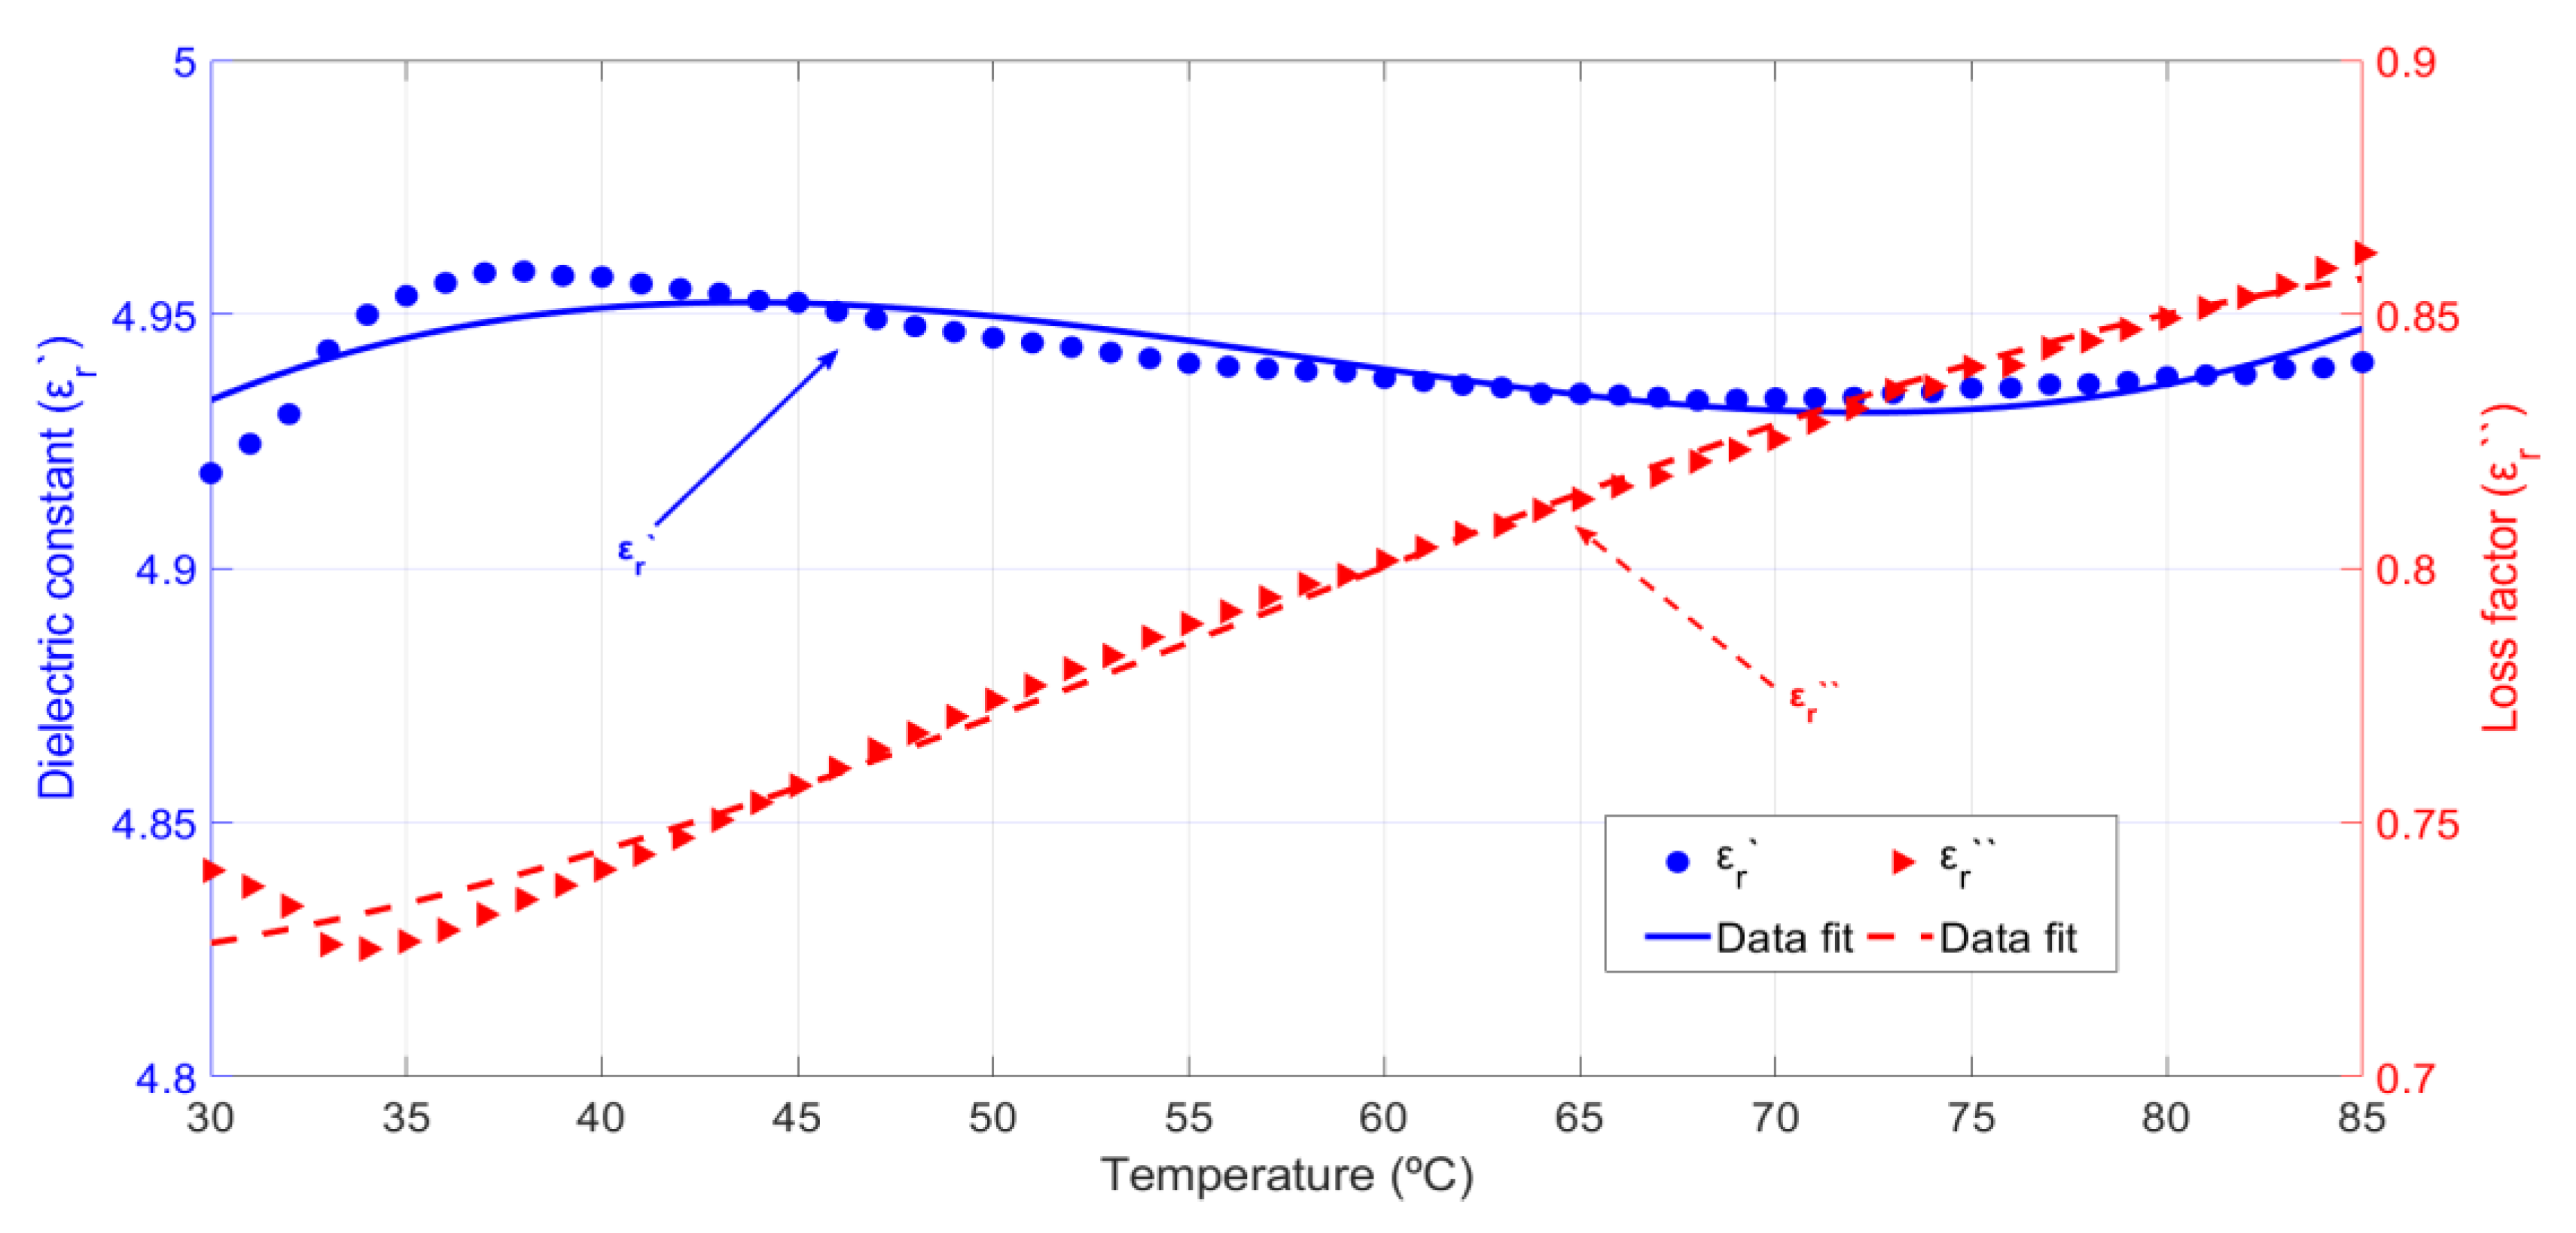
The obtained results for both rockrose and cypress biomass samples indicate that temperature has a limited influence on the dielectric constant, at least for temperatures ranging from 30 to 85 °C. However, the loss factor of both cypress and rockrose biomass increases around 8.8% and 16%, respectively, in that temperature range with increasing temperatures.
It must be remarked that this behavior is different from that measured for pure water as shown in [
28]. Whereas pure water shows decreasing values for its dielectric constant and loss factor when temperature increases, the cypress biomass dielectric constant increases and the real part of rockrose biomass permittivity stays constant. Additionally, the loss factors of both kinds of biomass increase with rising temperatures.
The explanation for this behavior can be found in [
29,
30]: When temperature increases, free water is released from its bound state inside the biomass cells and, therefore, the dielectric constant and, specially, the loss factor increase their values. Therefore, the increased mobility of water within plants due to higher temperatures compensates for the effect that temperature has on pure water.
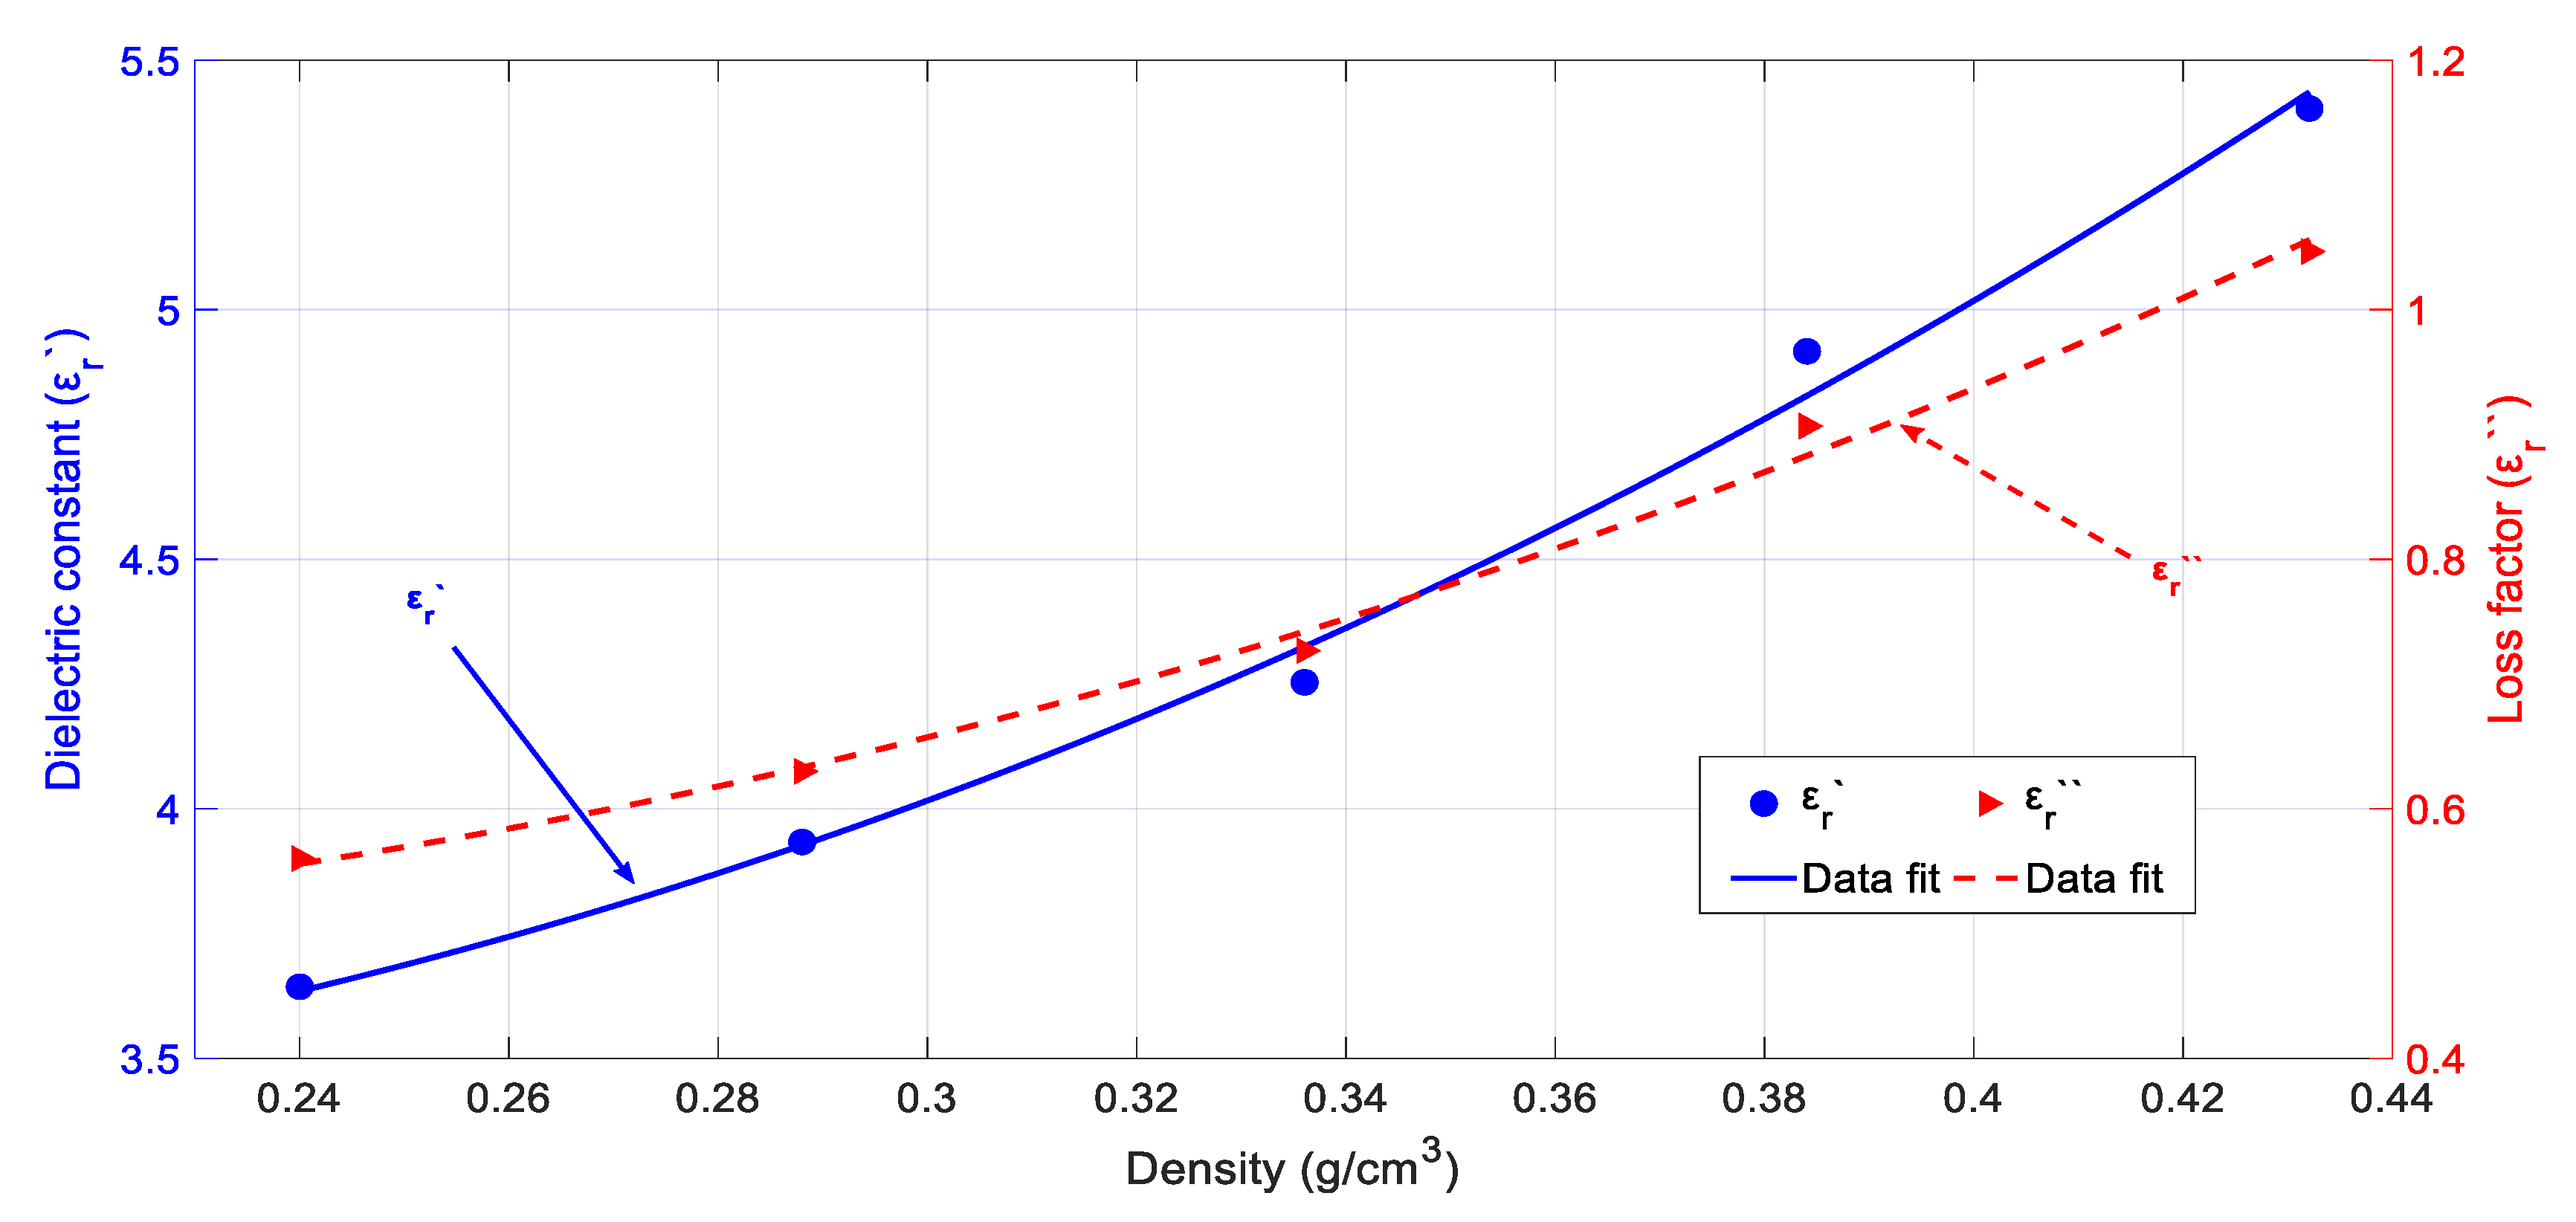
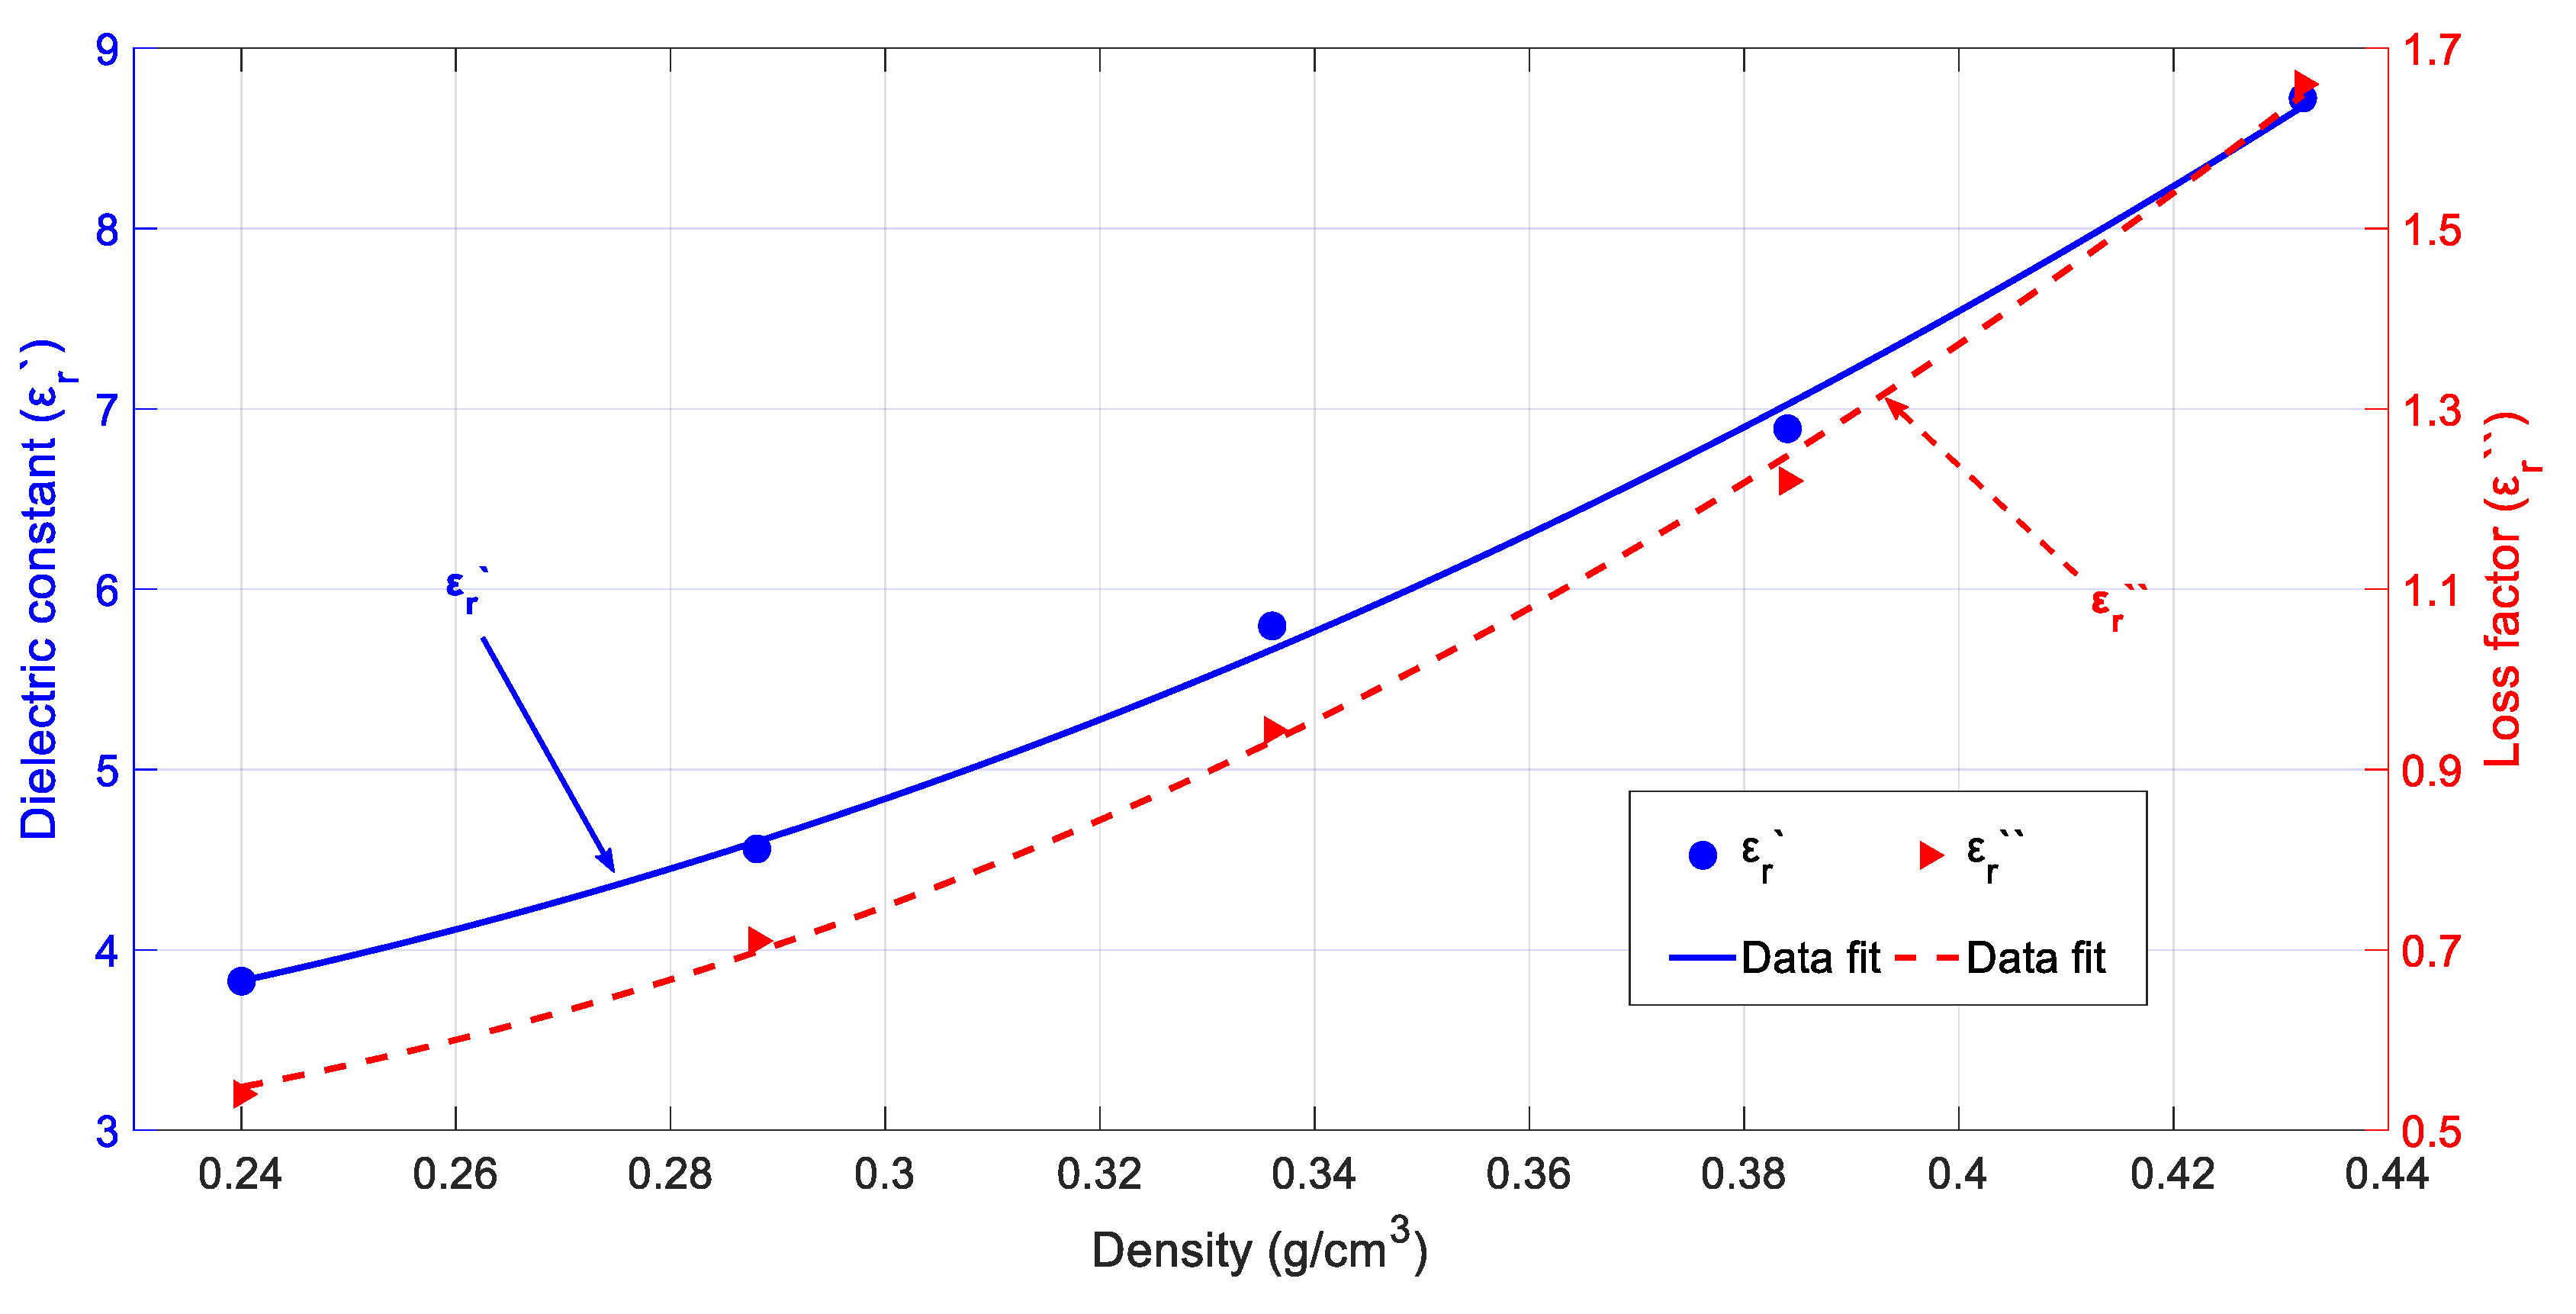
Density has a much more important influence on both the dielectric constant and loss factor values. Dielectric constant variations range from 48% to 125% for cypress and rockrose, respectively, whereas the loss factor variations versus density range from 91% to 200% for cypress and rockrose, respectively. Therefore, density should be carefully considered when designing an MAE applicator since it can largely affect its efficiency and temperature distribution.
High density values for cypress or rockrose biomass will ensure high loss factor values and, therefore, a high capacity for microwave absorption. This usually leads to high power efficiency values of the microwave applicator and high heating rates. However, the penetration depth will decrease with increasing the density values and therefore uniform heating will be more difficult as the density grows since most microwave energy will dissipate near the biomass surface. Therefore, a compromise between microwave absorption and uniform heating patterns should be considered when choosing the biomass density.
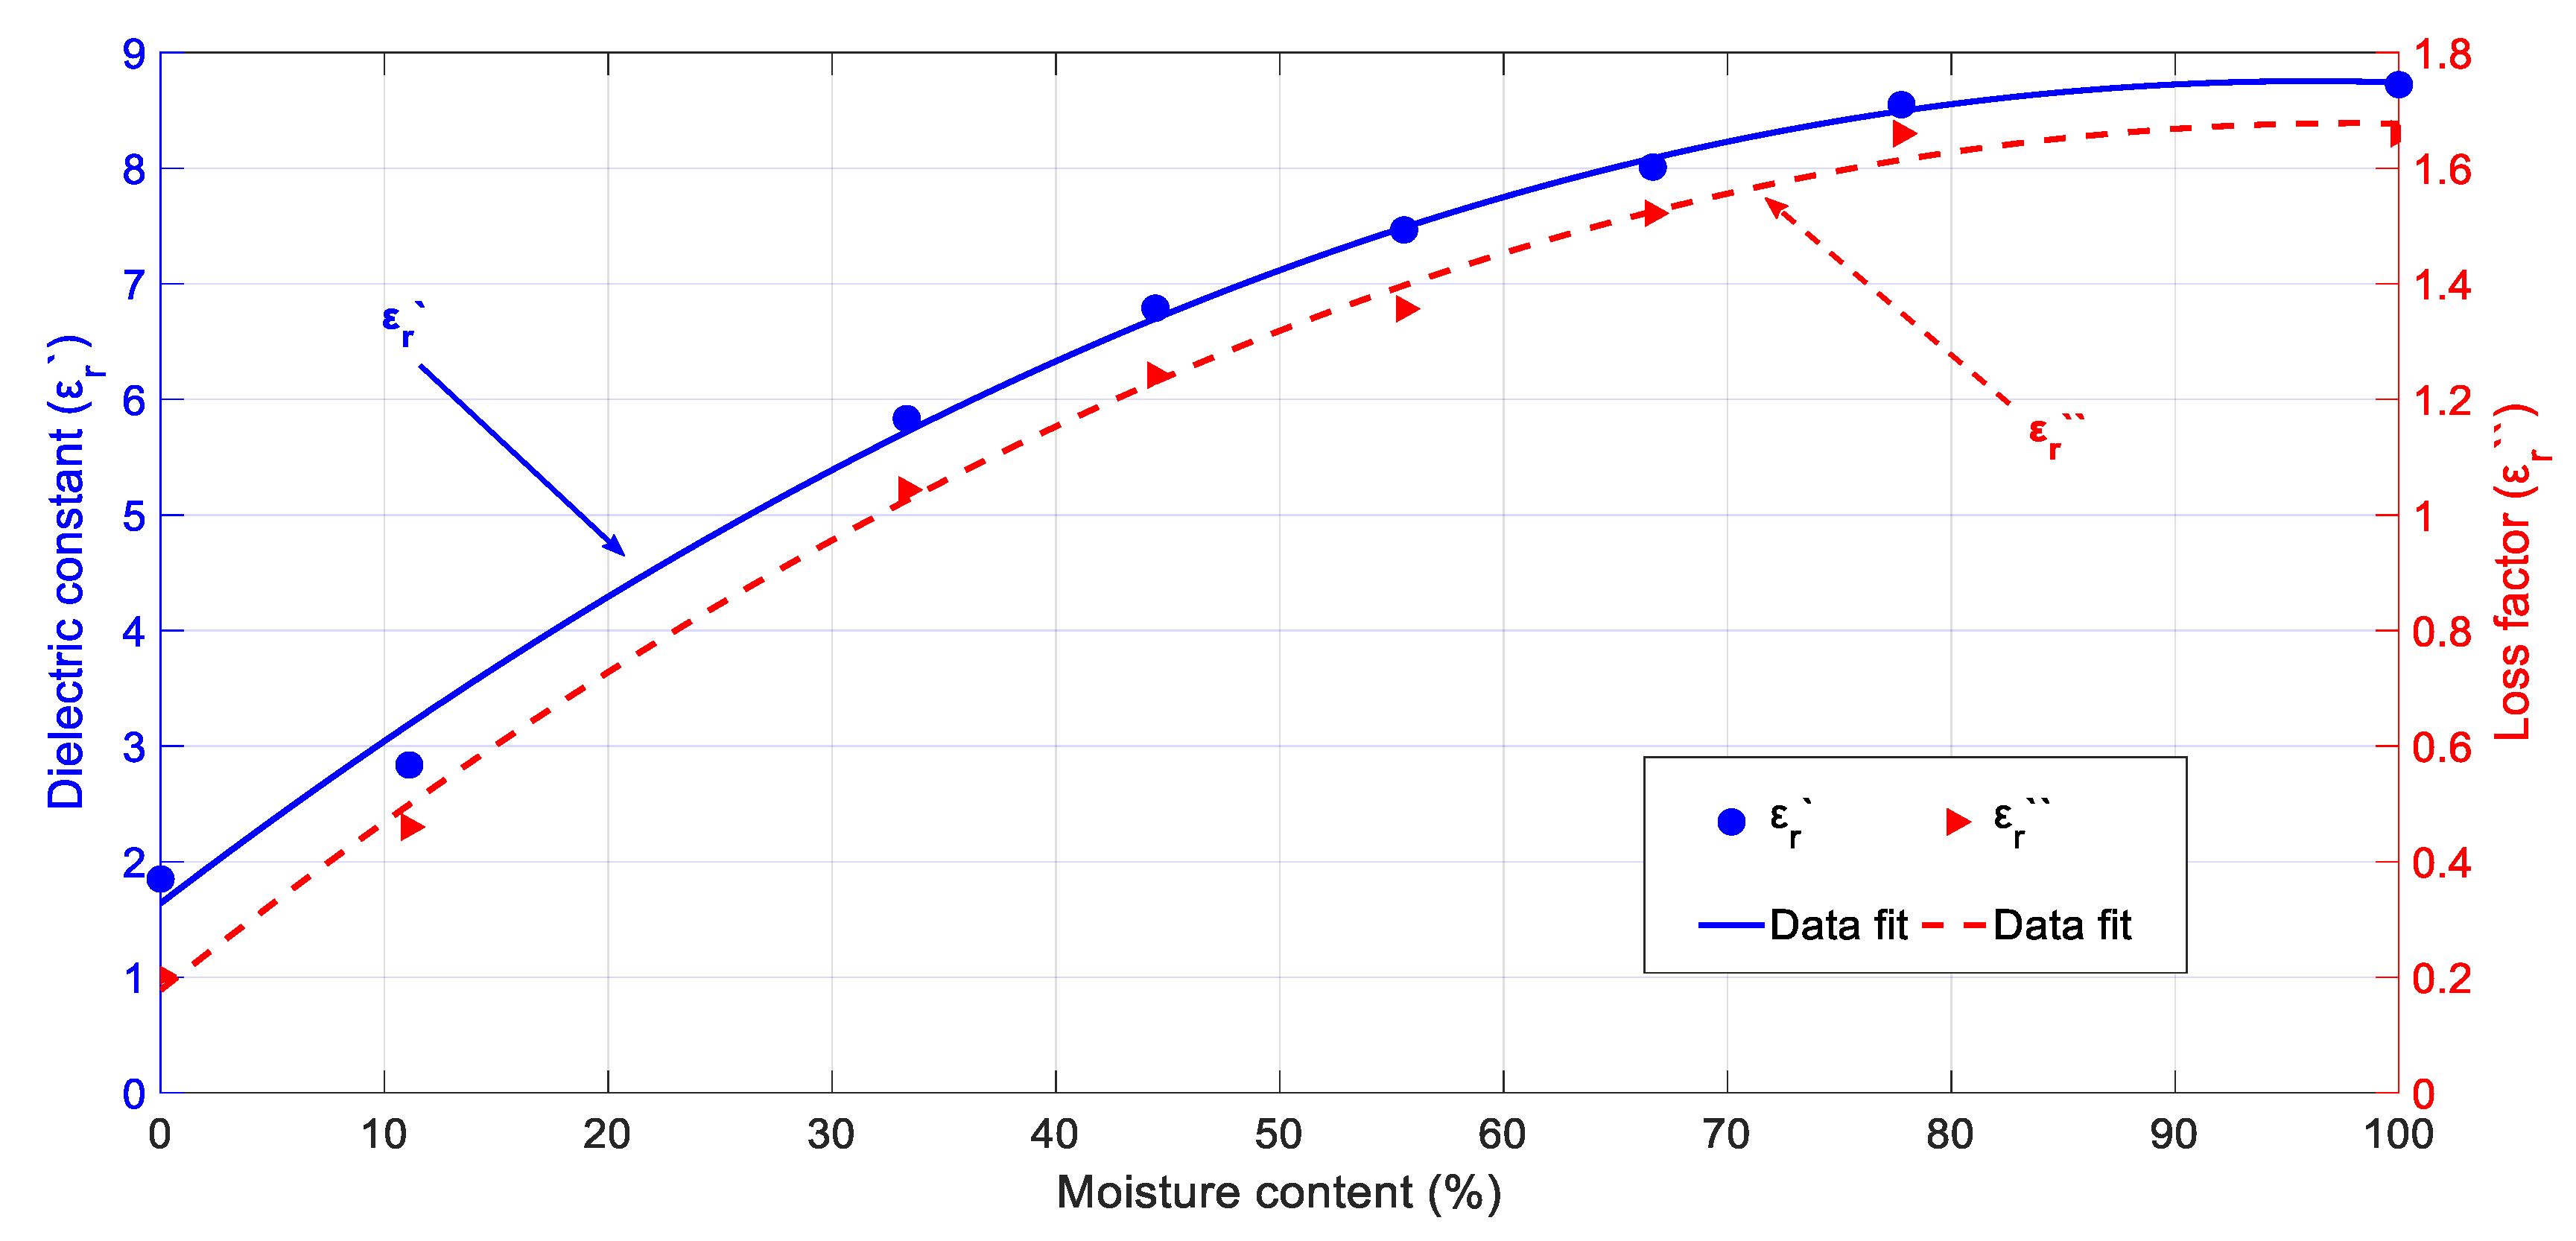
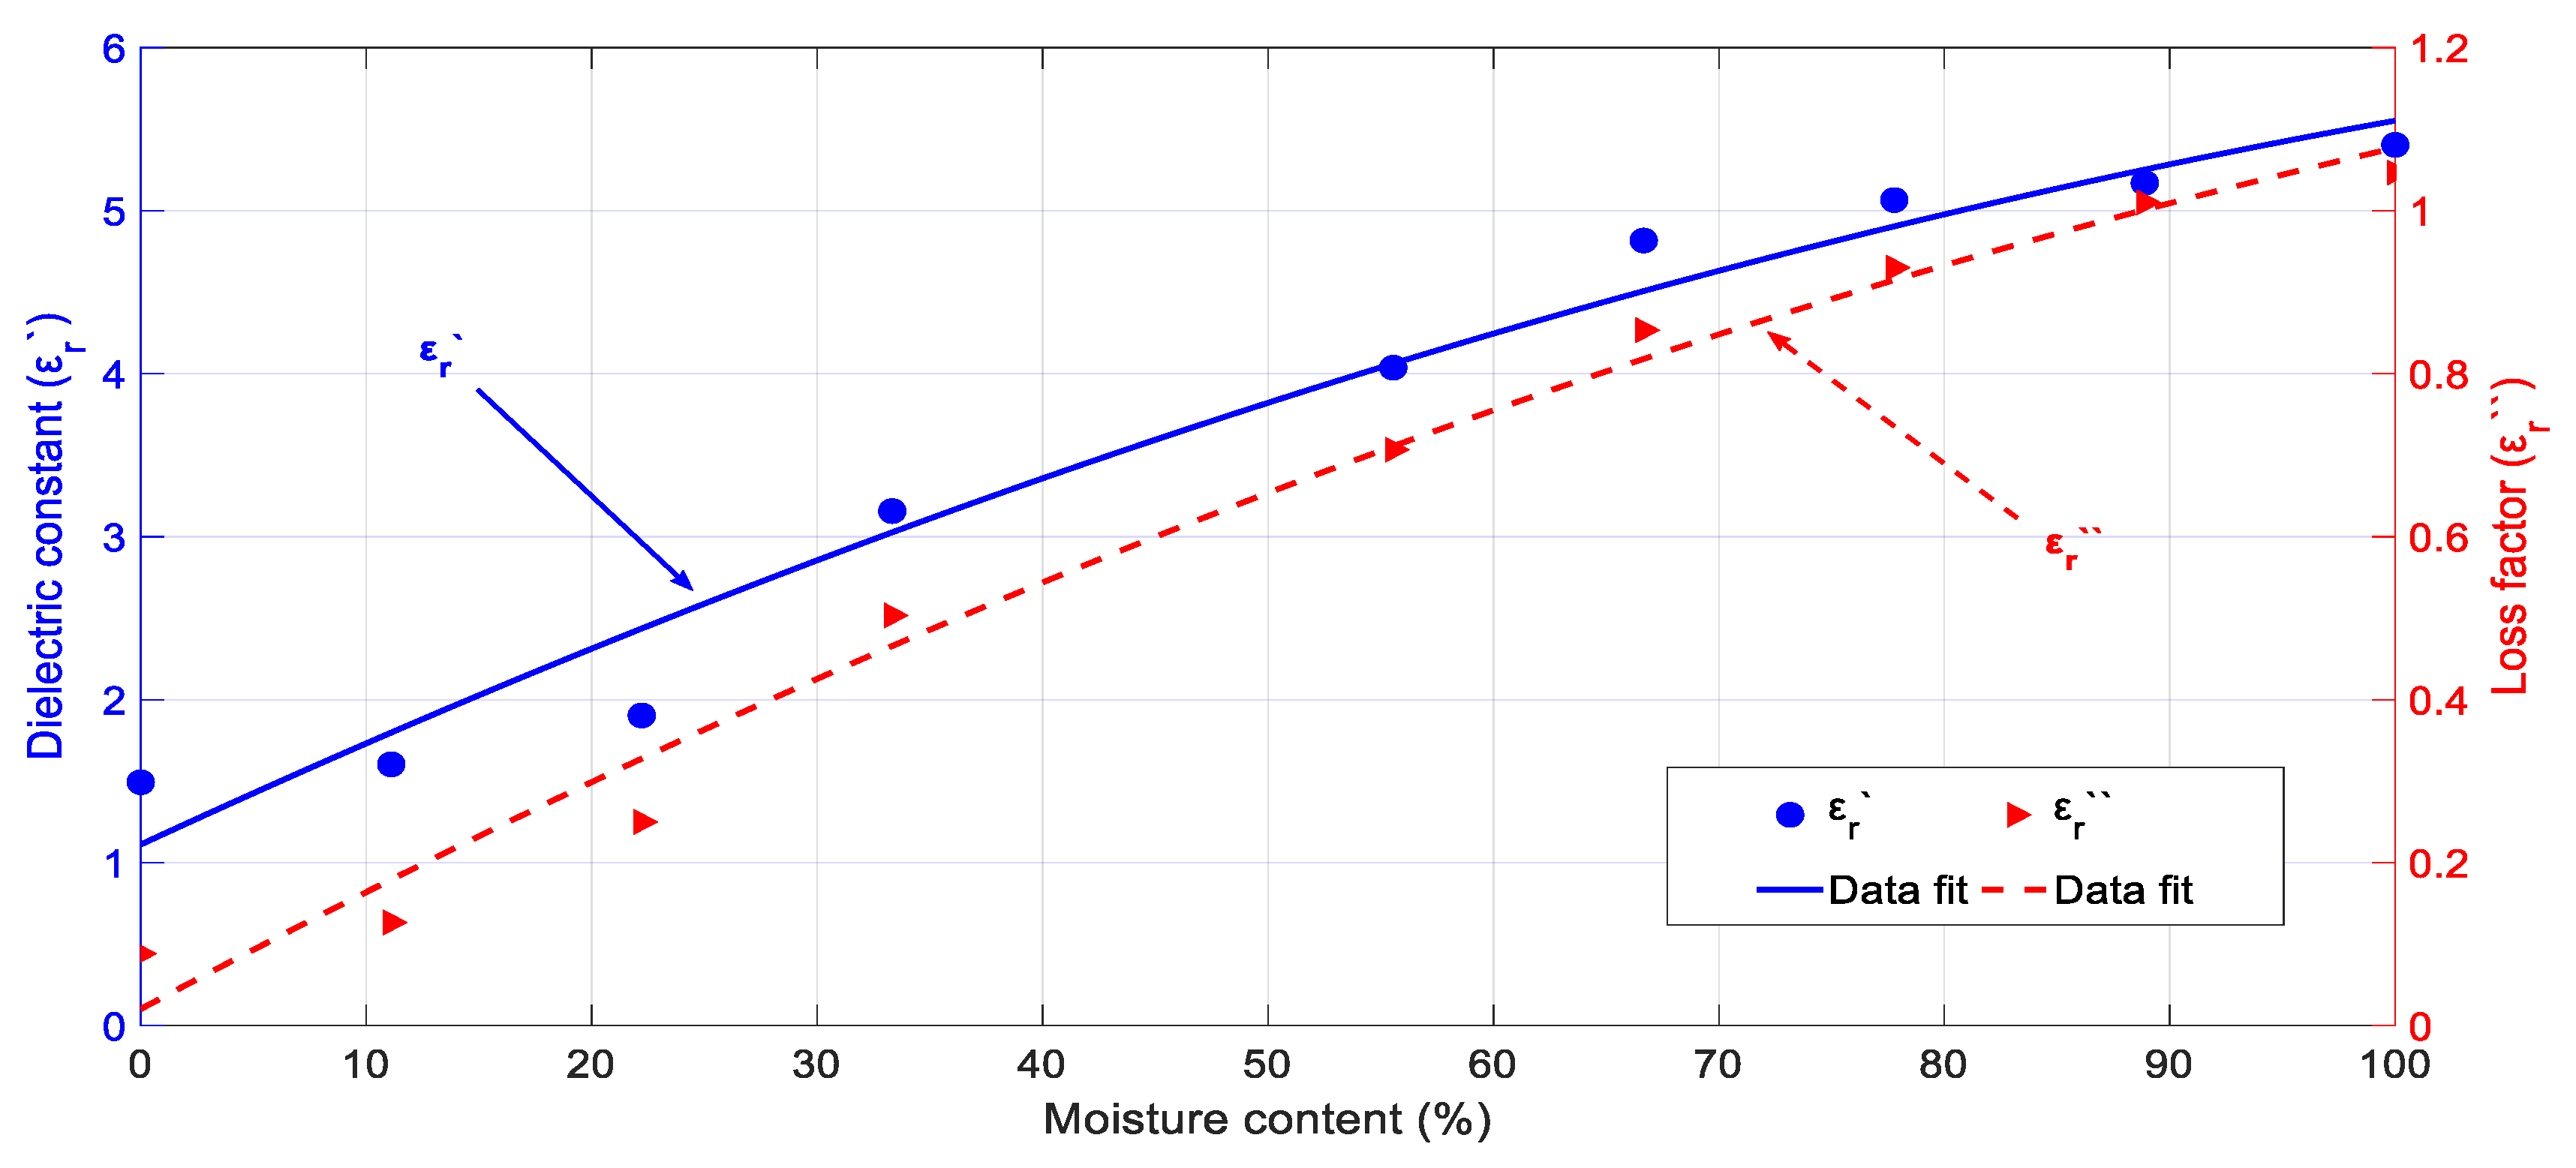
Moisture content also has a remarkable impact on the permittivity values. At least, two important conclusions can be obtained from the results: The first one is that higher moisture contents provide higher microwave absorption rates since the loss factor grows with increasing moisture content values. However, high moisture contents will lead to low penetration depth values and this will hinder uniform heating in the biomass volume. Therefore, there must be a compromise between microwave absorption and uniformity similar to that described for the biomass density of cypress and rockrose.
Additionally, some dispersion of the experimental data was observed when the moisture content changed and this might be explained due to the fact that the drying rates for stems, leaves, or tree branches are different and the composition of biomass is very heterogeneous.
Although the conclusions for biomass permittivity evolution versus temperature, density, and moisture content should be considered valid only around the 2.45 GHz ISM frequency, most of them will also reproduce at lower and higher microwave frequencies, where dipolar rotation is the driving mechanism for dielectric losses.
It is more complex is to consider the combined effect of different parameters. For instance, when samples lose moisture, it is expected that the sample density will also change with respect to the initial value that has been taken in each set of measurements. Therefore, the real variation of the permittivity determined by the combined effect of both parameters should be assumed to be different than that shown for each individual parameter. This is so because the variation in moisture for the cypress or rockrose is not independent of its mass density. A mutual relationship between temperature, moisture, and density determines the expected values for permittivity and future works are envisaged in that direction.
The estimation of the actual distribution of permittivity of the cypress or rockrose biomass within the microwave cavity in MAE processes is a complex task since the biomass will be pressed by blades and other transport elements and thus its density will vary evenly along the microwave applicator. Additionally, the moisture content and temperature distributions will vary during the microwave irradiation process.
However, for microwave applicator designing processes knowing the limits of biomass permittivity is often enough to provide good power efficiency levels, above 90%, and uniform temperature profiles. In this case, designers can test the best and worst cases and the response of the applicator both in terms of power reflection and the expected heating patterns
Finally, the obtained values of permittivity for both rockrose and cypress biomass show that these materials can be irradiated with microwave energy in order to extract profitable chemical substances. The irradiation would be more efficient for higher values of moisture content and density, although a compromise between the absorption and power efficiency should be taken into account when designing MAE applicators.
Implications for Sensor Design
The permittivity measurements carried out in this work for cypress and rockrose biomass will be useful for sensor design since the correlations of biomass permittivity with temperature, moisture content, and density are very clear.
The loss factor increases versus temperature with a biunivocal relationship in the range 35–85 °C for both cypress and rockrose biomass samples. This indicates that it would be possible to estimate the plant temperature increase due to undesired fire spots, ray strokes, or problems in greenhouses by using directive radio links since a temperature increment would lead to an important attenuation rise and a decrease in the received power.
This temperature-driven loss factor increment is directly correlated with the conversion of bound water into free water and therefore it could be related to the dehydration of the plants and their health. Thus, transmission-based microwave sensors could also measure the temperature stress resistance of cypress and rockrose plants, even for different varieties of the same species.
There is also a biunivocal relationship between the density and permittivity. In fact, both the dielectric constant and loss factor continuously increase as the density rises. Since density affects both the microwave power absorption capacity and penetration depth, it would be important to control this parameter when feeding microwave applicators. In this case, several possibilities can be implemented, such as resonant sensors or devices based on the reflection and/or transmission of microwave energy.
A sensor indicating the moisture content of biomass would also be useful in order to introduce the biomass into the microwave applicator at the optimal state for microwave-assisted extraction in terms of the penetration depth and microwave energy absorption. Obviously, controlling the moisture content of biomass would provide repeatability and the possibility to optimize the MAE process. Again, resonant techniques or sensors based on transmission/reflection configurations could be implemented since both the loss factor and the dielectric constant monotonously grow with increasing values of the moisture content.
Another application of density and moisture monitoring would be the estimation of the number of plants per square meter in a forest, which could be carried out with directive antennas. The attenuation of the radio link will be directly linked to the forest density and moisture content of the plants.
Future work is envisaged in this direction in order to correlate permittivity measurements to different biomass parameters and to develop non-invasive microwave sensors.

 ,
, 


