Inertial Sensor-Based Instrumented Cane for Real-Time Walking Cane Kinematics Estimation


Abstract
1. Introduction
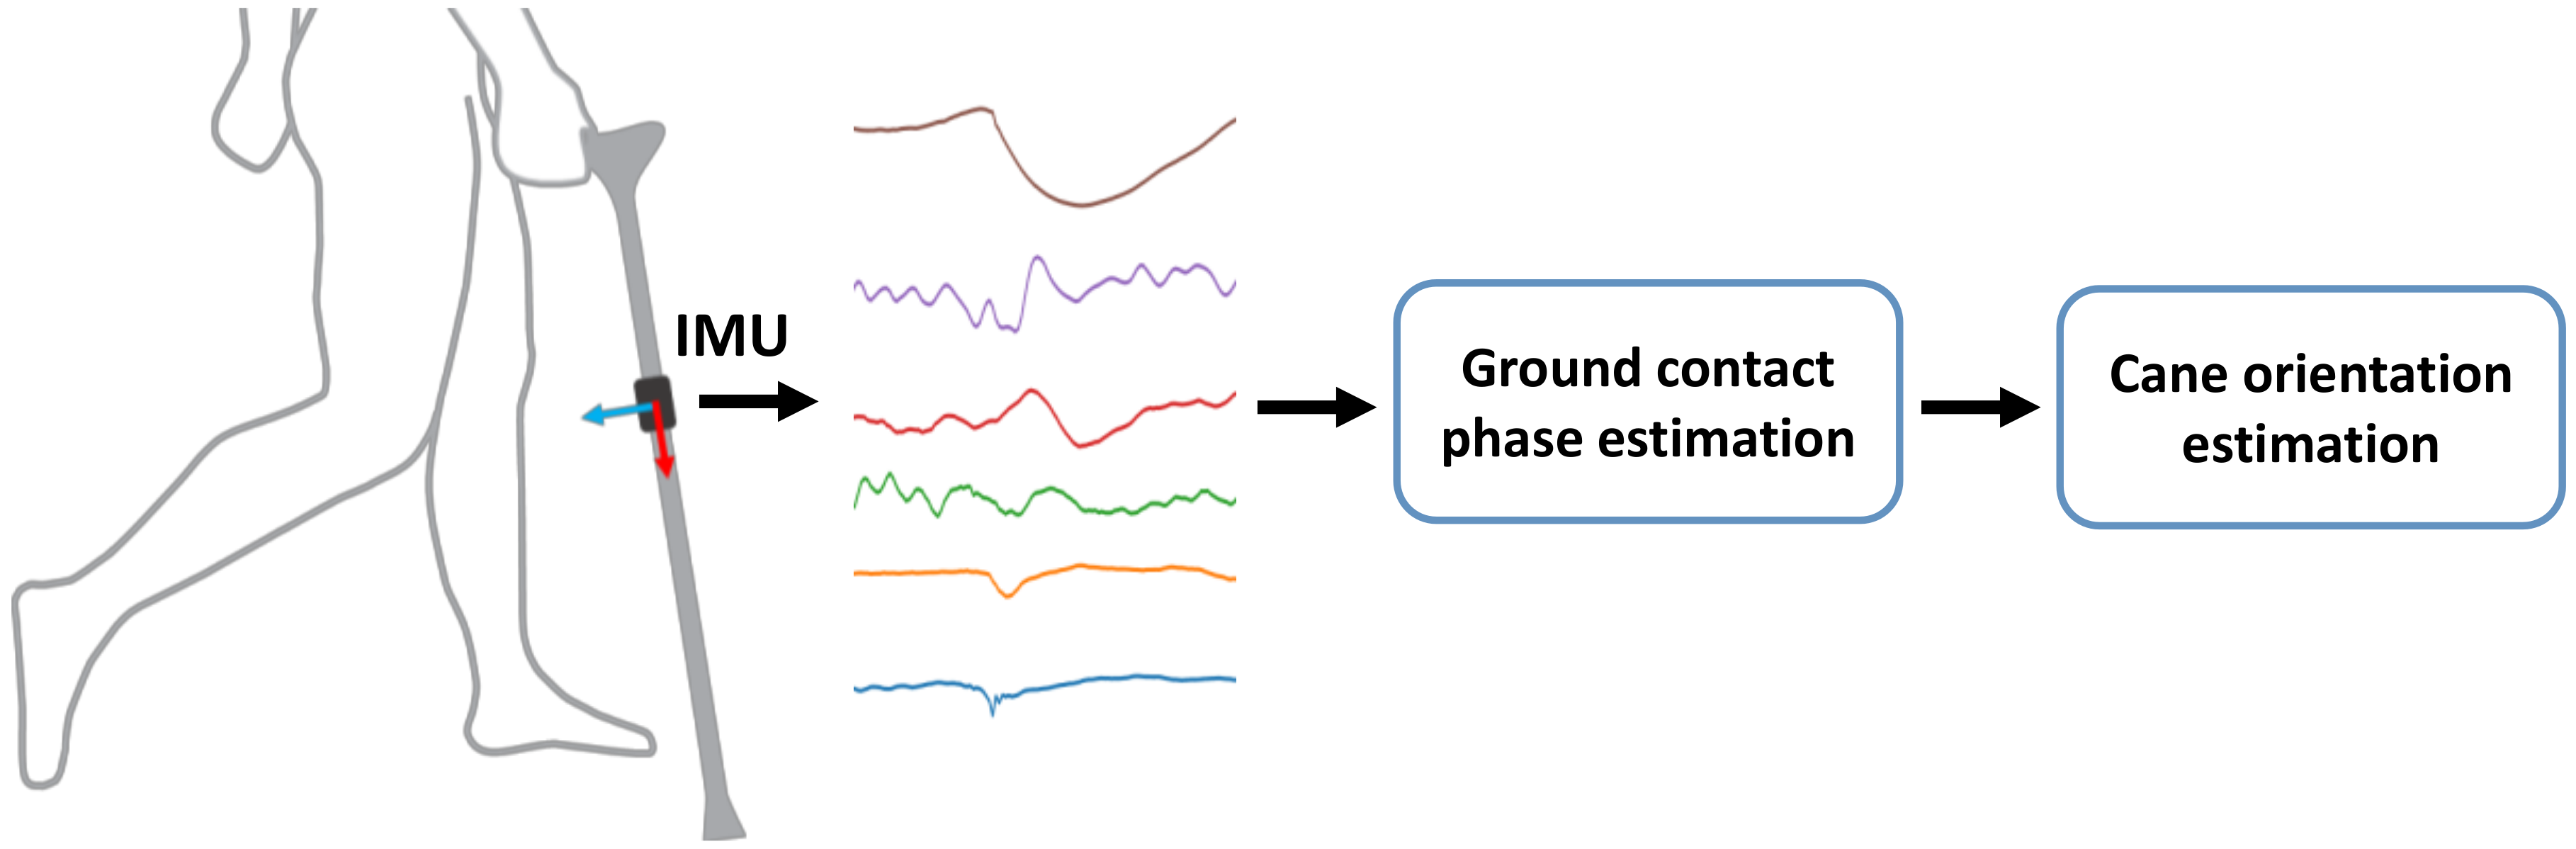
2. System Overview
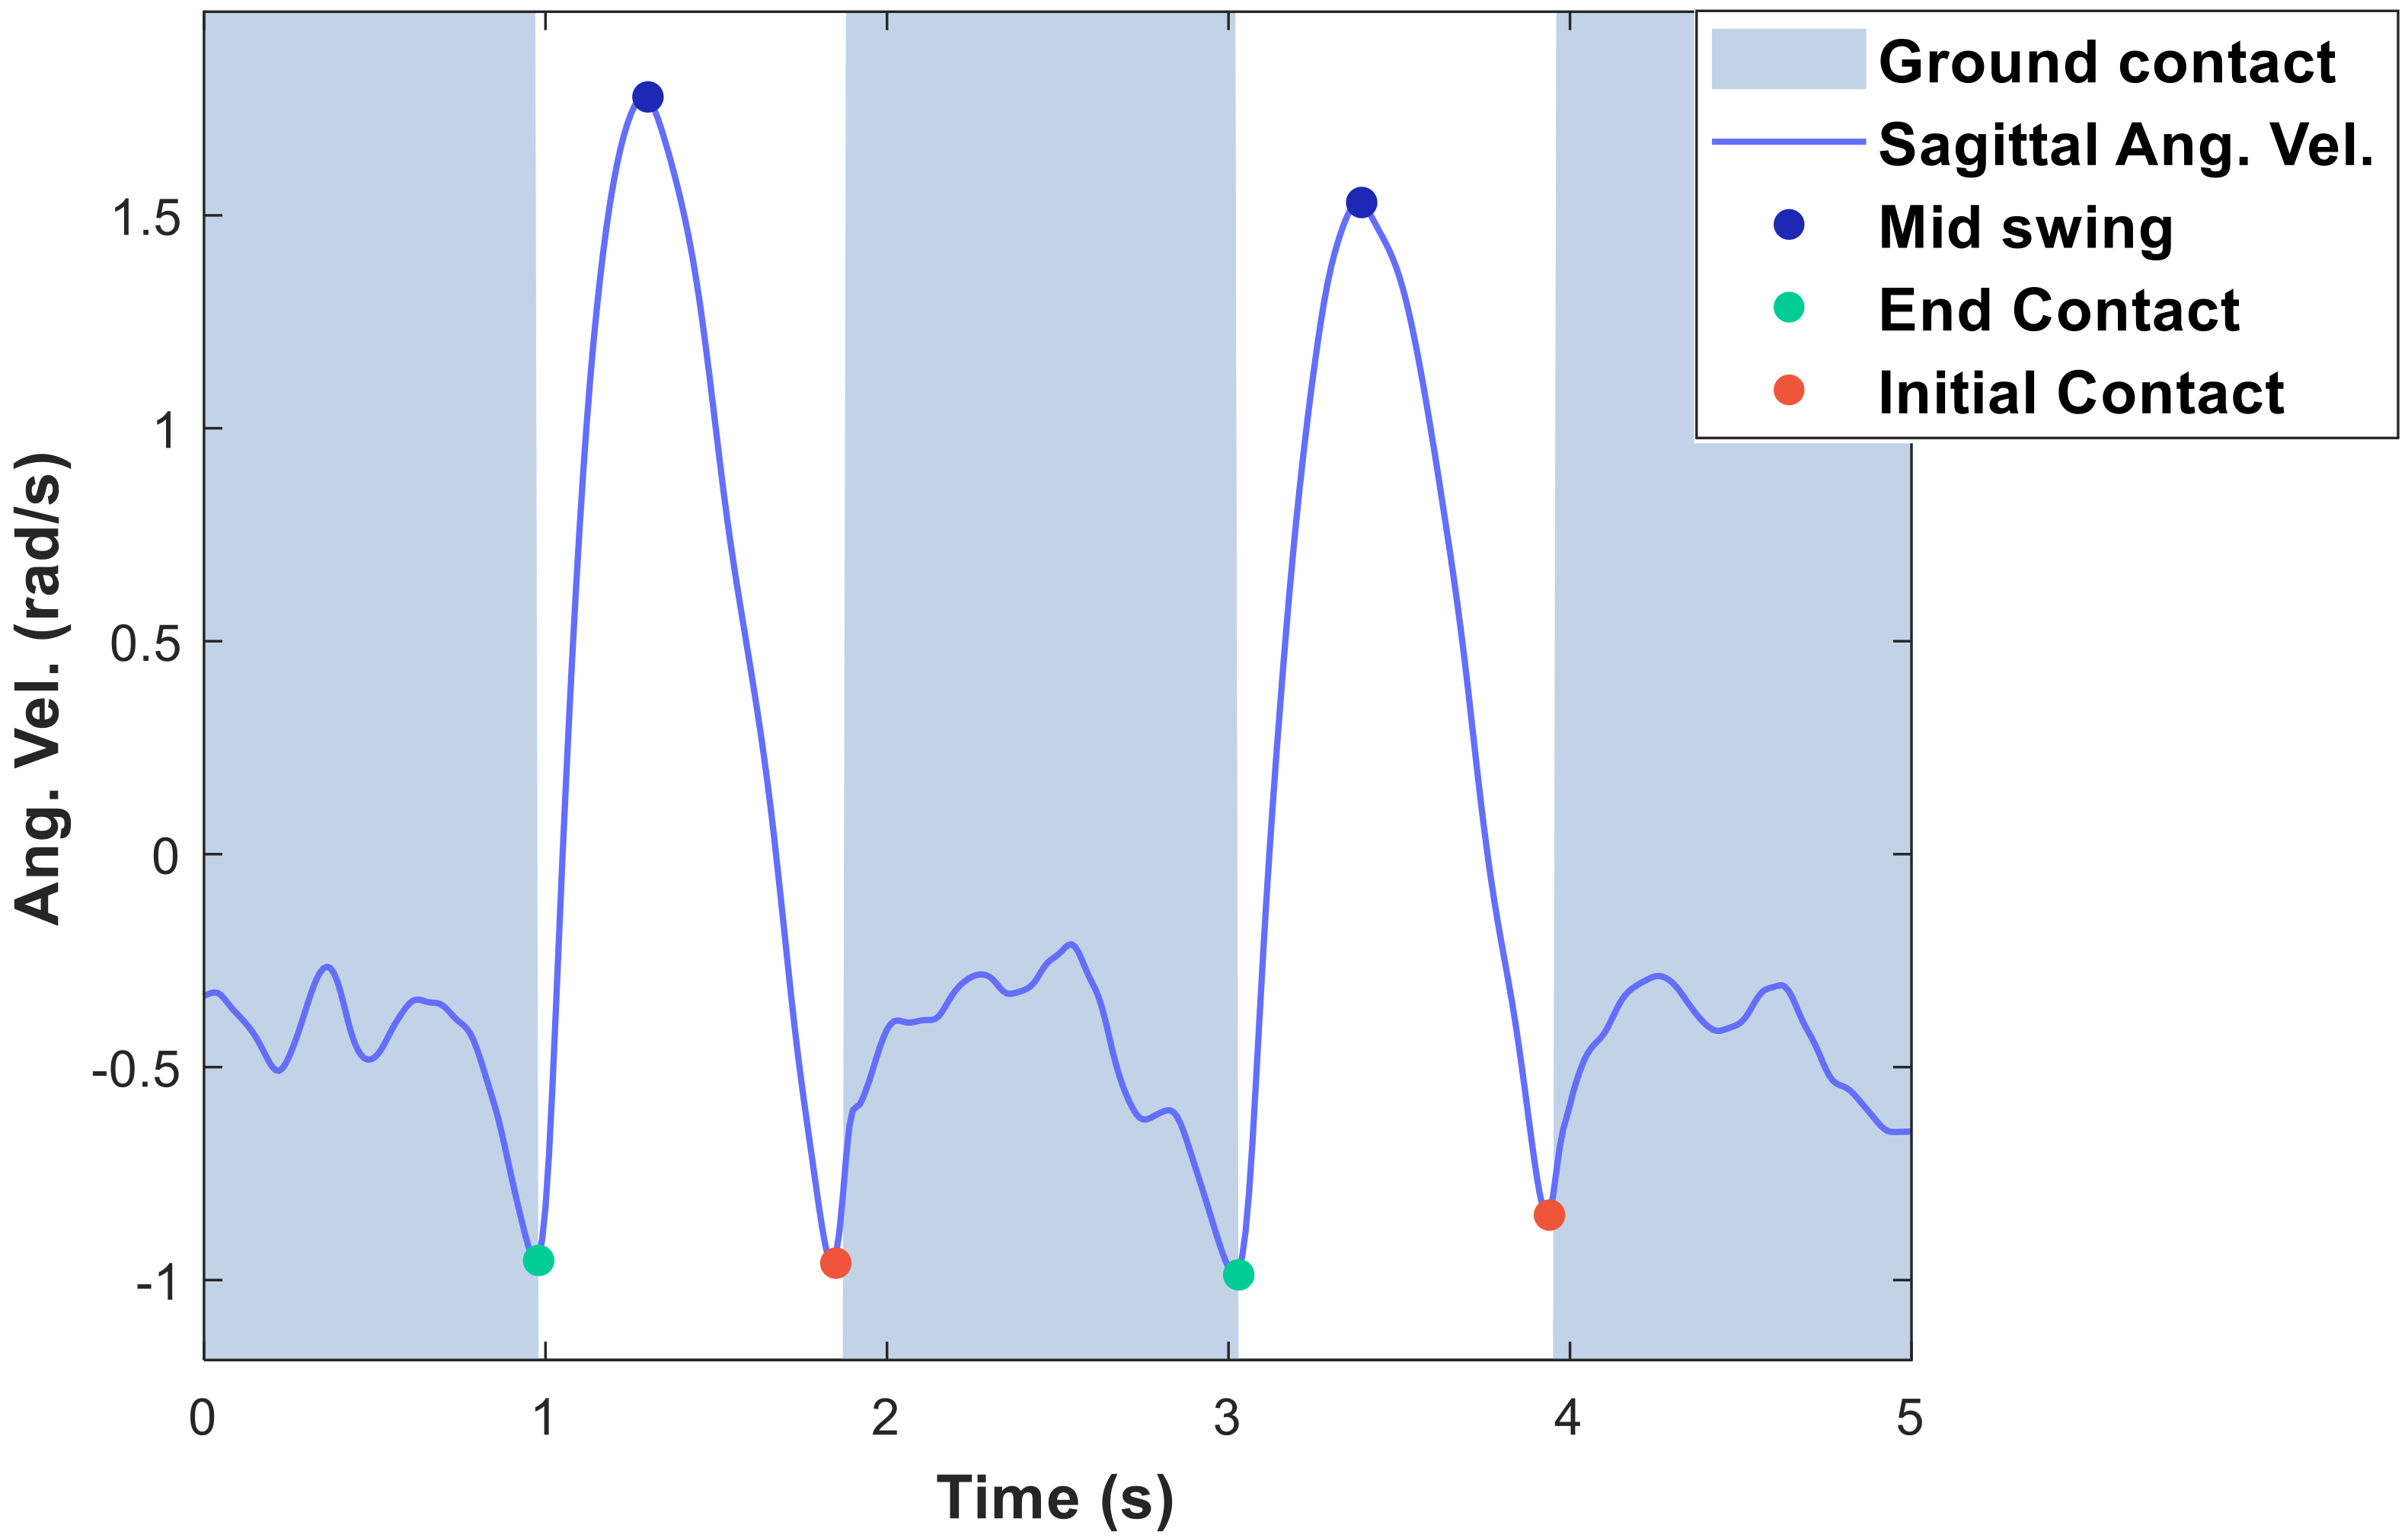
2.1. Ground-Contact Phase Estimation
2.1.1. Threshold-Based Methods
2.1.2. Event-Based Methods
2.1.3. Machine Learning Methods
2.2. Cane Orientation Estimation
2.2.1. Orientation from the Gravity and Magnetic North
2.2.2. Kalman Filter
2.2.3. Madgwick Filter
3. Methodology
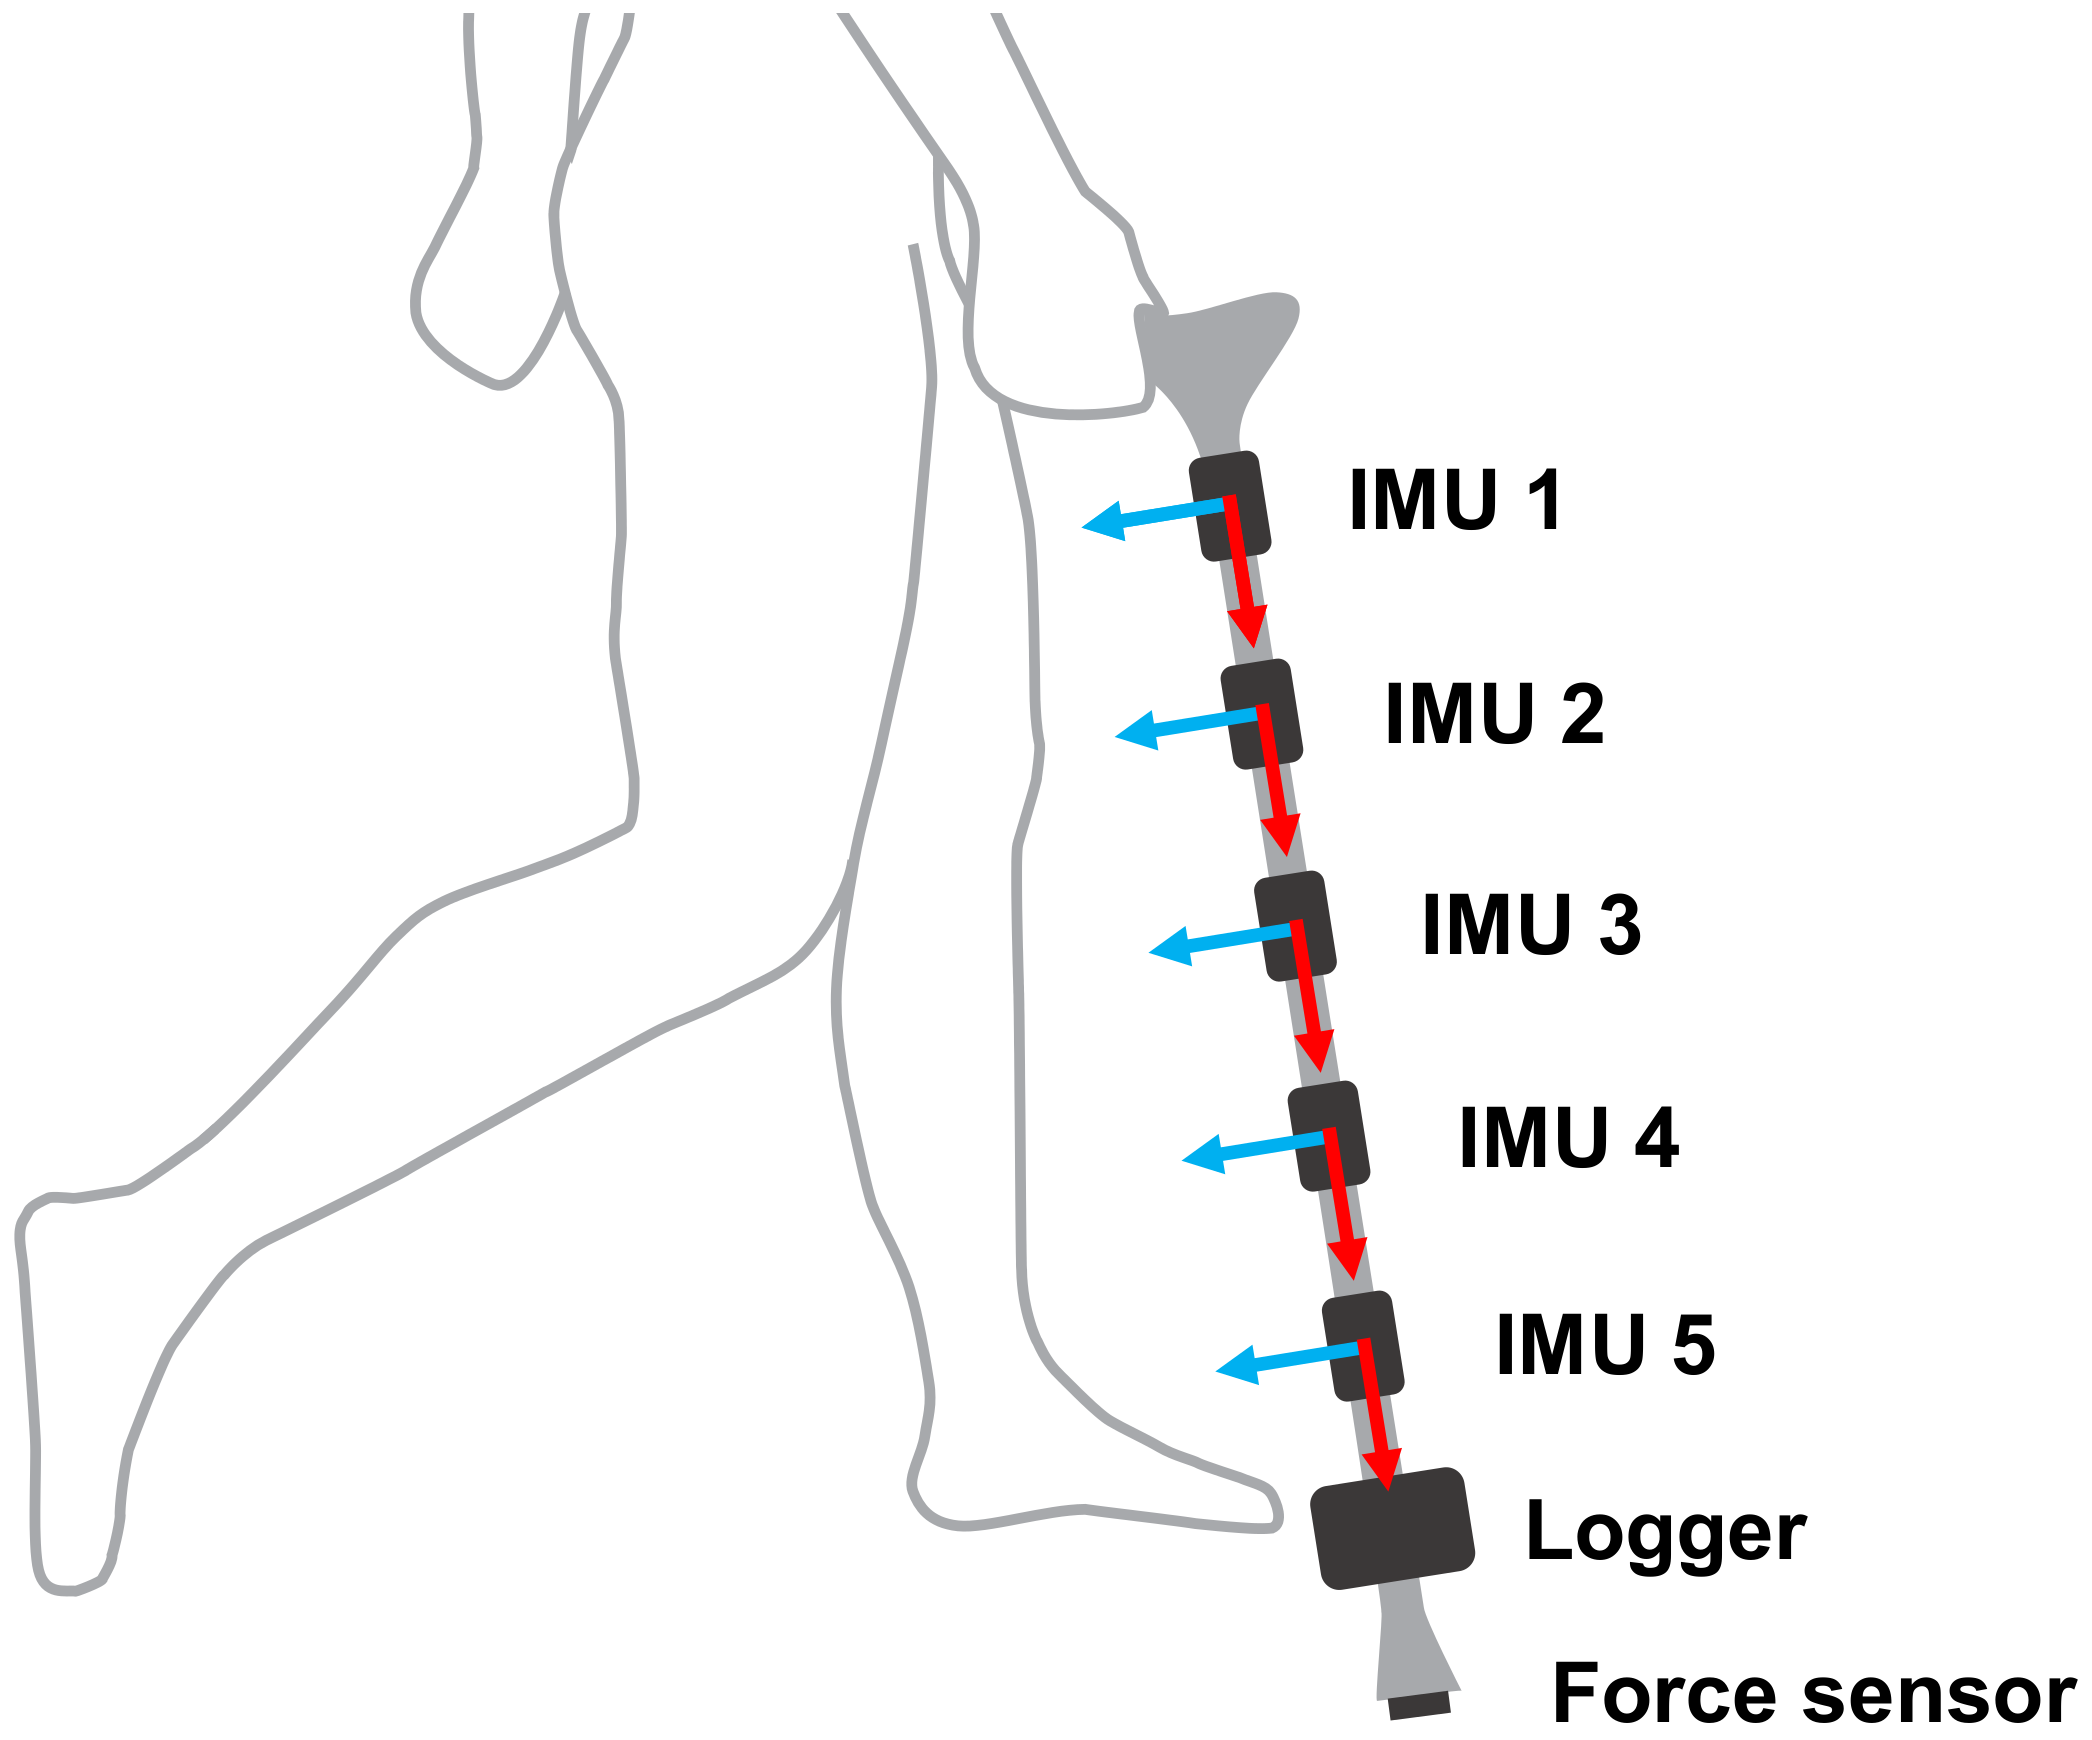
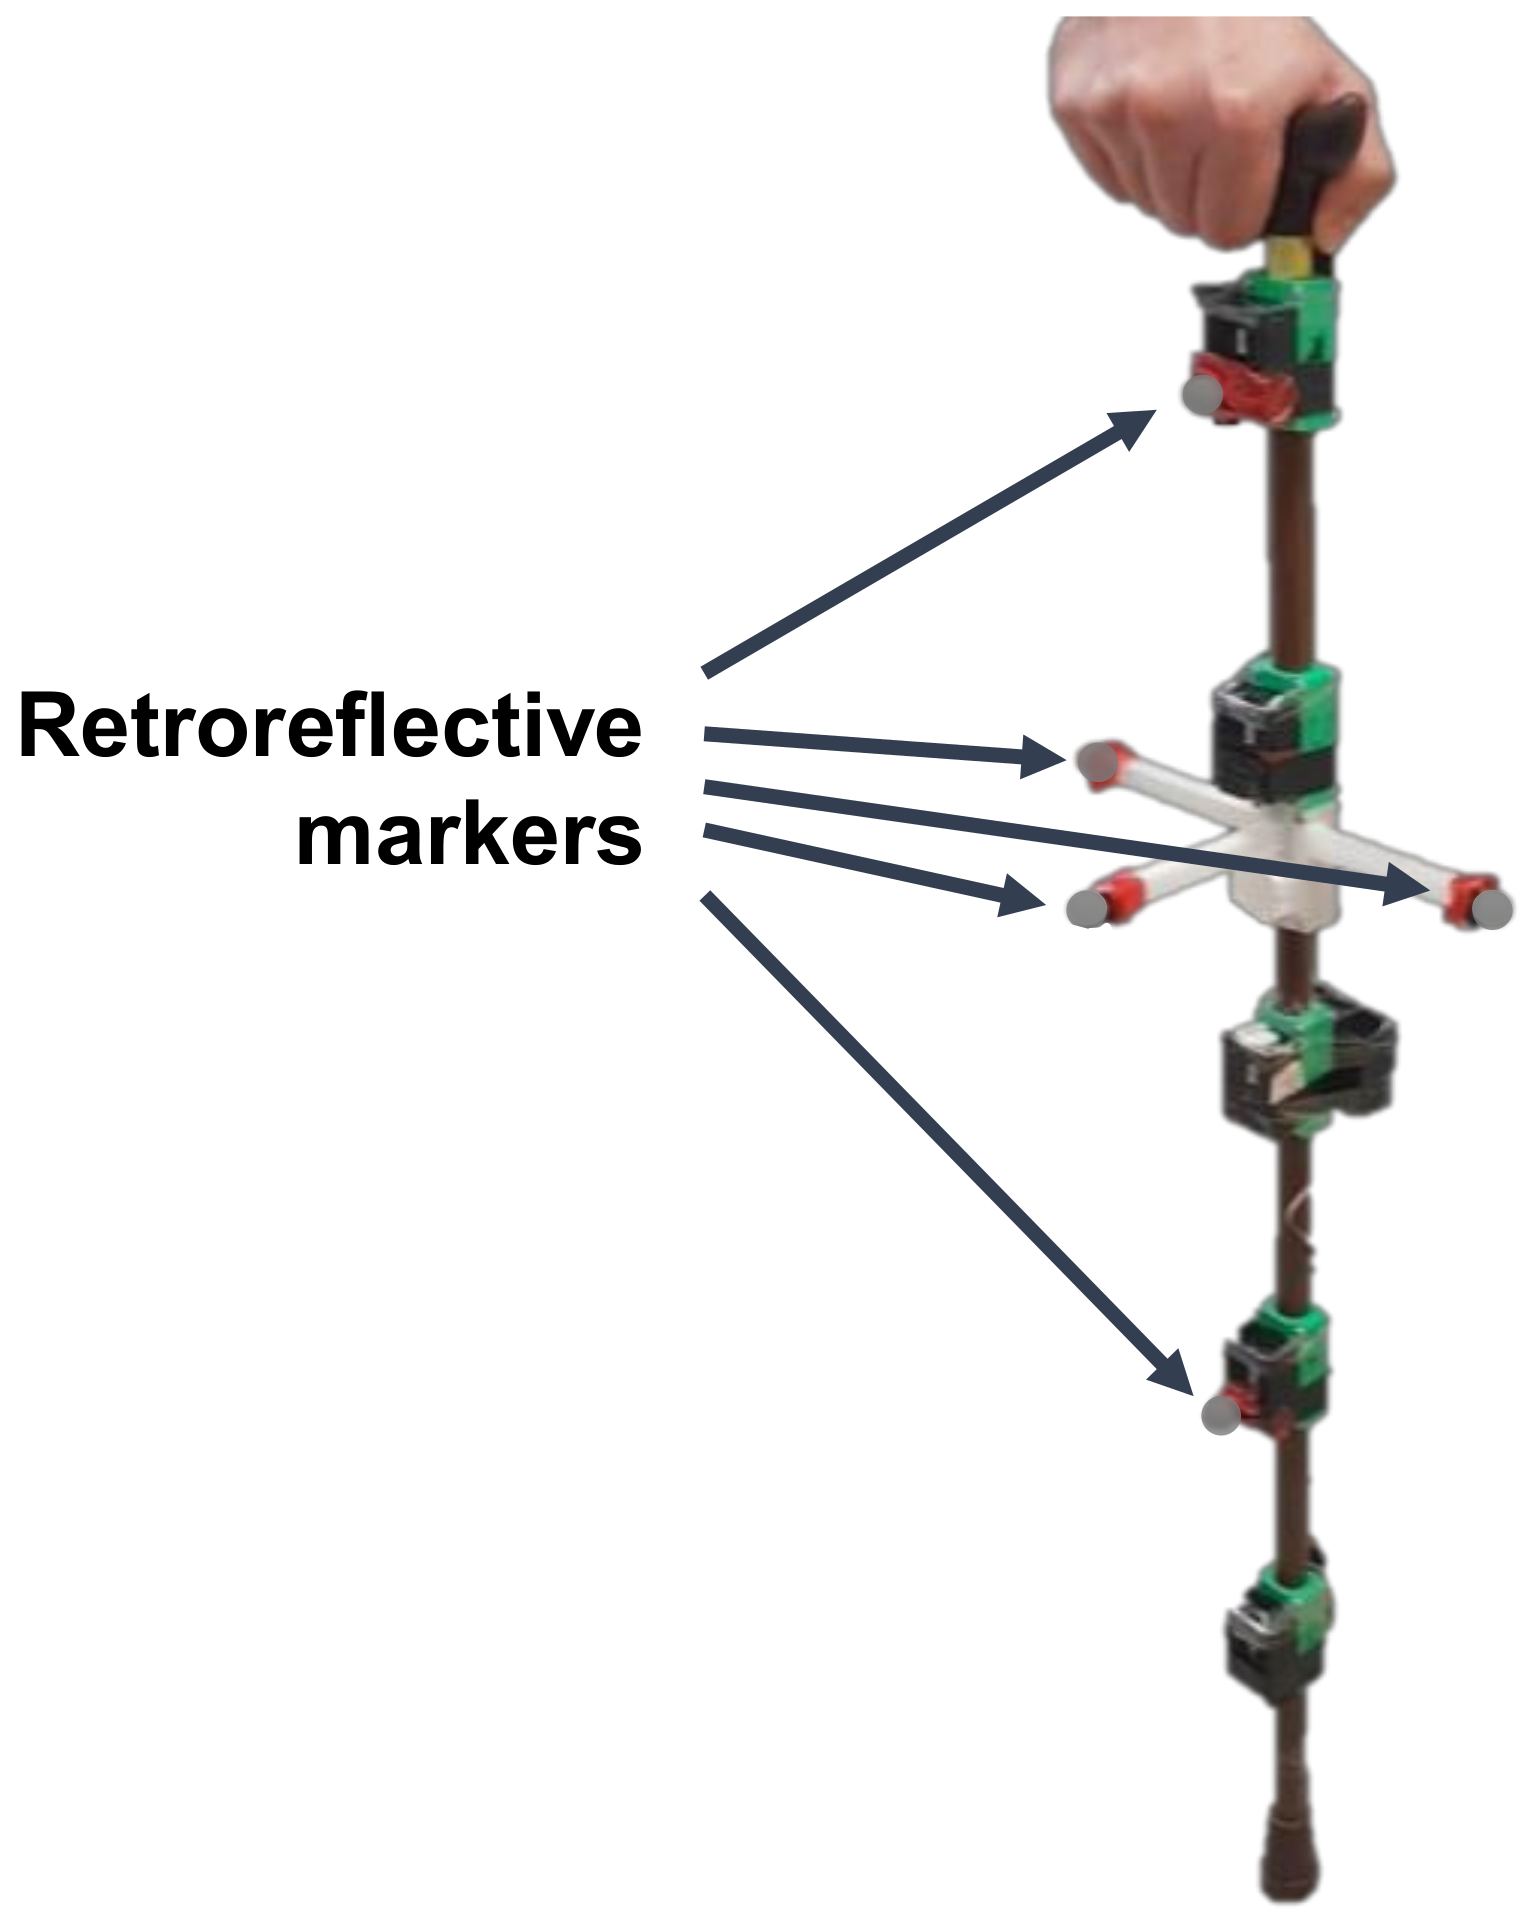
3.1. Instrumented Cane
3.2. Experiment 1: Cane Phase Estimation Evaluation
3.3. Experiment 2: Cane Orientation Evaluation
4. Results and Discussion
4.1. Cane Phase Estimation Results
4.2. Cane Orientation Estimation Results
5. Conclusions
- A deep learning model is proposed for estimating the cane contact-phase estimation from raw inertial sensor data.
- The temporal phase estimation is improved using a voting window.
- The 3D orientation of the cane during multiple daily life activities is estimated by orientation estimation algorithms, which are compared and validated.
- The position effect of the inertial sensor on the cane on both the contact phase and orientation estimates of the cane are analyzed.
- The proposed system performs the estimation calculations in real time on devices with low computational power.
Author Contributions
Funding
Conflicts of Interest
References
- Dionyssiotis, Y. Analyzing the problem of falls among older people. IJGM 2012, 805. [Google Scholar] [CrossRef] [PubMed]
- World Health Organization. World Report on Ageing and Health; World Health Organization: Geneva, Switzerland, 2015; ISBN 978-92-4-156504-2. [Google Scholar]
- Sakita, M.; Murakami, S.; Saito, T.; Kumagai, S. Falls and Fall Prevention in Elderly People: Summary of Recent Reviews. Jpn. J. Health Promot. Phys. Ther. 2015, 4, 161–169. [Google Scholar] [CrossRef][Green Version]
- Kioh, S.H. The prevalence and the risk of falls among institutionalised elderly in Penang, Malaysia. Med. J. Malays. 2018, 73, 8. [Google Scholar]
- Yasumura, S.; Hasegawa, M. Incidence of falls among the Elderly and Preventive Efforts in Japan. Jpn. Med. Assoc. J. 2009, 52, 6. [Google Scholar]
- Yu, X. Approaches and principles of fall detection for elderly and patient. In Proceedings of the HealthCom 2008—10th International Conference on e-health Networking, Applications and Services, Singapore, 7–9 July 2008; pp. 42–47. [Google Scholar]
- Muir, S.W.; Berg, K.; Chesworth, B.; Klar, N.; Speechley, M. Balance Impairment as a Risk Factor for Falls in Community-Dwelling Older Adults Who Are High Functioning: A Prospective Study. Phys. Ther. 2010, 90, 338–347. [Google Scholar] [CrossRef]
- Pollock, A.S.; Durward, B.R.; Rowe, P.J.; Paul, J.P. What is balance? Clin. Rehabil. 2000, 14, 402–406. [Google Scholar] [CrossRef]
- Bateni, H.; Maki, B.E. Assistive devices for balance and mobility: Benefits, demands, and adverse consequences. Arch. Phys. Med. Rehabil. 2005, 86, 134–145. [Google Scholar] [CrossRef] [PubMed]
- Löfqvist, C.; Nygren, C.; Széman, Z.; Iwarsson, S. Assistive devices among very old people in five European countries. Scand. J. Occup. Ther. 2005, 12, 181–192. [Google Scholar] [CrossRef]
- Hausdorff, J.M.; Rios, D.A.; Edelberg, H.K. Gait variability and fall risk in community-living older adults: A 1-year prospective study. Arch. Phys. Med. Rehabil. 2001, 82, 1050–1056. [Google Scholar] [CrossRef] [PubMed]
- Callisaya, M.L.; Blizzard, L.; Schmidt, M.D.; Martin, K.L.; McGinley, J.L.; Sanders, L.M.; Srikanth, V.K. Gait, gait variability and the risk of multiple incident falls in older people: A population-based study. Age Ageing 2011, 40, 481–487. [Google Scholar] [CrossRef] [PubMed]
- Ballesteros, J.; Tudela, A.; Caro-Romero, J.; Urdiales, C. Weight-Bearing Estimation for Cane Users by Using Onboard Sensors. Sensors 2019, 19, 509. [Google Scholar] [CrossRef] [PubMed]
- Culmer, P.R.; Brooks, P.C.; Strauss, D.N.; Ross, D.H.; Levesley, M.C.; O’Connor, R.J.; Bhakta, B.B. An Instrumented Walking Aid to Assess and Retrain Gait. IEEE/ASME Trans. Mechatron. 2014, 19, 141–148. [Google Scholar] [CrossRef]
- Wade, J.W.; Boyles, R.; Flemming, P.; Sarkar, A.; de Riesthal, M.; Withrow, T.J.; Sarkar, N. Feasibility of Automated Mobility Assessment of Older Adults via an Instrumented Cane. IEEE J. Biomed. Health Inform. 2019, 23, 1631–1638. [Google Scholar] [CrossRef] [PubMed]
- Lan, M.; Nahapetian, A.; Vahdatpour, A.; Au, L.; Kaiser, W.; Sarrafzadeh, M. SmartFall: An Automatic Fall Detection System Based on Subsequence Matching for the SmartCane. In Proceedings of the 4th International ICST Conference on Body Area Networks, ICST, Los Angeles, CA, USA, 1–3 April 2009; pp. 1–8. [Google Scholar]
- Dang, D.; Suh, Y. Walking Distance Estimation Using Walking Canes with Inertial Sensors. Sensors 2018, 18, 230. [Google Scholar] [CrossRef] [PubMed]
- Hassan, M.; Kadone, H.; Suzuki, K.; Sankai, Y. Wearable Gait Measurement System with an Instrumented Cane for Exoskeleton Control. Sensors 2014, 14, 1705–1722. [Google Scholar] [CrossRef]
- Wade, J.; Beccani, M.; Myszka, A.; Bekele, E.; Valdastri, P.; Flemming, P.; de Riesthal, M.; Withrow, T.; Sarkar, N. Design and implementation of an instrumented cane for gait recognition. In Proceedings of the 2015 IEEE International Conference on Robotics and Automation (ICRA), Seattle, WA, USA, 26–30 May 2015; pp. 5904–5909. [Google Scholar]
- Sprint, G.; Cook, D.J.; Weeks, D.L. Quantitative assessment of lower limb and cane movement with wearable inertial sensors. In Proceedings of the 2016 IEEE-EMBS International Conference on Biomedical and Health Informatics (BHI), IEEE, Las Vegas, NV, USA, 24–27 February 2016; pp. 418–421. [Google Scholar]
- Gill, S.; Hearn, J.; Powell, G.; Scheme, E. Design of a multi-sensor IoT-enabled assistive device for discrete and deployable gait monitoring. In Proceedings of the 2017 IEEE Healthcare Innovations and Point of Care Technologies (HI-POCT), Bethesda, MD, USA, 6–8 November 2017; pp. 216–220. [Google Scholar]
- Gill, S.; Seth, N.; Scheme, E. A Multi-Sensor Cane Can Detect Changes in Gait Caused by Simulated Gait Abnormalities and Walking Terrains. Sensors 2020, 20, 631. [Google Scholar] [CrossRef]
- Attal, F.; Mohammed, S.; Dedabrishvili, M.; Chamroukhi, F.; Oukhellou, L.; Amirat, Y. Physical Human Activity Recognition Using Wearable Sensors. Sensors 2015, 15, 31314–31338. [Google Scholar] [CrossRef]
- Shoaib, M.; Bosch, S.; Incel, O.; Scholten, H.; Havinga, P. Complex Human Activity Recognition Using Smartphone and Wrist-Worn Motion Sensors. Sensors 2016, 16, 426. [Google Scholar] [CrossRef]
- He, J.; Bai, S.; Wang, X. An Unobtrusive Fall Detection and Alerting System Based on Kalman Filter and Bayes Network Classifier. Sensors 2017, 17, 1393. [Google Scholar] [CrossRef]
- Özdemir, A.; Barshan, B. Detecting Falls with Wearable Sensors Using Machine Learning Techniques. Sensors 2014, 14, 10691–10708. [Google Scholar] [CrossRef]
- Mileti, I.; Germanotta, M.; Di Sipio, E.; Imbimbo, I.; Pacilli, A.; Erra, C.; Petracca, M.; Rossi, S.; Del Prete, Z.; Bentivoglio, A.; et al. Measuring Gait Quality in Parkinson’s Disease through Real-Time Gait Phase Recognition. Sensors 2018, 18, 919. [Google Scholar] [CrossRef]
- Vu, H.; Gomez, F.; Cherelle, P.; Lefeber, D.; Nowé, A.; Vanderborght, B. ED-FNN: A New Deep Learning Algorithm to Detect Percentage of the Gait Cycle for Powered Prostheses. Sensors 2018, 18, 2389. [Google Scholar] [CrossRef]
- Caro-Romero, J.R.; Ballesteros, J.; Garcia-Lagos, F.; Urdiales, C.; Sandoval, F. A Neural Network for Stance Phase Detection in Smart Cane Users. In Advances in Computational Intelligence; Rojas, I., Joya, G., Catala, A., Eds.; Lecture Notes in Computer Science; Springer International Publishing: Cham, Switzerland, 2019; Volume 11506, pp. 310–321. ISBN 978-3-030-20520-1. [Google Scholar]
- Liu, Y.H. Feature Extraction and Image Recognition with Convolutional Neural Networks. J. Phys. Conf. Ser. 2018, 1087, 062032. [Google Scholar] [CrossRef]
- Cruciani, F.; Vafeiadis, A.; Nugent, C.; Cleland, I.; McCullagh, P.; Votis, K.; Giakoumis, D.; Tzovaras, D.; Chen, L.; Hamzaoui, R. Feature learning for Human Activity Recognition using Convolutional Neural Networks: A case study for Inertial Measurement Unit and audio data. CCF Trans. Pervasive Comp. Interact. 2020, 2, 18–32. [Google Scholar] [CrossRef]
- El Maachi, I.; Bilodeau, G.-A.; Bouachir, W. Deep 1D-Convnet for accurate Parkinson disease detection and severity prediction from gait. Expert Syst. Appl. 2020, 143, 113075. [Google Scholar] [CrossRef]
- Sigcha, L.; Costa, N.; Pavón, I.; Costa, S.; Arezes, P.; López, J.M.; De Arcas, G. Deep Learning Approaches for Detecting Freezing of Gait in Parkinson’s Disease Patients through On-Body Acceleration Sensors. Sensors 2020, 20, 1895. [Google Scholar] [CrossRef] [PubMed]
- Lachtar, A.; Val, T.; Kachouri, A. 3DCane: A monitoring system for the elderly using a connected walking stick. Int. J. Comput. Sci. Inf. Secur. 2016, 14, 1–8. [Google Scholar]
- Kalman, R.E. A new approach to linear filtering and prediction problems. J. Basic Eng. 1960, 82, 35–45. [Google Scholar] [CrossRef]
- Roetenberg, D.; Luinge, H.J.; Baten, C.T.M.; Veltink, P.H. Compensation of Magnetic Disturbances Improves Inertial and Magnetic Sensing of Human Body Segment Orientation. IEEE Trans. Neural Syst. Rehabil. Eng. 2005, 13, 395–405. [Google Scholar] [CrossRef]
- Sabatini, A.M. Quaternion-Based Extended Kalman Filter for Determining Orientation by Inertial and Magnetic Sensing. IEEE Trans. Biomed. Eng. 2006, 53, 1346–1356. [Google Scholar] [CrossRef]
- Suh, Y.S. Orientation Estimation Using a Quaternion-Based Indirect Kalman Filter with Adaptive Estimation of External Acceleration. IEEE Trans. Instrum. Meas. 2010, 59, 3296–3305. [Google Scholar] [CrossRef]
- St-Pierre, M.; Gingras, D. Comparison between the unscented kalman filter and the extended kalman filter for the position estimation module of an integrated navigation information system. In Proceedings of the IEEE Intelligent Vehicles Symposium, Parma, Italy, 14–17 June 2004; pp. 831–835. [Google Scholar]
- Trawny, N.; Roumeliotis, S.I. Indirect Kalman filter for 3D attitude estimation. Univ. Minn. Dept. Comp. Sci. Eng. Tech. Rep. 2005, 2, 2005. [Google Scholar]
- Ferdinando, H.; Khoswanto, H.; Purwanto, D. Embedded Kalman Filter for Inertial Measurement Unit (IMU) on the ATMega8535. In Proceedings of the 2012 International Symposium on Innovations in Intelligent Systems and Applications, Trabzon, Turkey, 2–4 July 2012; pp. 1–5. [Google Scholar]
- Madgwick, S. An efficient orientation filter for inertial and inertial/magnetic sensor arrays. Rep. x-io Univ. Bristol 2010, 25, 113–118. [Google Scholar]
- Feng, K.; Li, J.; Zhang, X.; Shen, C.; Bi, Y.; Zheng, T.; Liu, J. A New Quaternion-Based Kalman Filter for Real-Time Attitude Estimation Using the Two-Step Geometrically-Intuitive Correction Algorithm. Sensors 2017, 17, 2146. [Google Scholar] [CrossRef]
- Nair, V.; Hinton, G.E. Rectified linear units improve restricted boltzmann machines. In Proceedings of the 27th International Conference on Machine Learning (ICML 2010), Haifa, Israel, 21–24 June 2010; pp. 807–814. [Google Scholar]
- Hochreiter, S.; Schmidhuber, J. Long short-term memory. Neural Comput. 1997, 9, 1735–1780. [Google Scholar] [CrossRef]
- Dunn, O.J. Multiple Comparisons among Means. J. Am. Stat. Assoc. 1961, 56, 52–64. [Google Scholar] [CrossRef]


| Activity | Summary |
|---|---|
| Three-point gait | Walking straight for 3 m following the three-point gait method with the cane. At each step, the participant first moved the cane forward, then moved the left foot forward, and finally moved the right foot forward. |
| Two-point gait | Walking straight for 3 m following the two-point gait method with the cane. At each step, the participant moved both the cane and the left foot forward, and then moved the right foot forward. |
| Standing | The participant stood still while bearing weight on the cane for 10 s. |
| Sit to Stand | The participant moved from a sitting position to a standing position while bearing weight on the cane. |
| Stand to Sit | The participant moved from a standing position to a sitting position while bearing weight on the cane. |
| Stairs up | The participant climbed up an 18-cm-high concrete block with a horizontal surface area of (60 × 30) cm2. The participant first placed the cane on top of the concrete block, moved the right foot to the top of the block, and finally moved the left foot onto the block. |
| Stairs down | The participant climbed down from the 18-cm-high concrete block. The participant first brought the cane down to the ground, then brought the left foot down, and finally lowered the right foot to the ground. |
| Method | Subject Number | |||||
|---|---|---|---|---|---|---|
| 1 | 2 | 3 | 4 | 5 | Avg. | |
| Threshold-based method [17] | 83.36 | 79.17 | 83.57 | 82.03 | 83.21 | 82.27 |
| (4.50) | (1.94) | (1.49) | (1.65) | (2.24) | (3.06) | |
| Event-based method [20,21] | 79.19 | 87.79 | 89.52 | 83.37 | 81.80 | 84.33 |
| (4.14) | (2.05) | (1.78) | (1.07) | (2.78) | (4.60) | |
| Proposed model | 92.77 | 94.53 | 96.41 | 97.32 | 96.26 | 95.46 |
| (3.24) | (1.38) | (1.44) | (0.48) | (1.42) | (2.43) | |
| Proposed model + Voting window | 92.97 | 94.85 | 96.66 | 97.61 | 96.49 | 95.72 |
| (3.22) | (1.30) | (1.39) | (0.42) | (1.38) | (2.42) | |
| IMU Number | Subject Number | |||||
|---|---|---|---|---|---|---|
| 1 | 2 | 3 | 4 | 5 | Avg. | |
| IMU 1 | 92.38 | 94.04 | 95.65 | 96.97 | 96.09 | 95.02 |
| (3.31) | (1.66) | (1.48) | (0.29) | (1.30) | (2.44) | |
| IMU 2 | 92.83 | 94.66 | 96.29 | 97.45 | 96.33 | 95.51 |
| (3.26) | (1.43) | (1.51) | (0.33) | (1.27) | (2.39) | |
| IMU 3 | 93.00 | 94.79 | 96.60 | 97.73 | 96.40 | 95.70 |
| (3.25) | (1.30) | (1.58) | (0.27) | (1.36) | (2.41) | |
| IMU 4 | 93.12 | 95.15 | 96.86 | 97.47 | 96.39 | 95.80 |
| (3.19) | (1.10) | (1.27) | (0.41) | (1.57) | (2.30) | |
| IMU 5 | 93.08 | 94.39 | 96.74 | 97.22 | 96.17 | 95.52 |
| (3.18) | (1.39) | (1.36) | (0.48) | (1.68) | (2.36) | |
| Algorithm | Subject Number | |||||||||||
|---|---|---|---|---|---|---|---|---|---|---|---|---|
| 1 | 2 | 3 | 4 | 5 | 6 | 7 | 8 | 9 | 10 | Avg. | ||
| Roll | Acc + Mag [15,34] | 17.39 (12.93) | 17.16 (18.54) | 14.68 (15.54) | 15.66 (14.87) | 17.40 (12.59) | 14.44 (12.27) | 18.53 (16.71) | 26.39 (25.55) | 17.25 (14.29) | 20.65 (18.83) | 17.91 (16.91) |
| Indirect Kalman filter [36] | 1.55 (1.77) | 1.50 (1.28) | 0.99 (0.78) | 1.03 (0.88) | 1.05 (0.64) | 1.15 (0.78) | 1.29 (1.16) | 1.32 (1.15) | 1.34 (1.10) | 1.19 (0.90) | 1.24 (1.10) | |
| Madgwick filter [42] | 0.67 (0.51) | 0.68 (0.41) | 0.66 (0.43) | 0.75 (0.57) | 0.87 (0.54) | 0.70 (0.34) | 0.67 (0.40) | 0.67 (0.33) | 0.88 (0.92) | 0.77 (0.45) | 0.73 (0.53) | |
| Pitch | Acc + Mag [15,34] | 16.24 (14.19) | 14.81 (15.82) | 12.65 (15.62) | 11.48 (9.93) | 14.78 (11.37) | 13.89 (12.29) | 16.87 (16.88) | 22.65 (25.88) | 15.48 (13.30) | 18.58 (18.84) | 15.71 (16.20) |
| Indirect Kalman filter [36] | 1.77 (2.10) | 1.52 (1.53) | 1.46 (1.09) | 1.13 (0.66) | 1.33 (0.90) | 1.25 (1.03) | 1.46 (1.64) | 1.25 (0.93) | 1.49 (1.01) | 1.29 (1.00) | 1.40 (1.26) | |
| Madgwick filter [42] | 0.92 (0.59) | 1.00 (0.71) | 0.86 (0.45) | 0.81 (0.35) | 1.06 (0.54) | 0.91 (0.53) | 0.97 (0.62) | 0.75 (0.38) | 1.06 (0.59) | 0.89 (0.49) | 0.92 (0.54) | |
| Yaw | Acc + Mag [15,34] | 16.91 (12.32) | 16.81 (11.02) | 13.87 (10.92) | 11.96 (8.09) | 14.38 (9.81) | 14.57 (10.99) | 16.04 (10.57) | 18.46 (12.18) | 14.21 (10.52) | 16.96 (10.82) | 15.40 (10.92) |
| Indirect Kalman filter [36] | 1.57 (1.84) | 2.12 (3.27) | 1.25 (1.31) | 1.01 (0.89) | 1.25 (1.33) | 1.26 (1.60) | 2.09 (2.92) | 1.20 (1.11) | 1.49 (1.71) | 1.60 (2.37) | 1.48 (2.01) | |
| Madgwick filter [42] | 0.71 (0.53) | 0.68 (0.44) | 0.70 (0.41) | 0.71 (0.48) | 0.84 (0.49) | 0.71 (0.43) | 1.15 (0.57) | 0.78 (0.46) | 0.91 (0.93) | 0.67 (0.40) | 0.78 (0.55) | |
| Total | Acc + Mag [15,34] | 17.45 (12.36) | 17.25 (14.36) | 14.35 (13.59) | 13.98 (10.30) | 16.15 (10.48) | 14.92 (11.08) | 17.93 (14.11) | 23.74 (21.06) | 16.31 (12.02) | 19.61 (15.62) | 17.14 (14.04) |
| Indirect Kalman filter [36] | 1.84 (1.71) | 1.97 (2.01) | 1.37 (0.92) | 1.17 (0.65) | 1.32 (0.86) | 1.34 (1.05) | 1.83 (1.89) | 1.37 (0.92) | 1.60 (1.11) | 1.53 (1.42) | 1.53 (1.35) | |
| Madgwick filter [42] | 0.82 (0.47) | 0.85 (0.46) | 0.78 (0.36) | 0.81 (0.38) | 0.96 (0.45) | 0.81 (0.38) | 1.00 (0.43) | 0.78 (0.29) | 1.03 (0.74) | 0.83 (0.36) | 0.87 (0.46) | |
| Activity Type | |||||||
|---|---|---|---|---|---|---|---|
| 3-Point Gait | 2-Point Gait | Standing | Sit to Stand | Stand to Sit | Stairs Up | Stairs Down | |
| Roll | 1.13 (0.89) | 1.03 (0.44) | 0.80 (0.54) | 0.45 (0.21) | 0.44 (0.18) | 0.53 (0.23) | 0.51 (0.22) |
| Pitch | 1.08 (0.39) | 1.00 (0.26) | 0.74 (0.46) | 0.52 (0.28) | 0.65 (0.36) | 0.92 (0.46) | 0.49 (0.20) |
| Yaw | 1.14 (0.86) | 0.93 (0.42) | 0.98 (0.56) | 0.64 (0.34) | 0.68 (0.38) | 0.67 (0.52) | 0.94 (0.47) |
| Total | 1.24 (0.60) | 1.09 (0.26) | 0.86 (0.40) | 0.57 (0.19) | 0.56 (0.23) | 0.81 (0.34) | 0.73 (0.21) |
| Subject Number | |||||||||||
|---|---|---|---|---|---|---|---|---|---|---|---|
| 1 | 2 | 3 | 4 | 5 | 6 | 7 | 8 | 9 | 10 | Avg. | |
| IMU 1 | 0.77 (0.43) | 0.81 (0.46) | 0.73 (0.31) | 0.85 (0.33) | 1.02 (0.51) | 0.79 (0.36) | 1.14 (0.56) | 0.78 (0.27) | 0.97 (0.73) | 0.68 (0.33) | 0.85 (0.47) |
| IMU 2 | 0.63 (0.36) | 0.57 (0.29) | 0.53 (0.23) | 0.66 (0.35) | 0.82 (0.33) | 0.73 (0.31) | 0.81 (0.29) | 0.72 (0.28) | 0.92 (0.69) | 0.71 (0.27) | 0.71 (0.38) |
| IMU 3 | 1.03 (0.56) | 0.99 (0.50) | 0.84 (0.33) | 0.84 (0.36) | 1.08 (0.52) | 0.91 (0.46) | 1.01 (0.41) | 0.78 (0.30) | 1.11 (0.75) | 1.03 (0.39) | 0.96 (0.49) |
| IMU 4 | 0.77 (0.41) | 0.82 (0.37) | 0.76 (0.32) | 0.76 (0.39) | 0.90 (0.36) | 0.76 (0.31) | 0.94 (0.36) | 0.77 (0.30) | 1.05 (0.74) | 0.85 (0.33) | 0.79 (0.54) |
| IMU 5 | 0.90 (0.44) | 1.05 (0.47) | 1.03 (0.39) | 0.96 (0.39) | 0.99 (0.46) | 0.87 (0.43) | 1.11 (0.43) | 0.86 (0.30) | 1.09 (0.78) | 0.88 (0.35) | 0.97 (0.47) |
© 2020 by the authors. Licensee MDPI, Basel, Switzerland. This article is an open access article distributed under the terms and conditions of the Creative Commons Attribution (CC BY) license (http://creativecommons.org/licenses/by/4.0/).
Share and Cite
Fernandez, I.G.; Ahmad, S.A.; Wada, C. Inertial Sensor-Based Instrumented Cane for Real-Time Walking Cane Kinematics Estimation. Sensors 2020, 20, 4675. https://doi.org/10.3390/s20174675
Fernandez IG, Ahmad SA, Wada C. Inertial Sensor-Based Instrumented Cane for Real-Time Walking Cane Kinematics Estimation. Sensors. 2020; 20(17):4675. https://doi.org/10.3390/s20174675
Chicago/Turabian StyleFernandez, Ibai Gorordo, Siti Anom Ahmad, and Chikamune Wada. 2020. "Inertial Sensor-Based Instrumented Cane for Real-Time Walking Cane Kinematics Estimation" Sensors 20, no. 17: 4675. https://doi.org/10.3390/s20174675
APA StyleFernandez, I. G., Ahmad, S. A., & Wada, C. (2020). Inertial Sensor-Based Instrumented Cane for Real-Time Walking Cane Kinematics Estimation. Sensors, 20(17), 4675. https://doi.org/10.3390/s20174675