Micro-Crack Mechanism in the Fracture Evolution of Saturated Granite and Enlightenment to the Precursors of Instability


Abstract
1. Introduction
2. Experiment
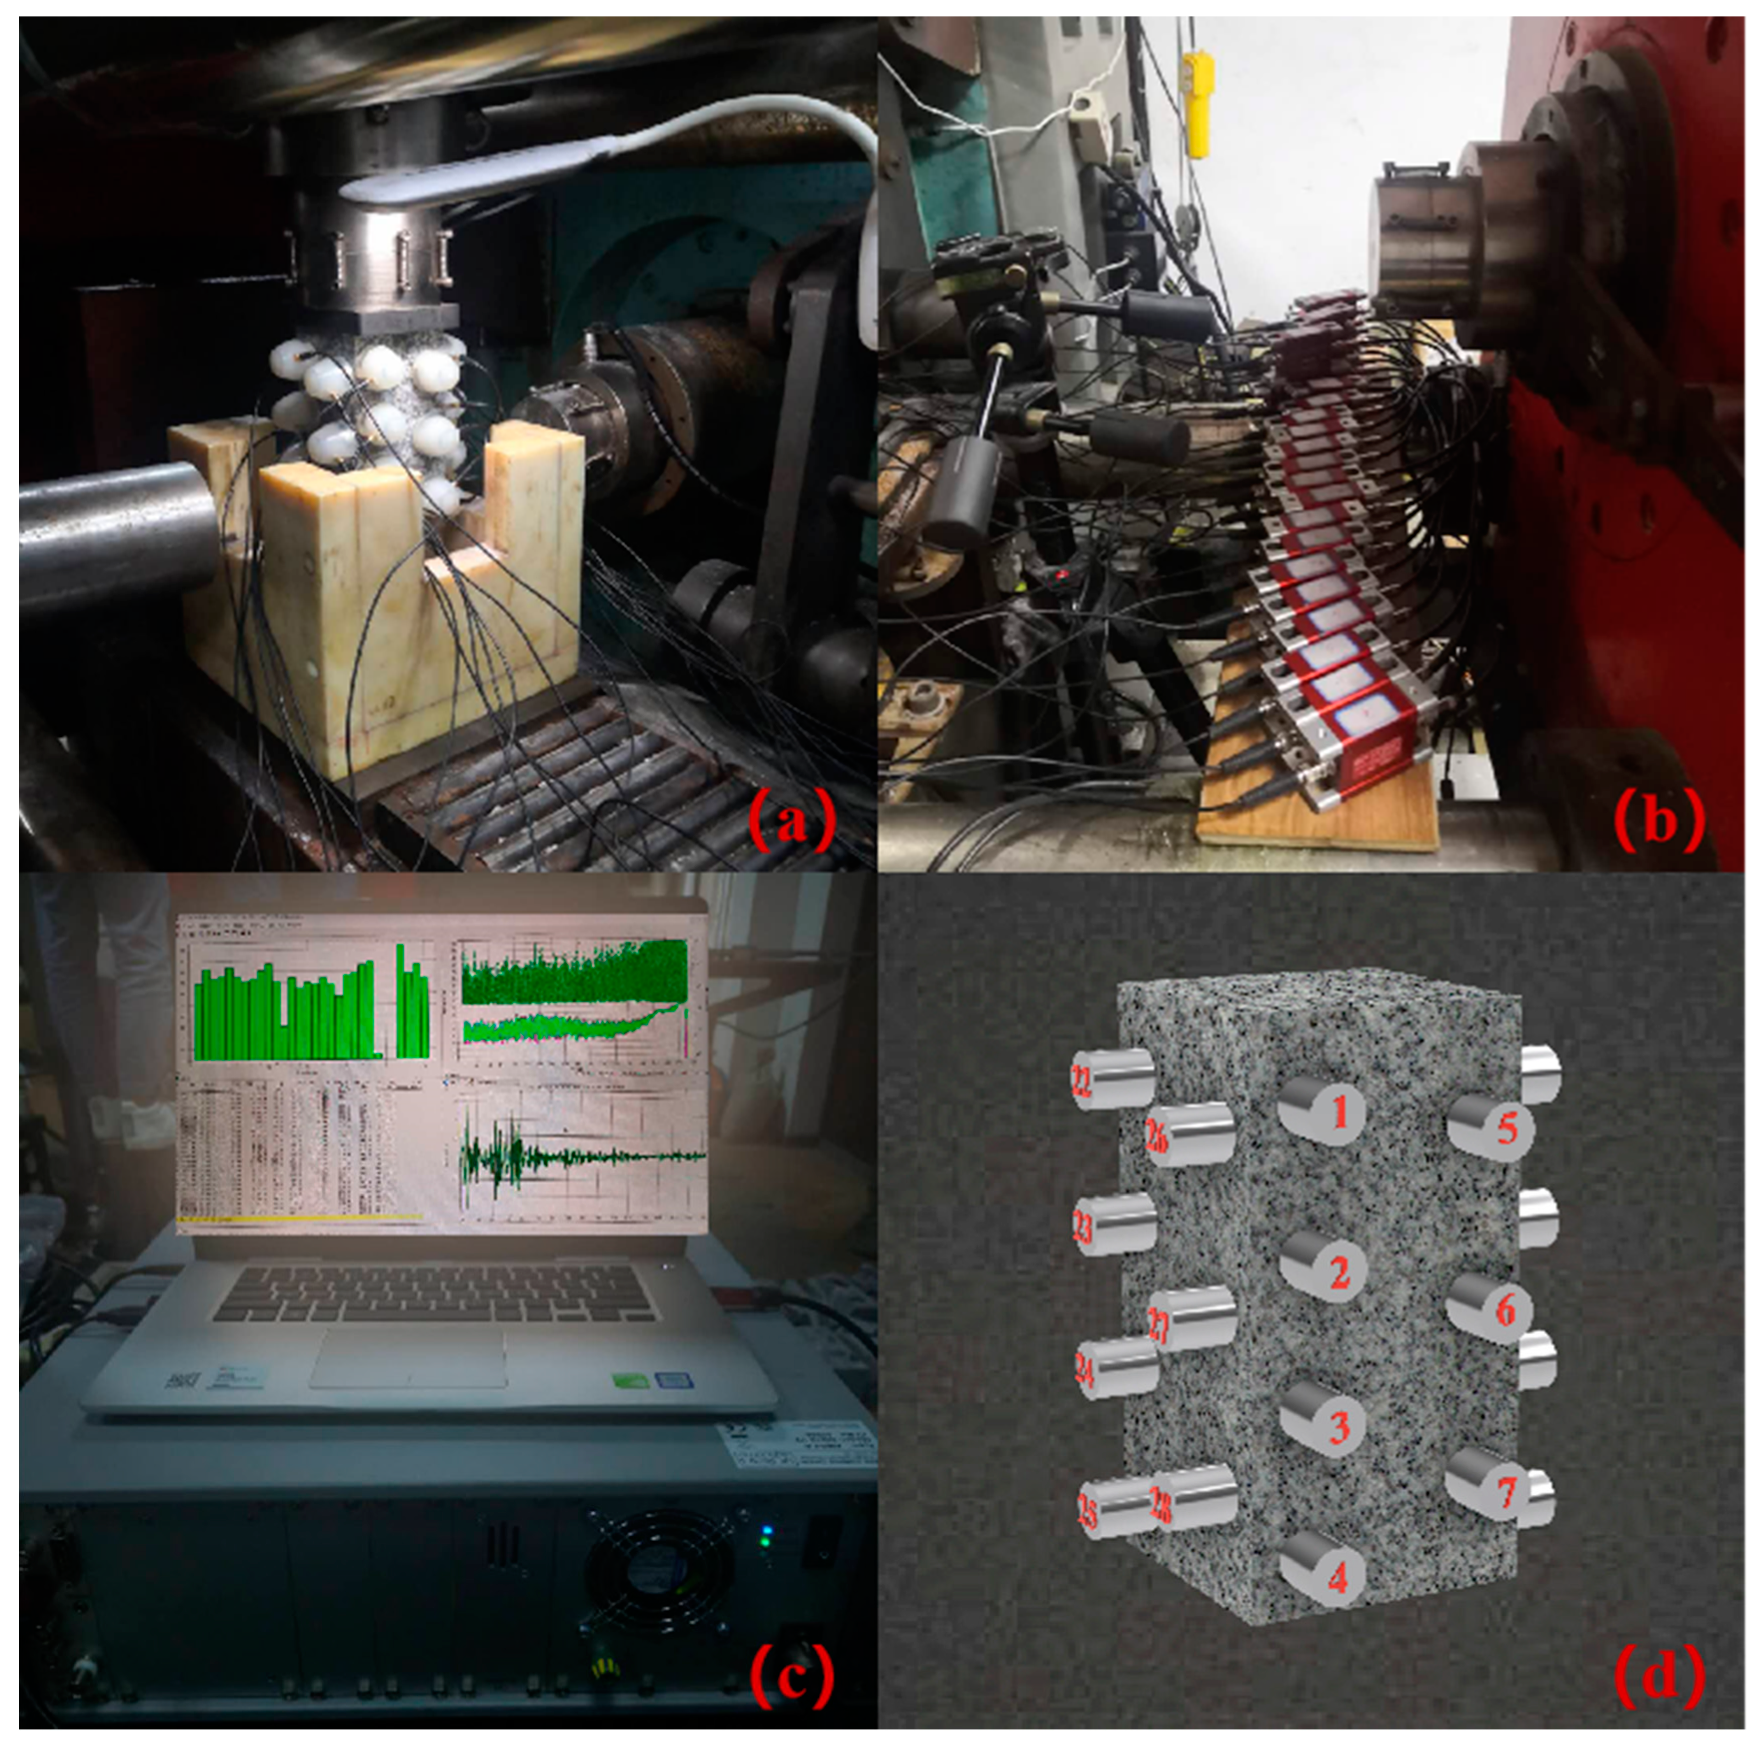
2.1. Instruments and Rock Samples
2.2. Sensor Arrangement and Loading Procedure
3. Results
3.1. AE Time-Frequency Characteristics of Granite Damage Evolution
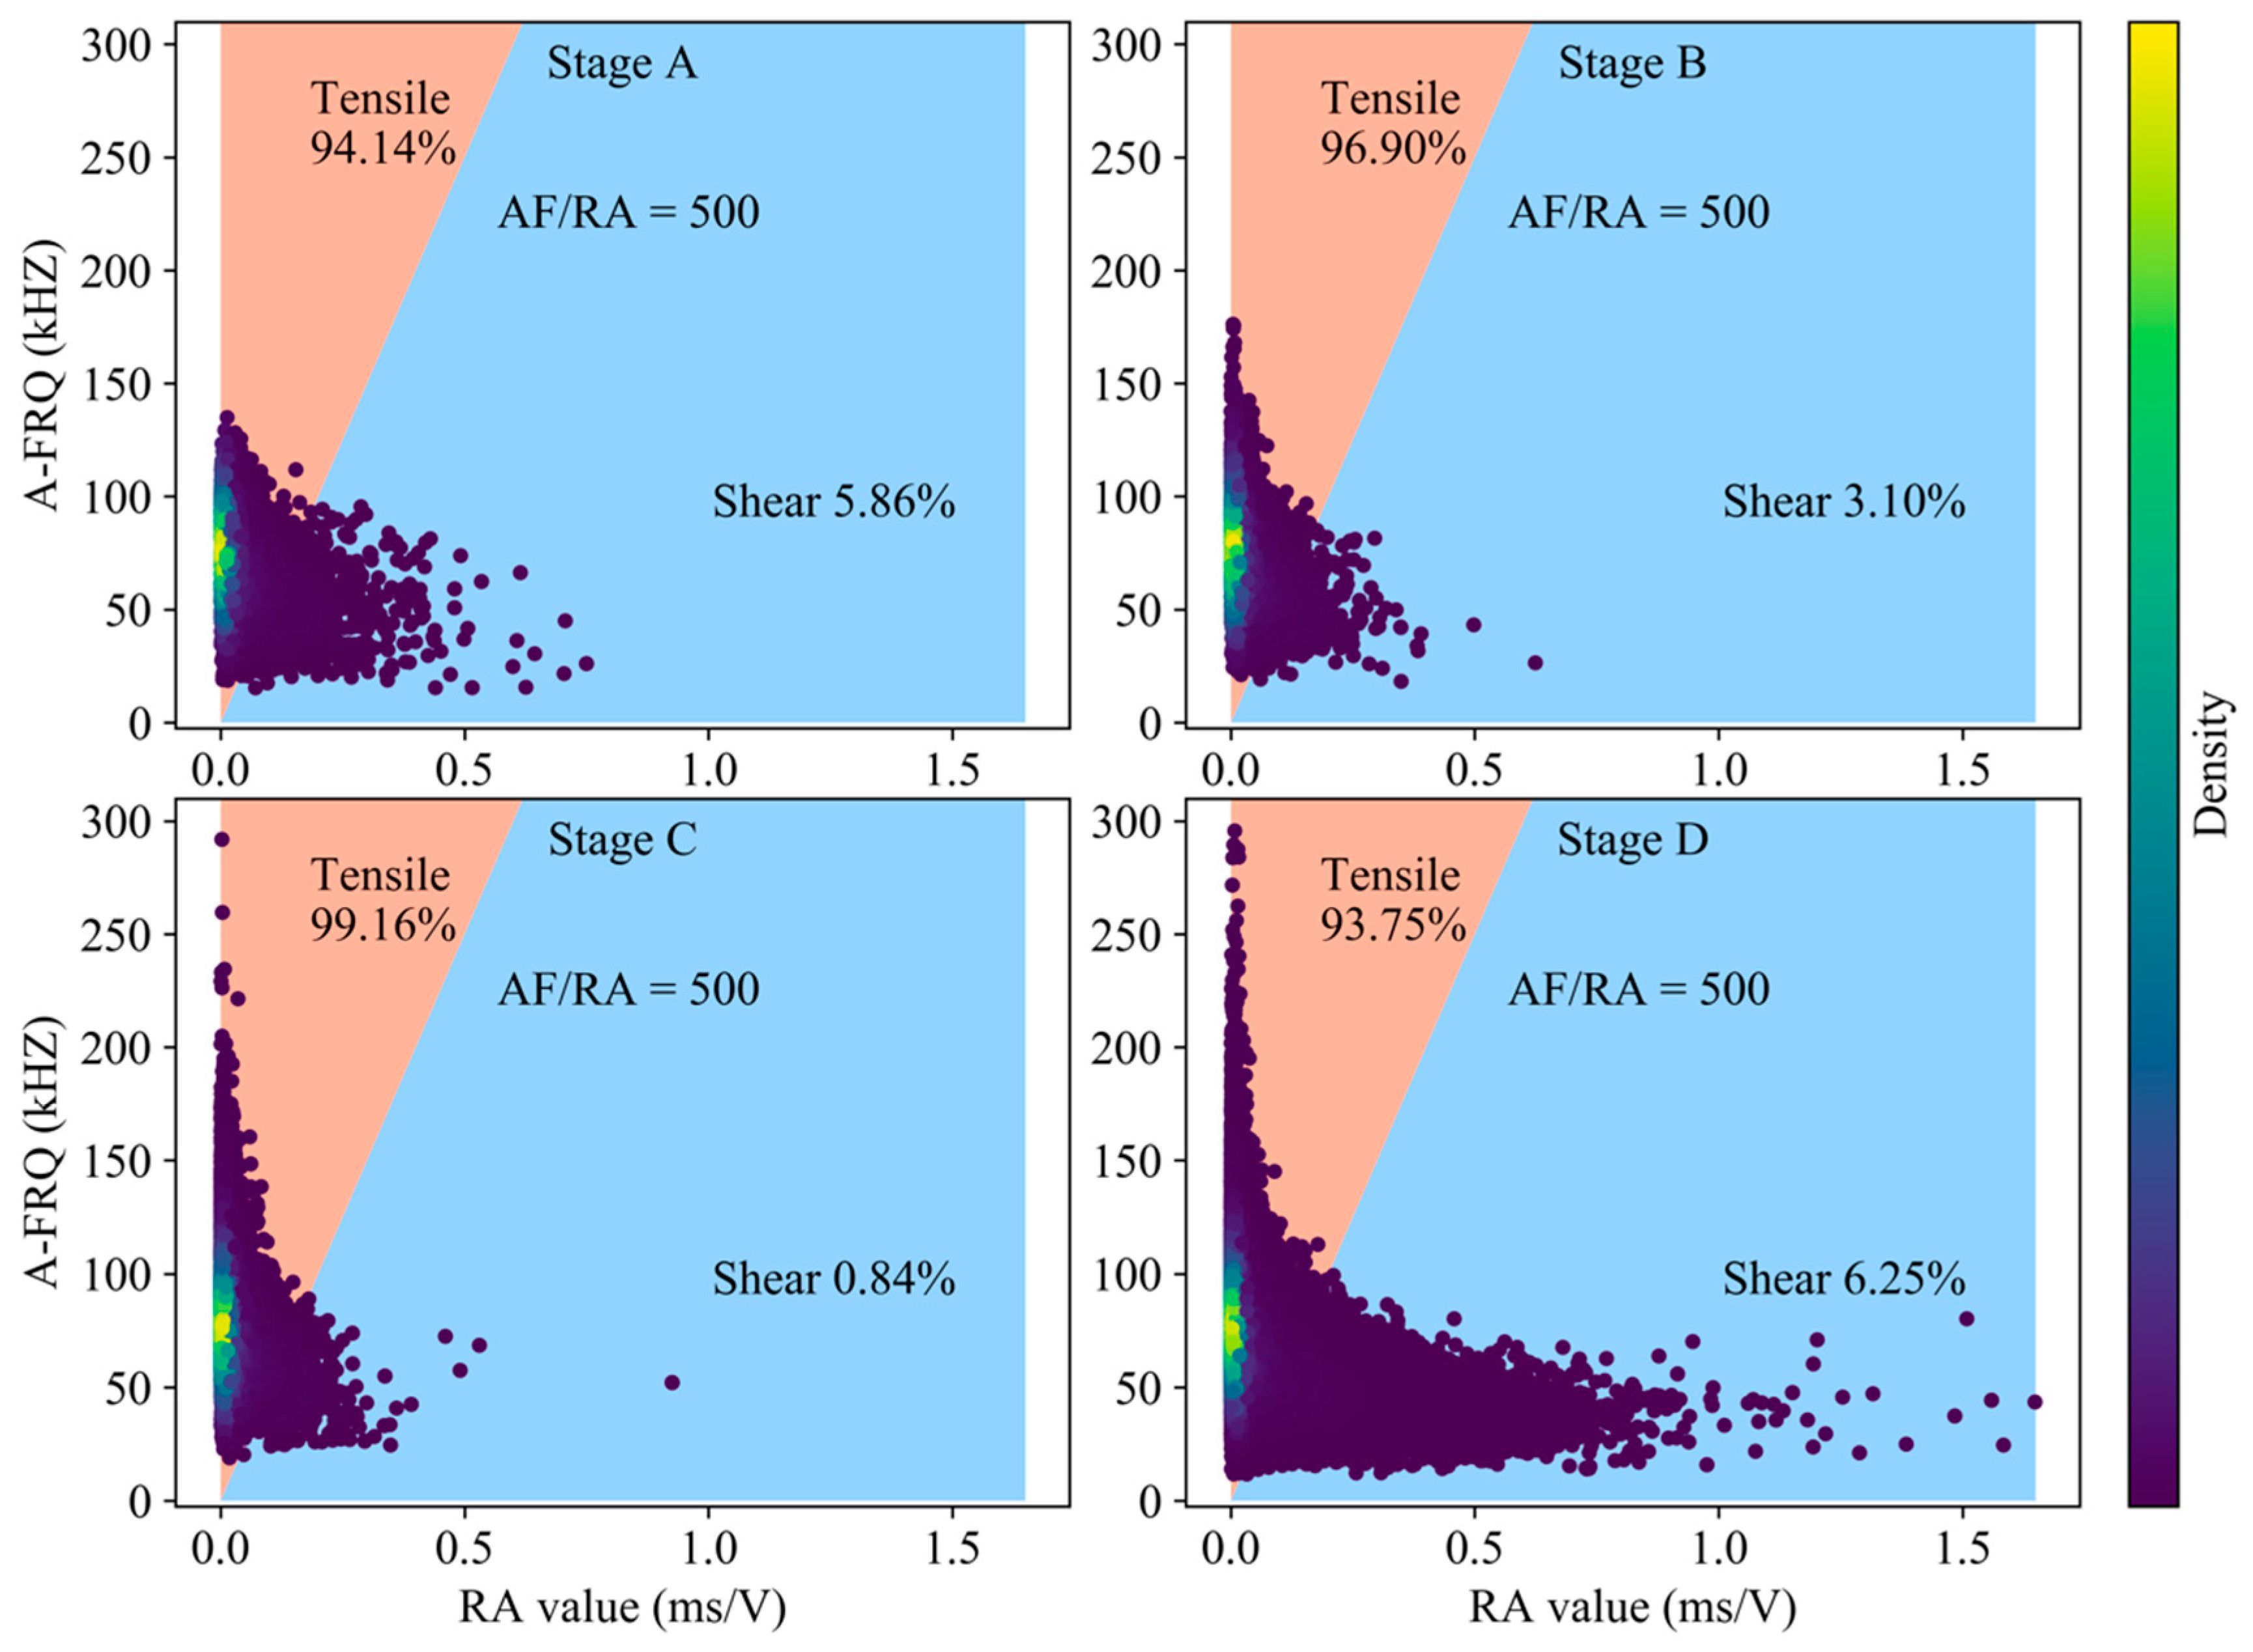
- Stage A (the compaction stage during 0–795s): the characteristics of AE event are low amplitude, low frequency, and low event rate. The main sources of AE signals originate from the primary cracks closed and the friction dislocation between grains.
- Stage B (the elastic stage during 796–1200s): the AE activity is almost quiet, and the characteristics are similar to the previous stage.
- Stage C (the stable crack propagation stage during 1201–1484s): the increase of AE event rate is accompanied by a large number of AE events with high amplitude and intermediate and high frequency. The primary cracks and secondary cracks with different scales and multiple fracture modes propagate stably in granite.
- Stage D (the unstable crack propagation stage during 1485–1702s): the AE events of high energy level increase sharply, and the low frequency band becomes wider, and the low, intermediate and high frequency bands coexist, which reveal that the crack propagation of granite is accelerated, and microcrack initiation and large crack penetration are synchronous.
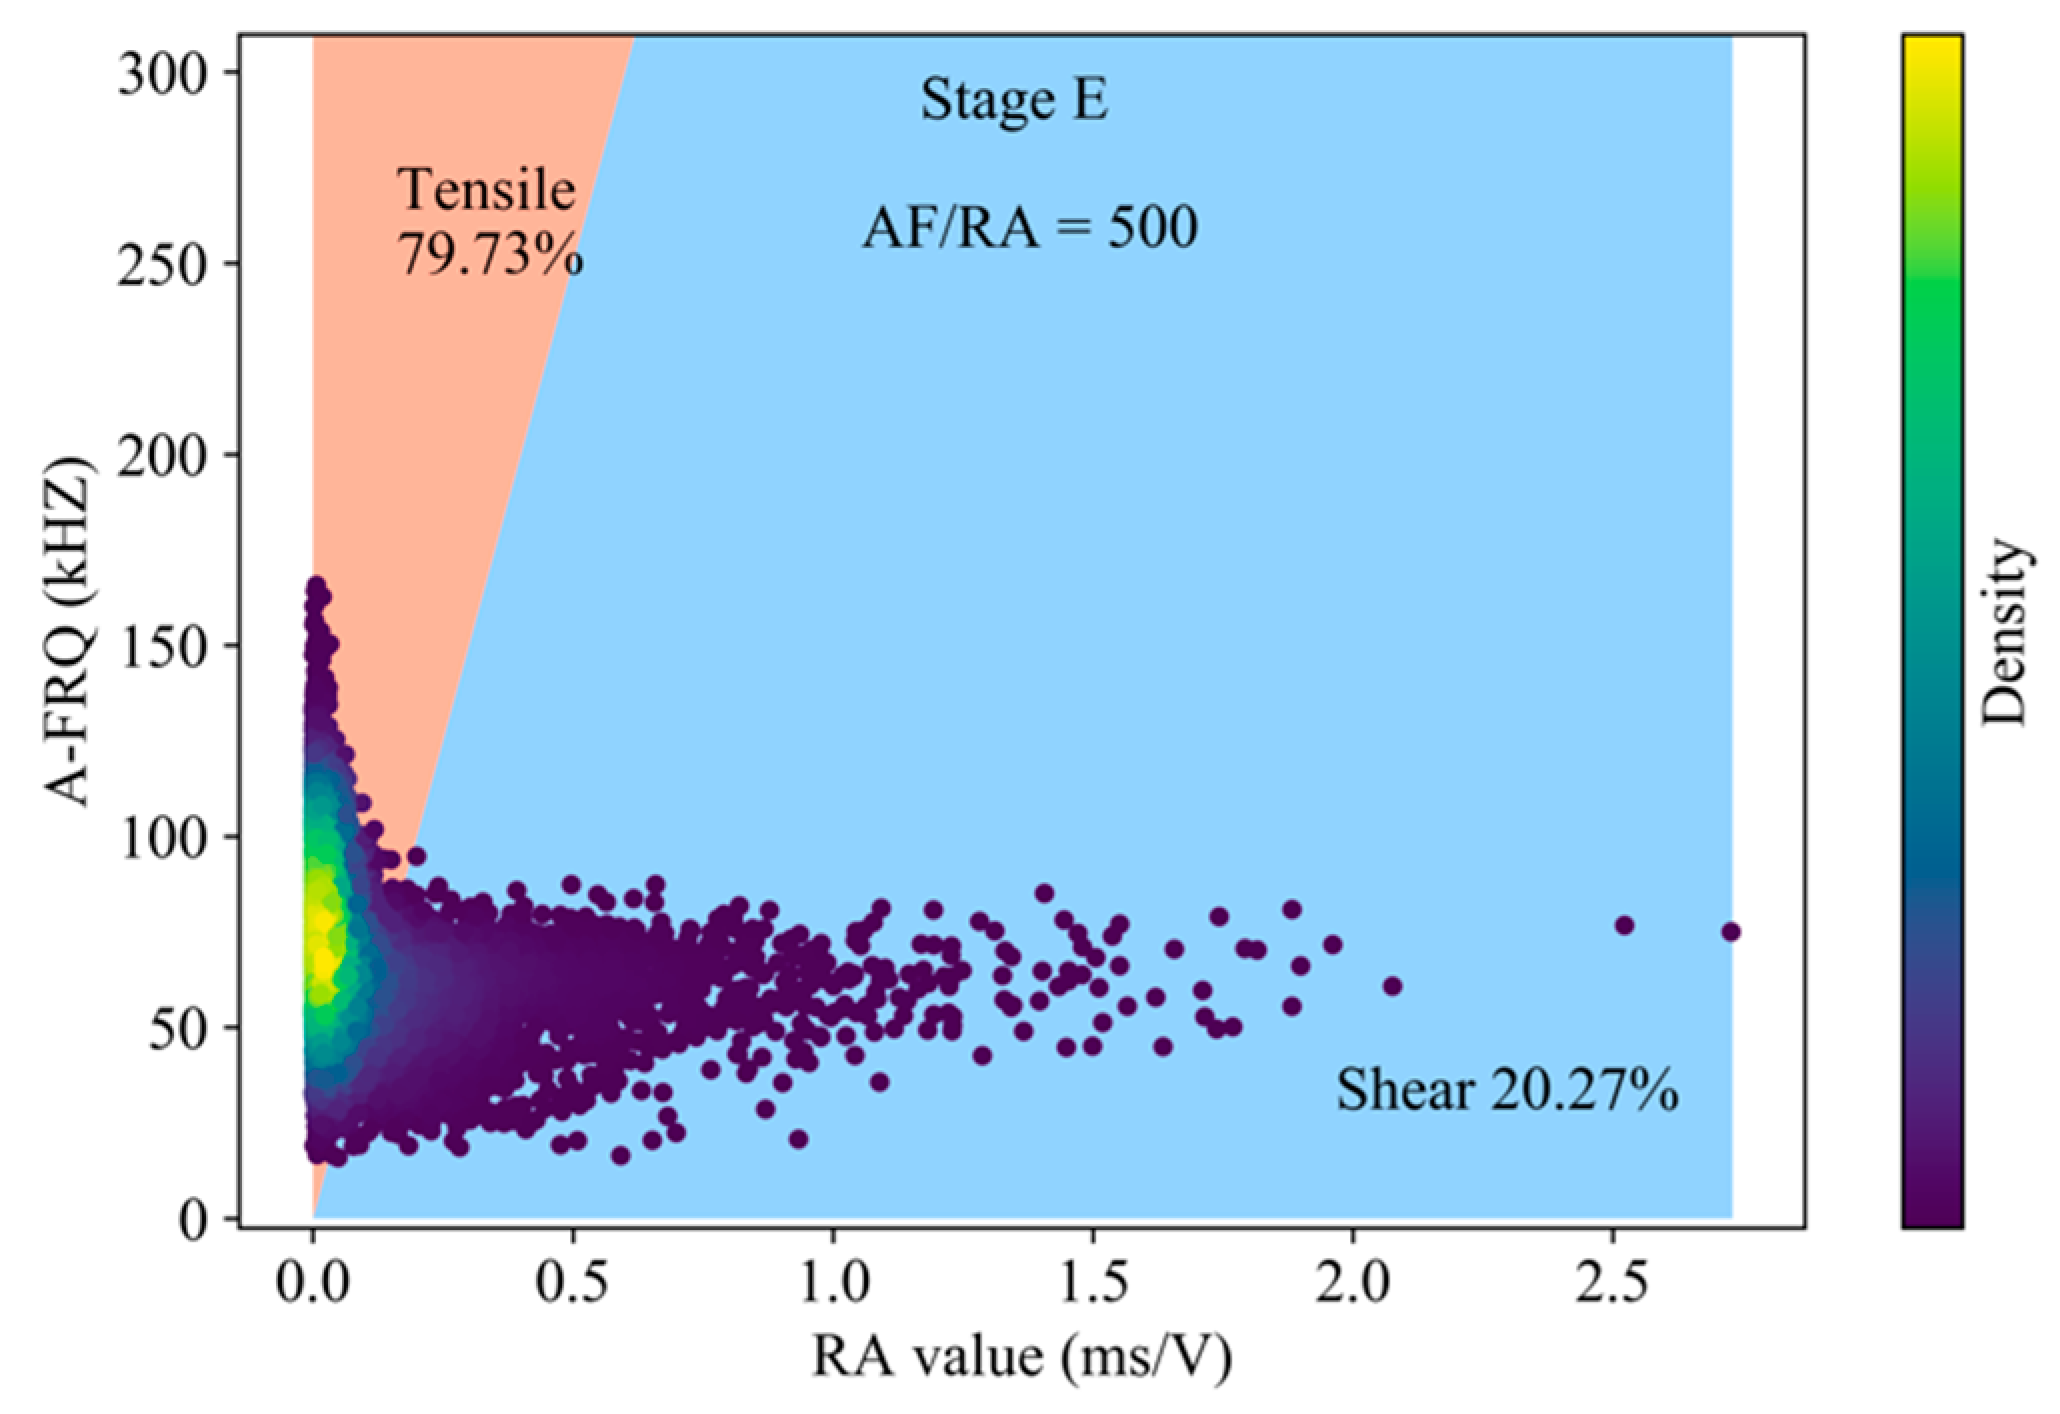
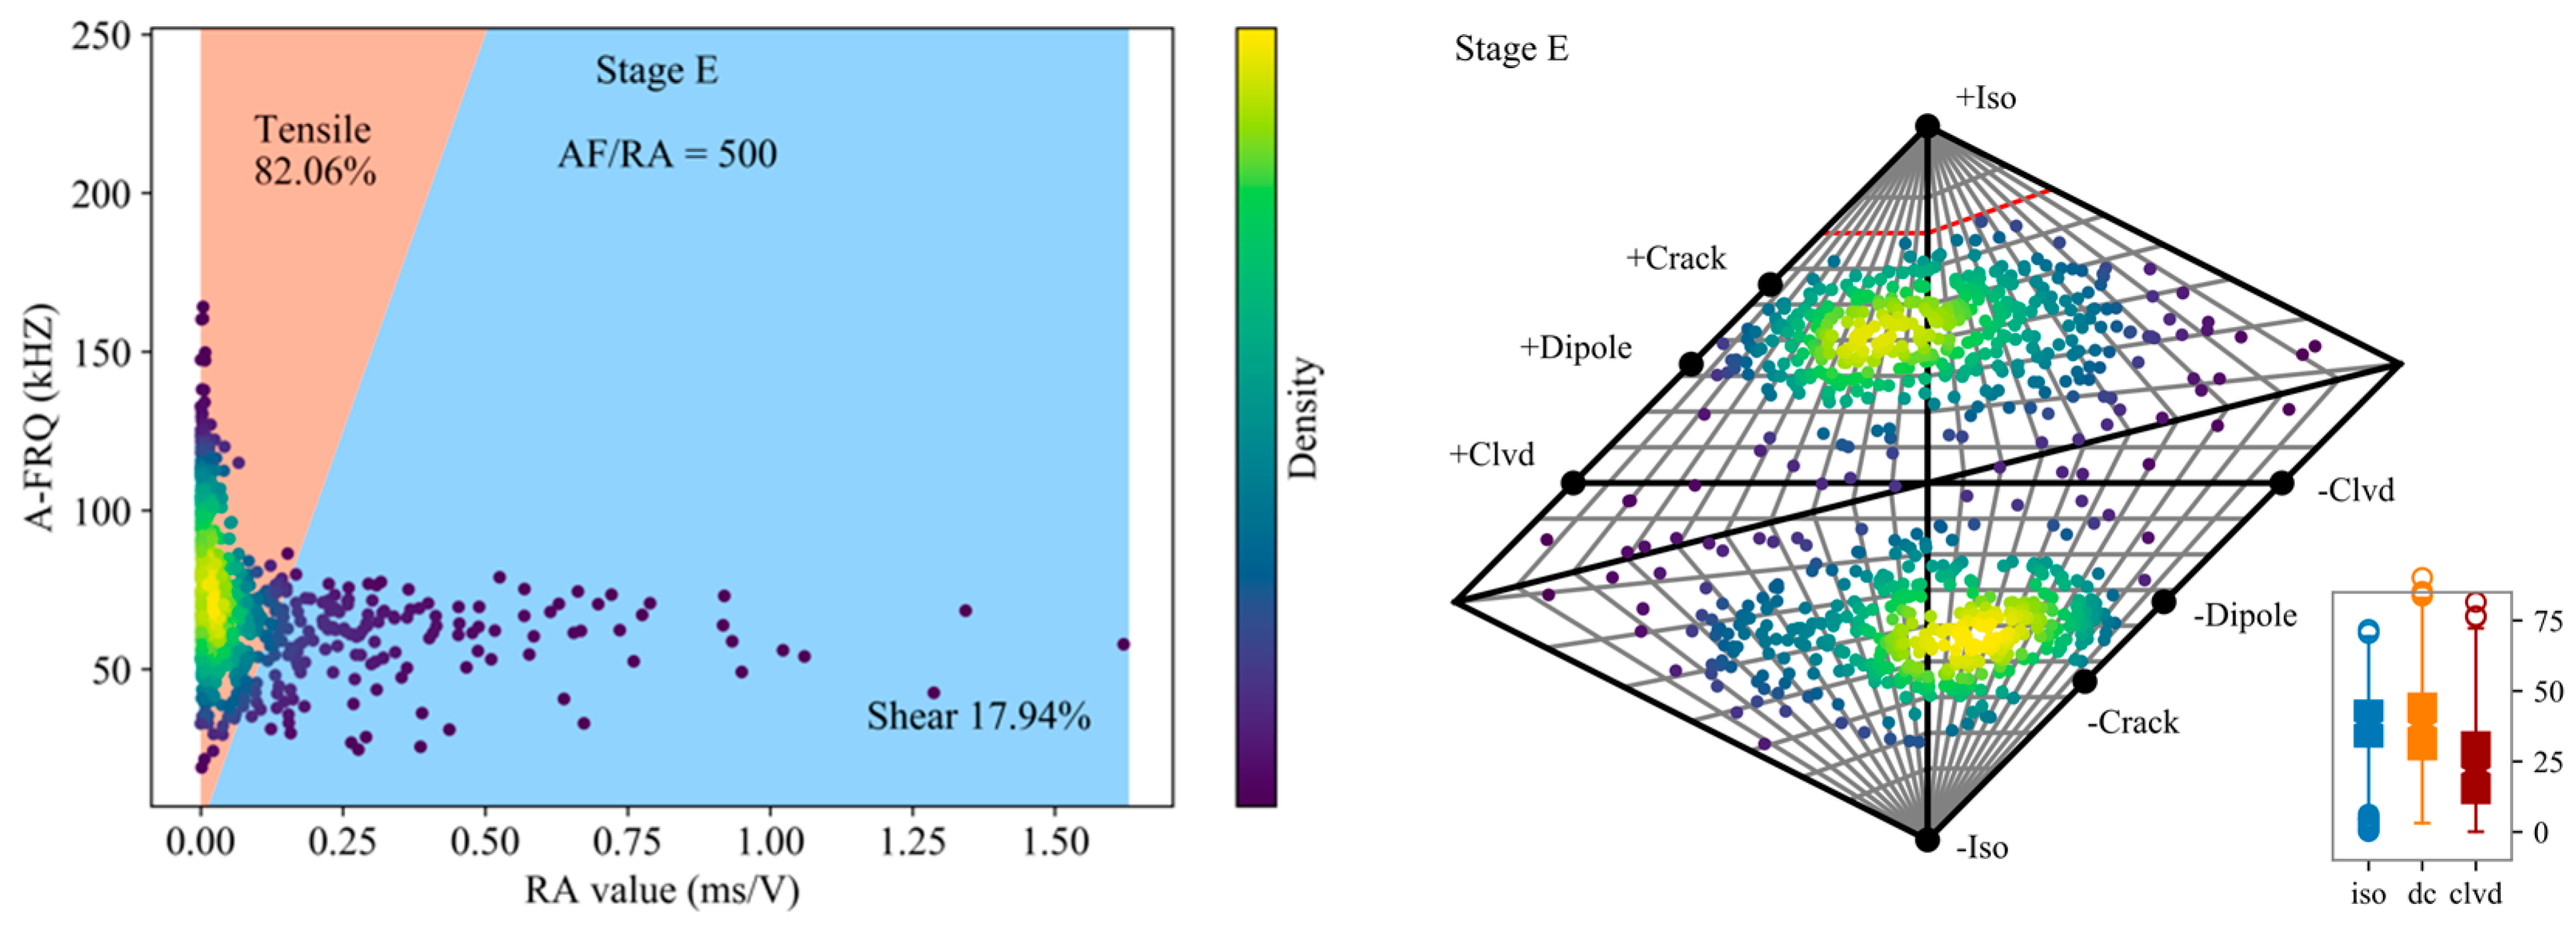
- Stage E (the post-peak stage during 1703–1770s): AE events with high-frequency basically disappear, and AE events with low-frequency and high-amplitude dominate the rock damage. The crack penetration leads to the formation of discontinuity surfaces inside the granite, and the weakened coupling between the sensor and the rock surface, which causes the attenuation of the acquisition wave frequency, especially the influence on the AE signal with high-frequency. With the further penetration of macroscopic cracks, the energy stored in pre-peak continues to be released, and the granite gradually loses its bearing capacity.
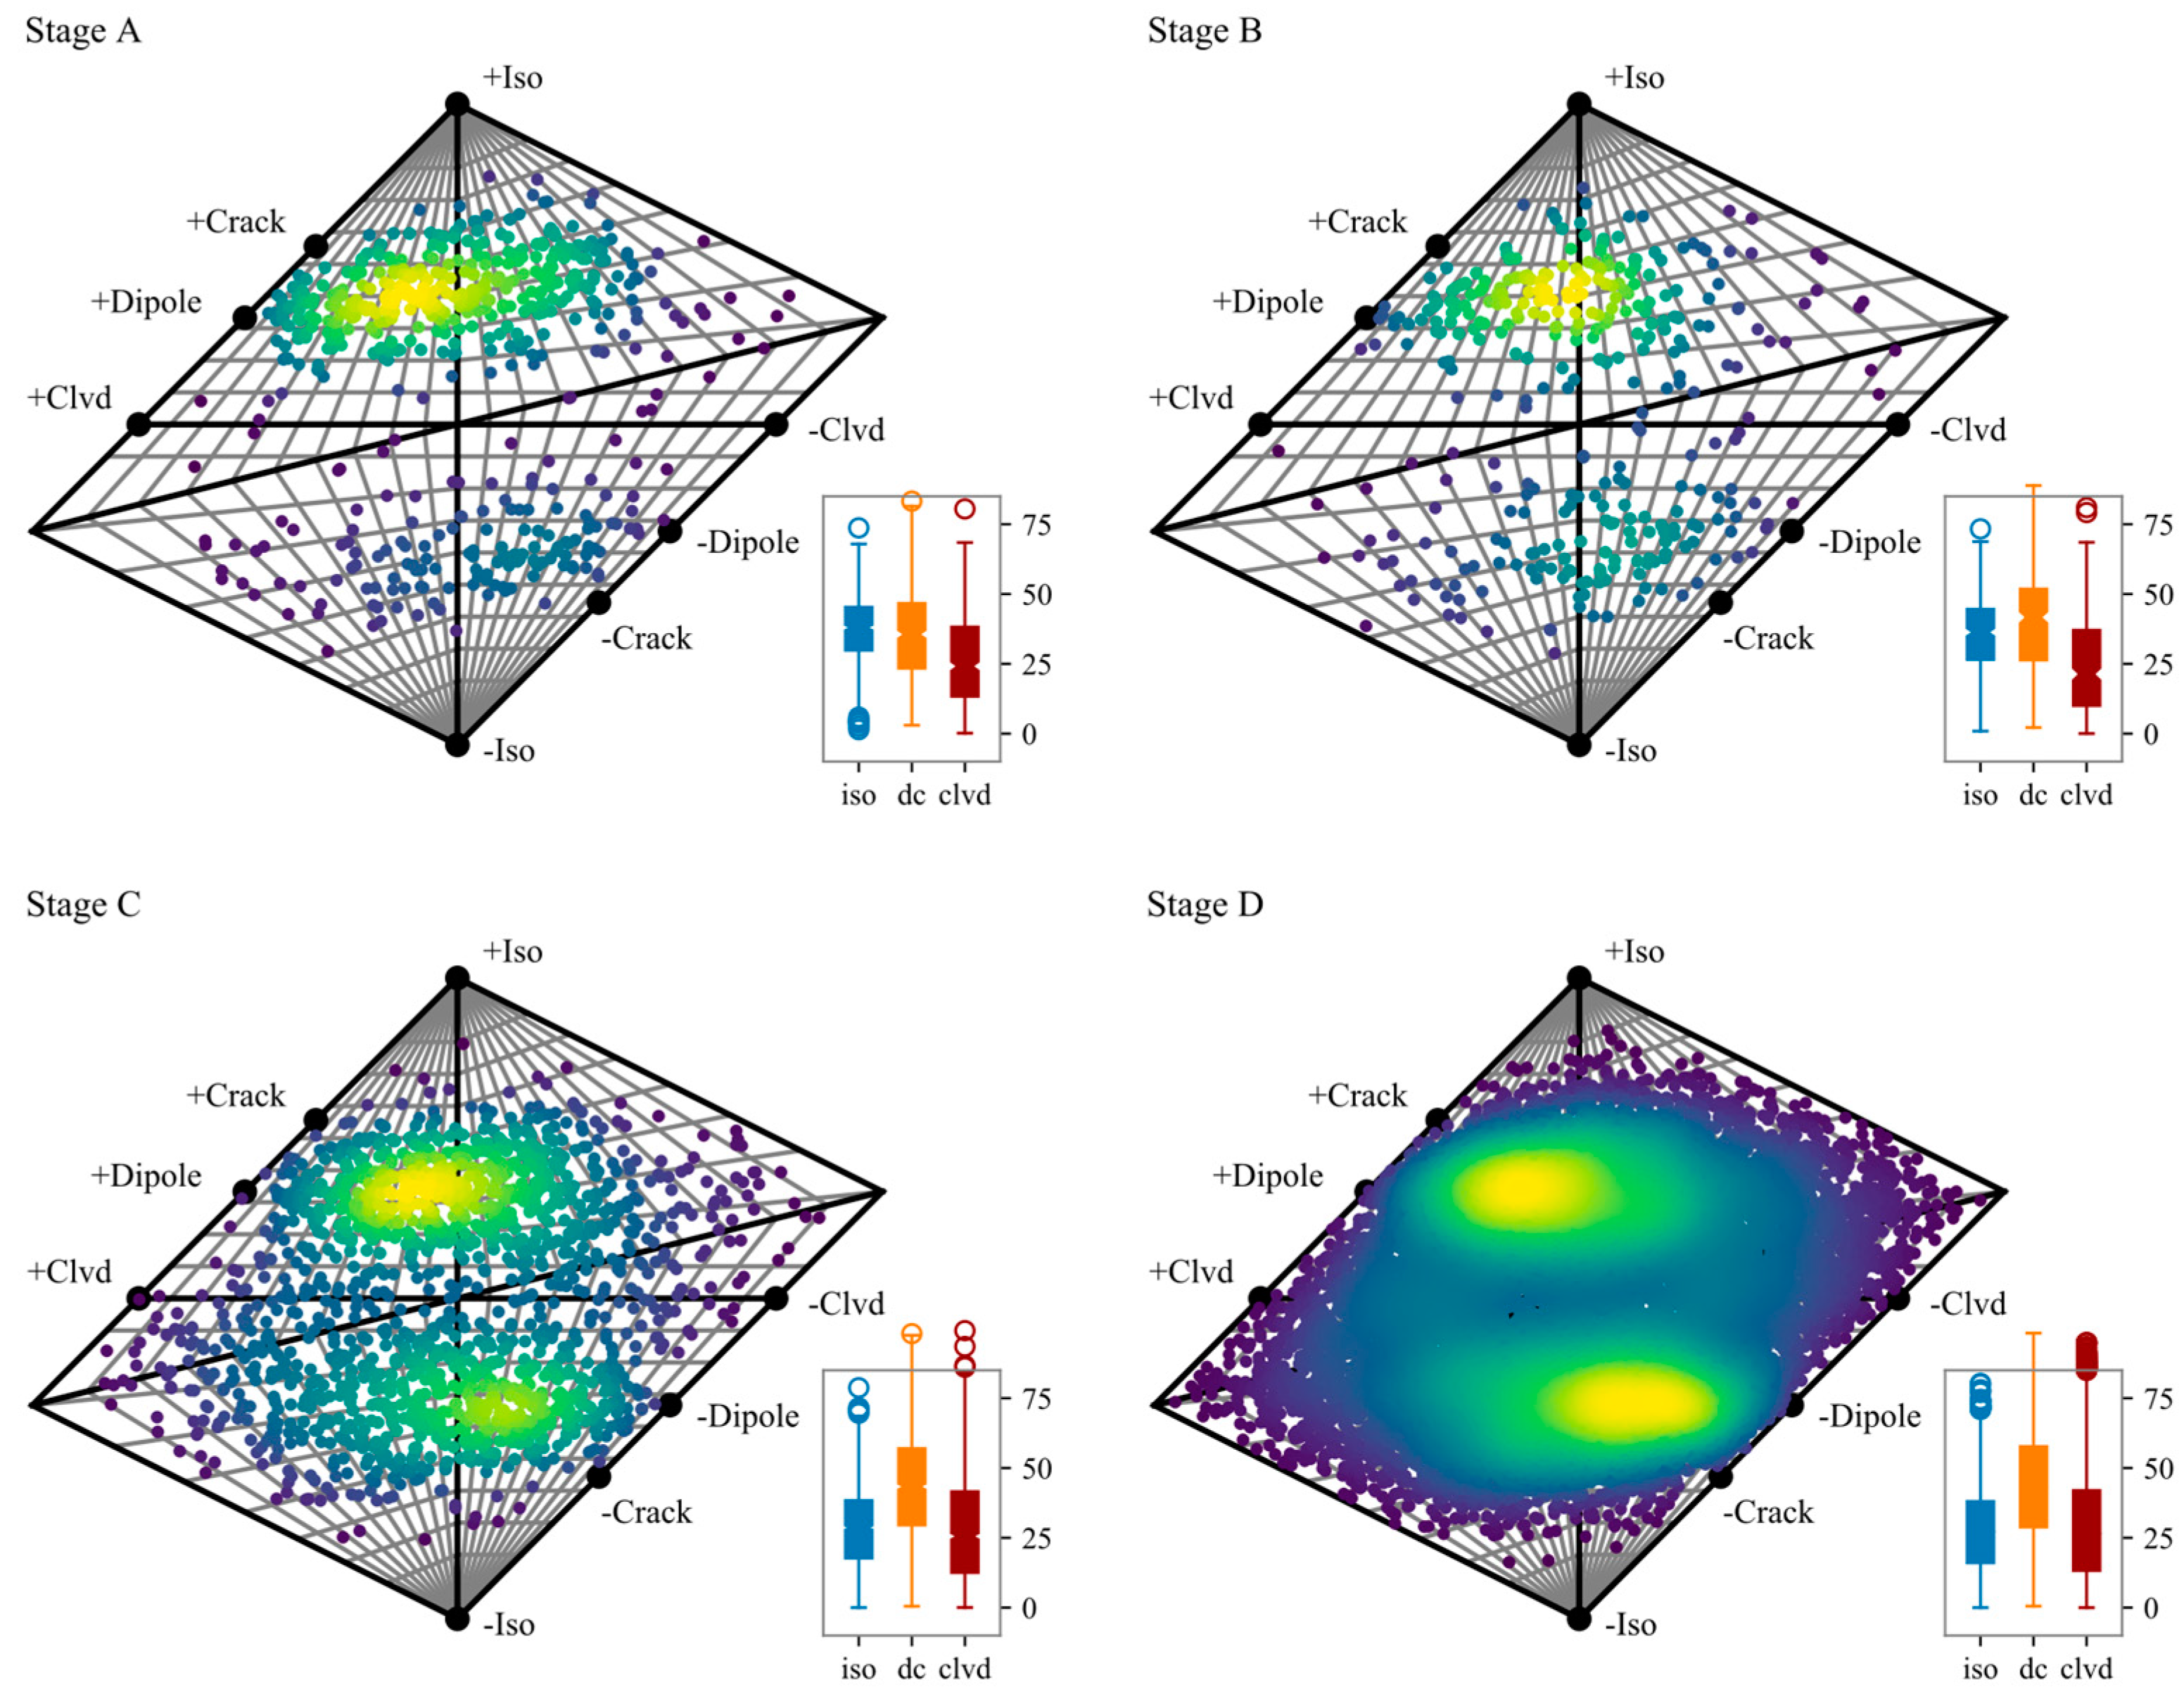
3.2. Fracture Types of Granite Damage Evolution
3.3. The Influence of Water on the Fracture Types
4. Discussion
4.1. Uncertainty of the RA-AF Parameter Characteristics Method
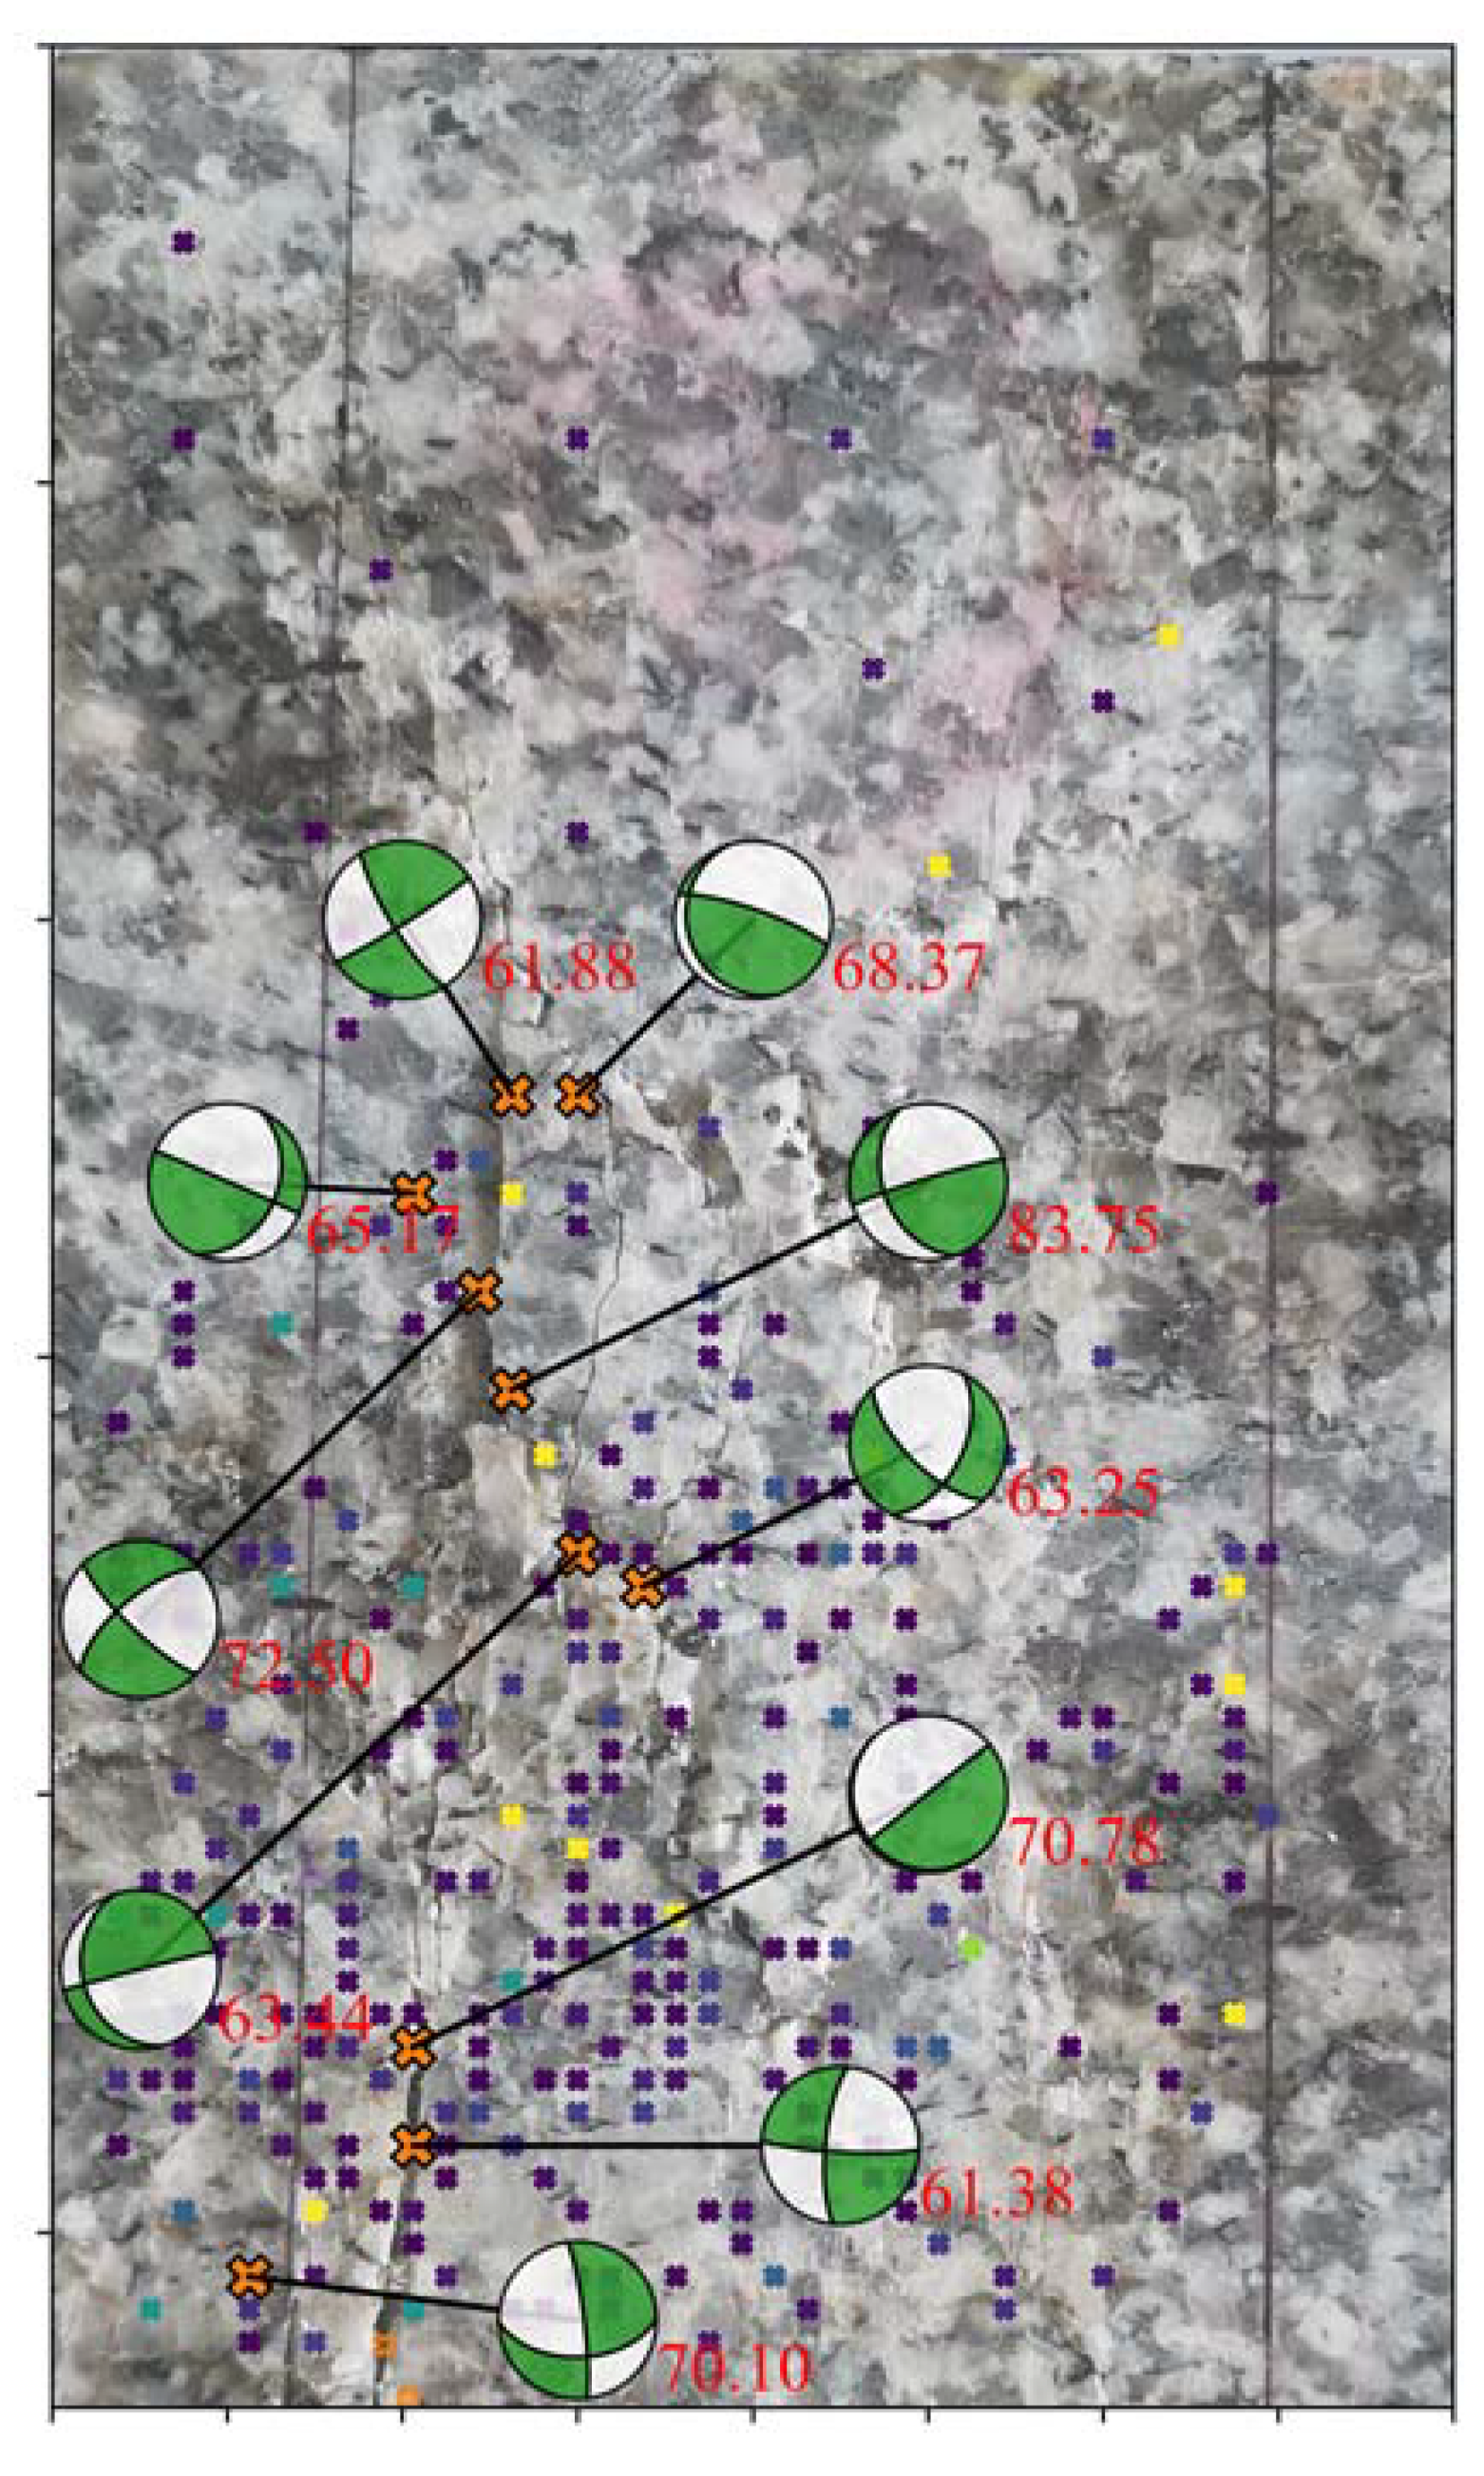
4.2. Analysis of Fracture Types Based on the Moment Tensor Method
4.3. Uncertainty of the Moment Tensor Method
4.4. Fracture Types of Granite in Post-Peak
5. Conclusions
Author Contributions
Funding
Conflicts of Interest
References
- Kemeny, J.M.; Cook, N.G.W. Micromechanics of Deformation in Rocks. In Toughening Mechanisms in Quasi-Brittle Materials; Shah, S.P., Ed.; Kluwer Academic Publishers: Dordrecht, The Netherlands, 1991; pp. 155–188. [Google Scholar]
- Zhao, Y.; Wang, Y.; Tang, L. The compressive-shear fracture strength of rock containing water based on Druker-Prager failure criterion. Arab. J. Geosci. 2019, 12, 1–8. [Google Scholar] [CrossRef]
- Chmel, A.; Shcherbakov, I. A comparative acoustic emission study of compression and impact fracture in granite. Int. J. Rock Mech. Min. Sci. 2013, 64, 56–59. [Google Scholar] [CrossRef]
- Hu, Q.; Dong, L. Acoustic Emission Source Location and Experimental Verification for Two-Dimensional Irregular Complex Structure. IEEE Sens. J. 2020, 20, 2679–2691. [Google Scholar] [CrossRef]
- Dong, L.; Sun, D.; Han, G.; Li, X.; Hu, Q.; Shu, L. Velocity-free Localization of Autonomous Driverless Vehicles in Underground Intelligent Mines. IEEE Trans. Veh. Technol. (Early Access) 2020. [Google Scholar] [CrossRef]
- Dong, L.; Zou, W.; Li, X.; Shu, W.; Wang, Z. Collaborative localization method using analytical and iterative solutions for microseismic/acoustic emission sources in the rockmass structure for underground mining. Eng. Fract. Mech. 2018, 210, 95–112. [Google Scholar] [CrossRef]
- Shiotani, T.; Ohtsu, M.; Ikeda, K. Detection and evaluation of AE waves due to rock deformation. Constr. Build. Mater. 2001, 15, 235–246. [Google Scholar] [CrossRef]
- Aggelis, D.G.; Matikas, T.E.; Shiotani, T. Advanced acoustic techniques for health monitoring of concrete structures. In The Song’s Handbook of Concrete Durability; Kim, S., Ann, Y., Eds.; Middleton Publishing Inc.: West Sussex, UK, 2010; pp. 331–378. [Google Scholar]
- Aggelis, D.G. Classification of cracking mode in concrete by acoustic emission parameters. Mech. Res. Commun. 2011, 38, 153–157. [Google Scholar] [CrossRef]
- Man-cha, H.E. Feature evolution of dominant frequency components in acoustic emissions of instantaneous strain-type granitic rockburst simulation tests. Rock Soil Mech. 2015, 36, 1–8. [Google Scholar]
- Li, L.R.; Deng, J.H.; Zheng, L.; Liu, J.F. Dominant Frequency Characteristics of Acoustic Emissions in White Marble during Direct Tensile Tests. Rock Mech. Rock Eng. 2017, 50, 1337–1346. [Google Scholar] [CrossRef]
- Zhang, Z.; Deng, J.; Zhu, J.; Li, L. An Experimental Investigation of the Failure Mechanisms of Jointed and Intact Marble under Compression Based on Quantitative Analysis of Acoustic Emission Waveforms. Rock Mech. Rock Eng. 2018, 51, 2299–2307. [Google Scholar] [CrossRef]
- Wang, Y.; Deng, J.; Li, L.; Zhang, Z. Micro-failure Analysis of Direct and Flat Loading Brazilian Tensile Tests. Rock Mech. Rock Eng. 2019, 52, 4175–4187. [Google Scholar] [CrossRef]
- Zhang, Y.; Liang, P.; Sun, L.; Tian, B.; Yao, X. Spectral characteristics of acoustic emission in the process of saturated granite fracture under uniaxial compress. Rock Soil Mech. 2019, 40, 2497–2506. [Google Scholar]
- Zhang, Y.; Zhang, X.; Liang, P.; Cheng, S.; Sun, L.; Yao, X.; Liu, X.; Liang, J. Experimental research on time-frequency characteristics of AE P-wave and S-wave of granite under failure process. J. Rock Mech. Geotech. 2019, 38, 3554–3564. [Google Scholar]
- Ohno, K.; Ohtsu, M. Crack classification in concrete based on acoustic emission. Constr. Build. Mater. 2010, 24, 2339–2346. [Google Scholar] [CrossRef]
- Shahidan, S.; Pulin, R.; Bunnori, N.M.; Holford, K.M. Damage classification in reinforced concrete beam by acoustic emission signal analysis. Constr. Build. Mater. 2013, 45, 78–86. [Google Scholar] [CrossRef]
- Wang, M.; Tan, C.; Meng, J.; Yang, B.; Li, Y. Crack classification and evolution in anisotropic shale during cyclic loading tests by acoustic emission. J. Geophys. Eng. 2017, 14, 930–938. [Google Scholar] [CrossRef]
- Du, K.; Li, X.; Tao, M.; Wang, S. Experimental study on acoustic emission (AE) characteristics and crack classification during rock fracture in several basic lab tests. Int. J. Rock Mech. Min. 2020, 133, 104411, in press. [Google Scholar] [CrossRef]
- Liu, X.; Liu, Z.; Li, X.; Han, M.; Yang, L. Acoustic emission and micro-fracture characteristics of rocks under Brazilian splittingload. Chin. J. Eng. 2019, 41, 1422–1432. [Google Scholar]
- Hu, X.; Su, G.; Chen, G.; Mei, S.; Feng, X.; Mei, G.; Huang, X. Experiment on Rockburst Process of Borehole and Its Acoustic Emission Characteristics. Rock Mech. Rock Eng. 2019, 52, 783–802. [Google Scholar] [CrossRef]
- Zhang, Z.; Deng, J. A new method for determining the crack classification criterion in acoustic emission parameter analysis. Int. J. Rock Mech. Min. 2020, 130, 104323. [Google Scholar] [CrossRef]
- Zhang, P.; Yu, Q.; Li, L.; Xu, T.; Yang, T.; Zhu, W. The Radiation Energy of AE Sources with Different Tensile Angles and Implication for the Rock Failure Process. Pure Appl. Geophys. 2020, 177, 3407–3419. [Google Scholar] [CrossRef]
- Yamamoto, K.; Naoi, M.; Chen, Y.; Nishihara, K.; Yano, S.; Kawakata, H.; Akai, T.; Kurosawa, I.; Ishida, T. Moment tensor analysis of acoustic emissions induced by laboratory-based hydraulic fracturing in granite. Geophys. J. Int. 2019, 216, 1507–1516. [Google Scholar] [CrossRef]
- McLaskey, G.C.; Lockner, D.A. Shear failure of a granite pin traversing a sawcut fault. Int. J. Rock Mech. Min. 2018, 110, 97–110. [Google Scholar] [CrossRef]
- Zhang, X.; Zhang, Q. Distinction of Crack Nature in Brittle Rock-Like Materials: A Numerical Study Based on Moment Tensors. Rock Mech. Rock Eng. 2017, 50, 2837–2845. [Google Scholar] [CrossRef]
- Stierle, E.; Vavryčuk, V.; Kwiatek, G.; Charalampidou, E.C.; Bohnhoff, M. Seismic moment tensors of acoustic emissions recorded during laboratory rock deformation experiments: Sensitivity to attenuation and anisotropy. Geophys. J. Int. 2016, 205, 38–50. [Google Scholar] [CrossRef]
- Hampton, J.; Gutierrez, M.; Matzar, L.; Hu, D.; Frash, L. Acoustic emission characterization of microcracking in laboratory-scale hydraulic fracturing tests. J. Rock Mech. Geotech. 2018, 10, 805–817. [Google Scholar] [CrossRef]
- Liu, Q.; Liu, Q.; Pan, Y.; Liu, X.; Kong, X.; Deng, P. Microcracking Mechanism Analysis of Rock Failure in Diametral Compression Tests. J. Mater. Civil. Eng. 2018, 30, 10-1061. [Google Scholar] [CrossRef]
- Wong, L.N.Y.; Xiong, Q. A method for multiscale interpretation of fracture processes in Carrara marble specimen containing a single flaw under uniaxial compression. J. Geophys. Res. 2018, 123, 6459–6490. [Google Scholar] [CrossRef]
- Liu, J.; Li, Y.; Xu, S.; Xu, S.; Jin, C.; Liu, Z. Moment tensor analysis of acoustic emission for cracking mechanisms in rock with a pre-cut circular hole under uniaxial compression. Eng. Fract. Mech. 2015, 135, 206–218. [Google Scholar] [CrossRef]
- Ohtsu, M. Simplified moment tensor analysis and unified decomposition of acoustic emission source: Application to in situ hydrofracturing test. J. Geophys. Res. 1991, 96, 6211–6221. [Google Scholar] [CrossRef]
- Ohtsu, M.; Okamoto, T.; Yuyama, S. Moment tensor analysis of acoustic emission for cracking mechanisms in concrete. Struct. J. 1998, 95, 87–95. [Google Scholar]
- Zhao, Y.; Wang, Y.; Wang, W.; Tang, L.; Liu, Q.; Cheng, G. Modeling of rheological fracture behavior of rock cracks subjected to hydraulic pressure and far field stresses. Theor. Appl. Fract. Mec. 2019, 101, 59–66. [Google Scholar] [CrossRef]
- Zhao, Y.; Zhang, L.; Wang, W.; Tang, J.; Lin, H.; Wan, W. Transient pulse test and morphological analysis of single rock fractures. Int. J. Rock Mech. Min. 2017, 91, 139–154. [Google Scholar] [CrossRef]
- Vavryčuk, V. Seismic moment tensors in anisotropic media: A review. In Moment Tensor Solutions; D’Amico, S., Ed.; Springer Natural Hazards; Springer: Cham, Switzerland, 2018; pp. 29–54. [Google Scholar]
- Ma, J.; Dong, L.; Zhao, G.; Li, X. Discrimination of seismic sources in an underground mine using full waveform inversion. Int. J. Rock Mech. Min. 2018, 106, 213–222. [Google Scholar] [CrossRef]
- Dong, L.; Hu, Q.; Tong, X.; Liu, Y. Velocity-free MS/AE source location method for three-dimensional hole-containing structures. Engineering 2020, 6, 827–835. [Google Scholar] [CrossRef]


| Sample | Method | Stage A [%] | Stage B [%] | Stage C [%] | Stage D [%] | ||||
|---|---|---|---|---|---|---|---|---|---|
| Shear | Tensile | Shear | Tensile | Shear | Tensile | Shear | Tensile | ||
| Natural granite | AH | 4.34 | 95.66 | 0.95 | 99.05 | 0.80 | 99.20 | 10.44 | 89.56 |
| FAH | 2.28 | 97.72 | 0.27 | 99.73 | 0.64 | 99.36 | 13.11 | 86.89 | |
| Saturated granite | AH | 5.86 | 94.14 | 3.10 | 96.90 | 0.84 | 99.16 | 6.25 | 93.75 |
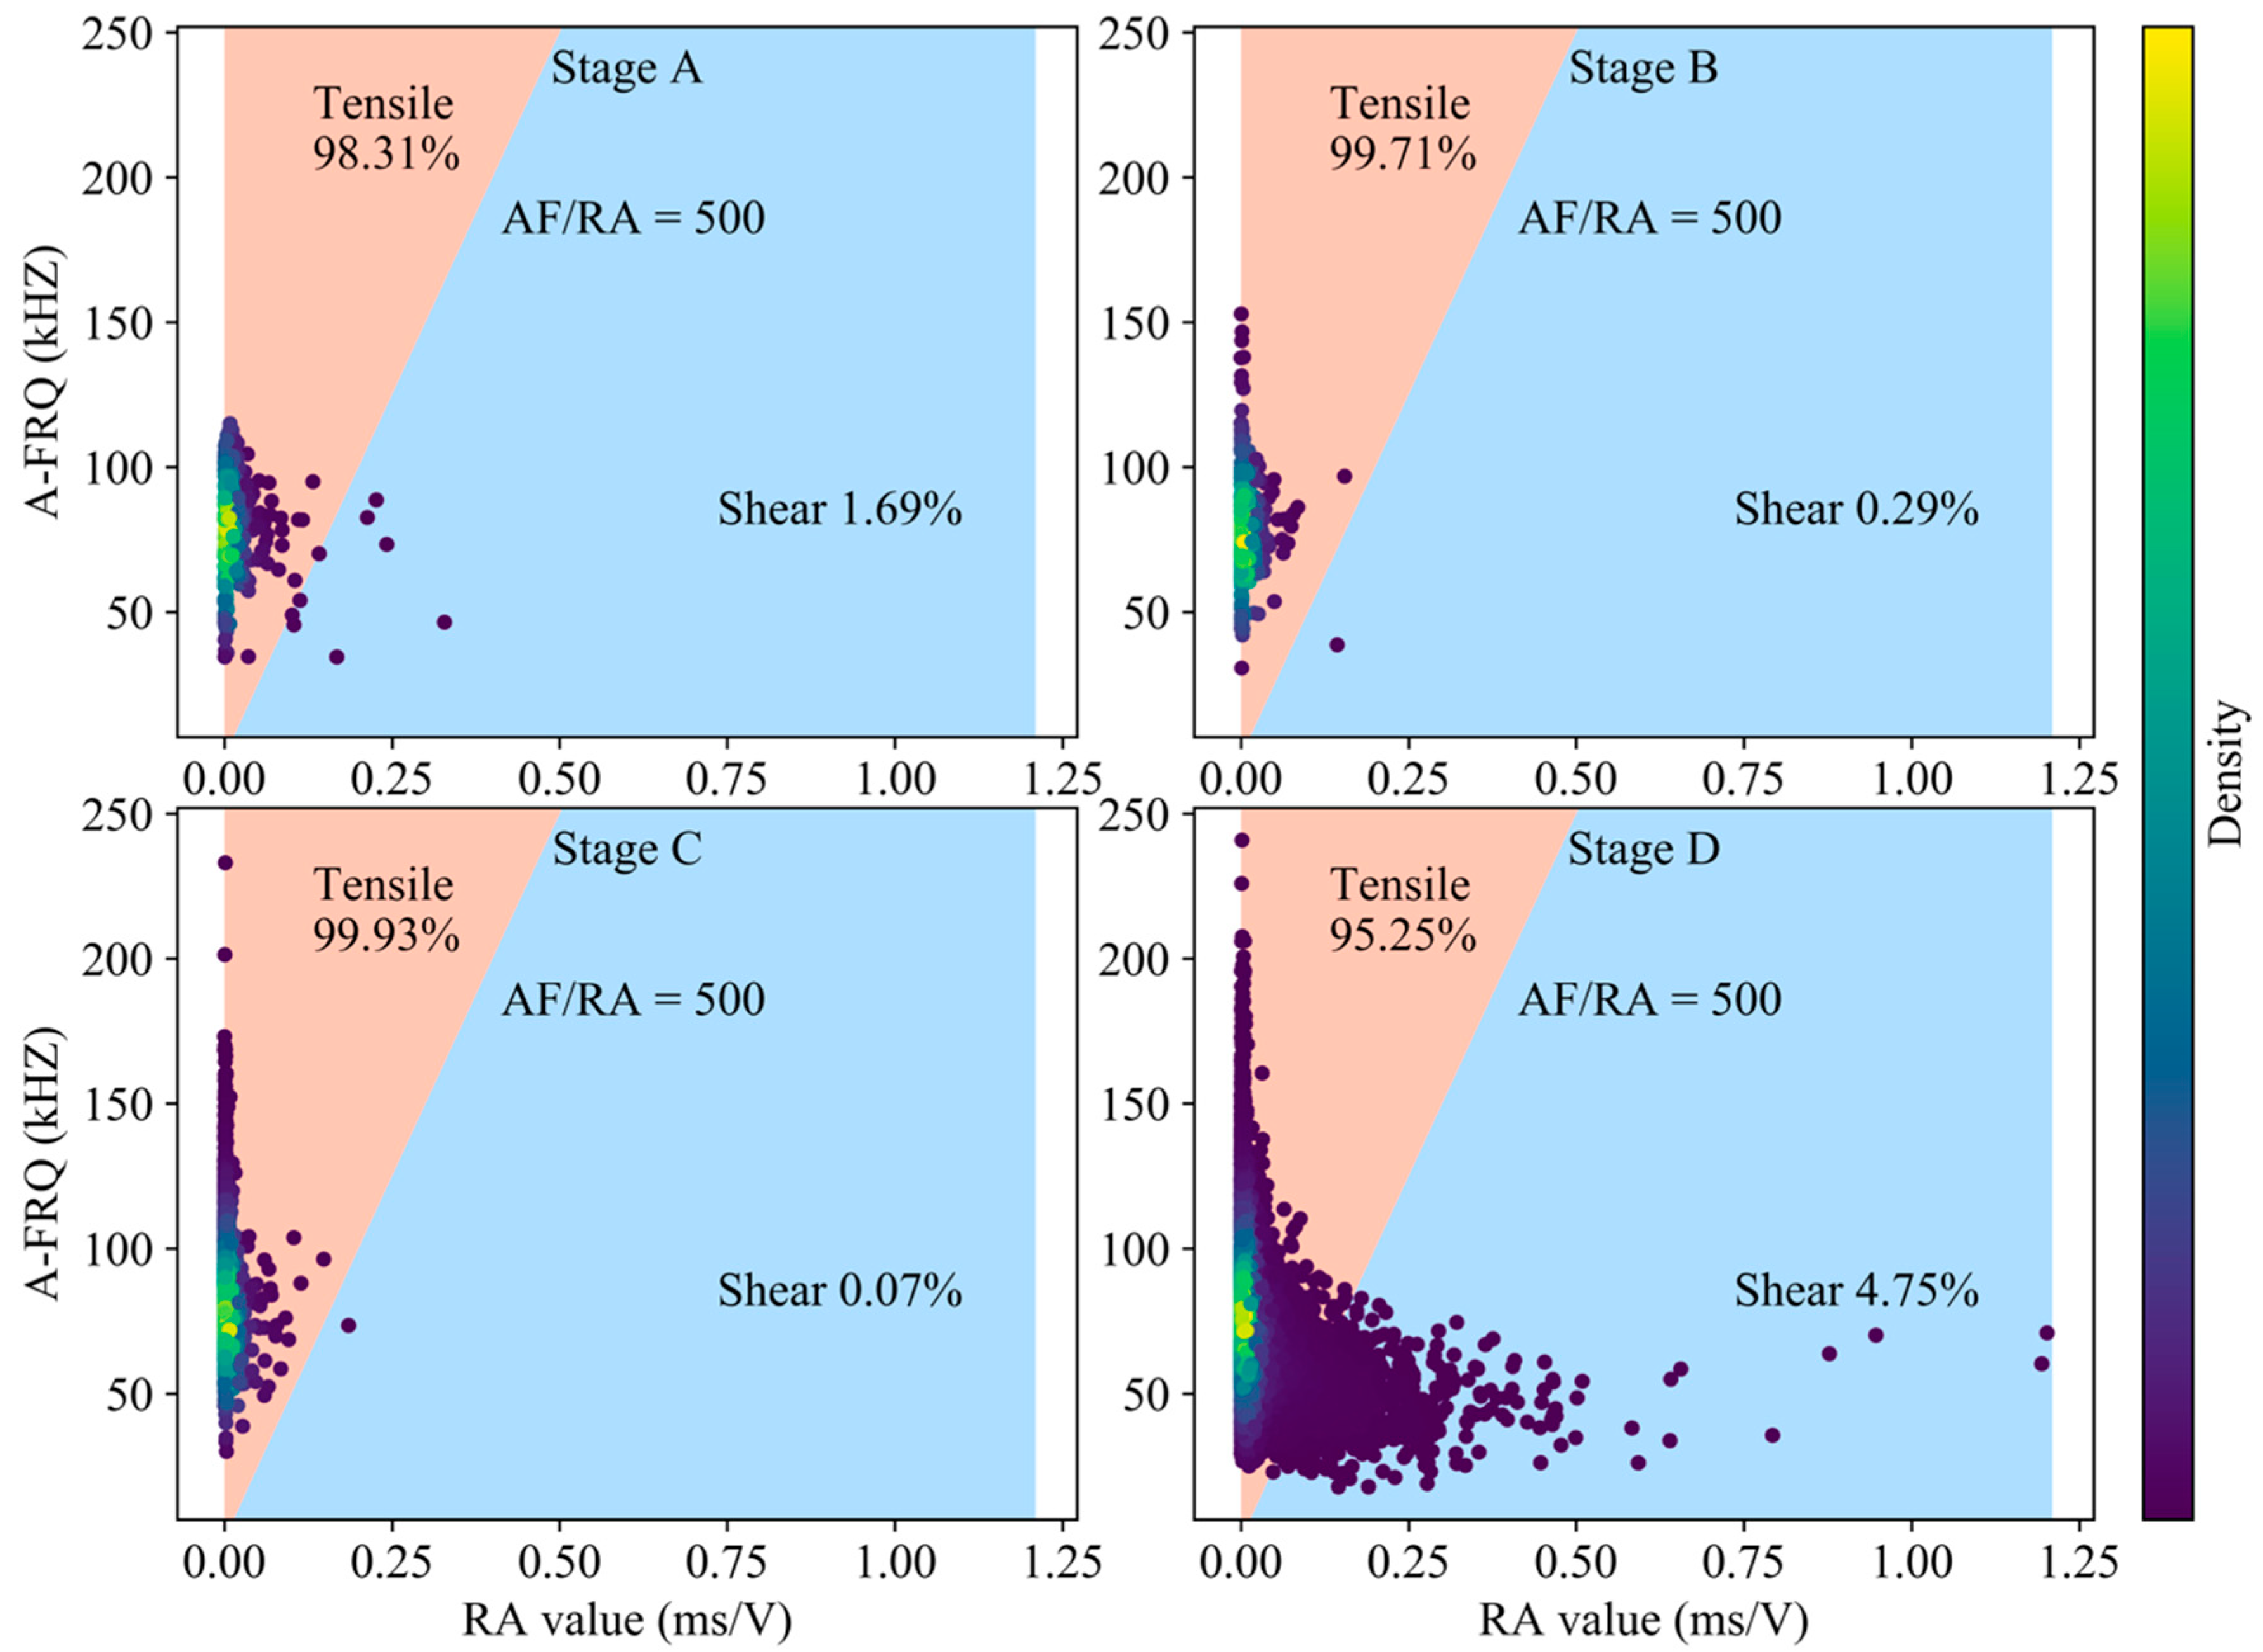
| FAH | 1.69 | 98.31 | 0.29 | 99.71 | 0.07 | 99.93 | 4.75 | 95.25 | |
| Stage A [%] | Stage B [%] | Stage C [%] | Stage D [%] | |
|---|---|---|---|---|
| DC Proportion > 60% | 2.81 | 2.30 | 5.05 | 6.94 |
| DC Proportion > 50% | 6.19 | 6.62 | 14.36 | 17.09 |
| DC Proportion > 40% | 23.63 | 26.51 | 32.57 | 36.64 |
| Stage A [%] | Stage B [%] | Stage C [%] | Stage D [%] | |
|---|---|---|---|---|
| Explosive dominated | 0.37 | 0 | 0.39 | 0.25 |
| Tensile dominated | 64.35 | 61.09 | 47.20 | 44.07 |
| Shear dominated | 3.75 | 6.05 | 10.50 | 14.55 |
| Compression dominated | 31.14 | 32.56 | 41.62 | 40.88 |
| Implosive dominated | 0.37 | 0.28 | 0.26 | 0.21 |
| Stage A [%] | Stage B [%] | Stage C [%] | Stage D [%] | |
|---|---|---|---|---|
| DC Proportion > 60% | 8.44 | 14.98 | 20.07 | 21.58 |
| DC Proportion > 50% | 21.20 | 28.81 | 37.96 | 37.51 |
| DC Proportion > 40% | 38.46 | 51.58 | 56.58 | 56.18 |
© 2020 by the authors. Licensee MDPI, Basel, Switzerland. This article is an open access article distributed under the terms and conditions of the Creative Commons Attribution (CC BY) license (http://creativecommons.org/licenses/by/4.0/).
Share and Cite
Dong, L.; Zhang, Y.; Ma, J. Micro-Crack Mechanism in the Fracture Evolution of Saturated Granite and Enlightenment to the Precursors of Instability. Sensors 2020, 20, 4595. https://doi.org/10.3390/s20164595
Dong L, Zhang Y, Ma J. Micro-Crack Mechanism in the Fracture Evolution of Saturated Granite and Enlightenment to the Precursors of Instability. Sensors. 2020; 20(16):4595. https://doi.org/10.3390/s20164595
Chicago/Turabian StyleDong, Longjun, Yihan Zhang, and Ju Ma. 2020. "Micro-Crack Mechanism in the Fracture Evolution of Saturated Granite and Enlightenment to the Precursors of Instability" Sensors 20, no. 16: 4595. https://doi.org/10.3390/s20164595
APA StyleDong, L., Zhang, Y., & Ma, J. (2020). Micro-Crack Mechanism in the Fracture Evolution of Saturated Granite and Enlightenment to the Precursors of Instability. Sensors, 20(16), 4595. https://doi.org/10.3390/s20164595