Abstract
Significant variation in impedance under a wide range of loads increases the difficulty of frequency tracking and vibration control in high-power piezoelectric systems (HPPSs). This paper proposed a wide operating range driving and control scheme for HPPSs. We systematically analyzed the impedance characteristics and deduced the load optimization frequency. In order to provide sufficient drive capability, the inverter combined with an LC matching circuit is configured. With the aid of a transformer ratio arm bridge (TRAB) combined with a proposed pulse-based phase detector (PBPD), the proposed scheme can control the vibration amplitude and keep parallel resonance status under a wide range of loads. Experiments conducted under actual operating conditions verify the feasibility of the proposed scheme under the modal resistance range from 7.40 to 500 Ω and the vibration range from 20% to 100%. Moreover, with the aid of a laser displacement sensor, our scheme is verified to have a vibration amplitude control accuracy better than 2% over a tenfold load variation. This research could be helpful for the driving and control of HPPSs operating in a wide range.
1. Introduction
High-power piezoelectric systems (HPPSs) are used in a large range of applications, such as ultrasonic welding, cutting and actuators [,,,]. In high-power situations, it is crucial to effectively convert the electrical energy into the mechanical vibration in the piezoelectric transducers (PTs) [,,,]. Generally, researchers excite PTs at their mechanical resonance frequency, that is, the series resonance frequency (), where the minimum excitation voltage is required [,]. However, as the vibration amplitude increases, an additional loss near degrades the performance of the PTs in high power [,]. It is attributed to the dielectric loss which is related to the input current in HPPSs []. Therefore, exciting the PTs at the parallel resonance frequency () with the minimum excitation current can achieve the optimal efficiency. For the HPPSs operating under high vibration amplitude, high excitation voltage is required at []. However, different materials and processes result in wide range of loads in some ultrasonic machining, such as welding and cutting [,]. The load increases the required excitation voltage, leading to the risk of electrical breakdown. Therefore, avoiding the excessive rise up of excitation voltage under high load conditions becomes a challenge for HPPSs. Meanwhile, the wide range of loads has a significant impact on the impedance characteristics, leading to another challenge in providing sufficient drive capability over the operating range.
In most ultrasonic systems, piezoelectric transducers (PTs) need to be excited in the resonant mode [,]. Besides, different vibration amplitudes are required for different processing materials [,]. For the PT working at light loading conditions, the excitation voltage and current are almost in phase at and , while the impedance reaches the minimum and maximum near and , respectively []. Therefore, the working frequency can be tracked by a phase locking loop (PLL) or impedance extremum search []. Meanwhile, the vibration amplitude can be controlled through current and voltage driving modes at and , respectively [,]. However, as the load increases, two pairs of zero phase frequencies and the impedance extreme frequencies gradually deviate from and []. In order to enlarge the operating load range, schemes based on the impedance or admittance calculation are proposed, such as the maximum target impedance scheme and the admittance circle tracking scheme [,]. However, these schemes require complicated software operations to calculate the frequency deviation and the vibration amplitude. With the aid of a transformer ratio arm bridge (TRAB), a vibration amplitude signal is obtained online in an ultrasonic motor control scheme under different operating conditions []. Moreover, this signal is in phase with the excitation current at , so the parallel resonance detection can be achieved by detecting the phase between the vibration and the excitation current signals. However, the excitation current can be extremely discontinuous and harmonic-rich in the HPPSs over a wide operating range, leading to a new challenge for phase detection.
In order to drive the HPPSs at load optimization frequency under a wide range of loads with controllable vibration amplitudes, a driving and control scheme is proposed in this paper. We first analyze the impact of different loads on the impedance characteristics, and propose the load optimization frequency tracking mode. Second, in order to provide the sufficient drive capability, the effect of the inverter combined with an LC matching circuit is analyzed under different operating conditions. Then, the pulse-based phase detector (PBPD) is proposed to overcome the challenge of phase detection over a wide operating range. Finally, the proposed scheme is verified under actual operating conditions in terms of the frequency tracking and vibration control.
2. Electrical Architecture
2.1. Equivalent Models
An HPPS can be characterized by electromechanical models (A and B) deduced from an electrical model, as shown in Figure 1 [].

Figure 1.
Electrical and Electromechanical models of high-power piezoelectric systems (HPPSs).
In the electromechanical models, the dielectric property is characterized by and . For model A, which is similar to the classic Butterworth-Van Dyke (BVD) model [,], the series , and characterize the modal damping, mass and stiffness, respectively. Under the steady state of sinusoidal excitation, the model A can be converted to the model B []. In this model, the parameters can be calculated by
where
In this paper, some electrical characteristics under sinusoidal excitation can be expressed in complex vectors form written in bold letters, such as
where is the partial voltage of the parallel RLC part, and and are the excitation voltage and current of the transducer, respectively. Here, is defined as the impedance of the parallel RLC part, which satisfies the relationship
Then, we define to be the phase angle of , that is, the phase between and . Therefore, it can be inferred that at without the influence of because the parallel RLC part resonates at according to
Moreover, when comparing with the electrical model, it can be noted that the partial voltage in the model B corresponds to the piezoelectric voltage in the electrical model, which is proportional to the vibration amplitude []. Therefore, can be used for vibration and parallel resonance detection without additional calculation.
In this paper, we use a DUKANE 20 kHz 3300 W piezoelectric transducer, a 1:1.5 transducer amplitude transformer, and a φ70 mm plastic welding horn to construct a typical HPPS used for ultrasonic welding. The parameters of the HPPS are shown in Table 1. It should be noted that, in actual operating conditions, increases from 7.40 Ω under no load condition to 200~500 Ω under high load conditions.

Table 1.
Parameters of the BVD model for the HPPS.
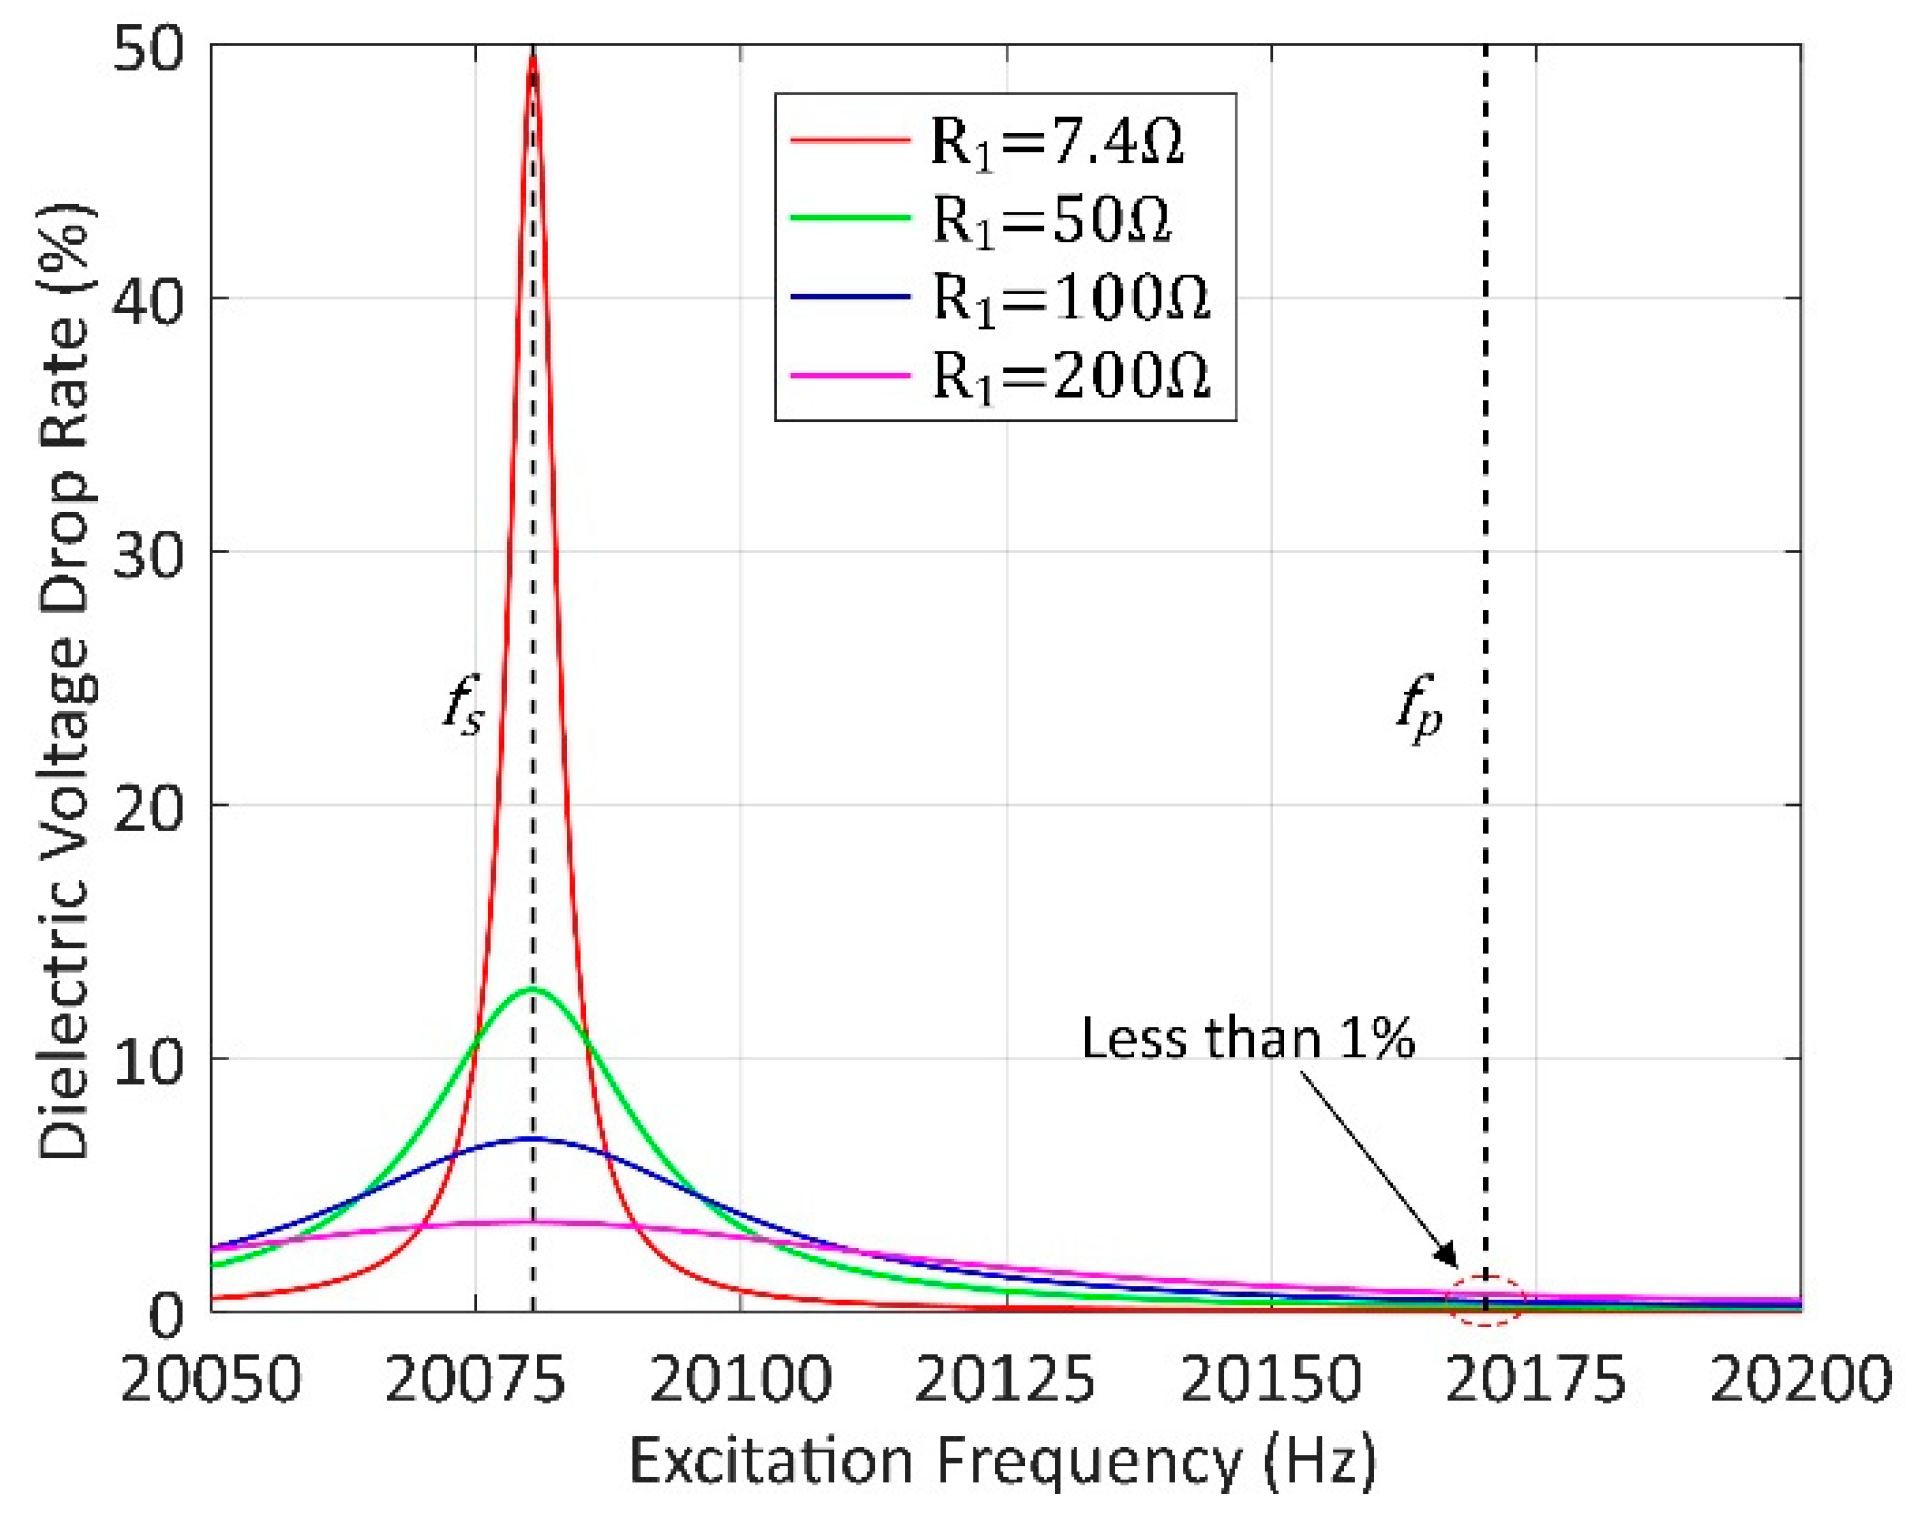
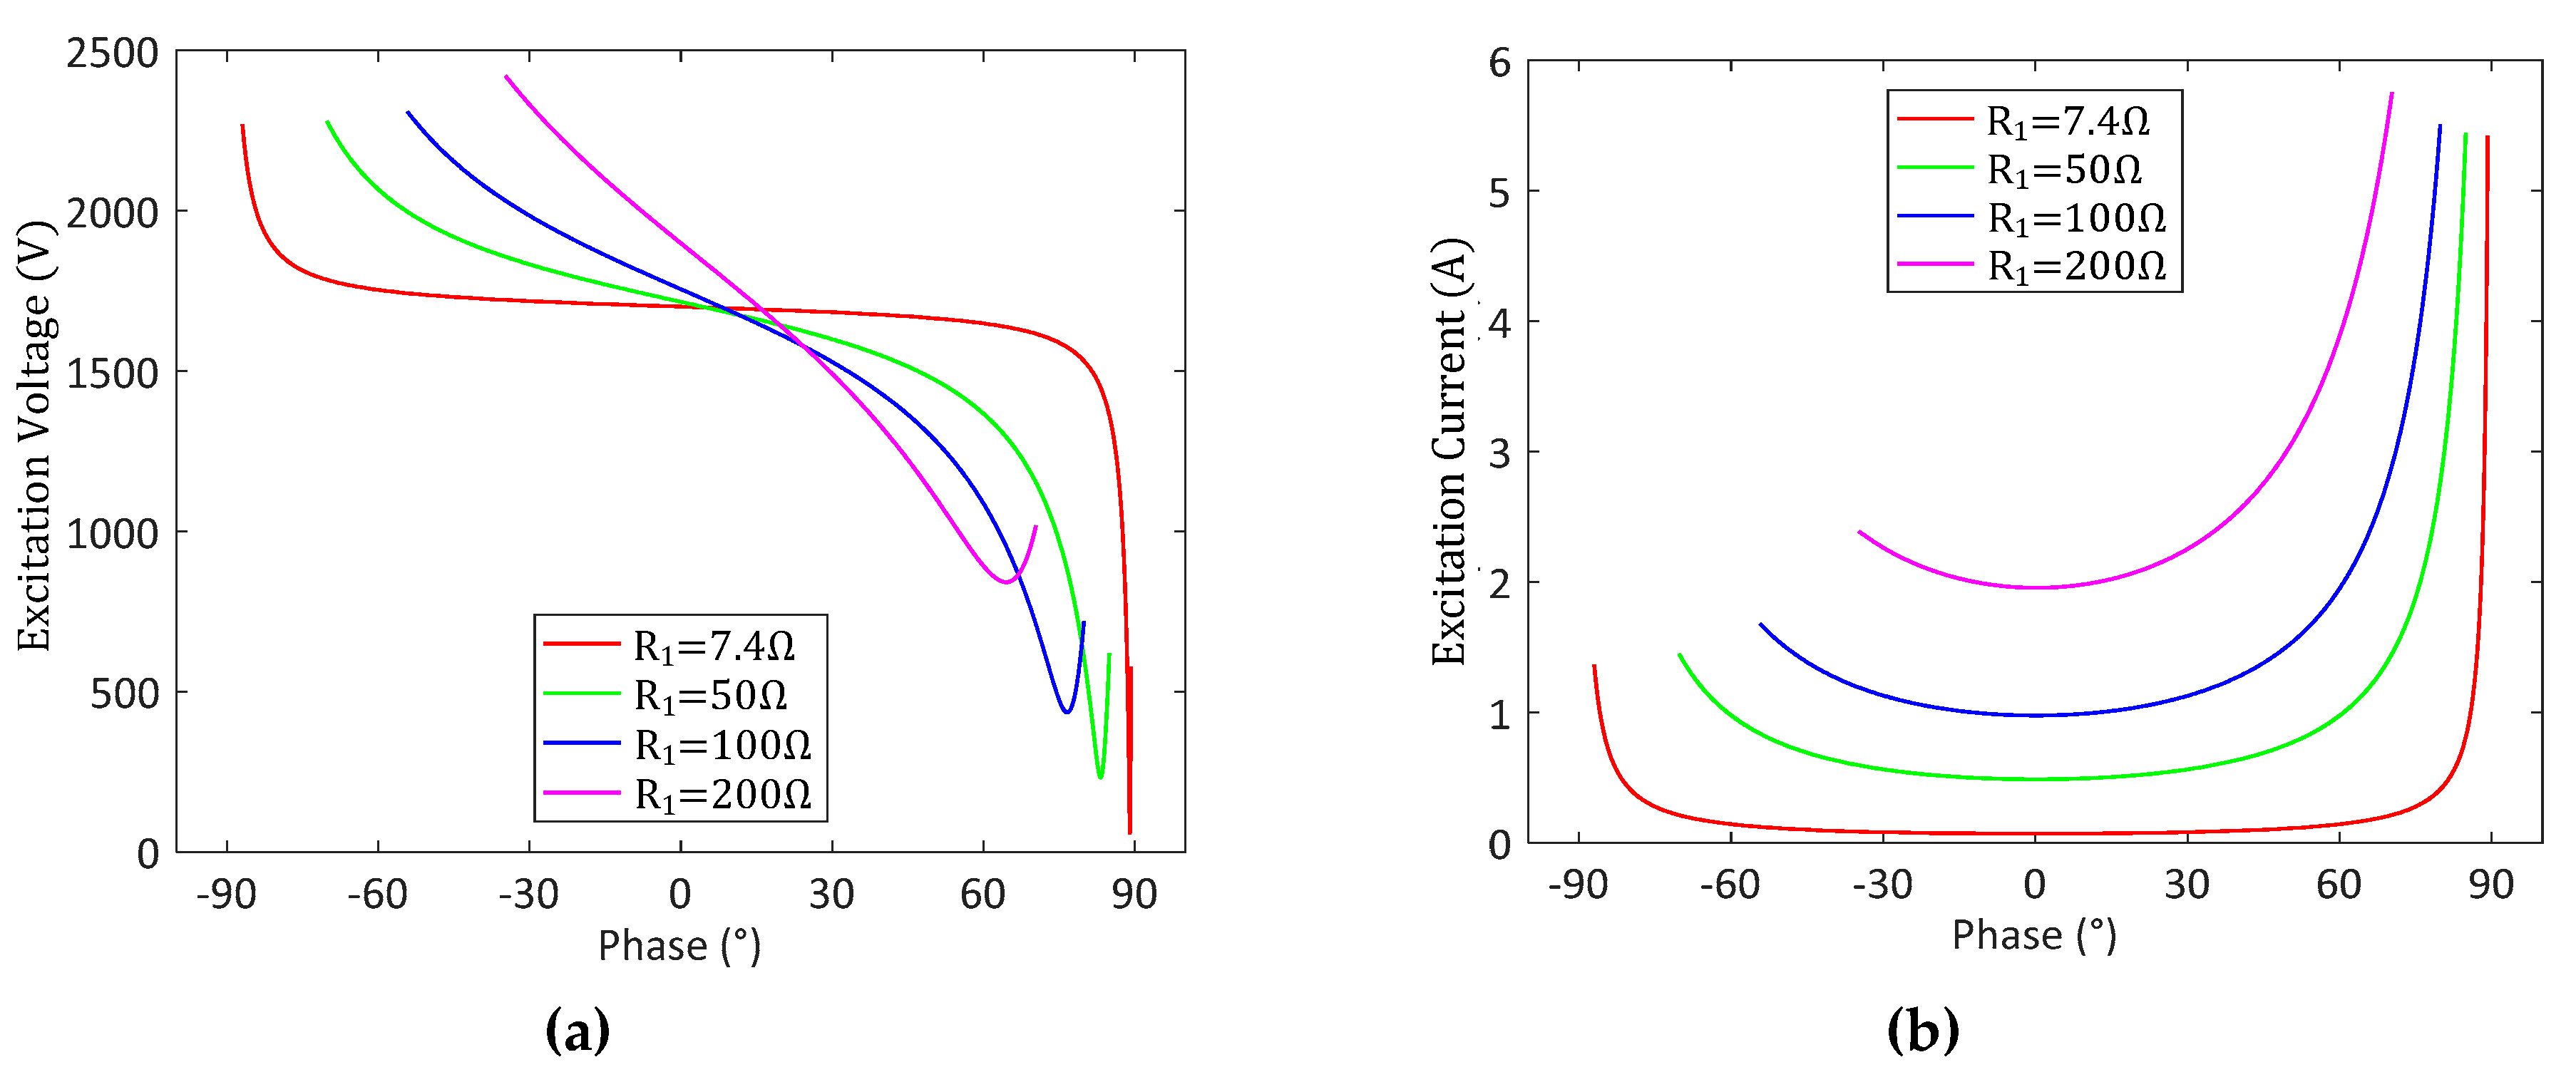
2.2. Impedance Characteristics Analysis
To analyze the influence of wide range of loads in an HPPS, the variations in and are calculated under a constant vibration. First, we set to be a typical value 1700 V, and can be calculated as
Then, is deduced to be
Therefore, the variations in and under different excitation frequencies are calculated and demonstrated in Figure 2a,b, respectively, in which is taken as four different typical values of 7.4, 50, 100 and 200 Ω. This analysis shows that increases linearly while increases slightly at as increases. Therefore, it can be inferred that the wide range of loads leads to an equal variation range of at . Furthermore, the current variation range is further expanded to over a hundred times when the vibration amplitude is controlled from 20% to 100% in our system.

Figure 2.
Variations in excitation voltage (a) and current (b) under the same vibration amplitude.
Moreover, we analyze the influence of from the perspective of the dielectric voltage drop rate calculated as , as shown in Figure 3. It shows that has the greatest impact at , especially under light load conditions. However, the dielectric voltage drop rate decreases to less than 1% near . Therefore, the influence of on the impedance characteristics can be ignored in our scheme.

Figure 3.
Dielectric voltage drop rate under different frequencies and loads.
Further, we analyze the variations of and near from the perspective of the phase under the constant vibration amplitude ( equals to 1700 V), as shown in Figure 4a,b, respectively. The relationships of and are deduced as

Figure 4.
Variations in excitation voltage (a) and current (b) under different phase .
The curves of shows that increases with at , and decreases with a slope positively related to . as increases. Meanwhile, it shows that is very close to the minimum near the zero phase due to the inverse relationship with . The analysis above suggests that slight phase difference has little influence on the impedance characteristics. Especially, an appropriate phase difference, such as 20°, can prevent the rise of under high load conditions with a negligible rise of . Therefore, we suggest the load optimization frequency to be slightly lower than with near 20° in our typical HPPS.
3. Proposed Driving Scheme
3.1. Electrical Architecture
The proposed scheme contains a rectifier bridge, a full-bridge inverter, an LC matching circuit and a transformer, as shown in Figure 5.

Figure 5.
Electrical architecture of the proposed scheme.
The commercial power (220 V 50 Hz) is rectified into the DC power , and then inverted to the AC power in ultrasonic frequency. A series LC matching circuit is used for DC isolating and harmonic filtering. More importantly, the specific configuration of and is also related to impedance matching and vibration excitation, which are analyzed in the next sector. Since a transformer ratio arm bridge (TRAB) is easy to be intergraded with little impact on the electrical circuit [], it is adopted to detect the partial voltage online. A tap is drawn from the secondary side of the transformer with the coil turns satisfying , and a detection capacitor is connected into the circuit, which satisfies
Therefore, the bridge voltage, that is, the transformer tap voltage satisfies the relationship
In the proposed scheme, we configure , , and according to the analysis above.
3.2. Electrical Properties
Under the driving of the gate signals, the inverter continuously changes the switching state, as shown in Figure 6. The input current to the HPPS rises up in the conduction zones and falls down in the freewheeling zones, then becomes zero and the inverter enters high resistance zones. As the duty cycle of the gate signals increases, the conduction zones become wider, leading to the increase in the vibration amplitude. However, the situation is much different under different .

Figure 6.
Typical waveforms of the proposed scheme.
In order to analyze the electrical properties under the steady state near , the electric architecture is simplified by equivalent transformation, as shown in Figure 7, leading to
where is the transformer ratio. , and are the matching inductance, matching capacitance and DC voltage after transformation, respectively. We also define as the sum voltage of and .

Figure 7.
Equivalent electrical circuit of the proposed scheme.
First, we analyze the situations with low duty cycle . Under these conditions, is always small, leading to negligible . Therefore, in the conduction zones, there exists
while there exists
in the freewheel zones. and other related waveforms are shown in Figure 6. Since only the fundamental wave can excite the modal vibration, we use the Fourier series to extract it in to consider as the excitation current of the HPPS, which can be calculated as
When we define to be in phase with , and should also be in phase. Therefore, the first term in Equation (15) equals to zero. On the other hand, the conduction and freewheeling zones are concentrated near the peak of . Therefore, Equation (15) can be approximated as
By consideration of Equations (13), (14) and (16), it can be deduced that
where and correspond to the effects of the conduction zones and the freewheeling zones, respectively, deduced as
According to at , the relationship between and can be derived as
where
Therefore, is inversely proportional to under the same load and duty cycle.
For the conditions where the inverter is driven with high duty cycle , the capacitor voltage is considerable, leading to Equations (21) and (22) in the conduction zones and freewheel zones, respectively. This mechanism leads to the heaping of the current waveform, as shown in Figure 6, which greatly increases the excitation current to the HPPS. Although it is difficult to analyze the current waveform further, the behavior of the inverter can be analyzed from the perspective of the input voltage under these situations. The conduction zones gradually dominate in the waveform of , approaching to a bidirectional pulse wave with increasing , as shown in Figure 8.

Figure 8.
Waveforms of the input voltage and the corresponding bidirectional pulse under high duty cycle.
Here, it is important to configure LC matching circuit to offset the capacitive reactance of and make the circuit purely resistive at , satisfying
Therefore, it can be noted that the partial voltage is equal to fundamental wave of the output voltage of the inverter under the matching condition above, satisfying
This relationship suggests that the scheme can excite to the maximum value of without being affected by the load.
Due to the analyzed above, we configure and . Here, we use MATLAB/Simulink (MathWorks, Natick, MA, USA, 2017b) to simulate the relationship among , and , as shown in Figure 9. It shows that increases smoothly with under different loads. This result verifies the drive capability of our scheme under a wide range of loads with adjustable vibration amplitude.

Figure 9.
Simulation result of vibration amplitude under different loads and duty cycle.
4. Detection and Control
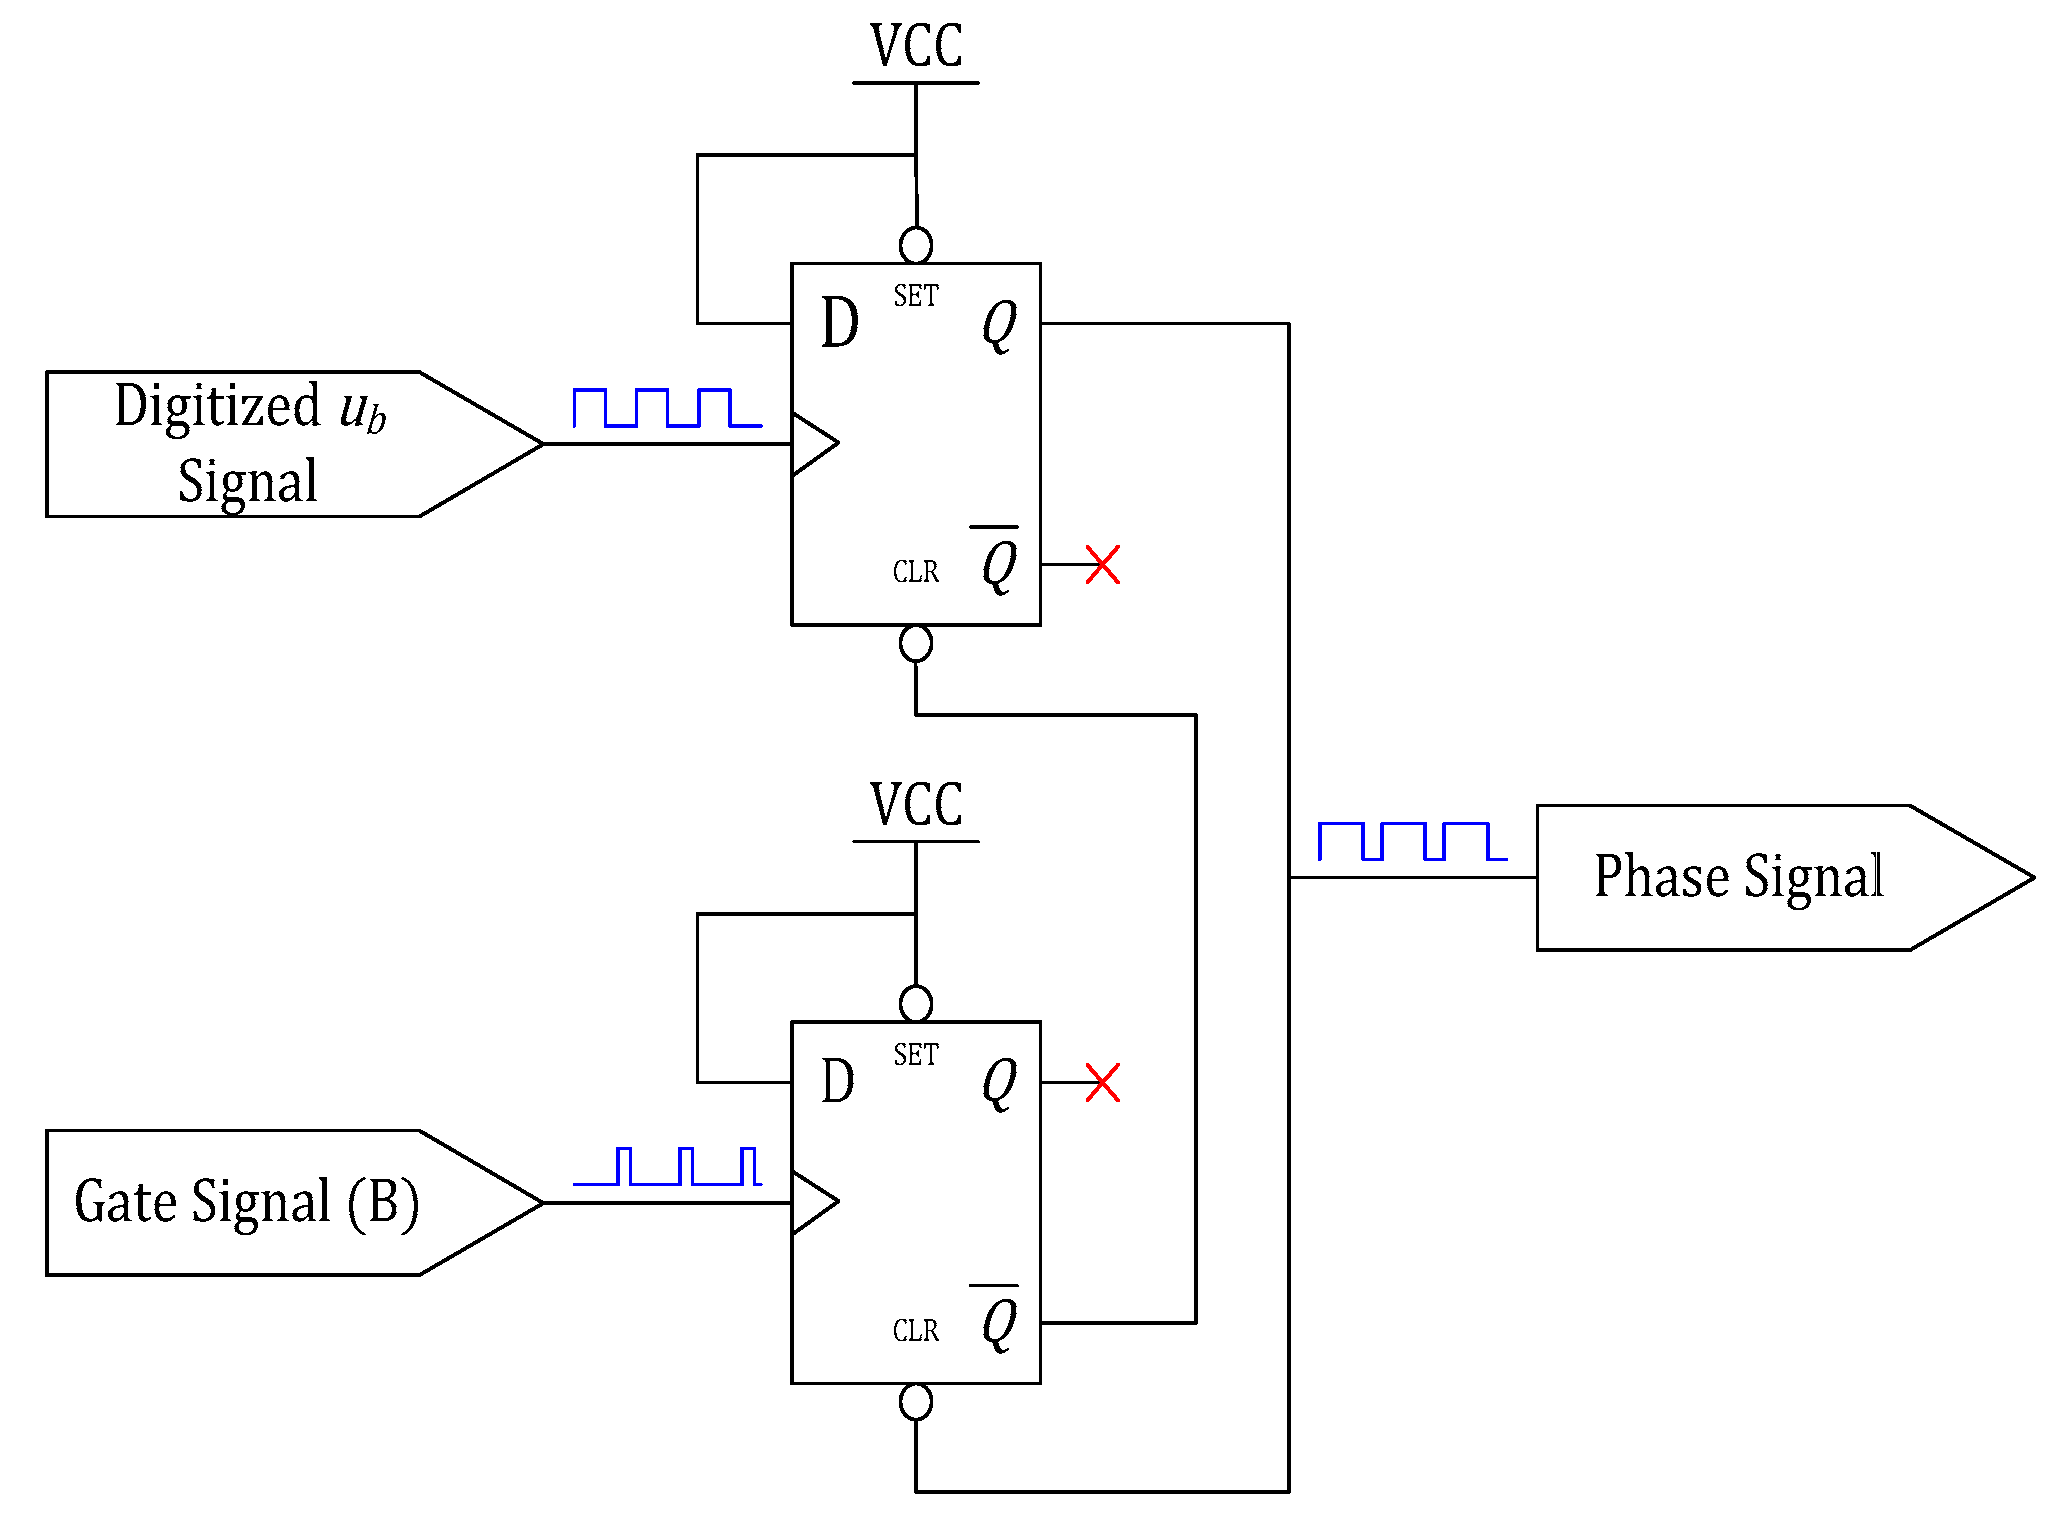
4.1. Pulse Based Phase Detector
In order to maintain constant vibration amplitude and keep operating near , the amplitude of and its phase with need to be detected. Owing to the TRAB integrated in our scheme, is extracted via the signal , which is strong and pure under most conditions. Therefore, it can be reliably digitized through the zero-crossing comparator after squelch. Meanwhile, is detected by a feed-through current transformer. However, filtering and digitizing is difficult due to the discontinuous and harmonic-rich in the large variation range.
In this scheme, a pulse-based phase detector (PBPD) is proposed. Since the input current almost occurs in the conduction zones, a PWM gate signal is used instead of the . A classical digital phase detector based on D flip-flops is adopted to generate a phase detection signal. The timing diagram of the relevant signals and the phase detector circuit are shown in Figure 10 and Figure 11, respectively.

Figure 10.
Timing diagram of the relevant signals of pulse-based phase detector (PBPD).

Figure 11.
Structure of the D flip-flops-based detector.
In the proposed scheme, we use the gate signal B but not A to avoid the potential competitive risk, and define the pulse center to be 270°. Therefore, the phase can be calculated though the relationship
where and are the pulse width and the cycle of the phase signal, respectively. Affected by the variation in the current waveform under different conditions, the phase obtained by PBPD has a small deviation, which will be further analyzed in the experiment.
This signal is also used in the detection of , which triggers a peak sampling timer on the rising edge, as shown in Figure 10.
4.2. Control Realization
Due to the perturbation of and variation of load, a vibration close loop is needed in the proposed scheme. As is deduced to be in positive correlation to , the control logic is established as
where is the feedback parameter, is the vibration target voltage, and is the proportional control parameter in the vibration amplitude controller.
Moreover, due to the change of temperature and the coupling stiffness caused by the loads, a frequency closed loop needs to be executed in parallel with the vibration close loop. Since is inversely related to frequency and equal to zero at , the control logic is established as
where is the proportional control parameter in the frequency controller.
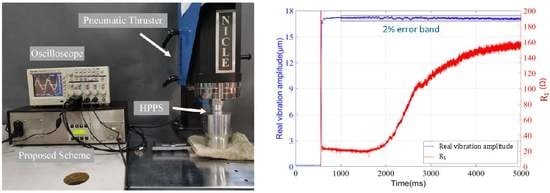
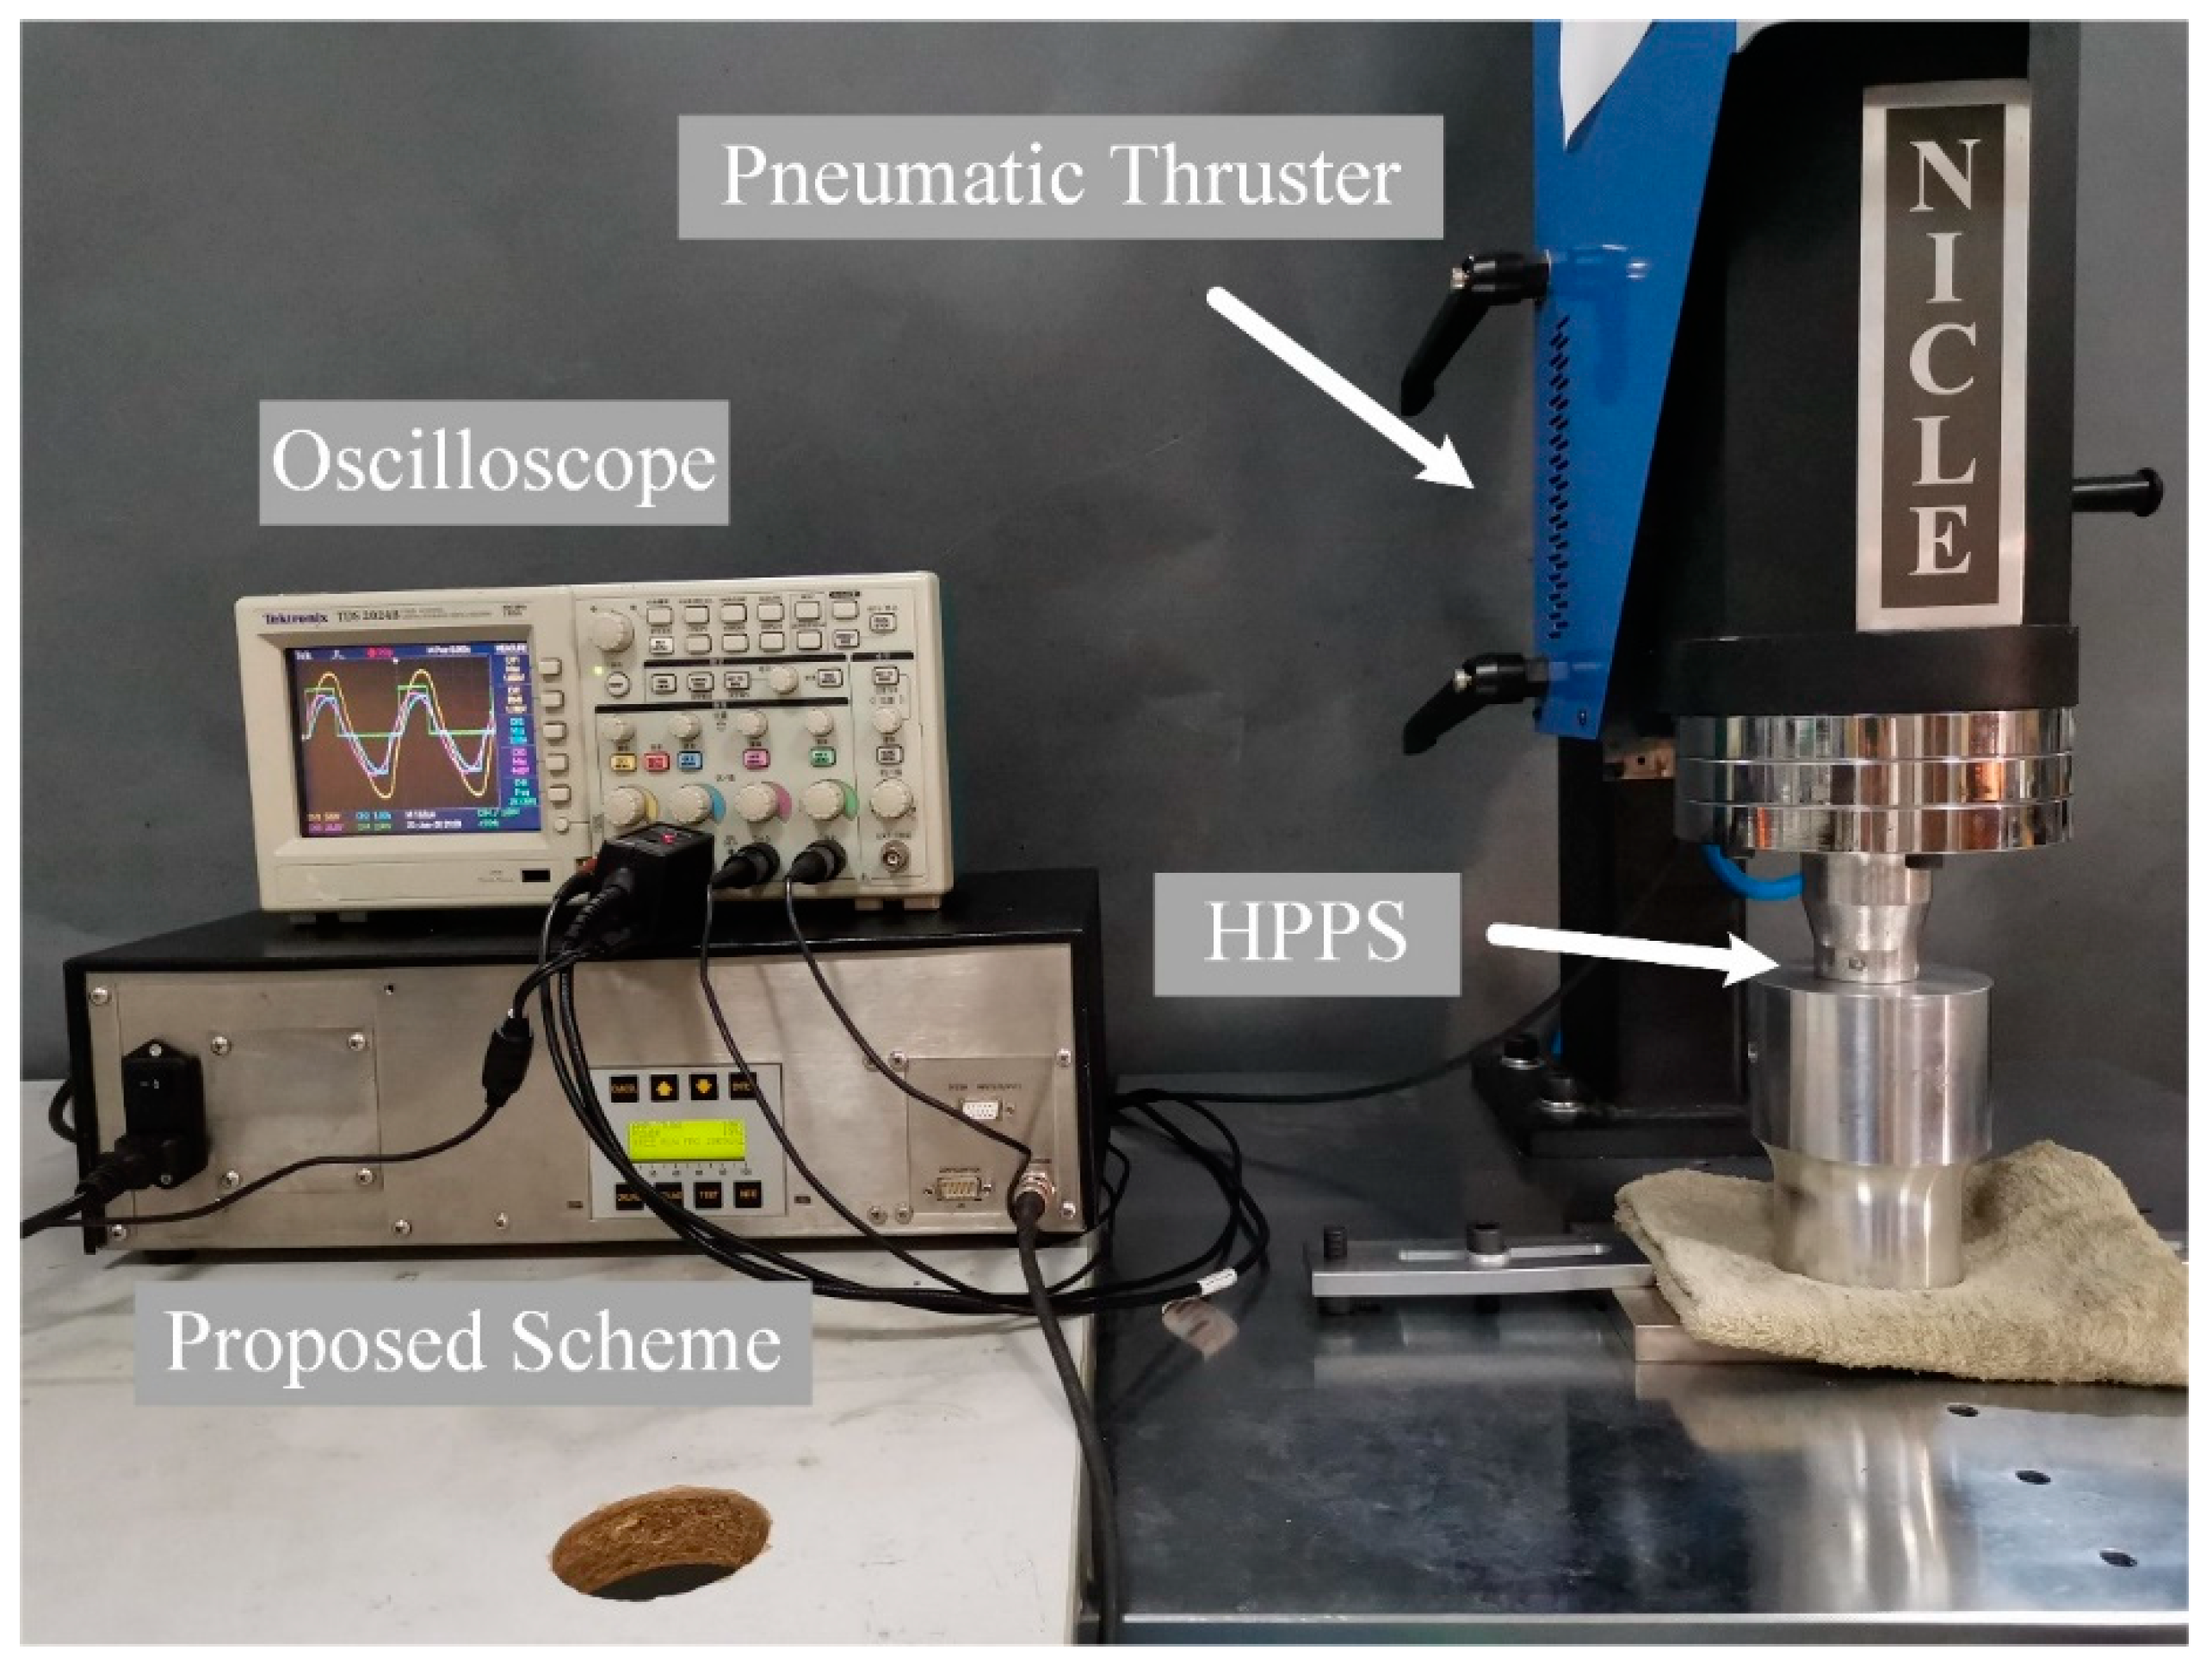
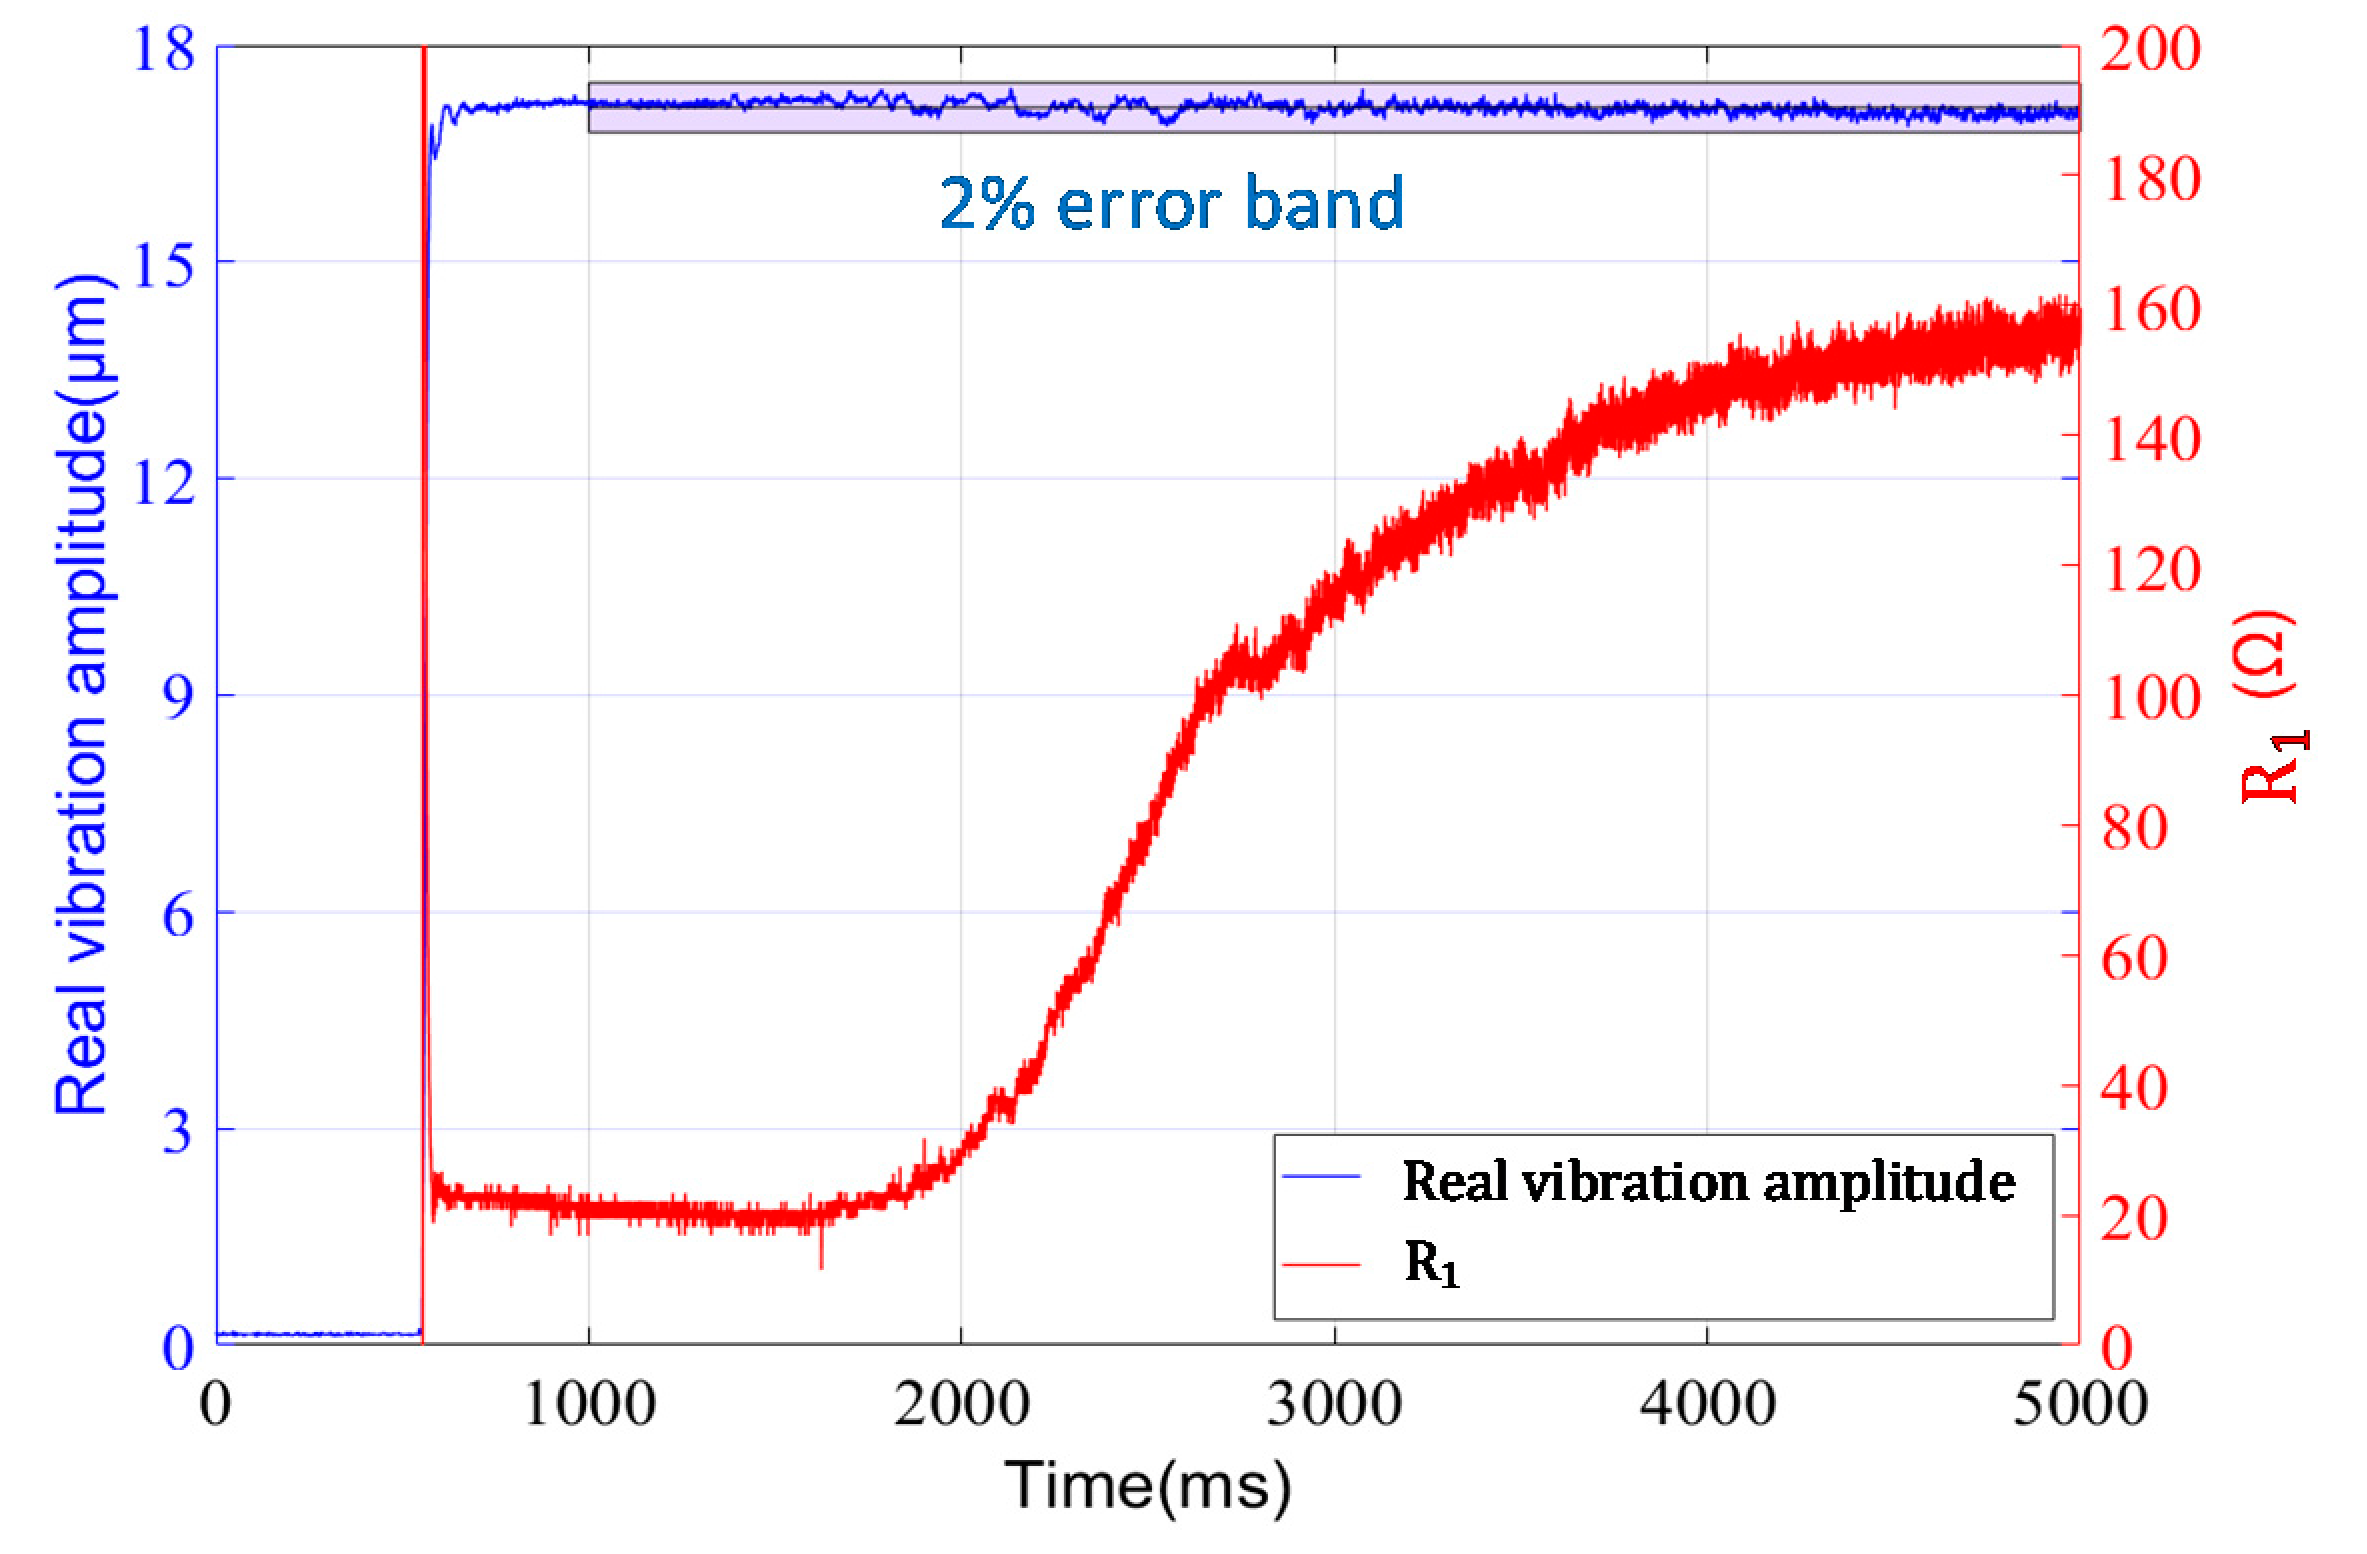
5. Experimental Results
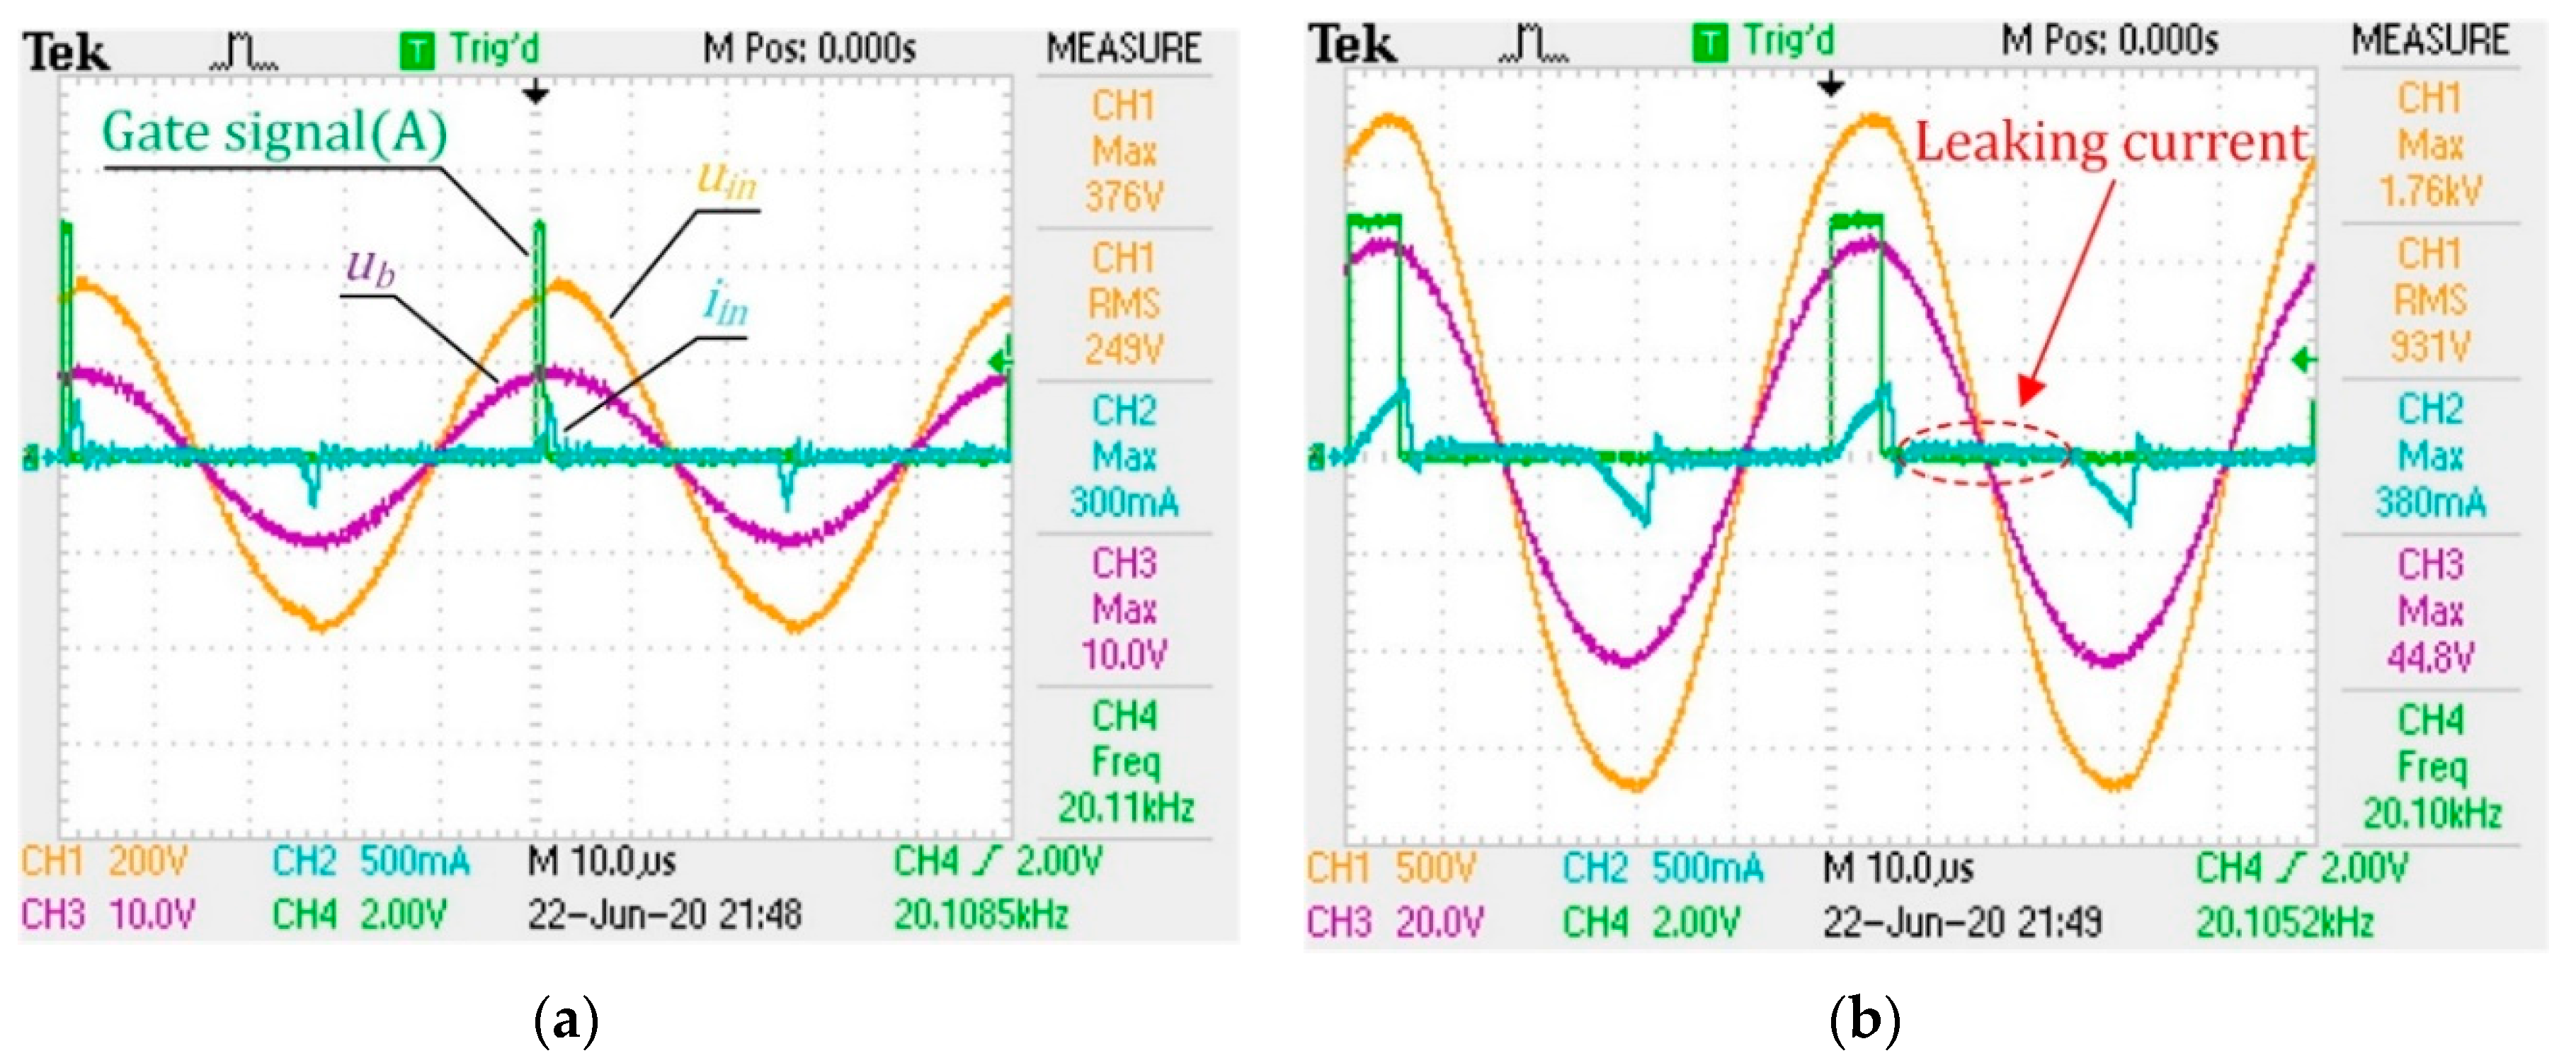
5.1. Frequency Tracking Verification
The experimental setup is demonstrated in Figure 12. Here, the HPPS is fixed on a pneumatic thruster and pressed against a damp cloth. We apply different loads to the HPPS by adjusting the cylinder pressure of the thruster. Meanwhile, the waveforms of , , and the gate signal A are measured by a Tektronix TDS 2024B oscilloscope, and the waveforms of four extreme operating conditions are shown in Figure 13. Here, 100% controlled vibration amplitude corresponds to about 1700 V of . The sampling period of the oscilloscope is 0.04 μs in the experiments, and the accuracy is 0.04 per division for each channel. This result shows that the center of the pulse coincides with the peak of , indicating that the frequency tracking meets the design. Meanwhile, the current waveforms are basically consistent with the analysis. The difference is caused by a weak leaking current in the high-resistance region, which may be attributed to the influence of the parasitic capacitance of the IGBT modules in the inverter.

Figure 12.
Experimental setup of frequency tracking verification.


Figure 13.
Waveforms of extreme operating conditions: (a) equals 7.40 Ω under 20% vibration amplitude; (b) equals 7.40 Ω under 100% vibration amplitude; (c) equals 500 Ω under 20% vibration amplitude; (d) equals 200 Ω under 100% vibration amplitude.
Further, we perform Fourier transform to extract the fundamental wave of , and the actual is calculated and demonstrated in Figure 14. This result shows that the phase difference is about 15°~25° under most operating conditions but relatively large under no load conditions ( equals to 7.40 Ω). It is inferred that the load optimization frequency is slightly lower than with near 20° in Section 2.2. The experiment result verifies this inference in which the actual excitation peak voltage is 1.76, 1.58, 1.58 and 1.62 kV when equals to 7.40, 50, 100 and 200 Ω, respectively.

Figure 14.
Phase deviation under different loads and vibration amplitudes.
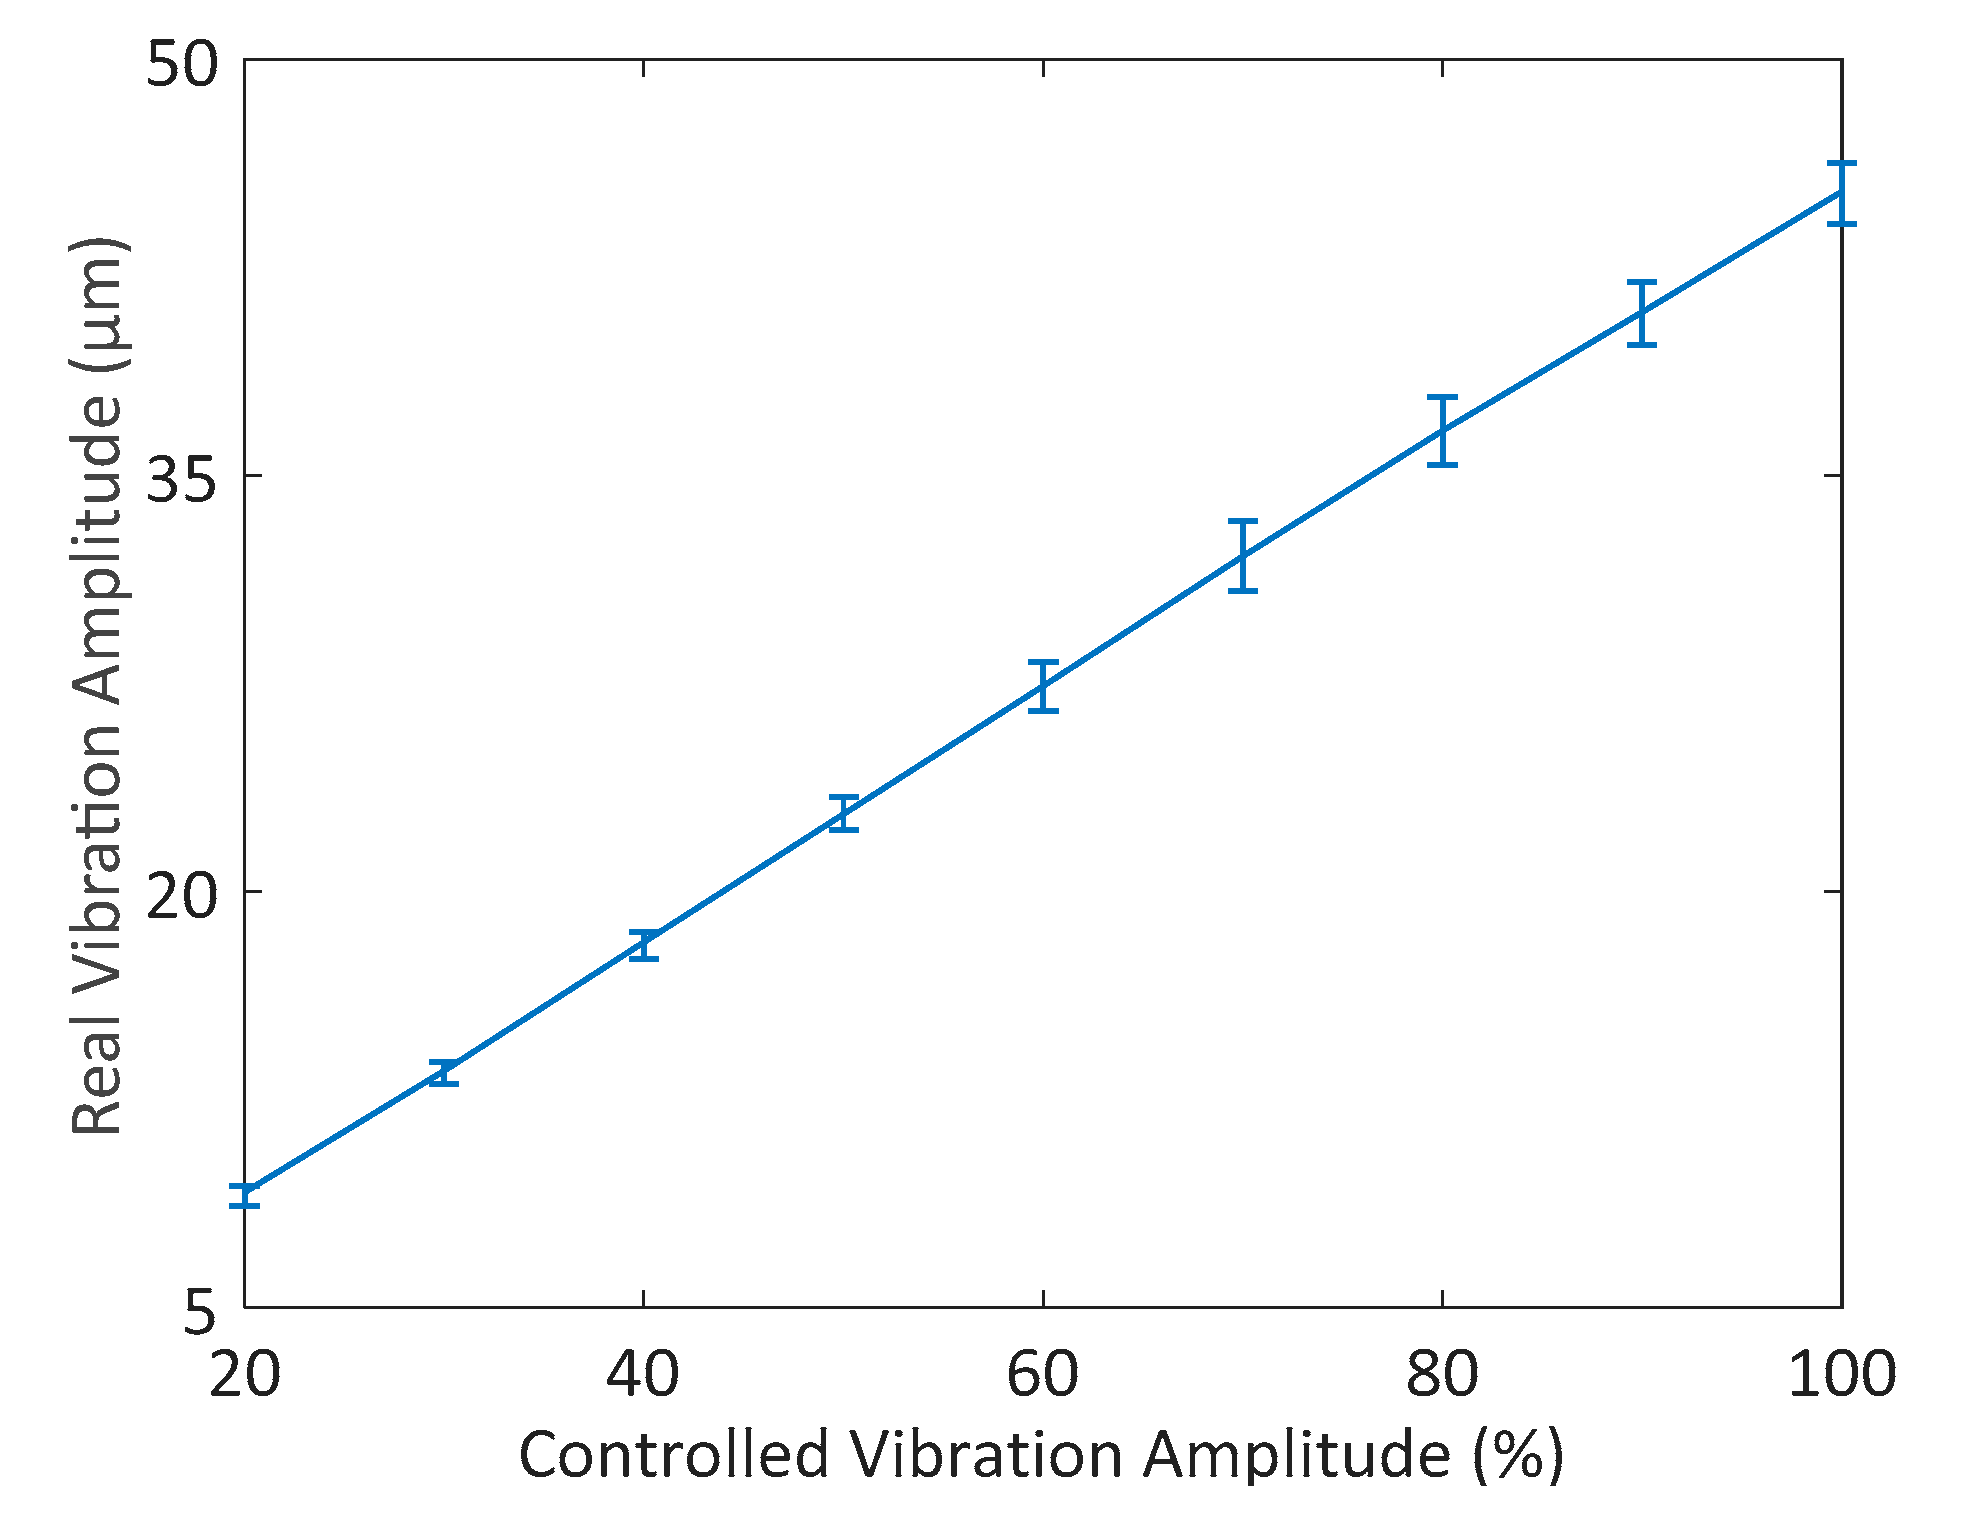
5.2. Vibration Control Verification
In this experiment, the vibration is tracked in different amplitudes by the proposed scheme and the actual vibration amplitude is measured by a KEYENCE LK-H008 laser displacement sensor. The measurement setup is shown in Figure 15. Each measurement is repeated five times, as shown in Figure 16. The result shows the linear relationship between our controlled vibration amplitude and the actual vibration amplitude. It verifies the reliability of our scheme in vibration control, which can be suitable for different processes.

Figure 15.
Experimental setup of vibration control verification.

Figure 16.
Real vibration amplitude under different control targets.
5.3. Vibration Stability under Variable Load
In order to verify the stability of vibration control in varying load condition, we set target vibration amplitude to 30%, and increase the load gradually using water. Meanwhile, the laser senor measures the actual vibration amplitude. The proposed scheme also calculates and records in real time according to the equation:
The variations in the actual vibration amplitude and are shown in Figure 17. It shows that gradually increases 10 times after startup, while the fluctuation in the actual vibration amplitude is within 2%. This result verifies the feasibility in a wide range of loads. On the other hand, it also demonstrates the dynamic adaptability of our scheme. Although the capability of frequency tracking and vibration control is verified, the HPPSs under transient state have more complex characteristics, which should be further considered in the dynamic process.

Figure 17.
Variation in vibration amplitude under varying load.
6. Conclusions
This paper demonstrates that the proposed scheme is capable of frequency tracking and vibration control under a wide operating range. First, the impedance analysis indicates that the excitation current varies in a wide range under different loads near . The analysis also indicates that a slight deviation in phase affects the impedance characteristics little. Especially, we suggest that the load optimization frequency with about 20° phase difference can help avoid the excessive rise up of the excitation voltage under high load conditions. Second, the electrical architecture is built, and the drive capability of the scheme is verified in wide range of loads and different vibration amplitudes. Then, the pulse-based phase detector (PBPD) is proposed, which can get the phase signal over a wide operating range with acceptable precision. The experiments verify the feasibility of PBPD and vibration amplitude control under the resistance range from 7.40 to 500 Ω and the vibration range from 20% to 100%. Finally, the experiment verifies that the accuracy of the vibration control is within 2% via a laser displacement sensor under varying load. The proposed scheme could be very useful for the HPPSs working in complex conditions, like ultrasonic welding and cutting.
Author Contributions
Conceptualization and methodology, T.Y. and M.Y.; Software, T.Y. and Z.F.; validation, Y.Z. and H.W.; writing—original draft preparation, T.Y. and Y.Z.; visualization, Y.Z. and Z.F.; supervision, M.Y. and W.J. All authors have read and agreed to the published version of the manuscript.
Funding
This research is supported by the Biomedical Science and Technology Support Project of Shanghai, China (No. 19441903300) and the Natural Science Foundation of Hebei, China (No. E2018203339).
Conflicts of Interest
The authors declare no conflict of interest.
References
- Wang, J.D.; Jiang, J.J.; Duan, F.J.; Zhang, F.M.; Liu, W.; Qu, X.H. A Novel Fast Resonance Frequency Tracking Method Based on the Admittance Circle for Ultrasonic Transducers. IEEE Trans. Ind. Electron. 2020, 67, 6864–6873. [Google Scholar] [CrossRef]
- Rani, M.R.; Prakasan, K.; Rudramoorthy, R. Studies on Thermo-Elastic Heating of Horns used in Ultrasonic Plastic Welding. Ultrasonics 2015, 55, 123–132. [Google Scholar] [CrossRef] [PubMed]
- Jiang, X.; Zhang, X.; Zhu, X.; Sui, H.; Zhang, D. Study of Phase Shift Control in High-Speed Ultrasonic Vibration Cutting. IEEE Trans. Ind. Electron. 2018, 65, 2467–2474. [Google Scholar] [CrossRef]
- An, D.; Yang, M.; Zhuang, X.; Yang, T.; Meng, F.; Dong, Z. Dual Traveling Wave Rotary Ultrasonic Motor with Single Active Vibrator. Appl. Phys. Lett. 2017, 110, 143507. [Google Scholar] [CrossRef]
- Ghenna, S.; Giraud, F.; Giraud-Audine, C.; Amberg, M. Vector Control of Piezoelectric Transducers and Ultrasonic Actuators. IEEE Trans. Ind. Electron. 2018, 65, 4880–4888. [Google Scholar] [CrossRef]
- Nazemi, H.; Balasingam, J.A.; Swaminathan, S.; Ambrose, K.; Nathani, M.U.; Ahmadi, T.; Lopez, Y.B.; Emadi, A. Mass Sensors Based on Capacitive and Piezoelectric Micromachined Ultrasonic Transducers-CMUT and PMUT. Sensors 2020, 20, 2010. [Google Scholar] [CrossRef] [PubMed]
- Fiorillo, A.S.; Pullano, S.A.; Bianco, M.G.; Critello, C.D. Ultrasonic Transducers Shaped in Archimedean and Fibonacci Spiral: A Comparison. Sensors 2020, 20, 2800. [Google Scholar] [CrossRef] [PubMed]
- Nguyen, T.H.L.; Park, S. Multi-Angle Liquid Flow Measurement Using Ultrasonic Linear Array Transducer. Sensors 2020, 20, 388. [Google Scholar] [CrossRef] [PubMed]
- Liu, X.; Colli-Menchi, A.I.; Gilbert, J.; Friedrichs, D.A.; Malang, K.; Sánchez-Sinencio, E. An Automatic Resonance Tracking Scheme With Maximum Power Transfer for Piezoelectric Transducers. IEEE Trans. Ind. Electron. 2015, 62, 7136–7145. [Google Scholar] [CrossRef]
- Umeda, M.; Nakamura, K.; Ueha, S. The Measurement of High-Power Characteristics for a Piezoelectric Transducer Based on the Electrical Transient Response. Jpn. J. Appl. Phys. 1998, 37, 5322–5325. [Google Scholar] [CrossRef]
- Uchino, K.; Zheng, J.H.; Chen, Y.H.; Du, X.H.; Ryu, J.; Gao, Y.; Ural, S.; Priya, S.; Hirose, S. Loss mechanisms and high power piezoelectrics. J. Mater. Sci. 2006, 41, 217–228. [Google Scholar] [CrossRef]
- Yang, T.; Zhu, Y.; Li, S.; An, D.; Yang, M.; Cao, W. Dielectric loss and thermal effect in high power piezoelectric systems. Sens. Actuators A. Phys. 2019, 303, 111724. [Google Scholar] [CrossRef]
- Wu, H.; Yang, M.; Yang, T.; An, D. Development of web-based communication for ultrasonic power supply. In Proceeding of the 2nd International Conference on Communication and Information, Wuhan, China, 7–9 November 2017. [Google Scholar]
- Zang, Y.D. Sandwich Piezoelectric Transducers and their Applications, Chinese ed.; Science Press: Beijing, China, 2006. [Google Scholar]
- Zhu, Y.; Yang, T.; Fang, Z.; Shiyang, L.; Cunyue, L.; Yang, M. Contact modeling for control design of traveling wave ultrasonic motors. Sens. Actuators A Phys. 2020, 310, 112037. [Google Scholar] [CrossRef]
- Zhang, H.; Wang, F.; Zhang, D.; Wang, L.; Hou, Y.; Xi, T. A new automatic resonance frequency tracking method for piezoelectric ultrasonic transducers used in thermosonic wire bonding. Sens. Actuator A-Phys. 2015, 235, 140–150. [Google Scholar] [CrossRef]
- Zhao, C.S. Ultrasonic Motors Technologies and Application, Chinese ed.; Science press: Beijing, China, 2007. [Google Scholar]
- Di, S.; Fan, W.; Li, H. Parallel resonant frequency tracking based on the static capacitance online measuring for a piezoelectric transducer. Sens. Actuator A-Phys. 2018, 270, 18–24. [Google Scholar] [CrossRef]
- Fang, Z.; Yang, T.; Zhu, Y.; Li, S.; Yang, M. Velocity Control of Traveling-Wave Ultrasonic Motors Based on Stator Vibration Amplitude. Sensors 2019, 19, 5326. [Google Scholar] [CrossRef] [PubMed]
- Butterworth, S. On Electrically-maintained Vibrations. Proc. Phys. Soc. Lond. 1914, 27, 410–424. [Google Scholar] [CrossRef]
- Dyke, K.S.V. The Piezo-Electric Resonator and Its Equivalent Network. Proc. Inst. Radio Eng. 1928, 16, 742–764. [Google Scholar]
© 2020 by the authors. Licensee MDPI, Basel, Switzerland. This article is an open access article distributed under the terms and conditions of the Creative Commons Attribution (CC BY) license (http://creativecommons.org/licenses/by/4.0/).