Comparison of Regression and Classification Models for User-Independent and Personal Stress Detection


Abstract
1. Introduction and Related Work
2. Experimental Dataset
3. Methods
4. Experiments
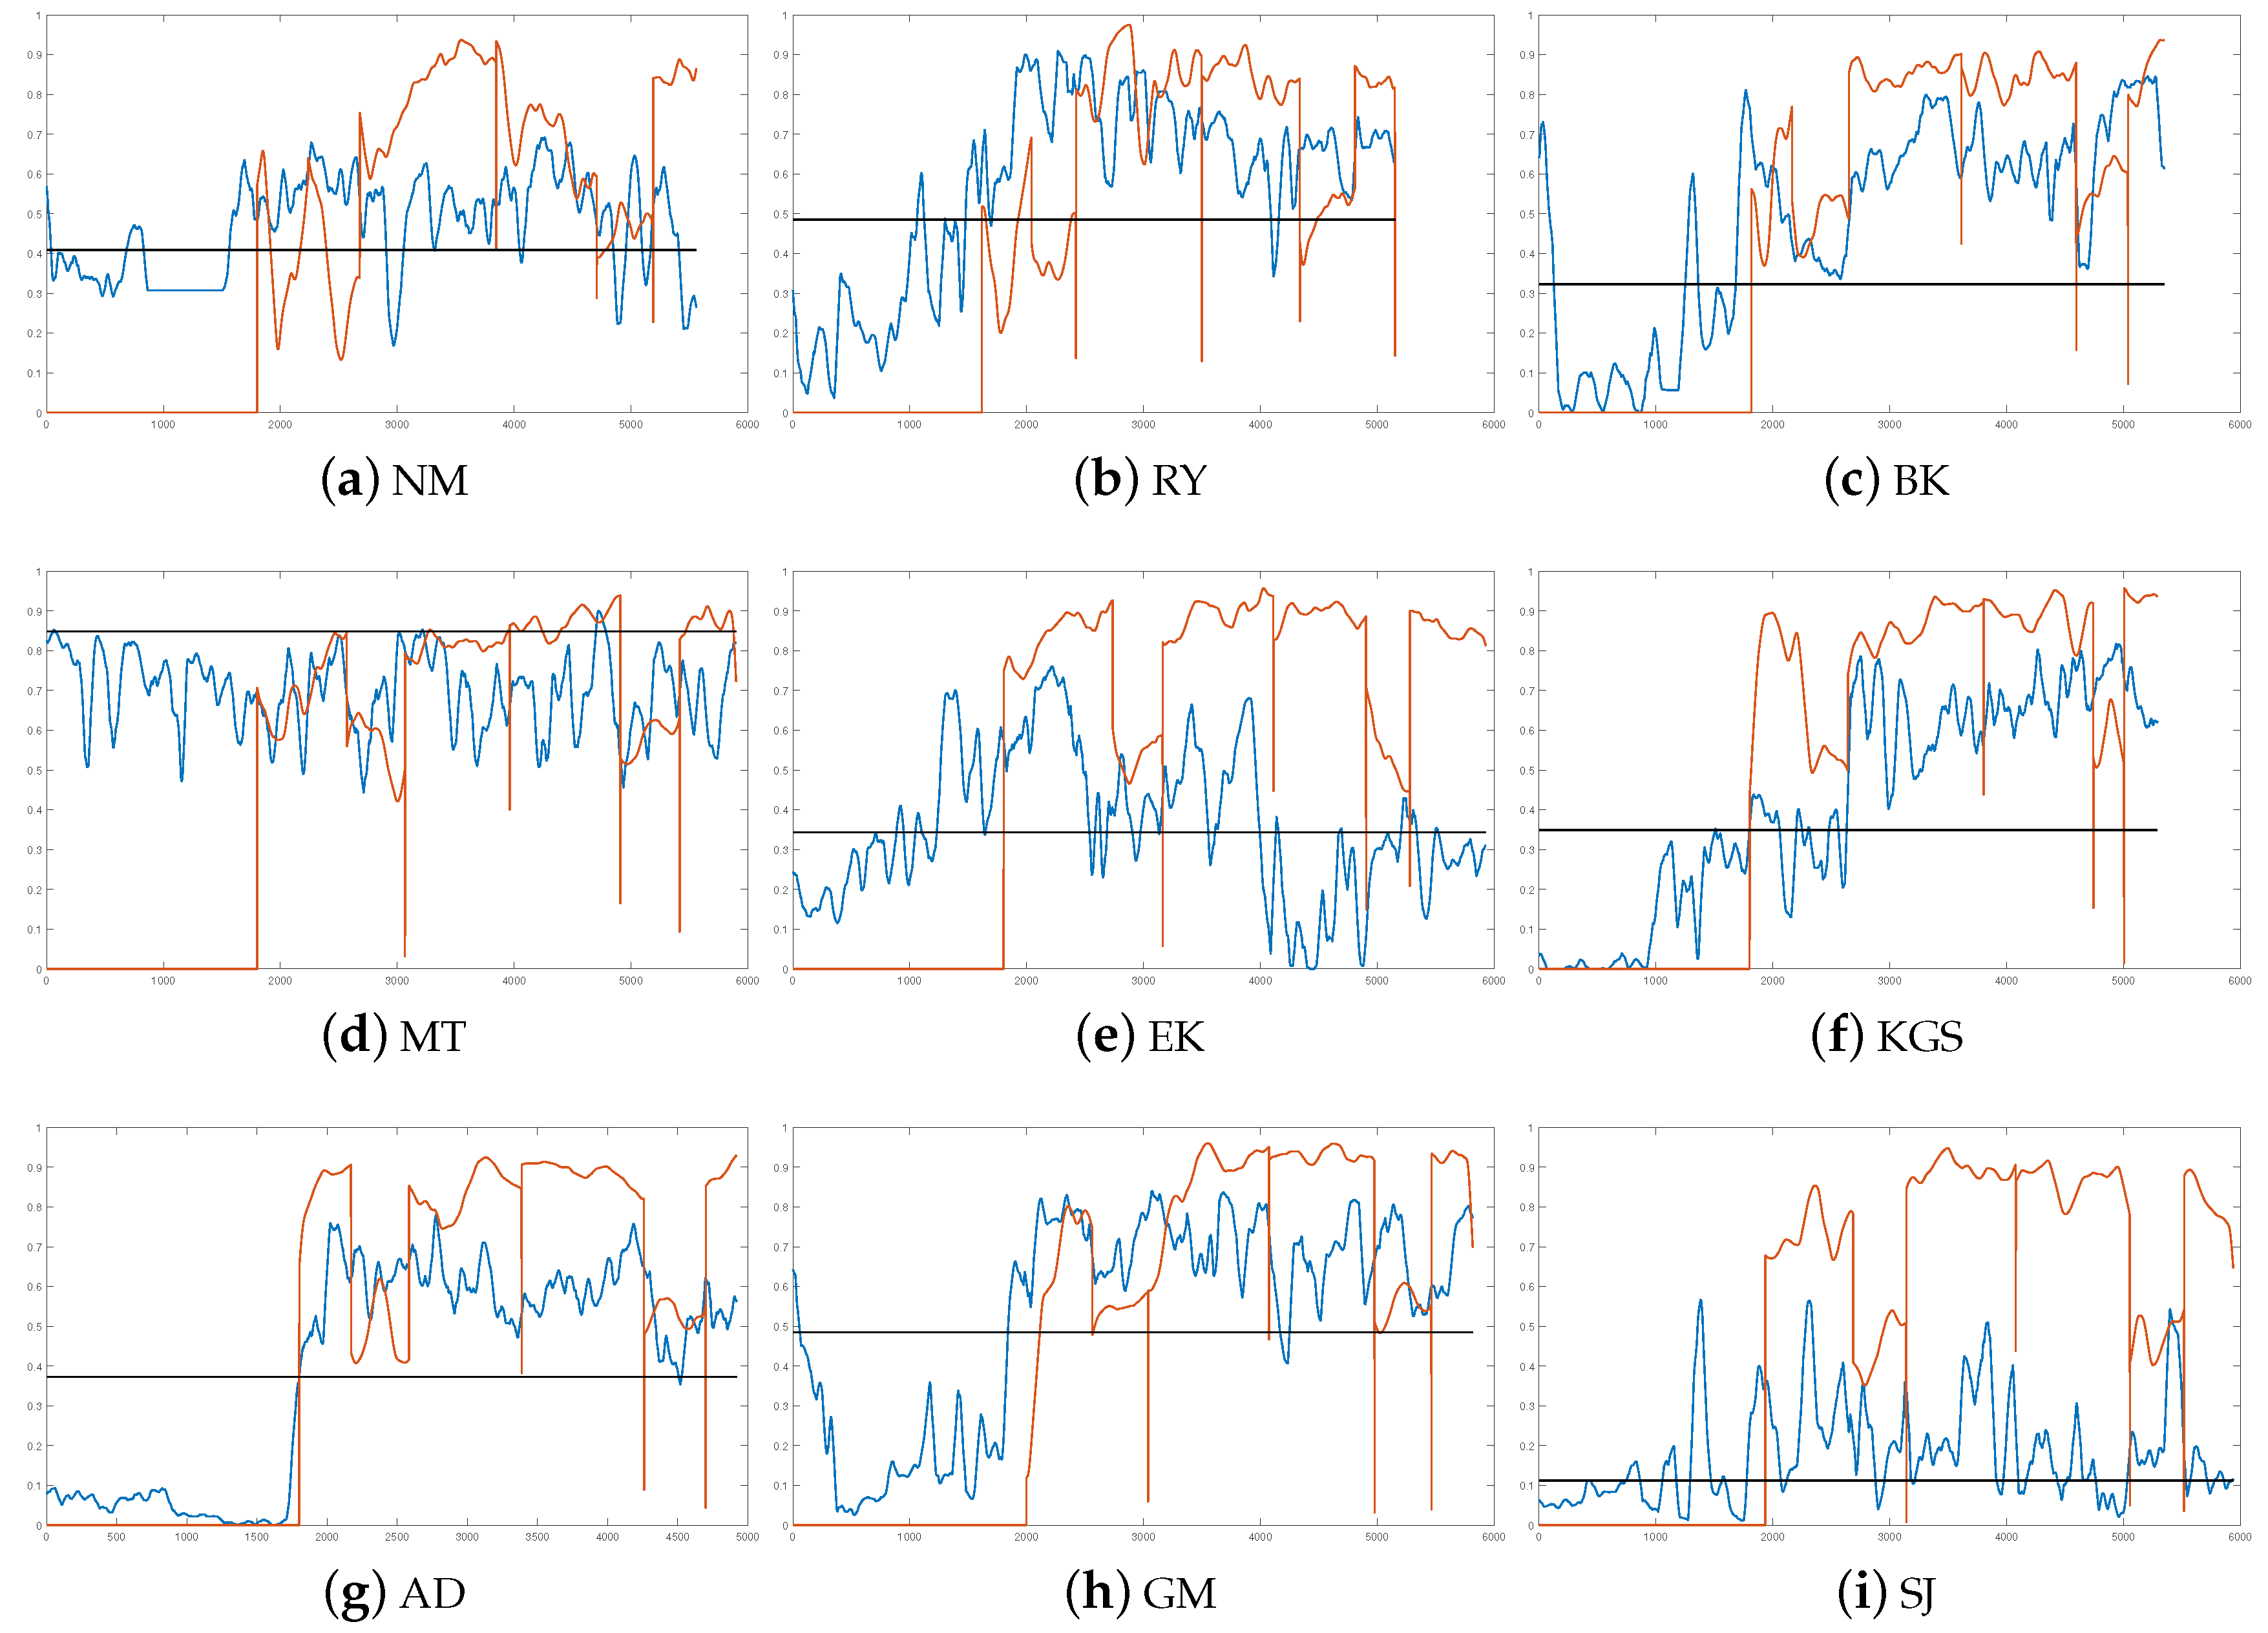
4.1. User-Independent Stress Detection
4.2. Personal Stress Detection
5. Discussion and Conclusions
Author Contributions
Funding
Acknowledgments
Conflicts of Interest
References
- Rathod, P.; George, K.; Shinde, N. Bio-signal based emotion detection device. In Proceedings of the 2016 IEEE 13th International Conference on Wearable and Implantable Body Sensor Networks (BSN), San Francisco, CA, USA, 14–17 June 2016; pp. 105–108. [Google Scholar]
- Zenonos, A.; Khan, A.; Kalogridis, G.; Vatsikas, S.; Lewis, T.; Sooriyabandara, M. HealthyOffice: Mood recognition at work using smartphones and wearable sensors. In Proceedings of the 2016 IEEE International Conference on Pervasive Computing and Communication Workshops (PerCom Workshops), Sydney, Australia, 14–18 March 2016; pp. 1–6. [Google Scholar]
- Renee Baptiste, N. Tightening the link between employee wellbeing at work and performance: A new dimension for HRM. Manag. Decis. 2008, 46, 284–309. [Google Scholar] [CrossRef]
- Lupien, S.J.; McEwen, B.S.; Gunnar, M.R.; Heim, C. Effects of stress throughout the lifespan on the brain, behaviour and cognition. Nat. Rev. Neurosci. 2009, 10, 434–445. [Google Scholar] [CrossRef] [PubMed]
- Nagaraja, A.S.; Sadaoui, N.C.; Dorniak, P.L.; Lutgendorf, S.K.; Sood, A.K. SnapShot: Stress and disease. Cell Metab. 2016, 23, 388–388.e1. [Google Scholar] [CrossRef] [PubMed]
- Gjoreski, M.; Gjoreski, H.; Luštrek, M.; Gams, M. Continuous Stress Detection Using a Wrist Device: In Laboratory and Real Life. In Proceedings of the 2016 ACM International Joint Conference on Pervasive and Ubiquitous Computing: Adjunct, Heidelberg, Germany, 12–16 September 2016; pp. 1185–1193. [Google Scholar] [CrossRef]
- Siirtola, P. Continuous stress detection using the sensors of commercial smartwatch. In Proceedings of the 2019 ACM International Joint Conference on Pervasive and Ubiquitous Computing and Proceedings of the 2019 ACM International Symposium on Wearable Computers, London, UK, 9–13 September 2019; pp. 1198–1201. [Google Scholar]
- Schmidt, P.; Reiss, A.; Dürichen, R.; Laerhoven, K.V. Wearable-Based Affect Recognition—A Review. Sensors 2019, 19, 4079. [Google Scholar] [CrossRef] [PubMed]
- Can, Y.S.; Arnrich, B.; Ersoy, C. Stress detection in daily life scenarios using smart phones and wearable sensors: A survey. J. Biomed. Inform. 2019, 92, 103139. [Google Scholar] [CrossRef] [PubMed]
- Hernandez, J.; Morris, R.R.; Picard, R.W. Call center stress recognition with person-specific models. In Proceedings of the International Conference on Affective Computing and Intelligent Interaction, Memphis, TN, USA, 9–12 October 2011; pp. 125–134. [Google Scholar]
- Stewart, C.L.; Folarin, A.; Dobson, R. Personalized acute stress classification from physiological signals with neural processes. arXiv 2020, arXiv:2002.04176. [Google Scholar]
- Mishra, V.; Hao, T.; Sun, S.; Walter, K.N.; Ball, M.J.; Chen, C.H.; Zhu, X. Investigating the role of context in perceived stress detection in the wild. In Proceedings of the 2018 ACM International Joint Conference and 2018 International Symposium on Pervasive and Ubiquitous Computing and Wearable Computers, Singapore, 8–12 October 2018; pp. 1708–1716. [Google Scholar]
- Healey, J.; Picard, R. Detecting stress during real-world driving tasks using physiological sensors. IEEE Trans. Intell. Transp. Syst. 2005, 6, 156–166. [Google Scholar] [CrossRef]
- Haouij, N.E.; Poggi, J.M.; Sevestre-Ghalila, S.; Ghozi, R.; Jaïdane, M. AffectiveROAD System and Database to Assess Driver’s Attention. In Proceedings of the 33rd Annual ACM Symposium on Applied Computing, Pau, France, 9–13 April 2018; pp. 800–803. [Google Scholar] [CrossRef]
- El Haouij, N. Biosignals for Driver’s Stress Level Assessment: Functional Variable Selection and Fractal Characterization. Ph.D. Thesis, Paris Saclay, Saint-Aubin, France, 2018. [Google Scholar]
- Novak, D.; Mihelj, M.; Munih, M. A survey of methods for data fusion and system adaptation using autonomic nervous system responses in physiological computing. Interact. Comput. 2012, 24, 154–172. [Google Scholar] [CrossRef]
- Wei, J.; Chen, T.; Liu, G.; Yang, J. Higher-order multivariable polynomial regression to estimate human affective states. Sci. Rep. 2016, 6, 23384. [Google Scholar] [CrossRef] [PubMed]
- Empatica E4. 2019. Available online: https://www.empatica.com/e4-wristband (accessed on 27 May 2019).
- Schmidt, P.; Reiss, A.; Duerichen, R.; Marberger, C.; Van Laerhoven, K. Introducing WESAD, a Multimodal Dataset for Wearable Stress and Affect Detection. In Proceedings of the 2018 on International Conference on Multimodal Interaction, Boulder, CO, USA, 16–20 October 2018; pp. 400–408. [Google Scholar]
- Siirtola, P.; Röning, J. Recognizing human activities user-independently on smartphones based on accelerometer data. IJIMAI 2012, 1, 38–45. [Google Scholar] [CrossRef]
- Siirtola, P.; Röning, J. Incremental Learning to Personalize Human Activity Recognition Models: The Importance of Human AI Collaboration. Sensors 2019, 19, 5151. [Google Scholar] [CrossRef] [PubMed]
- Schmidt, P.; Dürichen, R.; Reiss, A.; Van Laerhoven, K.; Plötz, T. Multi-target affect detection in the wild: An exploratory study. In Proceedings of the 23rd International Symposium on Wearable Computers, London, UK, 9–13 September 2019; pp. 211–219. [Google Scholar]


| Method | RMSE |
|---|---|
| Linear regression | 0.23 |
| Robust linear regression | 0.24 |
| Fine tree | 0.05 |
| Medium tree | 0.06 |
| Coarse tree | 0.08 |
| SVM with linear kernel | 0.24 |
| SVM with quadratic kernel | 0.14 |
| SVM with cubic kernel | 0.7 |
| SVM with fine Gaussian kernel | 0.14 |
| SVM with medium Gaussian kernel | 0.8 |
| SVM with coarse Gaussian kernel | 0.21 |
| Boosted tree based ensemble | 0.16 |
| Bagged tree based ensemble | 0.03 |
| Regression | |||
|---|---|---|---|
| Sensors | Balanced accuracy | Sensitivity | Specificity |
| ACC+EDA+ST+BVP | 89.0 (13.3) | 86.9 (22.7) | 93.6 (5.8) |
| EDA+ST+BVP | 75.0 (16.0) | 71.6 (27.3) | 90.9 (9.2) |
| EDA+BVP | 75.1 (15.8) | 73.5 (24.5) | 88.3 (7.8) |
| BVP+ST | 82.3 (17.0) | 76.6 (23.8) | 91.0 (6.1) |
| EDA+ST | 72.3 (16.7) | 70.9 (24.2) | 84.0 (11.0) |
| EDA | 73.5 (15.2) | 72.0 (23.7) | 87.5 (10.8) |
| BVP | 78.5 (16.7) | 72.1 (23.7) | 89.0 (7.2) |
| ST | 68.6 (11.8) | 56.1 (19.3) | 83.5 (9.0) |
| ACC | 94.3 (5.5) | 93.2 (7.0) | 96.2 (3.4) |
| Classification | |||
| Sensors | Balanced accuracy | Sensitivity | Specificity |
| ACC+EDA+ST+BVP | 85.2 (14.2) | 82.4 (22.9) | 91.7 (9.4) |
| EDA+ST+BVP | 65.4 (22.8) | 61.6 (33.9) | 76.7 (15.7) |
| EDA+BVP | 69.3 (16.9) | 57.9 (33.3) | 78.7 (11.4) |
| BVP+ST | 74.1 (16.7) | 66.0 (33.5) | 85.6 (10.9) |
| EDA+ST | 64.6 (23.1) | 54.1 (31.8) | 73.2 (17.5) |
| EDA | 64.5 (14.6) | 55.8 (23.9) | 78.1 (12.8) |
| BVP | 70.4 (20.4) | 64.0 (38.2) | 82.9 (11.0) |
| ST | 61.3 (14.9) | 50.5 (27.6) | 76.5 (12.0) |
| ACC | 90.2 (10.1) | 91.4 (9.2) | 96.0 (6.4) |
| True/Predicted | Non-Stressed | Stressed |
|---|---|---|
| Non-stressed | 88.0% | 12.0% |
| Stressed | 26.6% | 73.4% |
| Subject | Classification (%) | Regression (%) |
|---|---|---|
| NM | 64.3 | 84.6 |
| RY | 90.8 | 93.7 |
| BK | 87.0 | 88.3 |
| MT | 49.0 | 50.5 |
| EK | 59.4 | 60.7 |
| KGS | 88.3 | 93.7 |
| AD | 96.3 | 99.7 |
| GM | 69.9 | 95.0 |
| SJ | 62.2 | 74.7 |
| Mean | 74.1 (STD 16.7) | 82.3 (STD 17.0) |
| Subject | RMSE Total | RMSE Stress | R-Squared Total |
|---|---|---|---|
| NM | 0.31 | 0.26 | 0.09 |
| RY | 0.27 | 0.26 | 0.49 |
| BK | 0.24 | 0.18 | 0.60 |
| MT | 0.43 | 0.18 | 0 |
| EK | 0.46 | 0.52 | 0 |
| KGS | 0.25 | 0.28 | 0.60 |
| AD | 0.20 | 0.25 | 0.75 |
| GM | 0.22 | 0.21 | 0.64 |
| SJ | 0.48 | 0.60 | 0 |
| Mean | 0.32 | 0.31 | 0.35 |
| Subject | Balanced Accuracy (%) | Sensor Combination |
|---|---|---|
| NM | 84.6 | BVP+ST |
| RY | 93.7 | BVP+ST |
| BK | 91.1 | EDA+BVP+ST |
| MT | 64.3 | EDA+BVP+ST |
| EK | 83.2 | BVP+EDA |
| KGS | 93.7 | BVP+ST |
| AD | 99.7 | BVP+ST |
| GM | 95.0 | BVP+ST |
| SJ | 70.8 | ST |
| Mean | 86.3 (STD 11.7) |
| Sensors | Valid/Train NM1/NM2 Classif./Regr. | Valid/Train NM1/NM3 Classif./Regr. | Valid/Train RY1/RY2 Classif./Regr. | Valid/Train GM1/GM2 Classif./Regr. |
|---|---|---|---|---|
| EDA+ST+BVP | 69.3/70.1 | 49.2/68.0 | 50.0/50.0 | 50.0/ 71.4 |
| EDA+BVP | 69.9/79.5 | 50.0 /50.0 | 54.8/71.2 | 50.0/50.0 |
| BVP+ST | 69.3/88.0 | 50.8/67.9 | 50.0/65.0 | 83.7/91.6 |
| EDA+ST | 69.3/70.1 | 80.9/91.4 | 50.0/50.6 | 50.0/50.0 |
| EDA | 69.2/83.5 | 49.4/68.8 | 51.1/50.5 | 50.0/50.0 |
| BVP | 83.3/84.9 | 51.4/50.8 | 95.0/94.4 | 57.8/91.1 |
| ST | 69.3/70.1 | 69.3/69.4 | 50.0/84.7 | 50.0/78.7 |
| Sensors | Valid/Train NM1/NM2 + NM3 Classif./Regr. | Valid/Train NM2/NM1 + NM3 Classif./Regr. | Valid/Train NM3/NM1 + NM2 Classif./Regr. |
|---|---|---|---|
| EDA+ST+BVP | 74.4 /98.3 | 77.5/99.3 | 50.1/52.6 |
| EDA+BVP | 62.4/77.2 | 32.0 /50.0 | 51.0/52.4 |
| BVP+ST | 85.5/98.8 | 50.0/60.4 | 52.3/52.1 |
| EDA+ST | 69.3/85.6 | 80.6/99.4 | 48.2/52.6 |
| EDA | 63.8/80.1 | 32.9/68.3 | 49.6/51.0 |
| BVP | 74.5/78.7 | 64.8/87.4 | 51.9/50.9 |
| ST | 69.3/69.4 | 50.0/51.1 | 56.9/61.2 |
© 2020 by the authors. Licensee MDPI, Basel, Switzerland. This article is an open access article distributed under the terms and conditions of the Creative Commons Attribution (CC BY) license (http://creativecommons.org/licenses/by/4.0/).
Share and Cite
Siirtola, P.; Röning, J. Comparison of Regression and Classification Models for User-Independent and Personal Stress Detection. Sensors 2020, 20, 4402. https://doi.org/10.3390/s20164402
Siirtola P, Röning J. Comparison of Regression and Classification Models for User-Independent and Personal Stress Detection. Sensors. 2020; 20(16):4402. https://doi.org/10.3390/s20164402
Chicago/Turabian StyleSiirtola, Pekka, and Juha Röning. 2020. "Comparison of Regression and Classification Models for User-Independent and Personal Stress Detection" Sensors 20, no. 16: 4402. https://doi.org/10.3390/s20164402
APA StyleSiirtola, P., & Röning, J. (2020). Comparison of Regression and Classification Models for User-Independent and Personal Stress Detection. Sensors, 20(16), 4402. https://doi.org/10.3390/s20164402