Author Contributions
Conceptualization, S.K., Z.S., N.P. and P.N.; methodology, N.P., T.H. and P.N.; validation and formal analysis, Z.S., N.P., P.N. and T.H.; investigation, resources and data curation, S.K., Z.S., N.P., T.H. and P.N.; writing—original draft preparation, writing—review and editing, and visualization, S.K., N.P. and P.N. All authors have read and agreed to the published version of the manuscript.
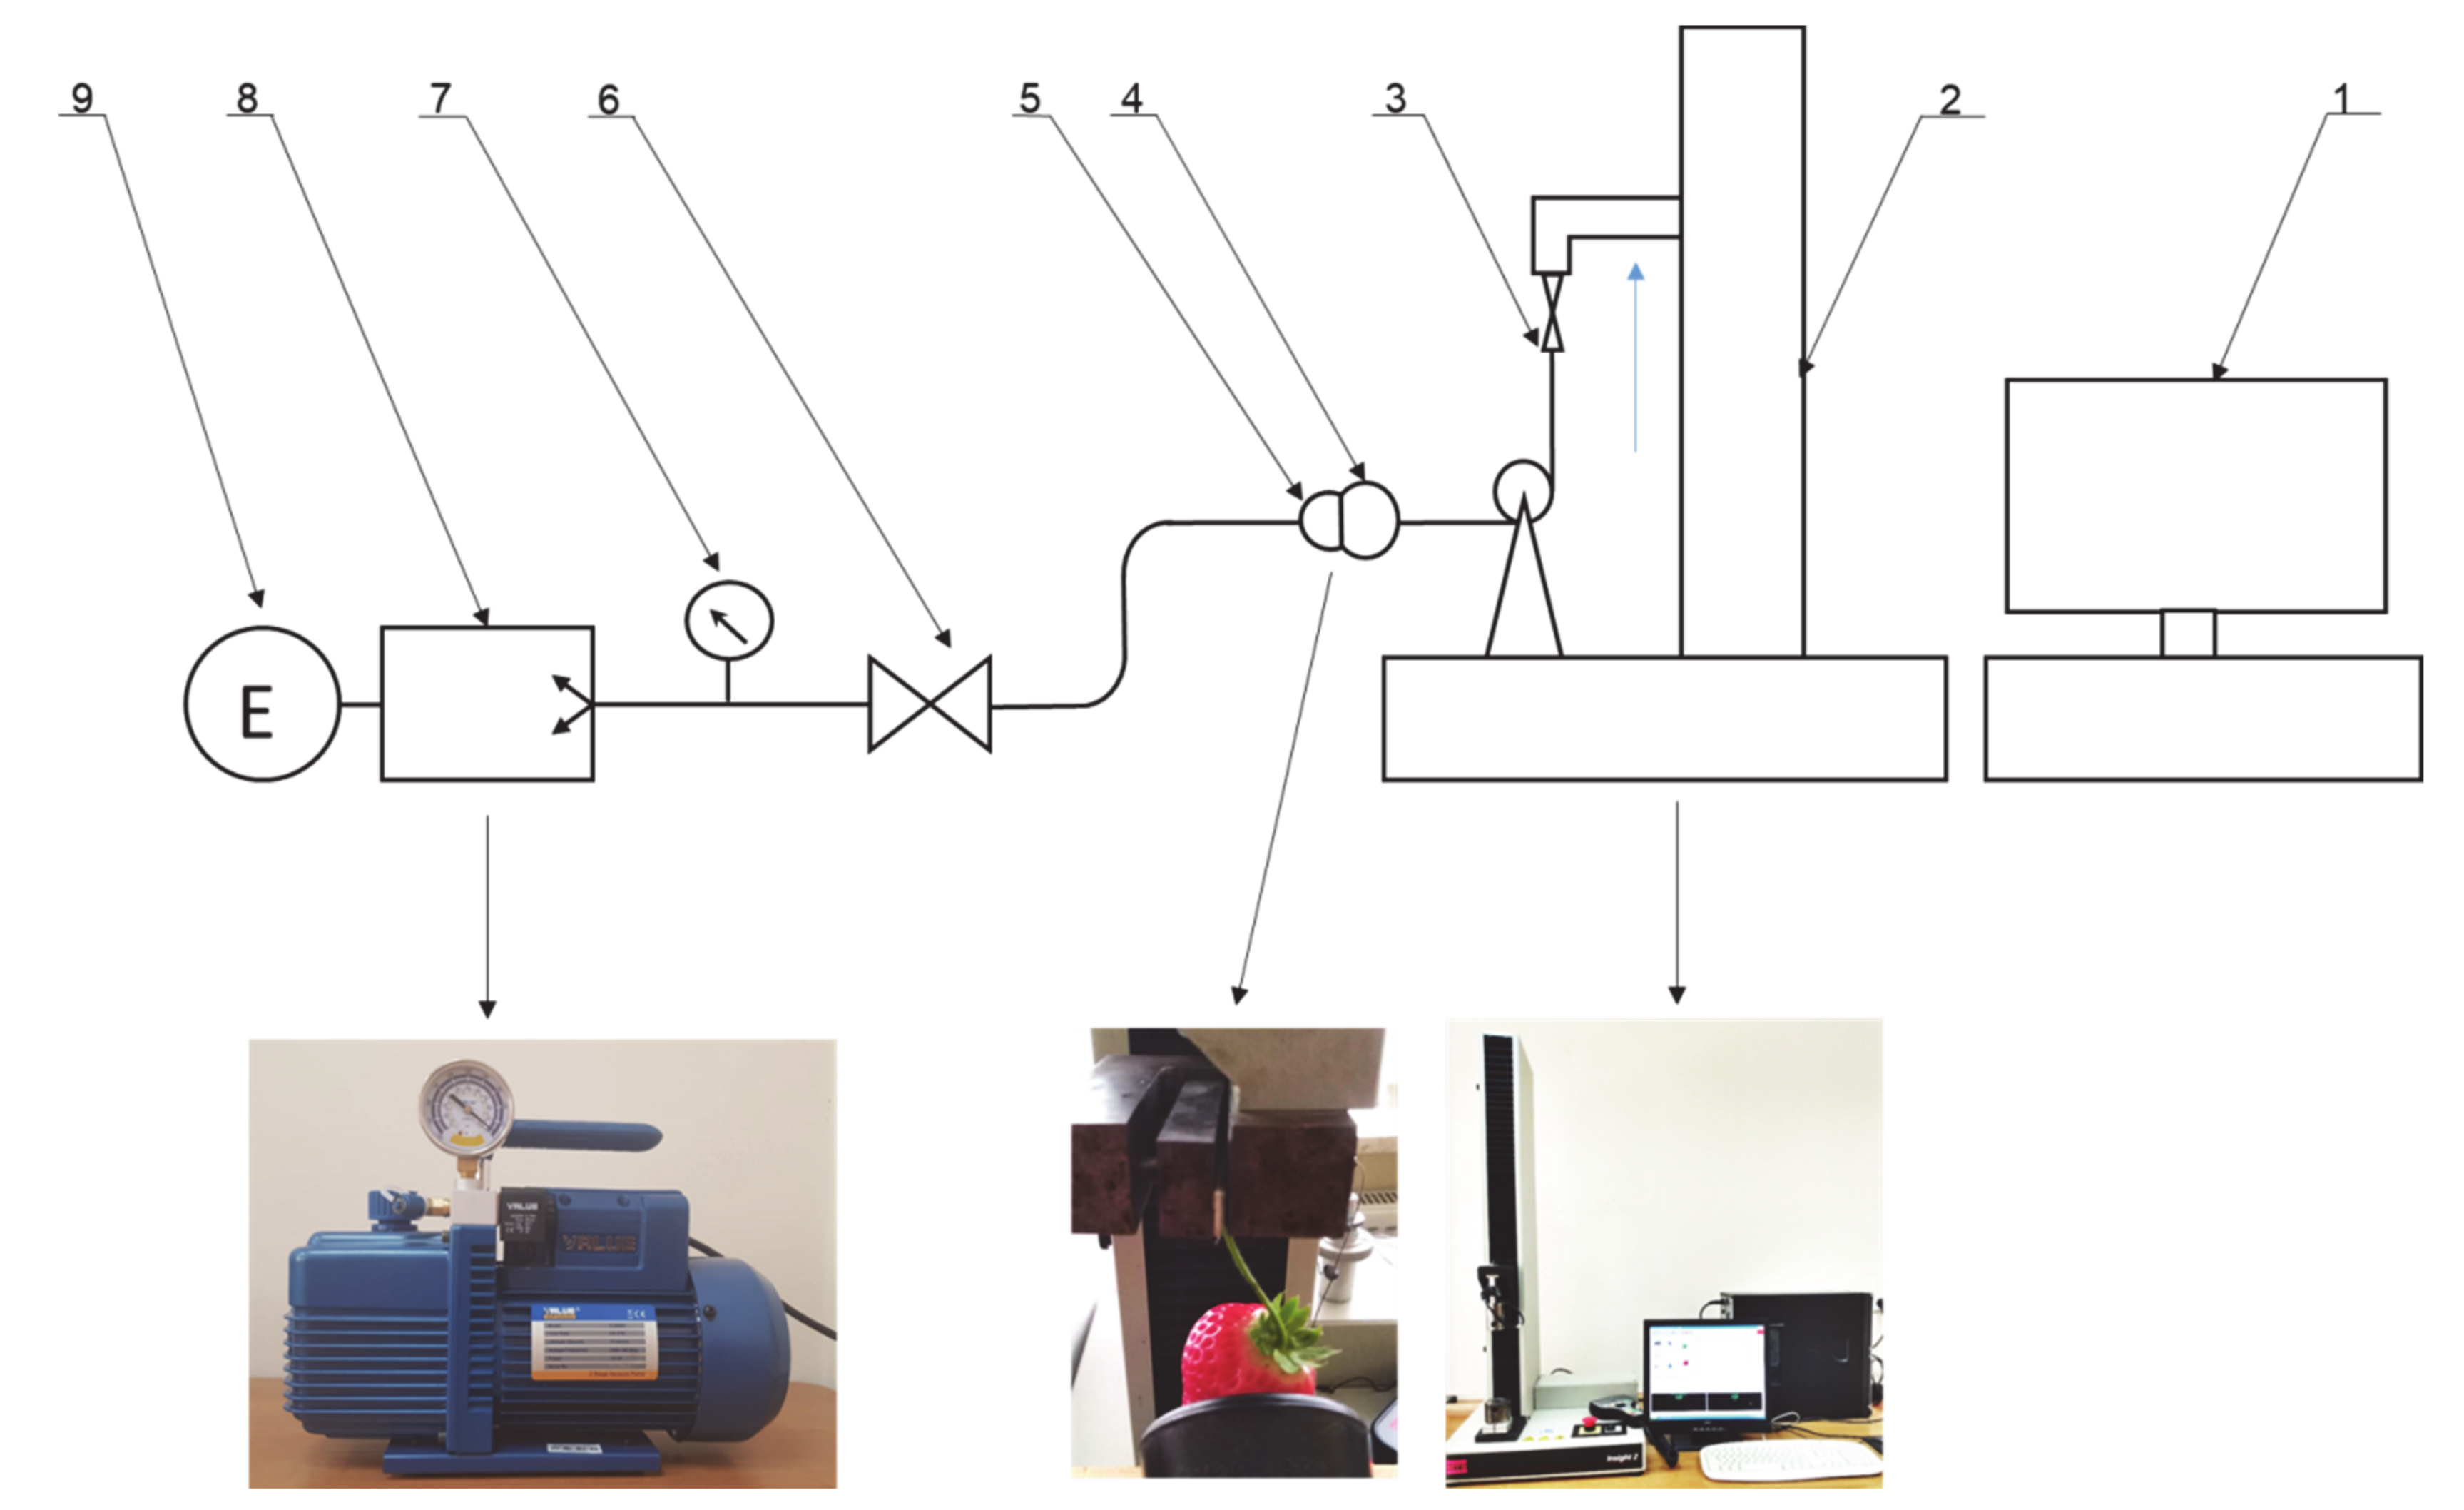
Figure 1.
Diagram of the measuring stand for determining the maximum suction force of strawberry fruit. 1: computer, 2: MTS 2 testing machine, 3: load cell strain gauge, 4: strawberry fruit, 5: suction cup, 6: valve, 7: vacuum gauge, 8: vacuum pump, 9: motor.
Figure 1.
Diagram of the measuring stand for determining the maximum suction force of strawberry fruit. 1: computer, 2: MTS 2 testing machine, 3: load cell strain gauge, 4: strawberry fruit, 5: suction cup, 6: valve, 7: vacuum gauge, 8: vacuum pump, 9: motor.
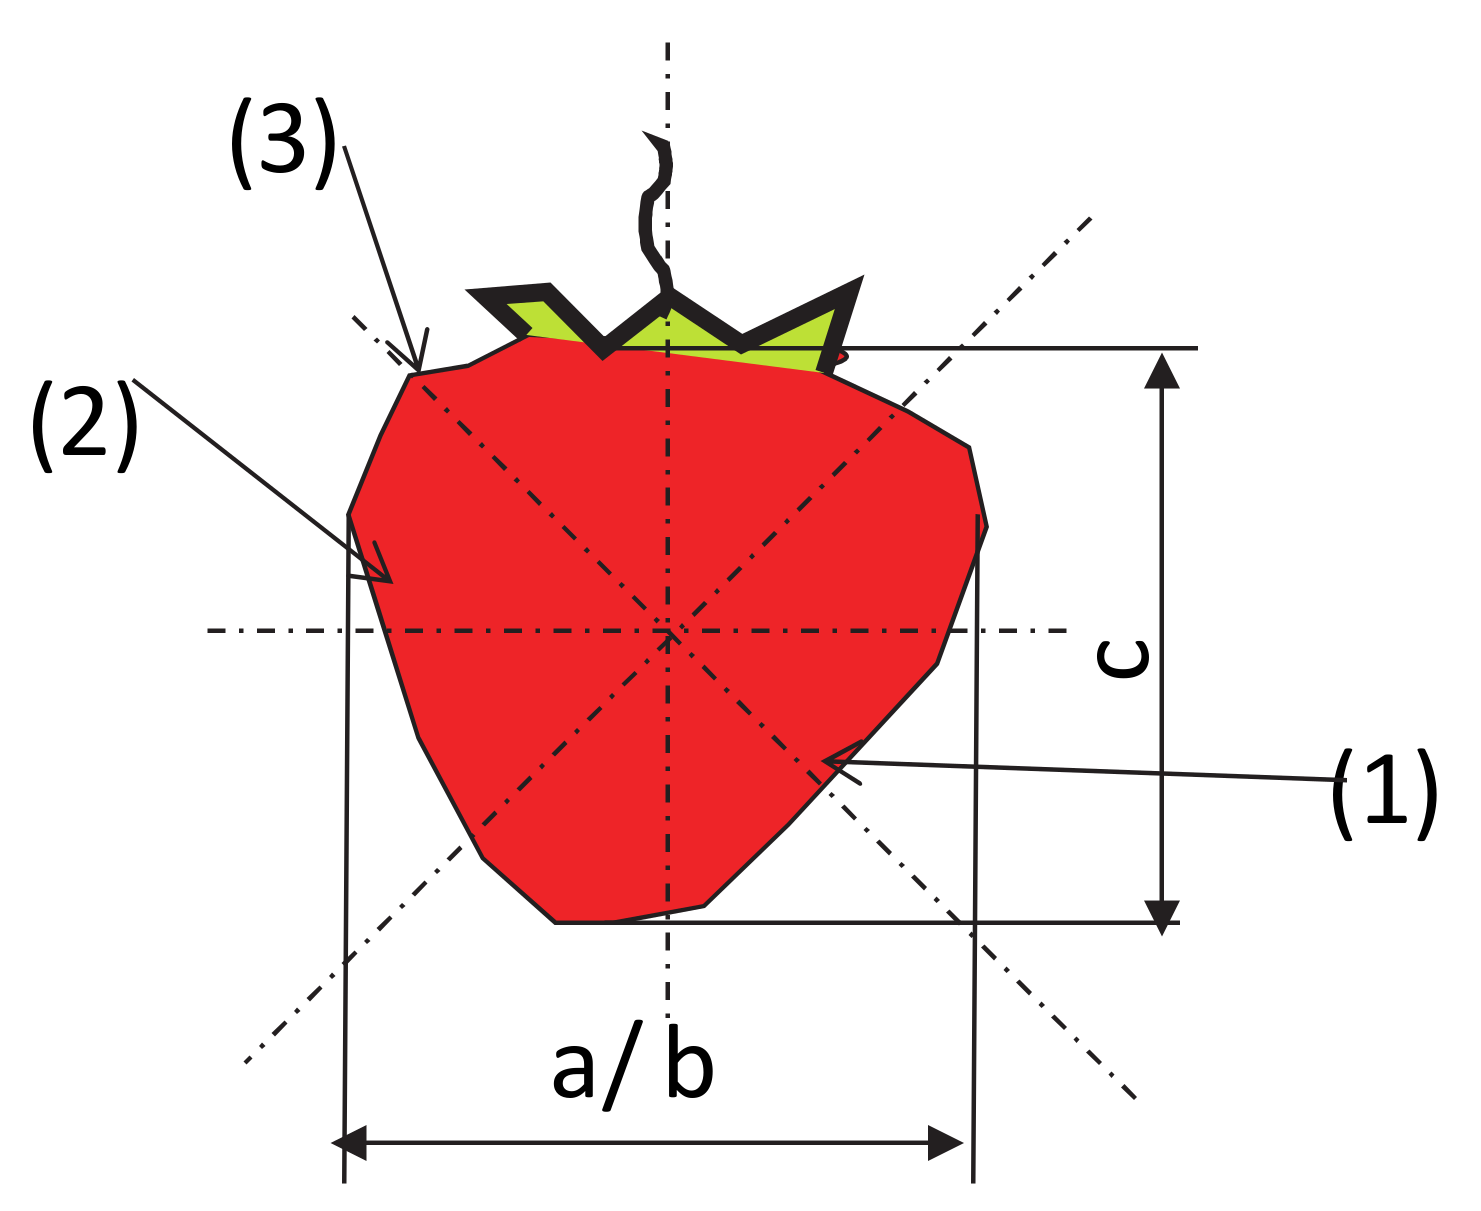
Figure 2.
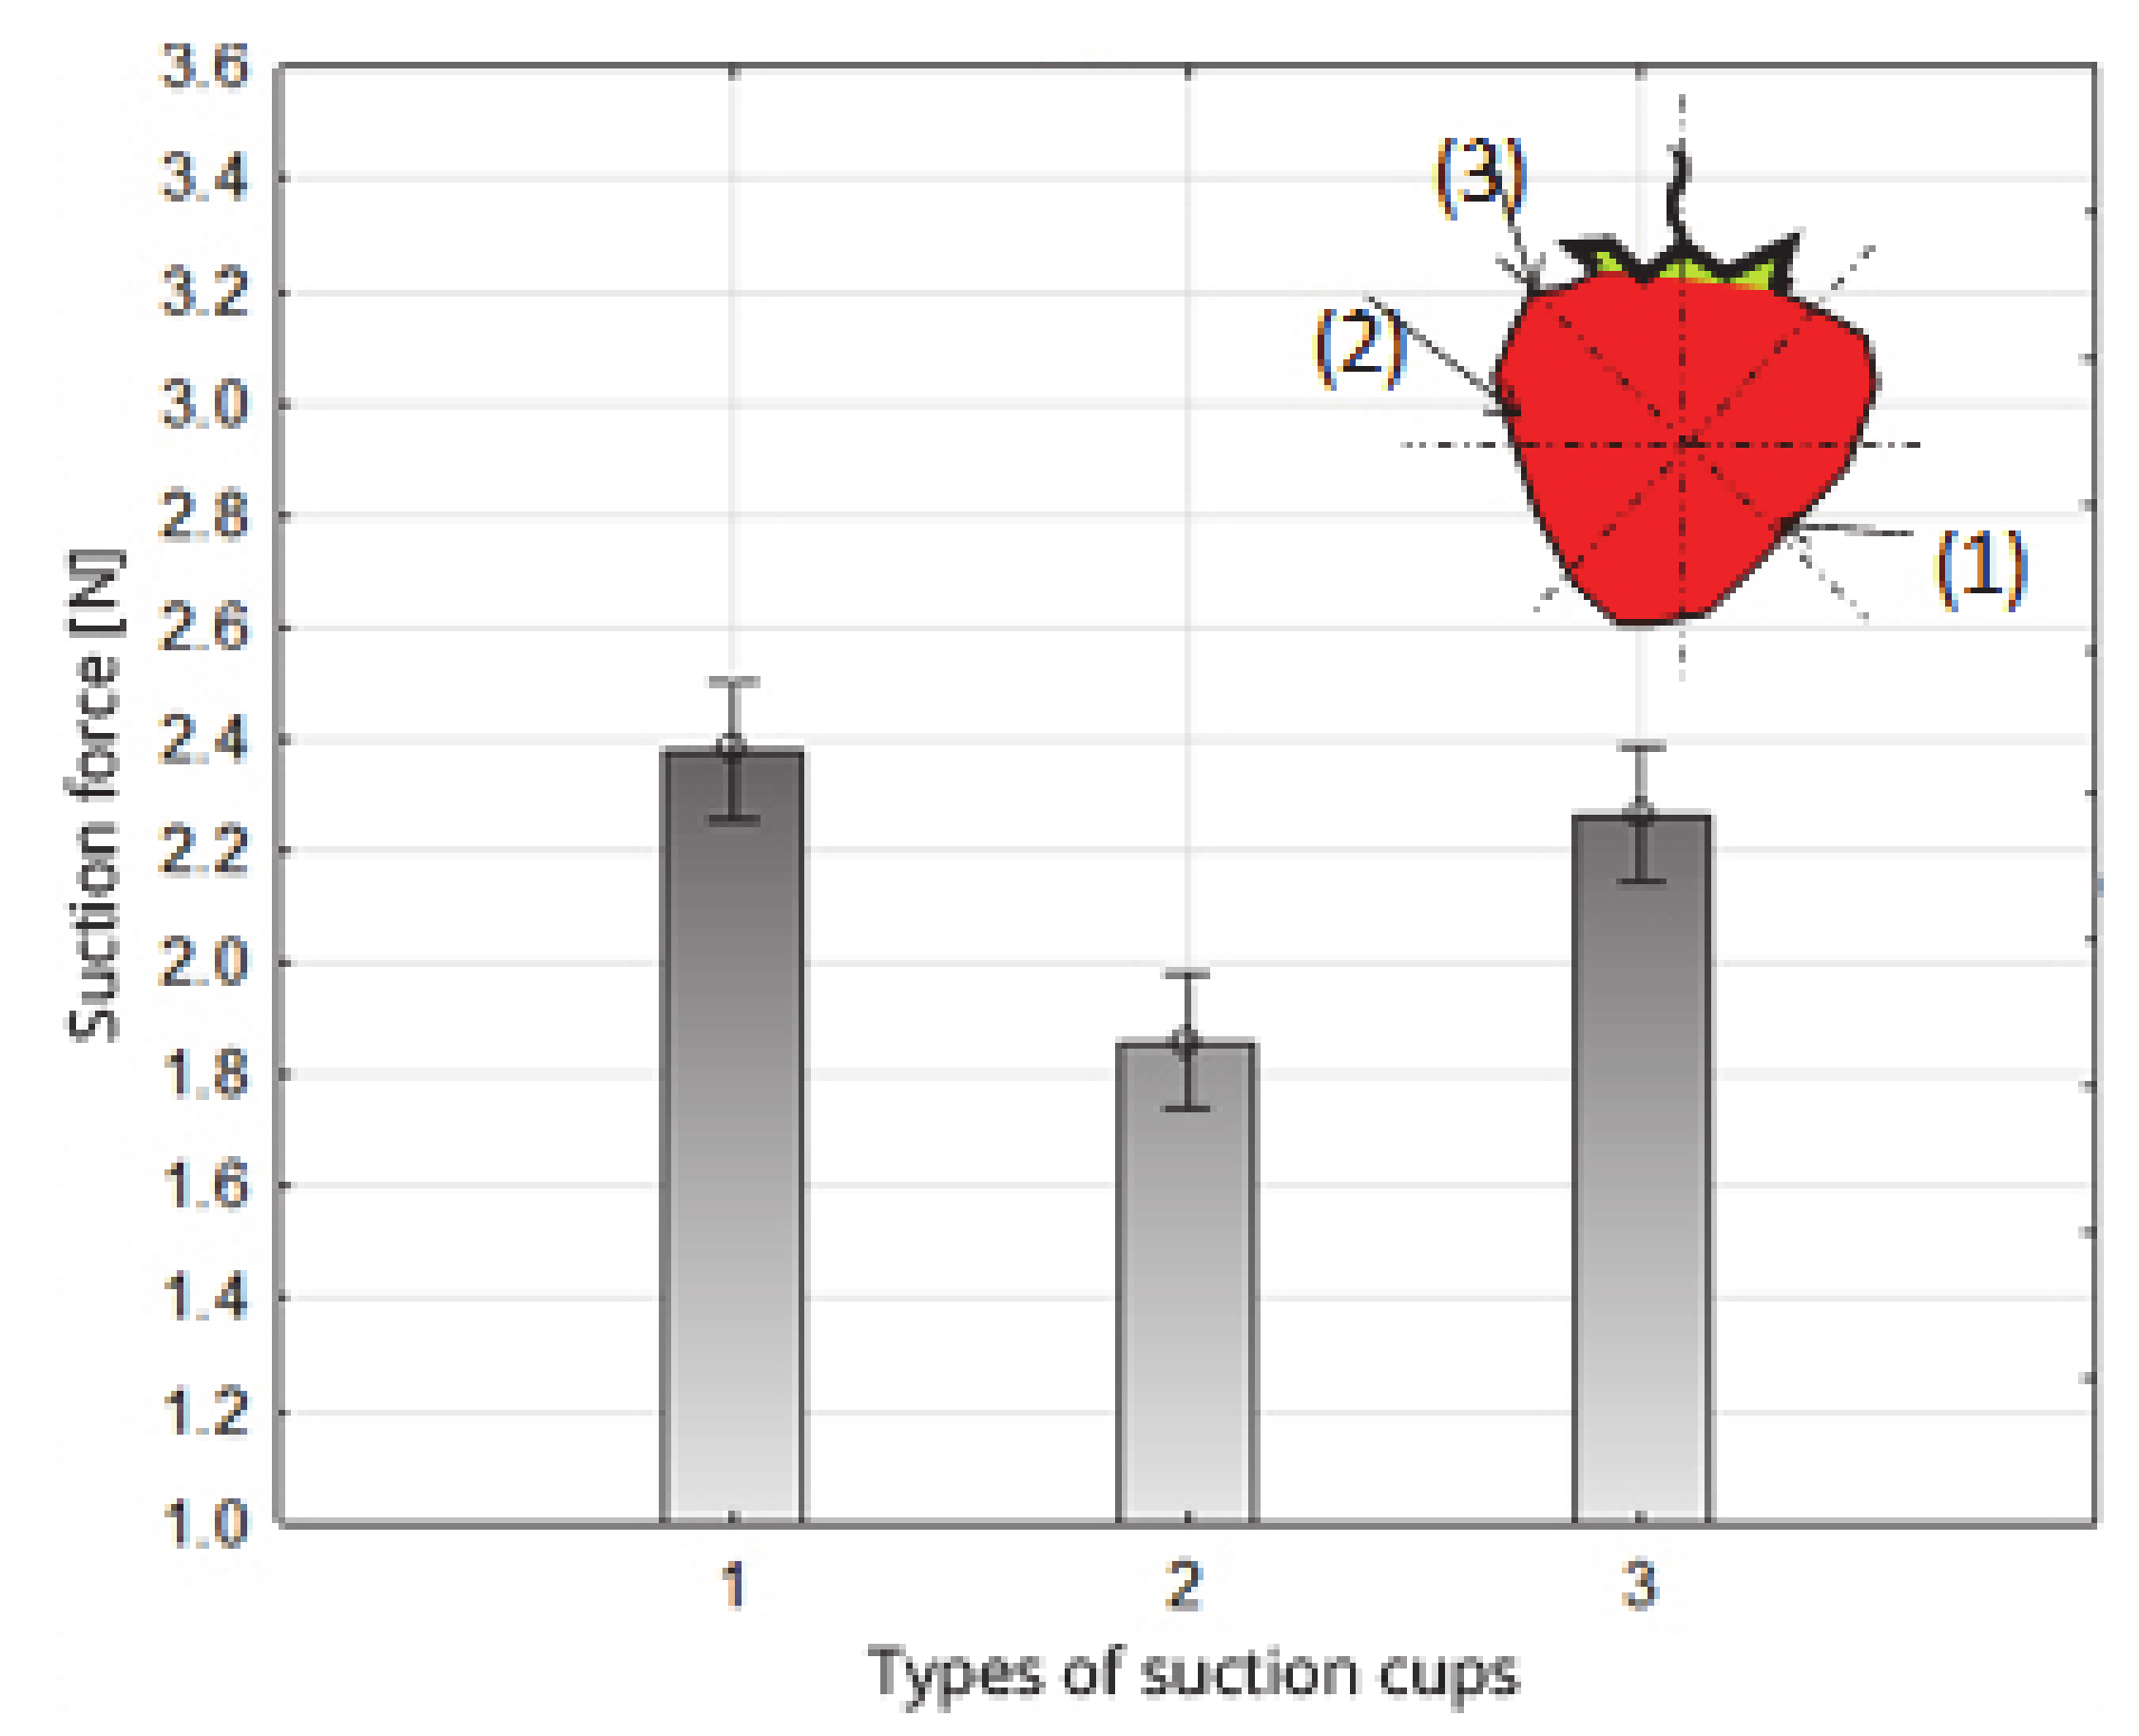
Zones and directions for applying the suction cups to the fruit during testing—1: the top zone, 2: the central zone, 3: the pedicel zone.
Figure 2.
Zones and directions for applying the suction cups to the fruit during testing—1: the top zone, 2: the central zone, 3: the pedicel zone.
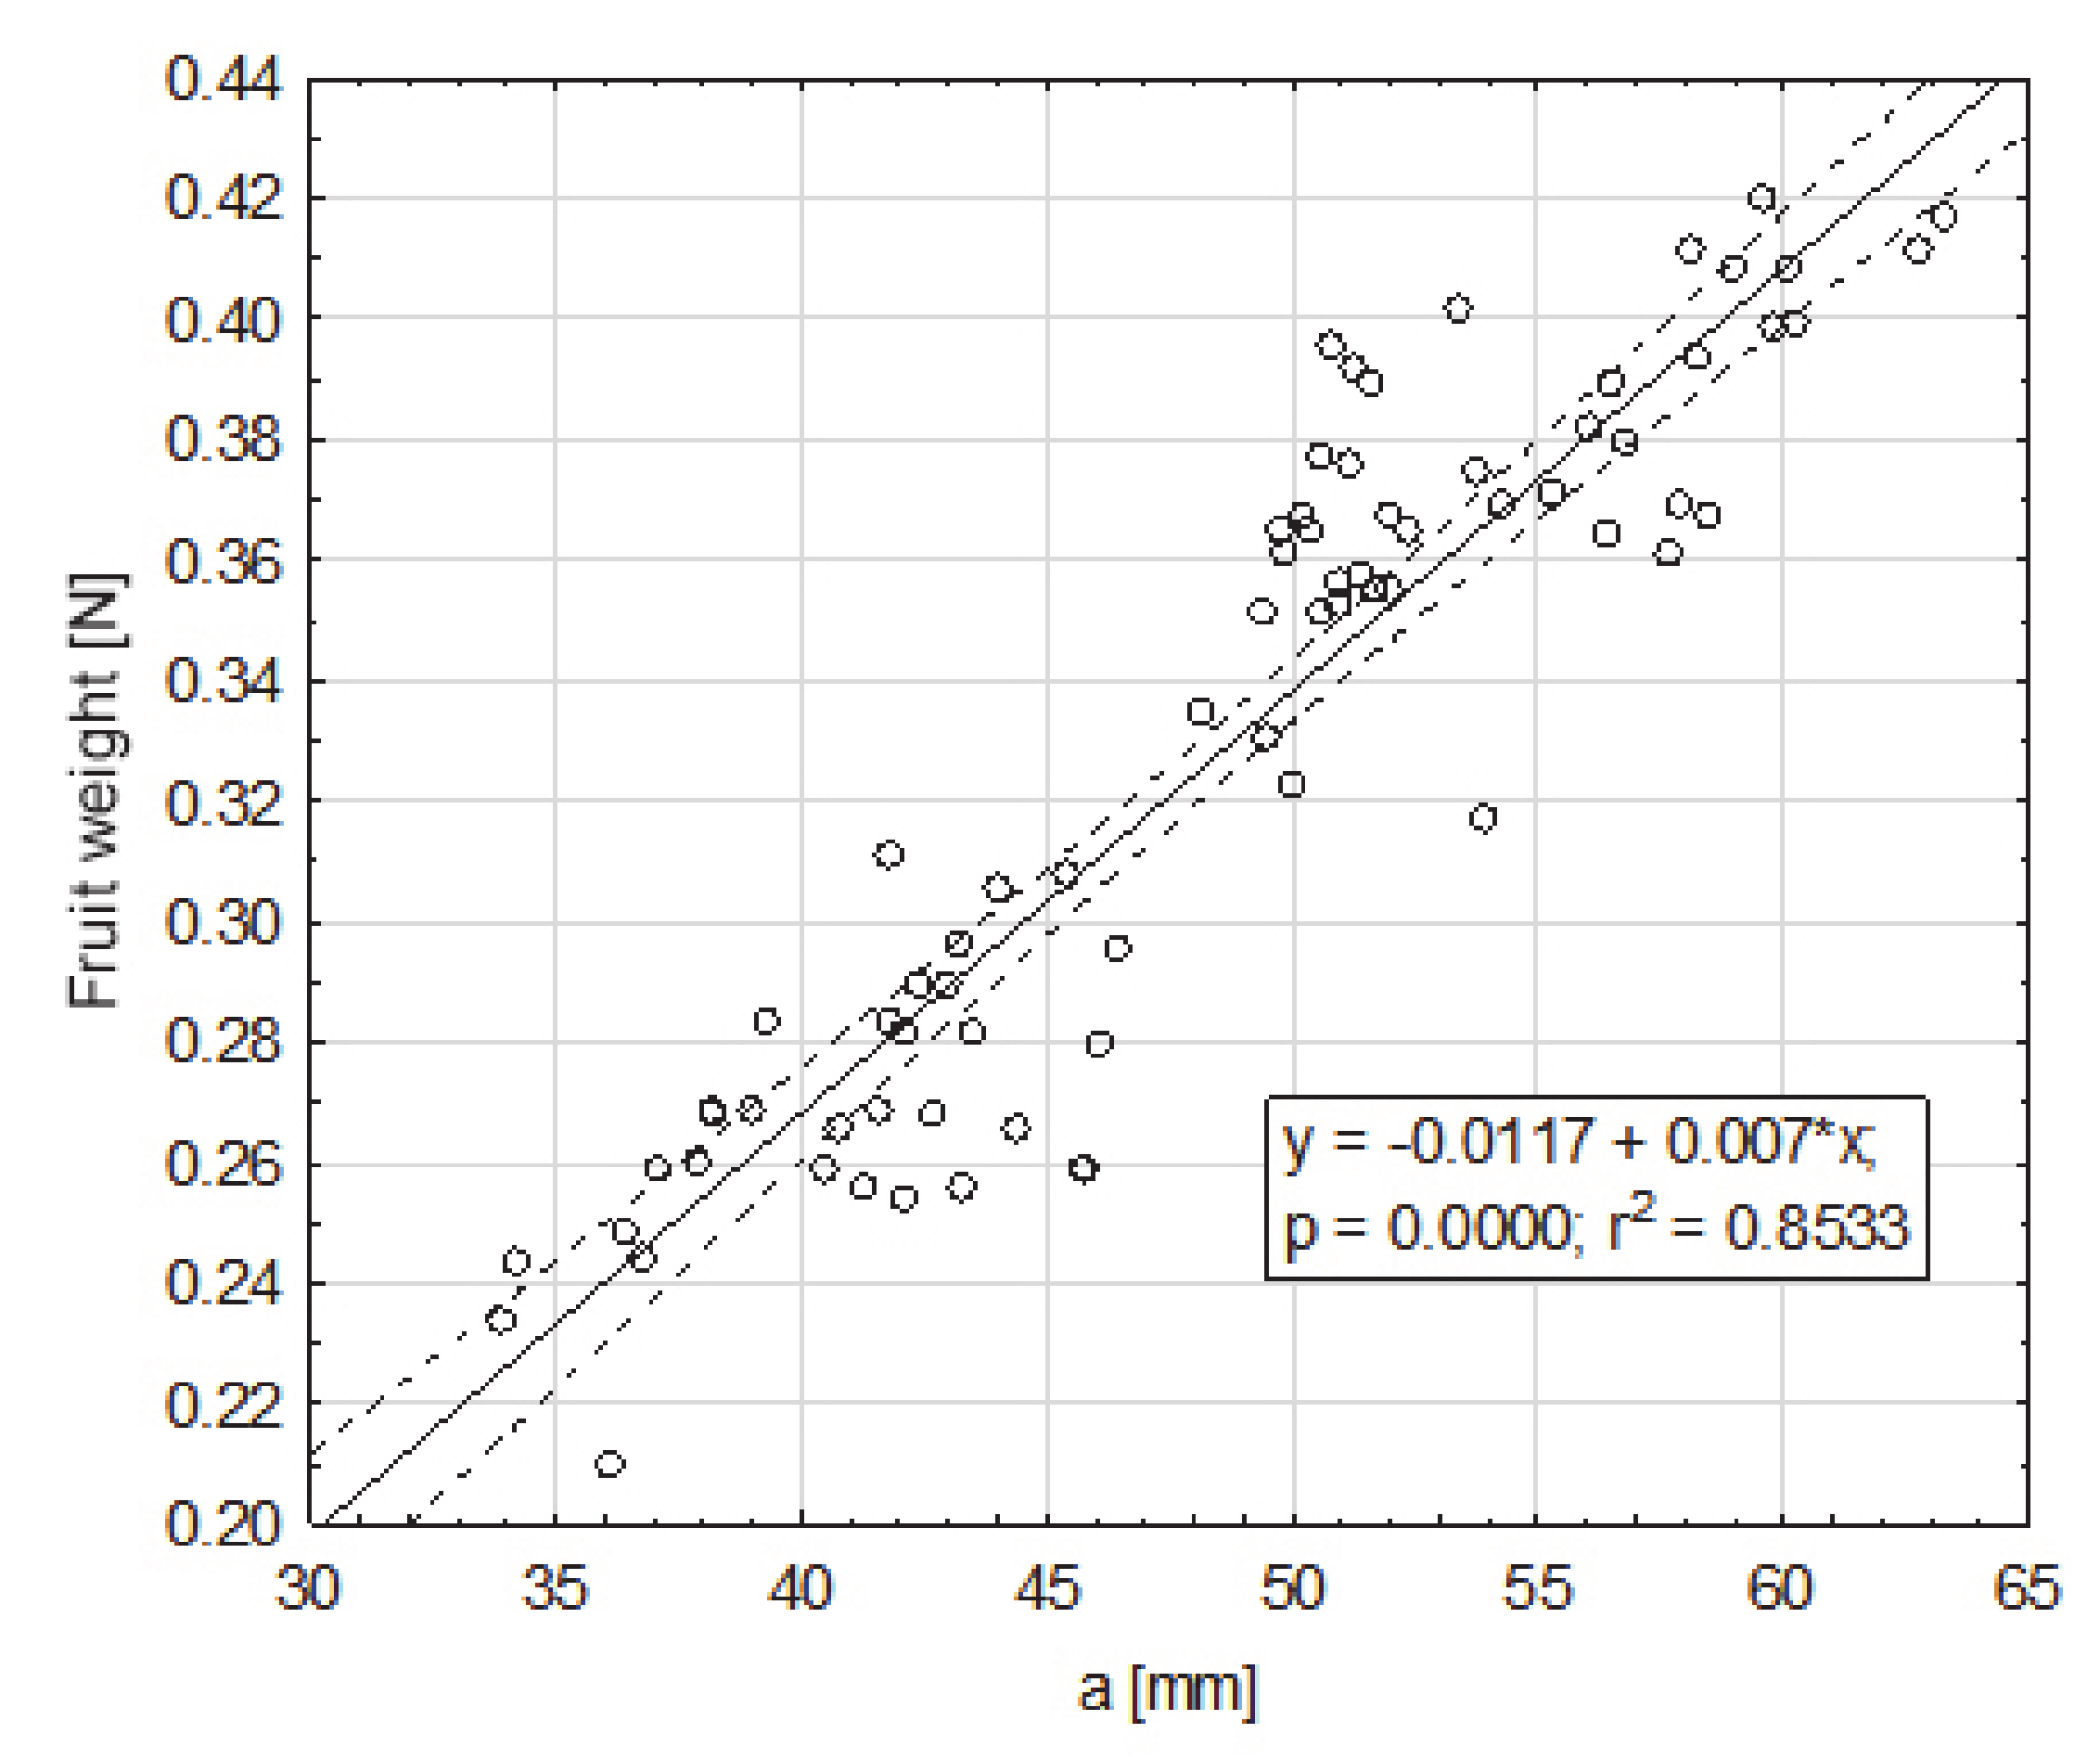
Figure 3.
Dependence of the weight of the fruit on dimension a (mm), smaller, from the cross-section to the axis extending between the apical part and the part of the fruit attachment, in the maximum place.
Figure 3.
Dependence of the weight of the fruit on dimension a (mm), smaller, from the cross-section to the axis extending between the apical part and the part of the fruit attachment, in the maximum place.
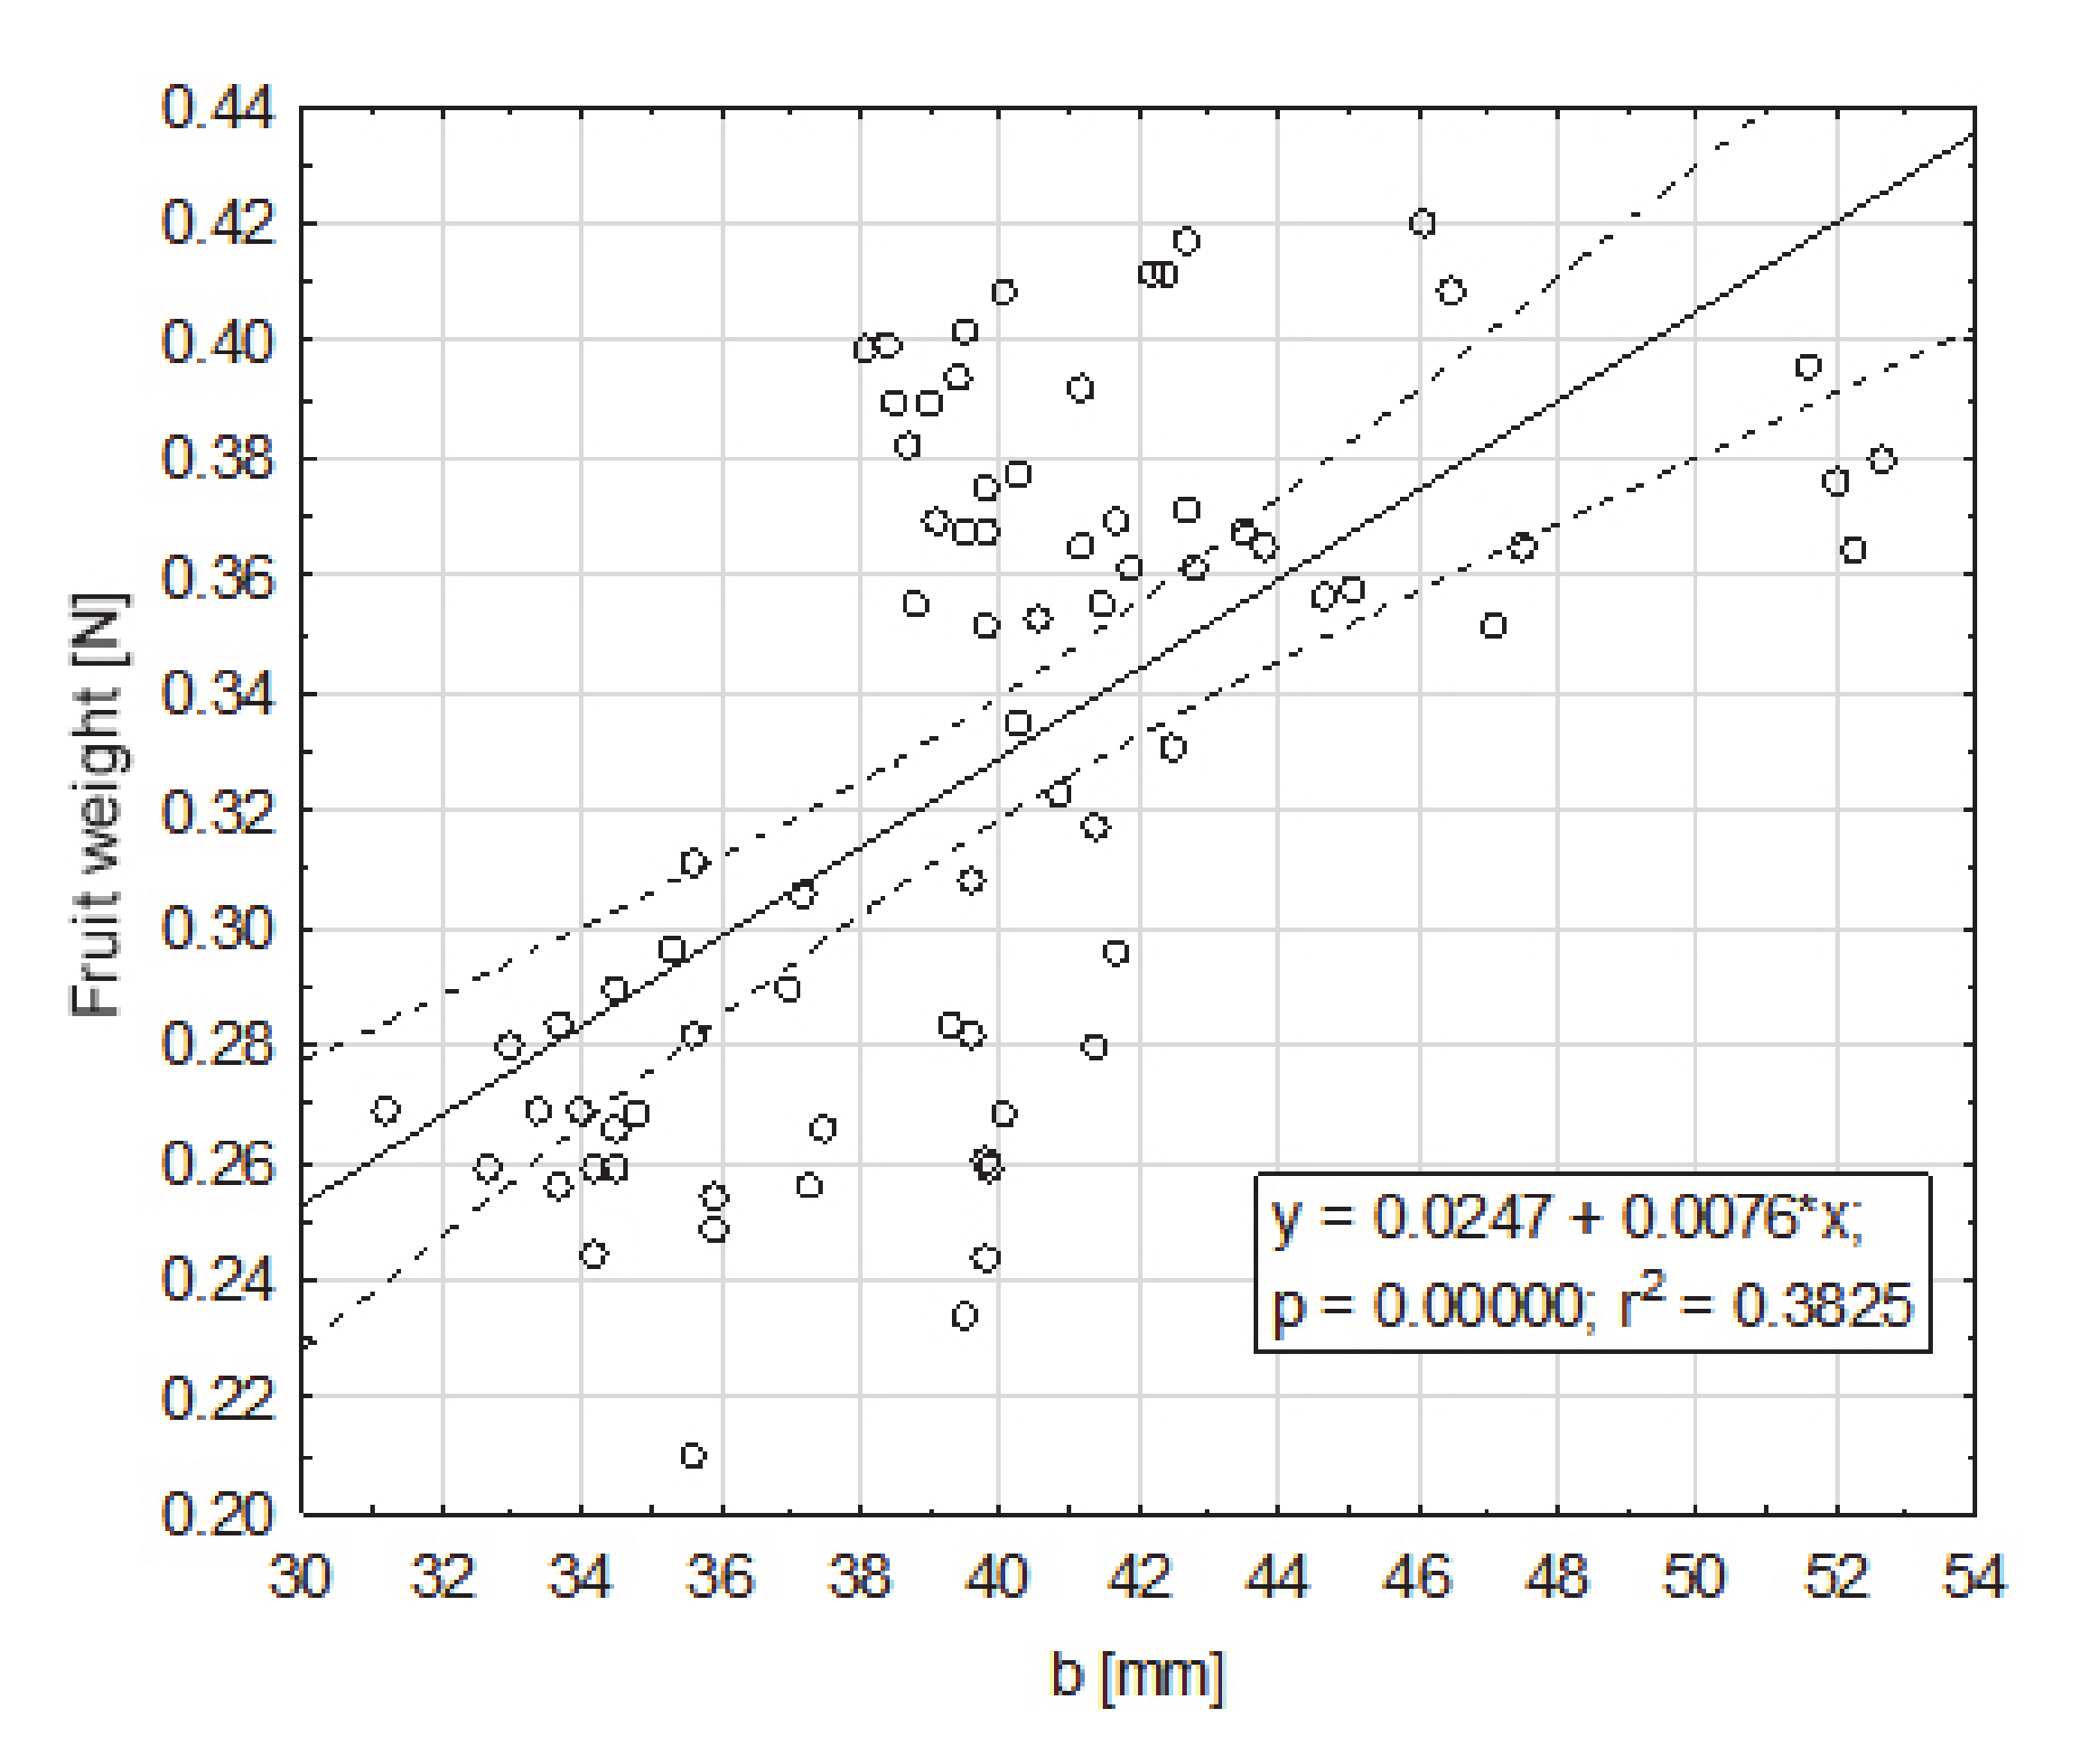
Figure 4.
Dependence of the fruit weight on dimension b (mm), greater, from the cross section to the axis contained between the apical part and the part of the fruit attachment, at the maximum place.
Figure 4.
Dependence of the fruit weight on dimension b (mm), greater, from the cross section to the axis contained between the apical part and the part of the fruit attachment, at the maximum place.
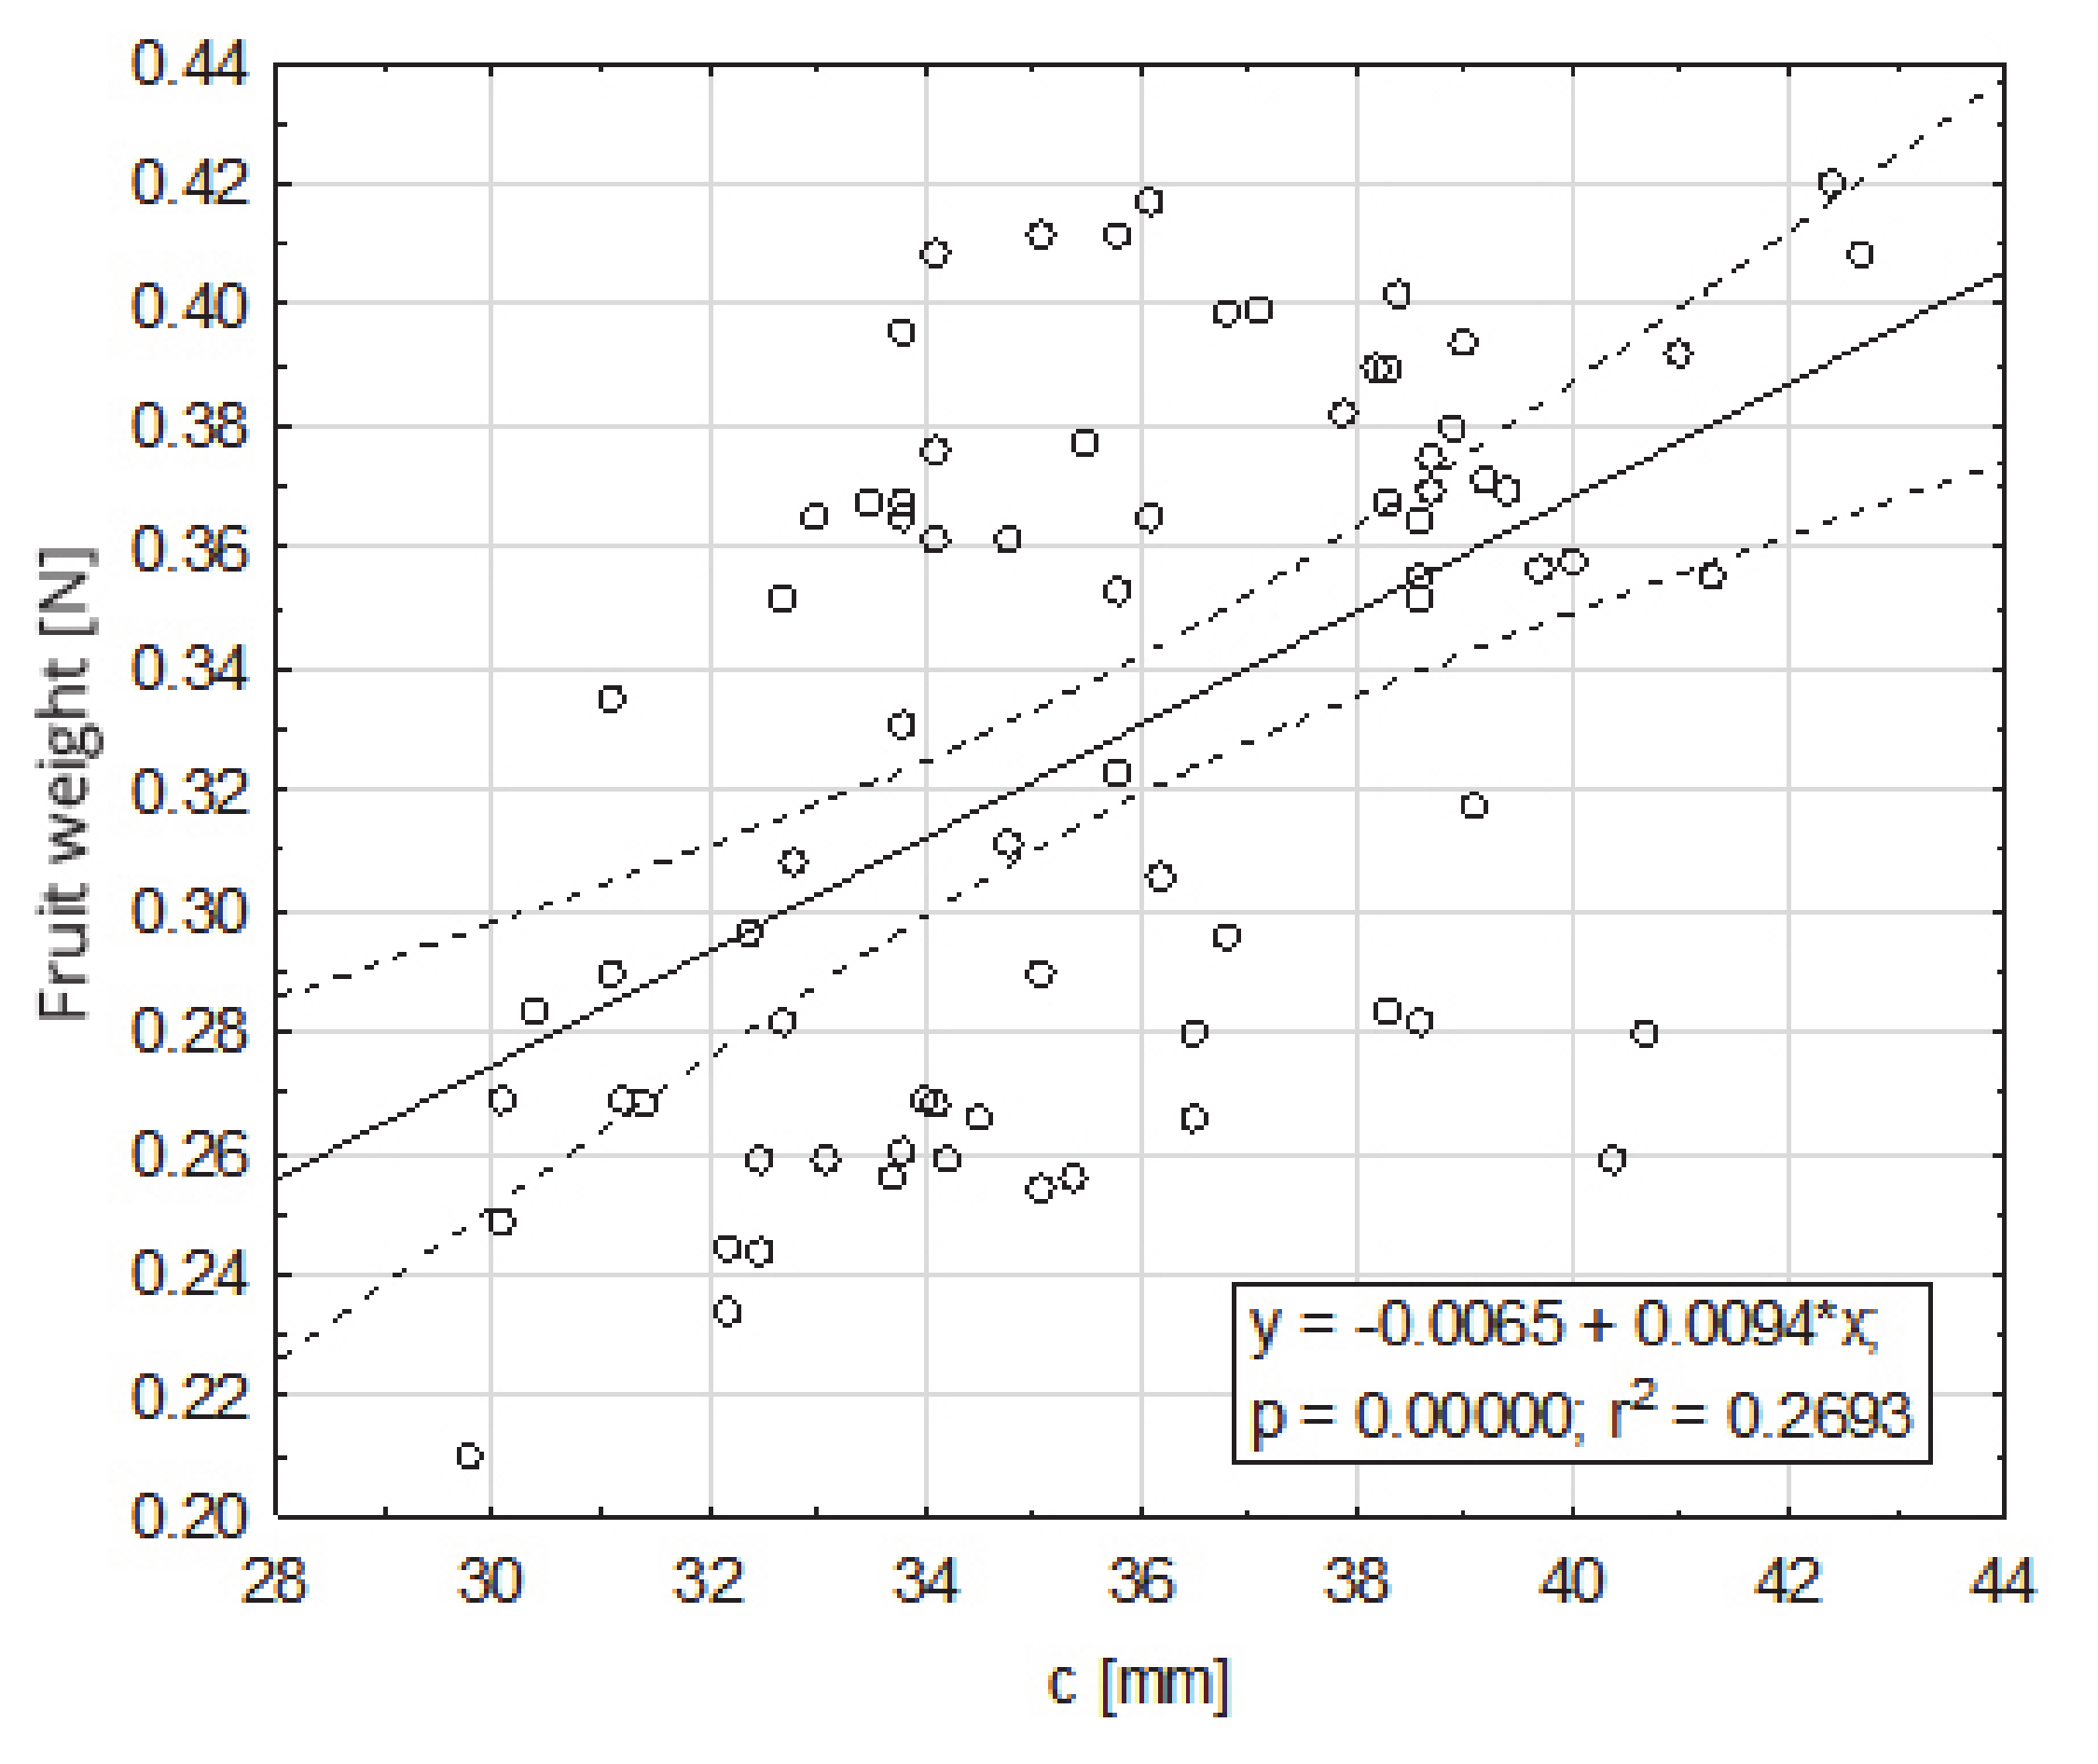
Figure 5.
Dependence of the fruit weight on dimension c (mm), contained between the top of the fruit and the fruit attachment.
Figure 5.
Dependence of the fruit weight on dimension c (mm), contained between the top of the fruit and the fruit attachment.
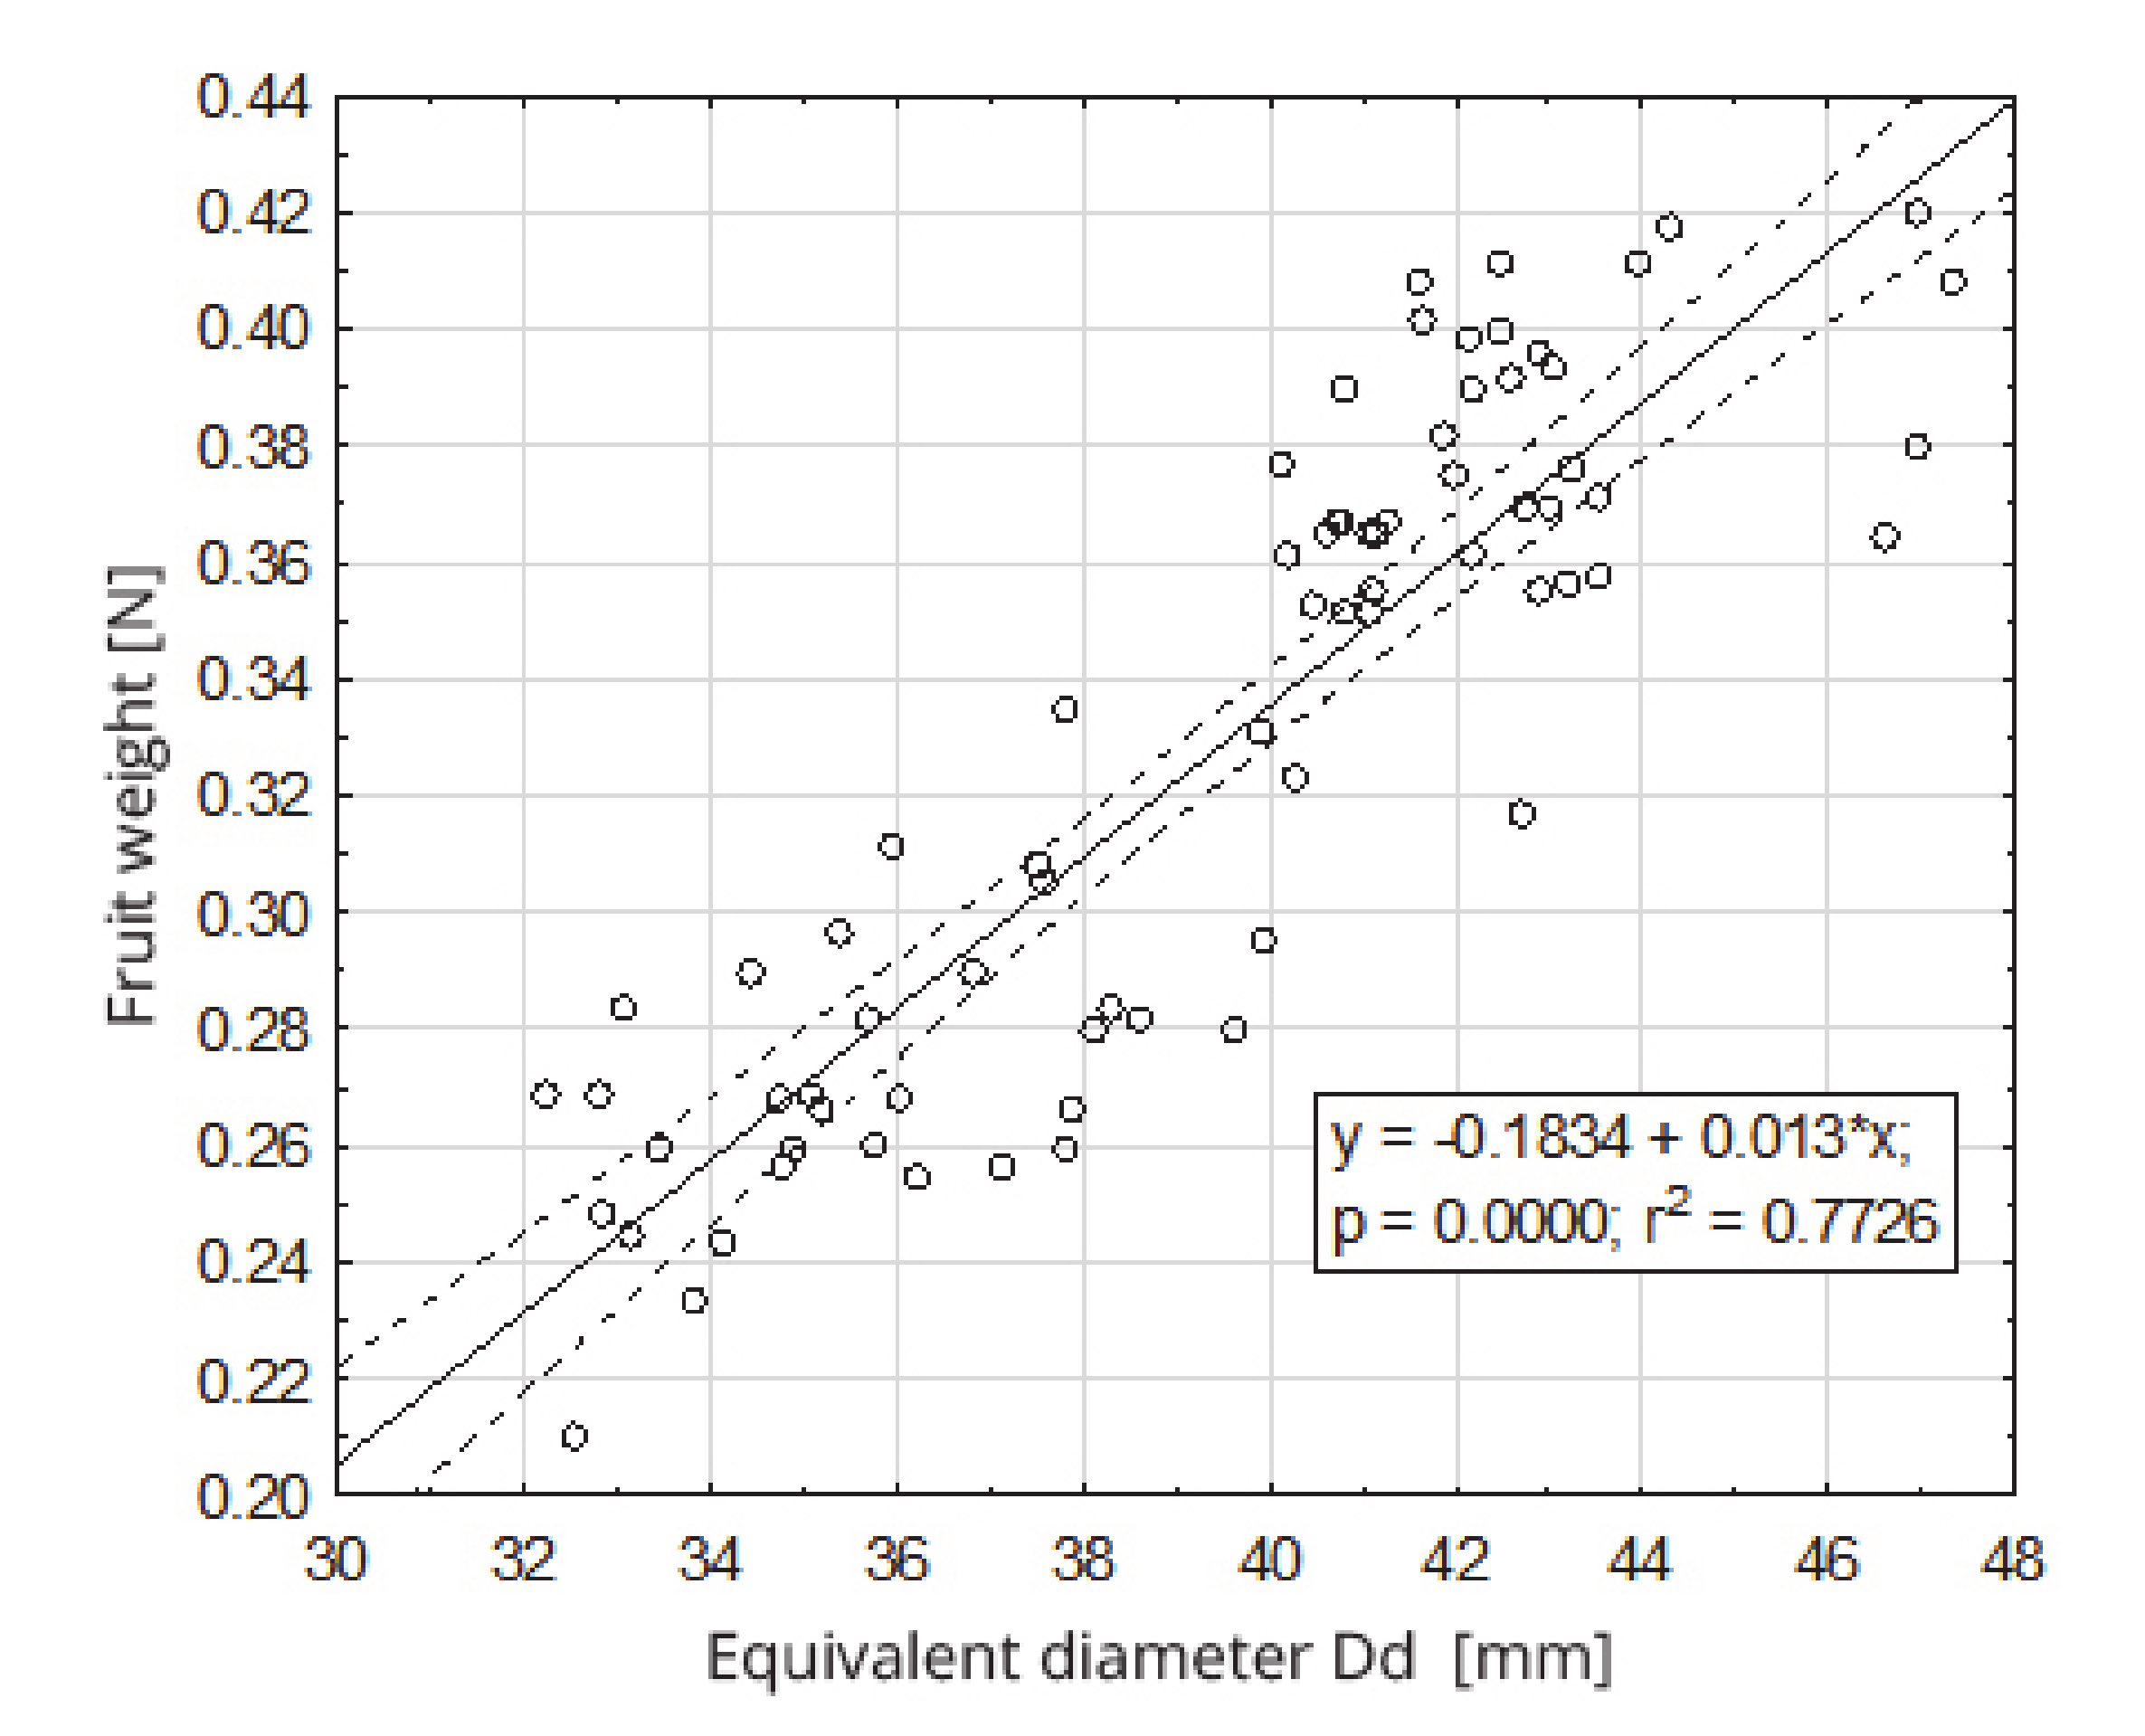
Figure 6.
Dependence of the fruit weight on the equivalent diameter.
Figure 6.
Dependence of the fruit weight on the equivalent diameter.
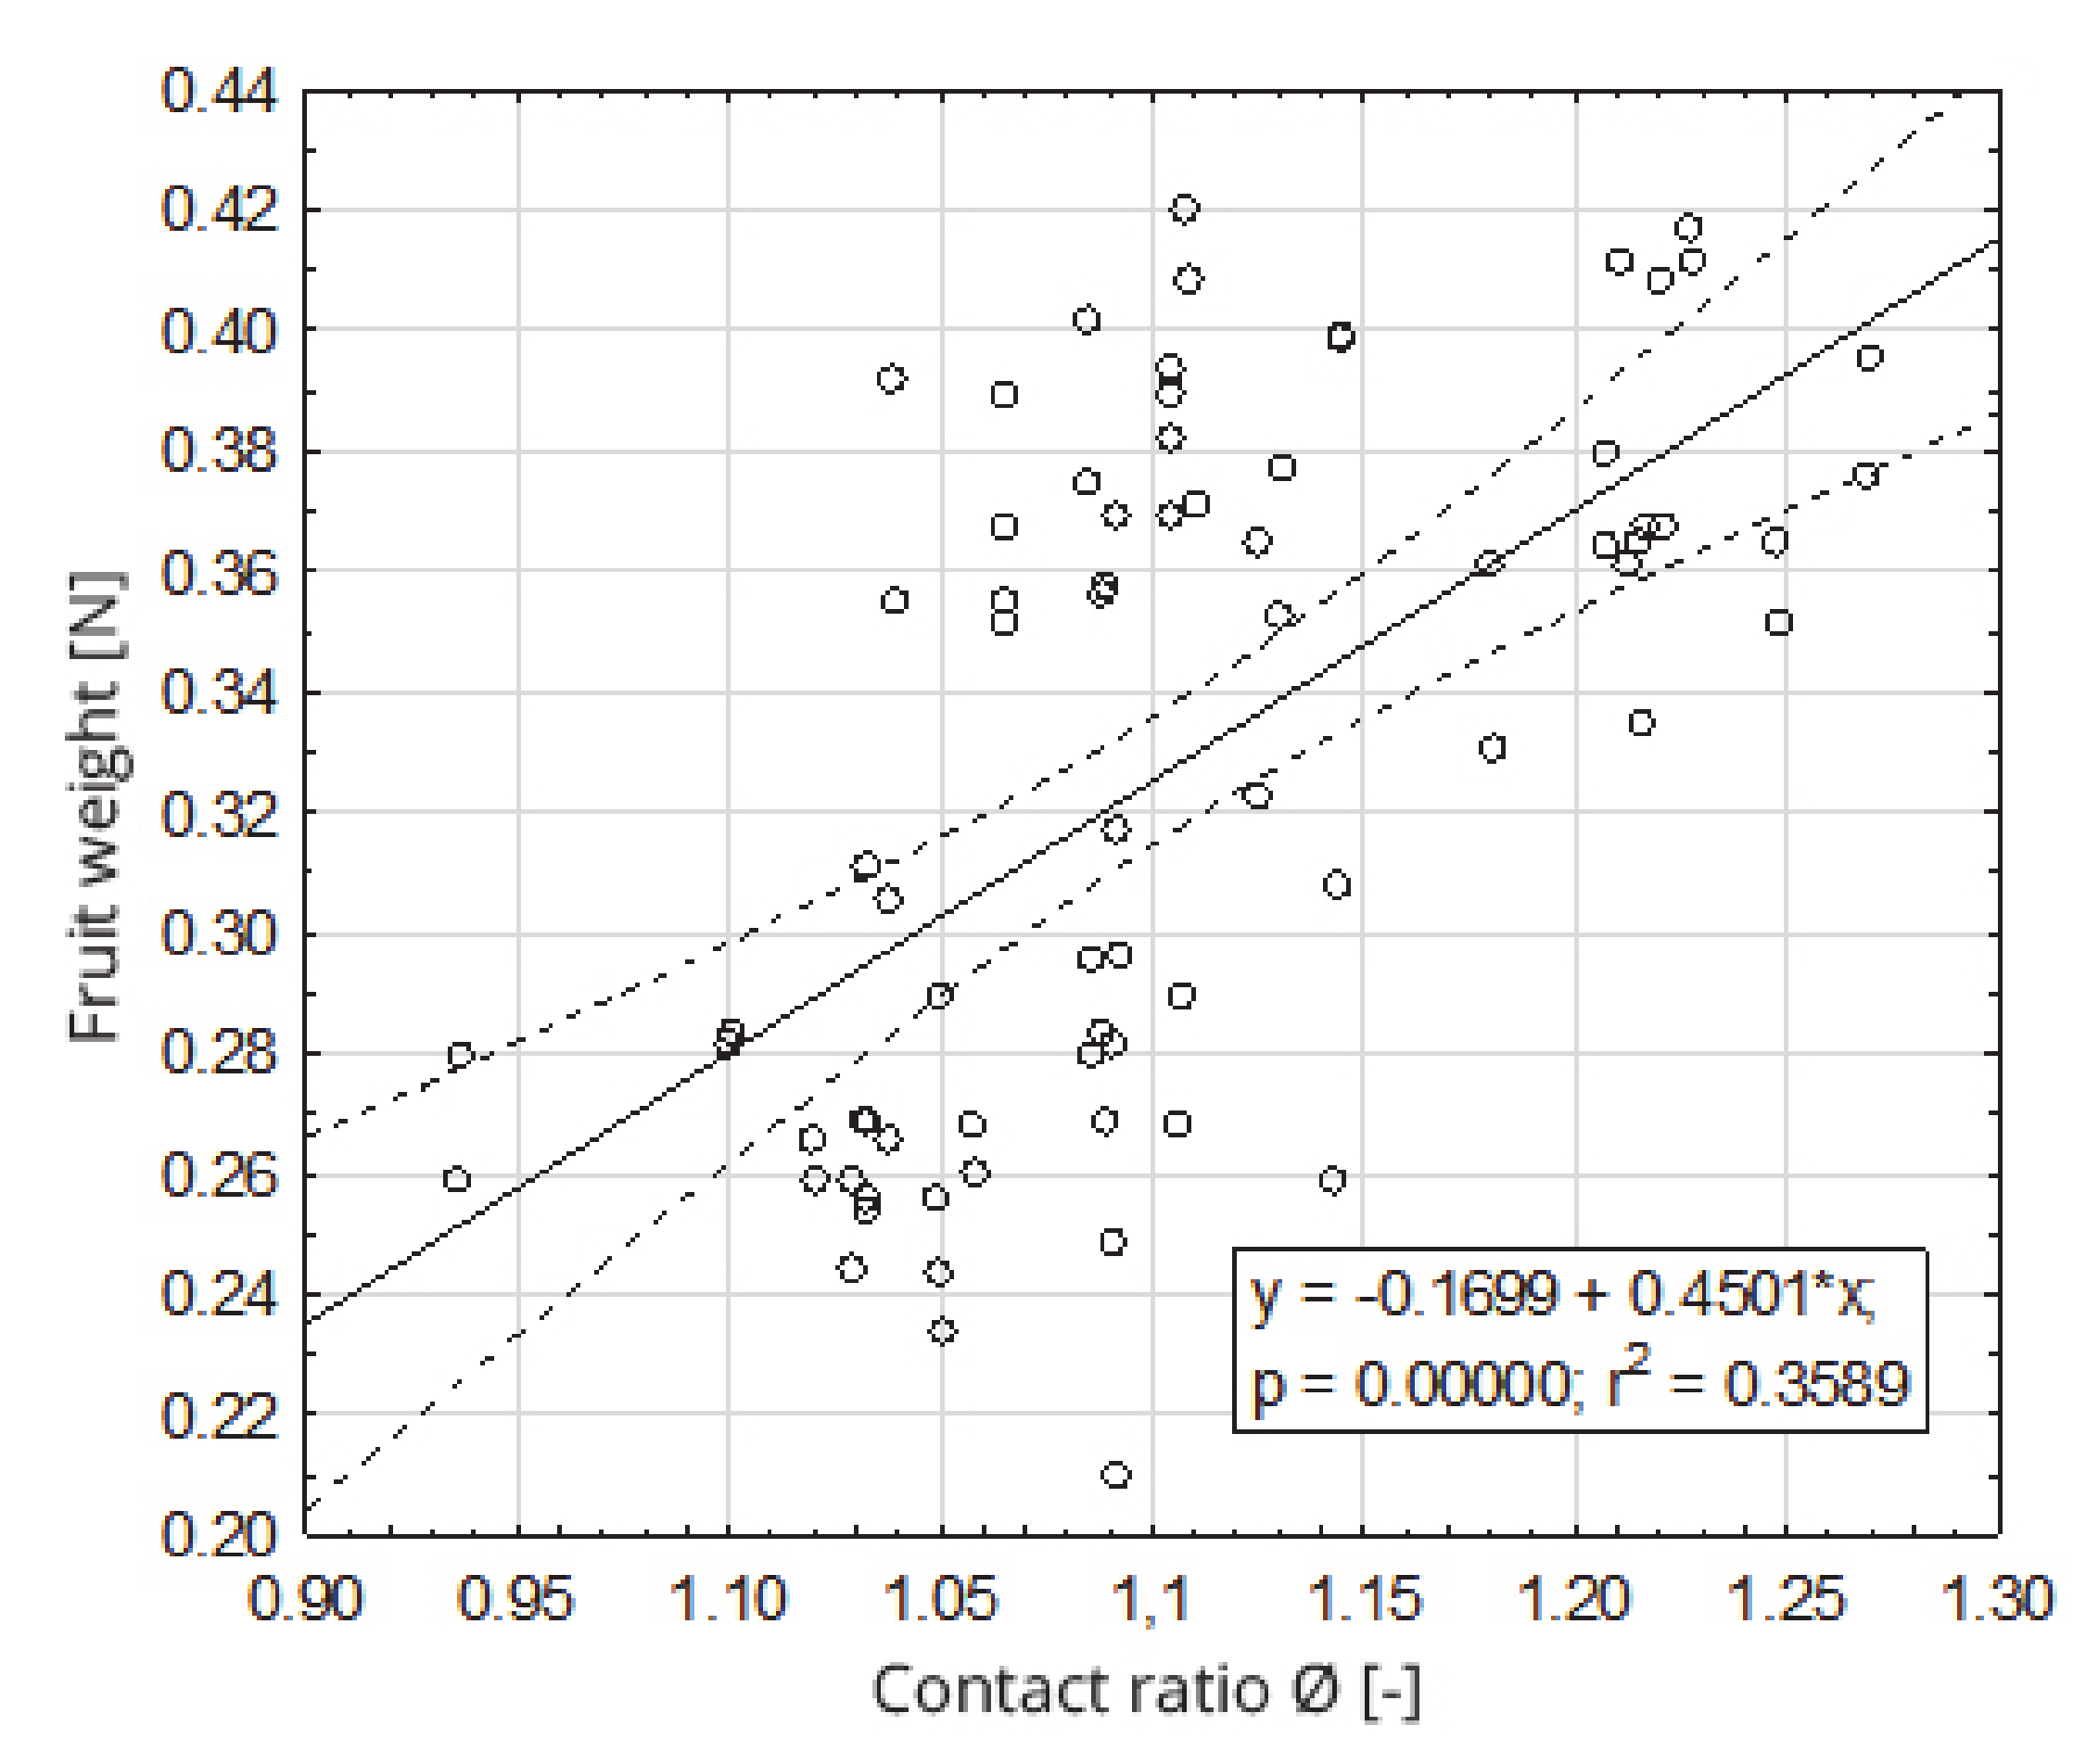
Figure 7.
Dependence of the fruit weight on the sphericity coefficient.
Figure 7.
Dependence of the fruit weight on the sphericity coefficient.
Figure 8.
Impact of the type of suction cups on the value of the suction force of strawberry fruit.
Figure 8.
Impact of the type of suction cups on the value of the suction force of strawberry fruit.
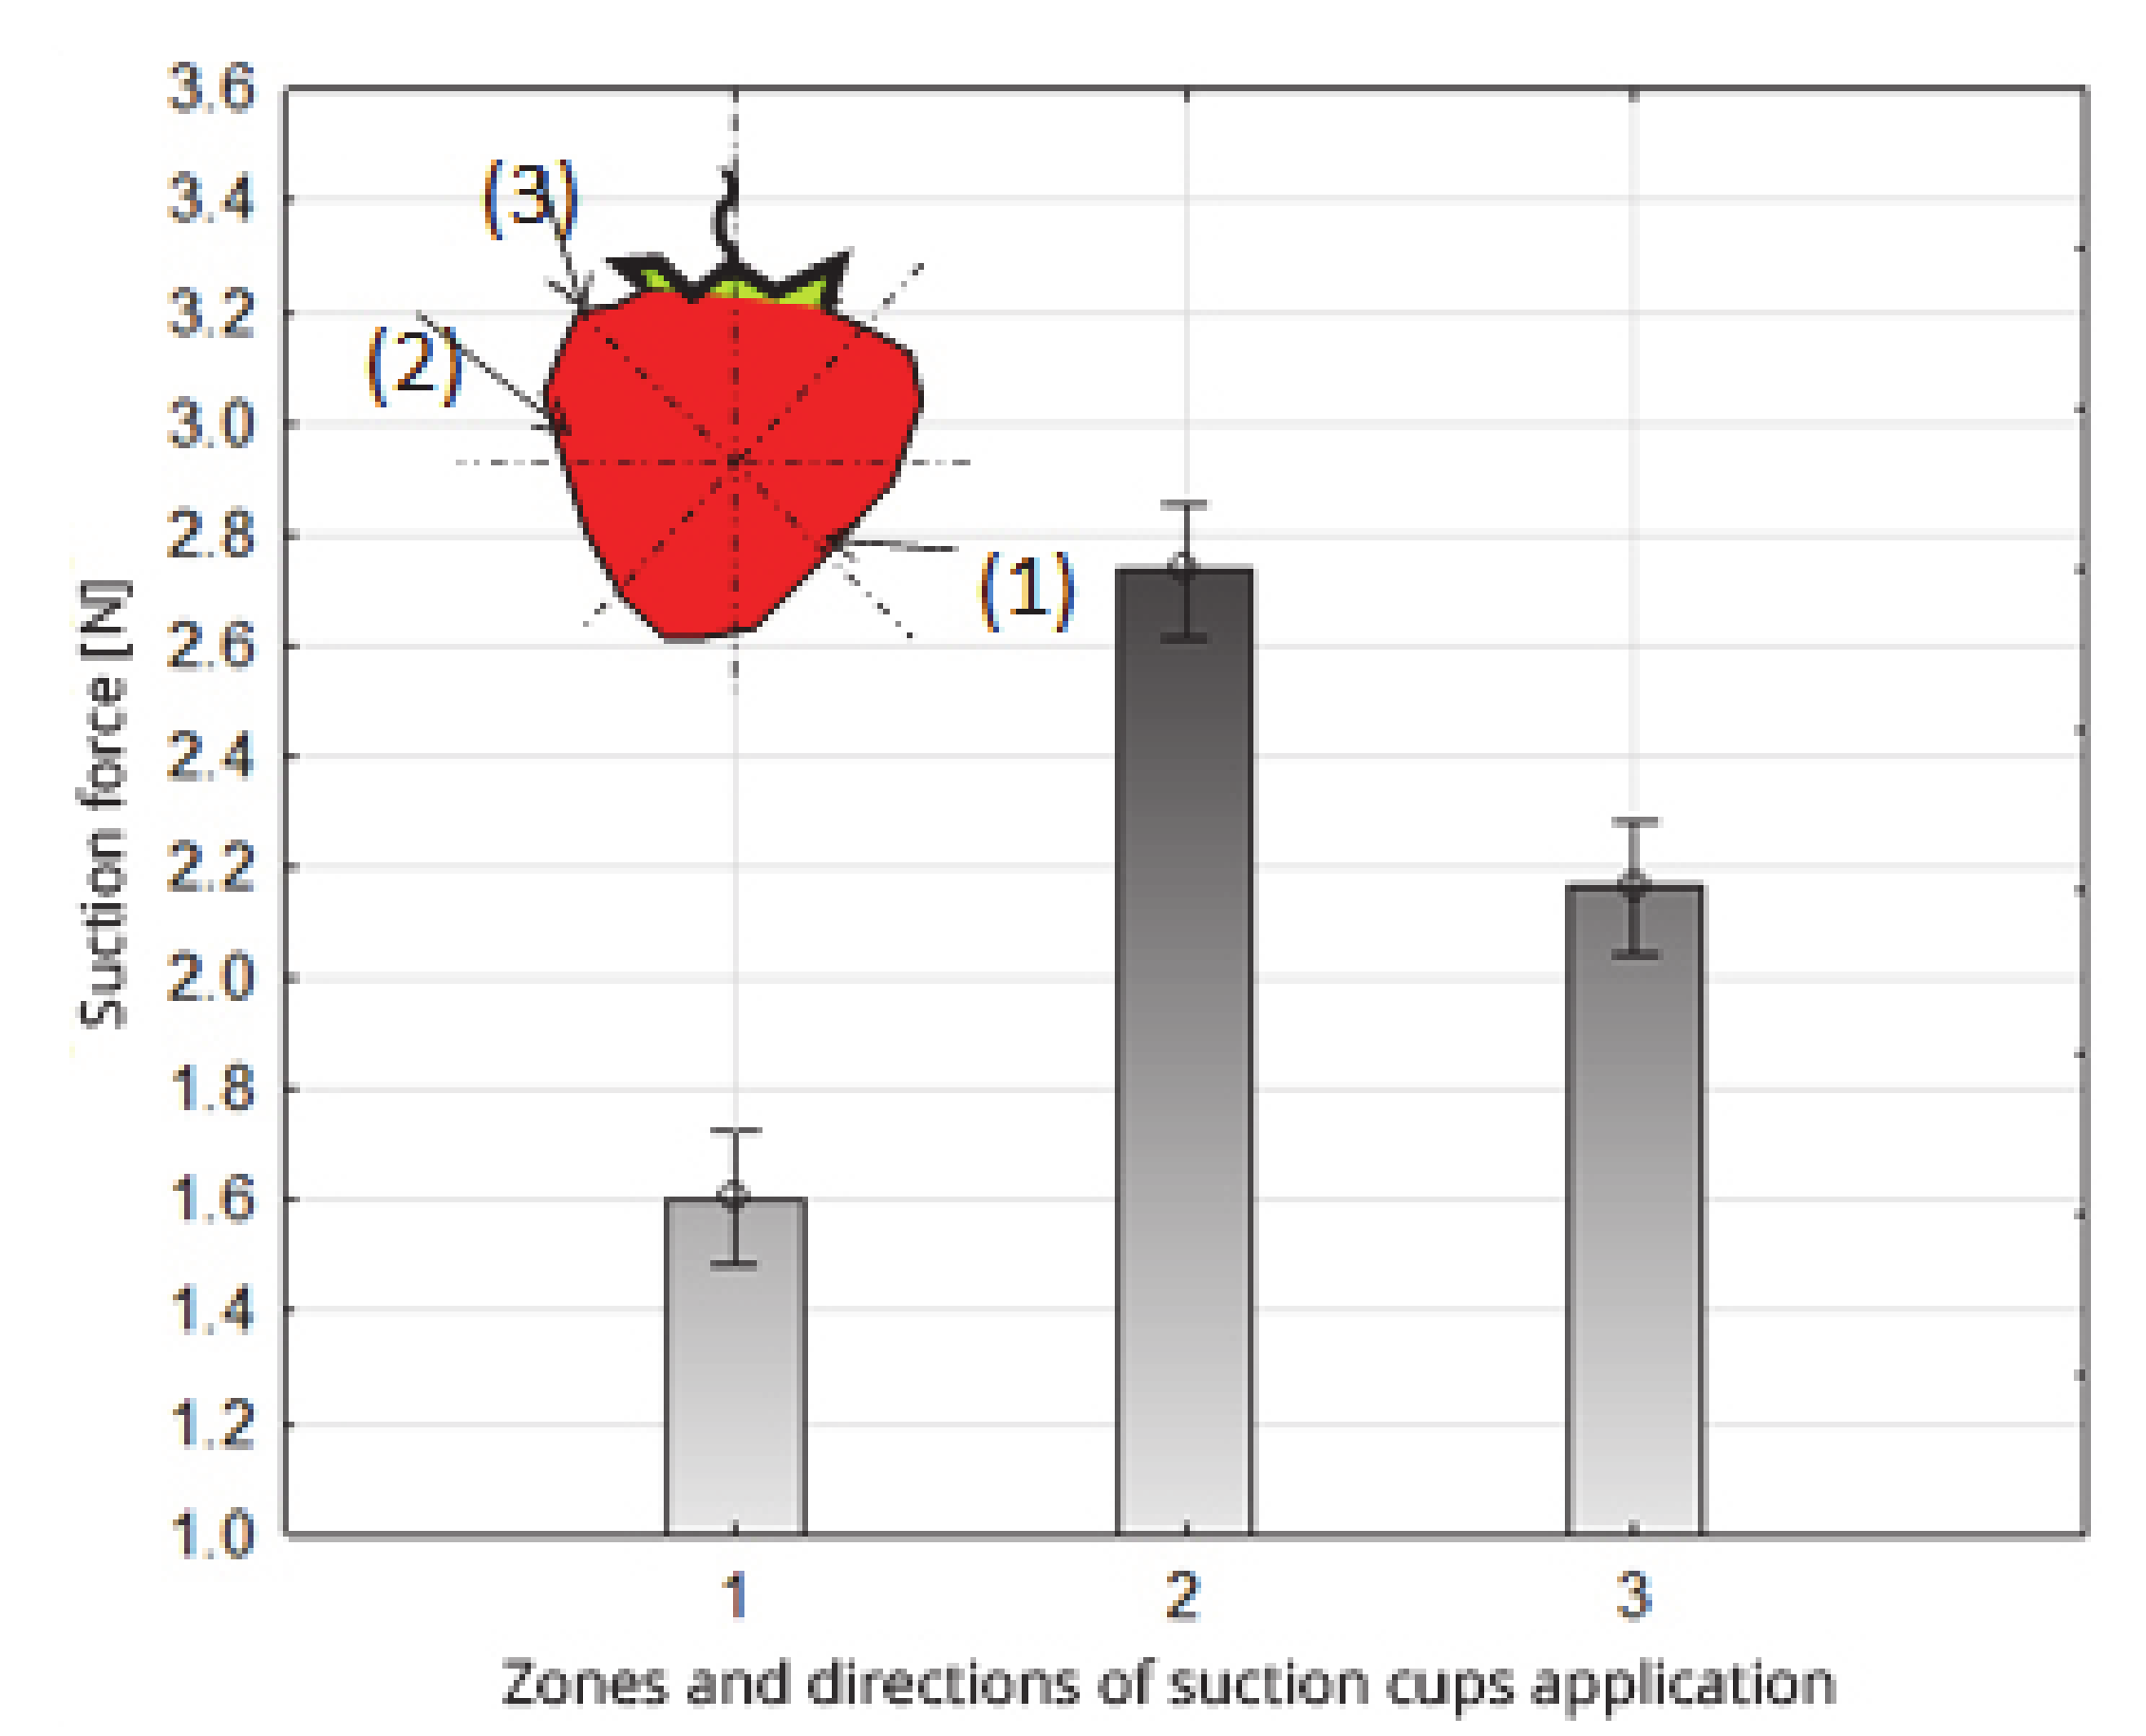
Figure 9.
Impact of the zones and directions of suction cup application on the value of the suction force of the strawberry fruit.
Figure 9.
Impact of the zones and directions of suction cup application on the value of the suction force of the strawberry fruit.
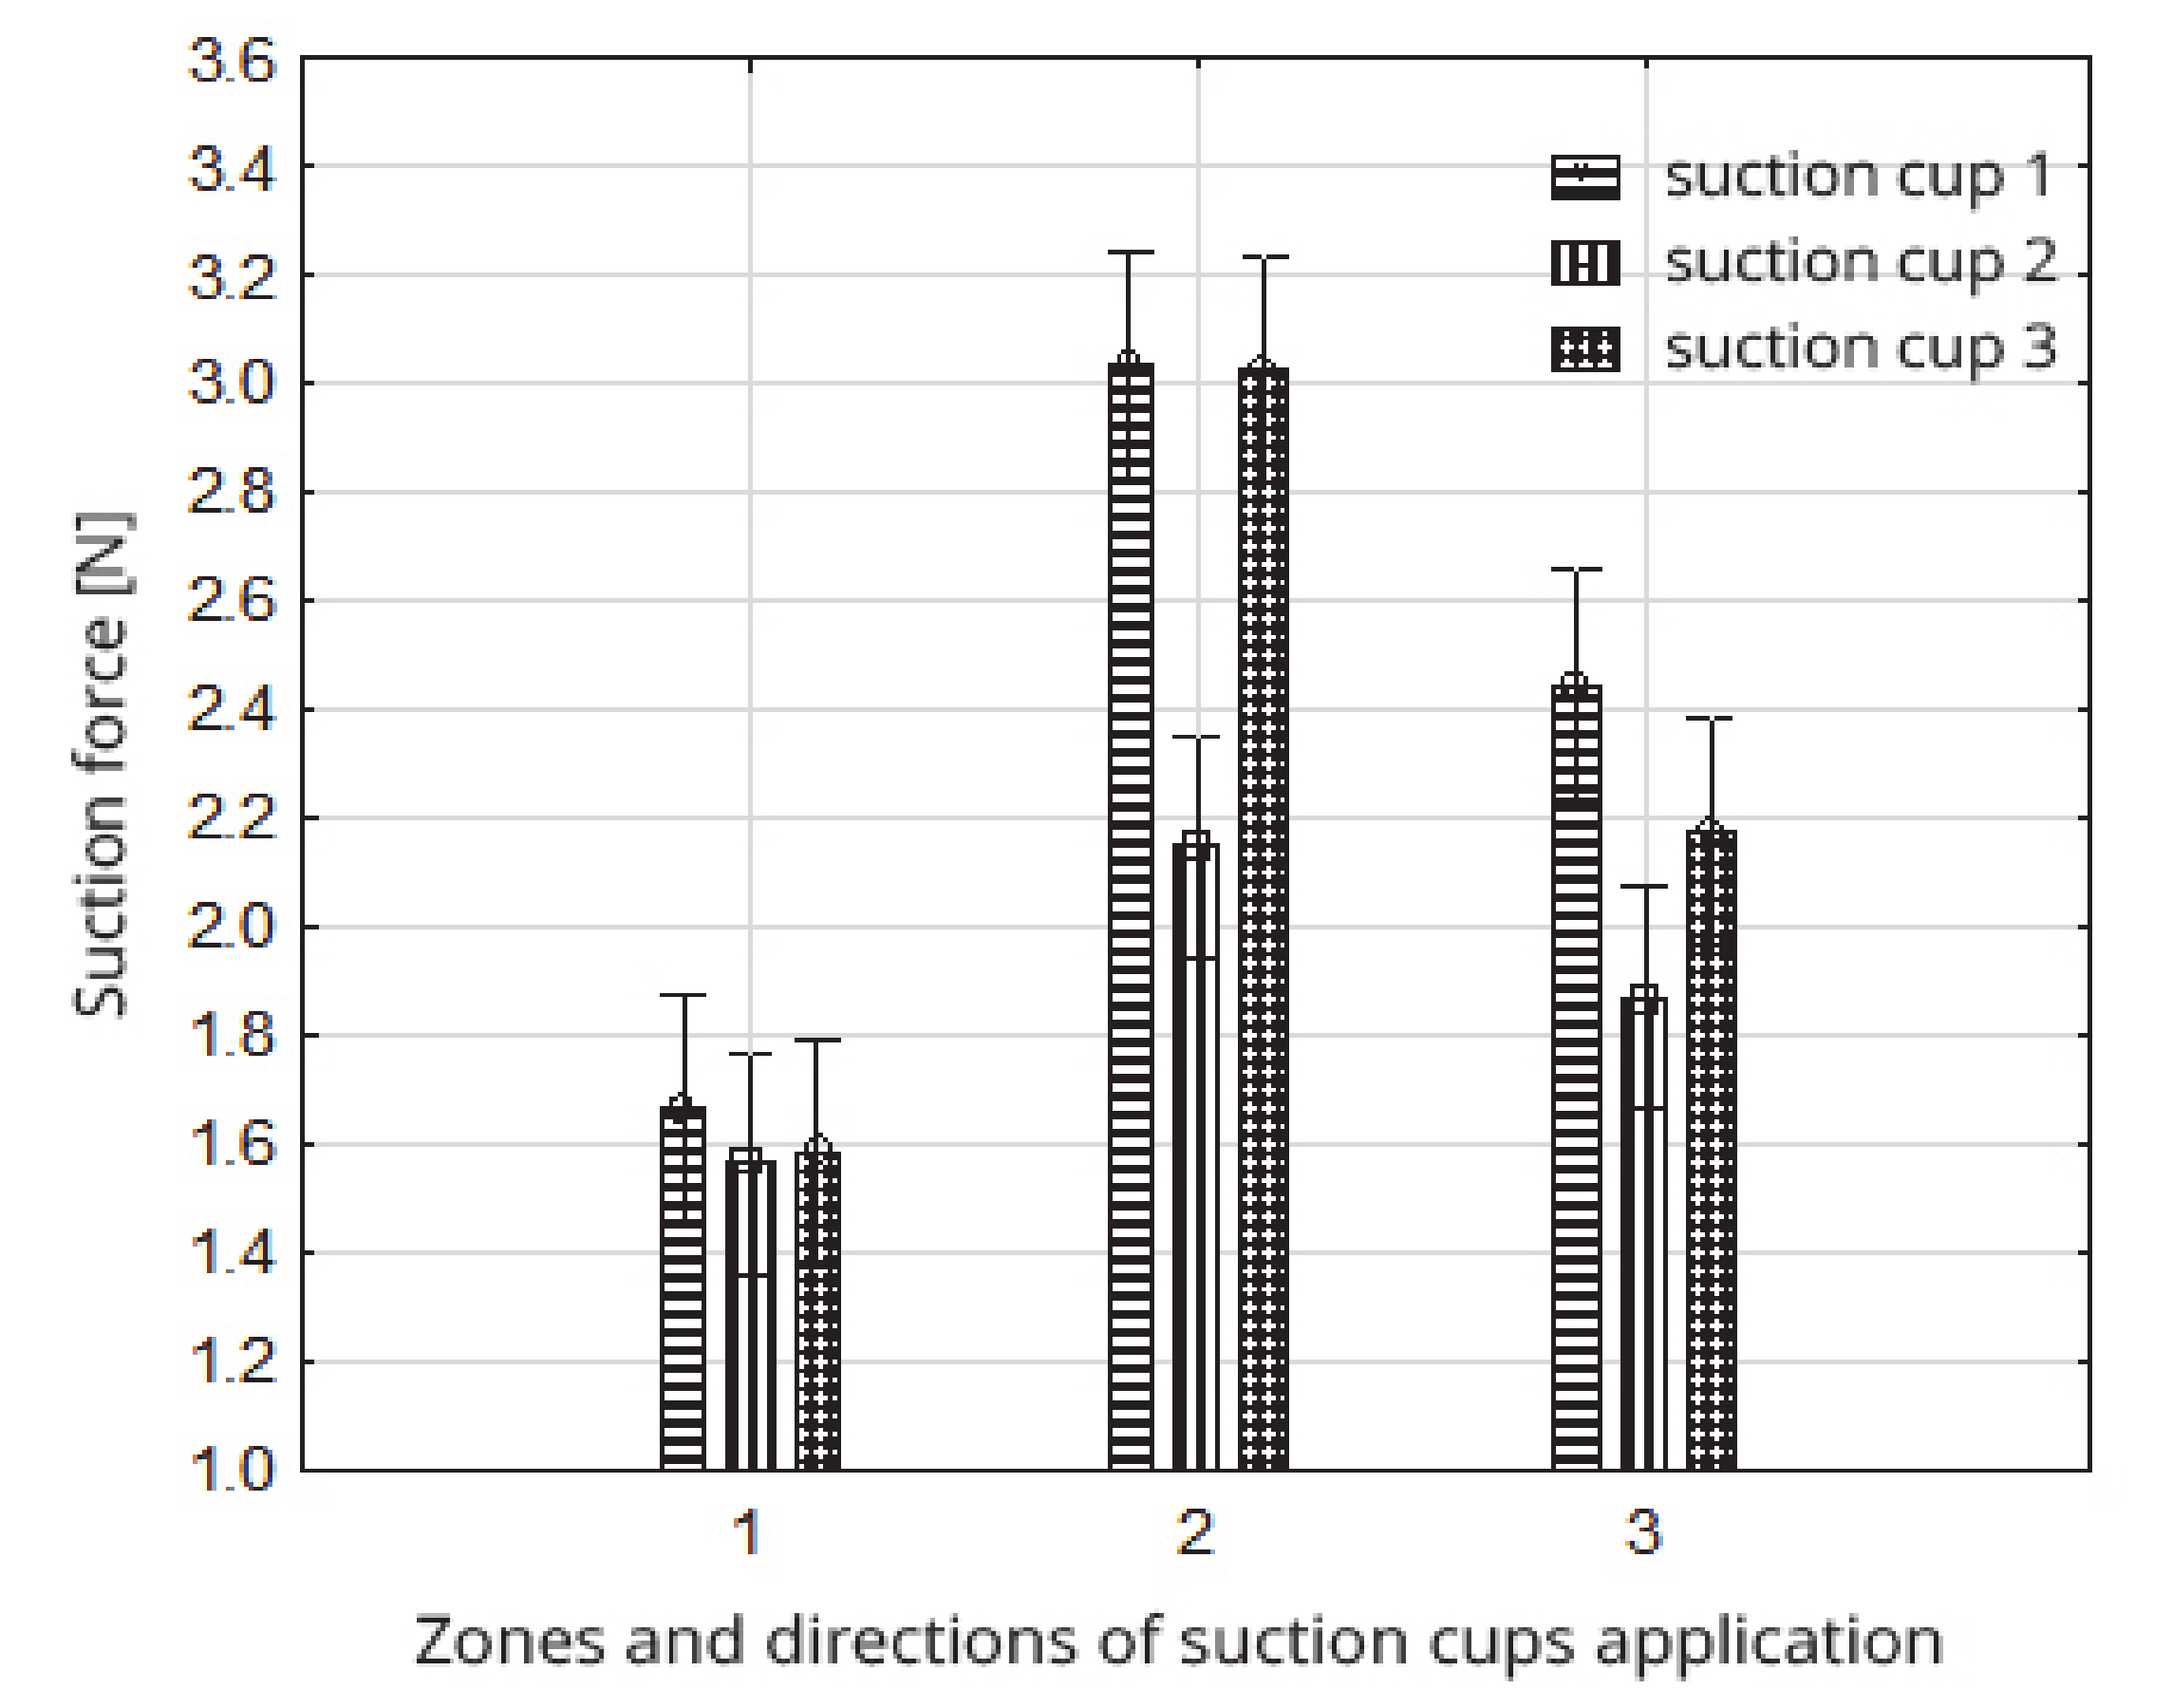
Figure 10.
Impact of the zones and directions of suction cup application on the value of the strawberry fruit suction force within the type of suction cups.
Figure 10.
Impact of the zones and directions of suction cup application on the value of the strawberry fruit suction force within the type of suction cups.
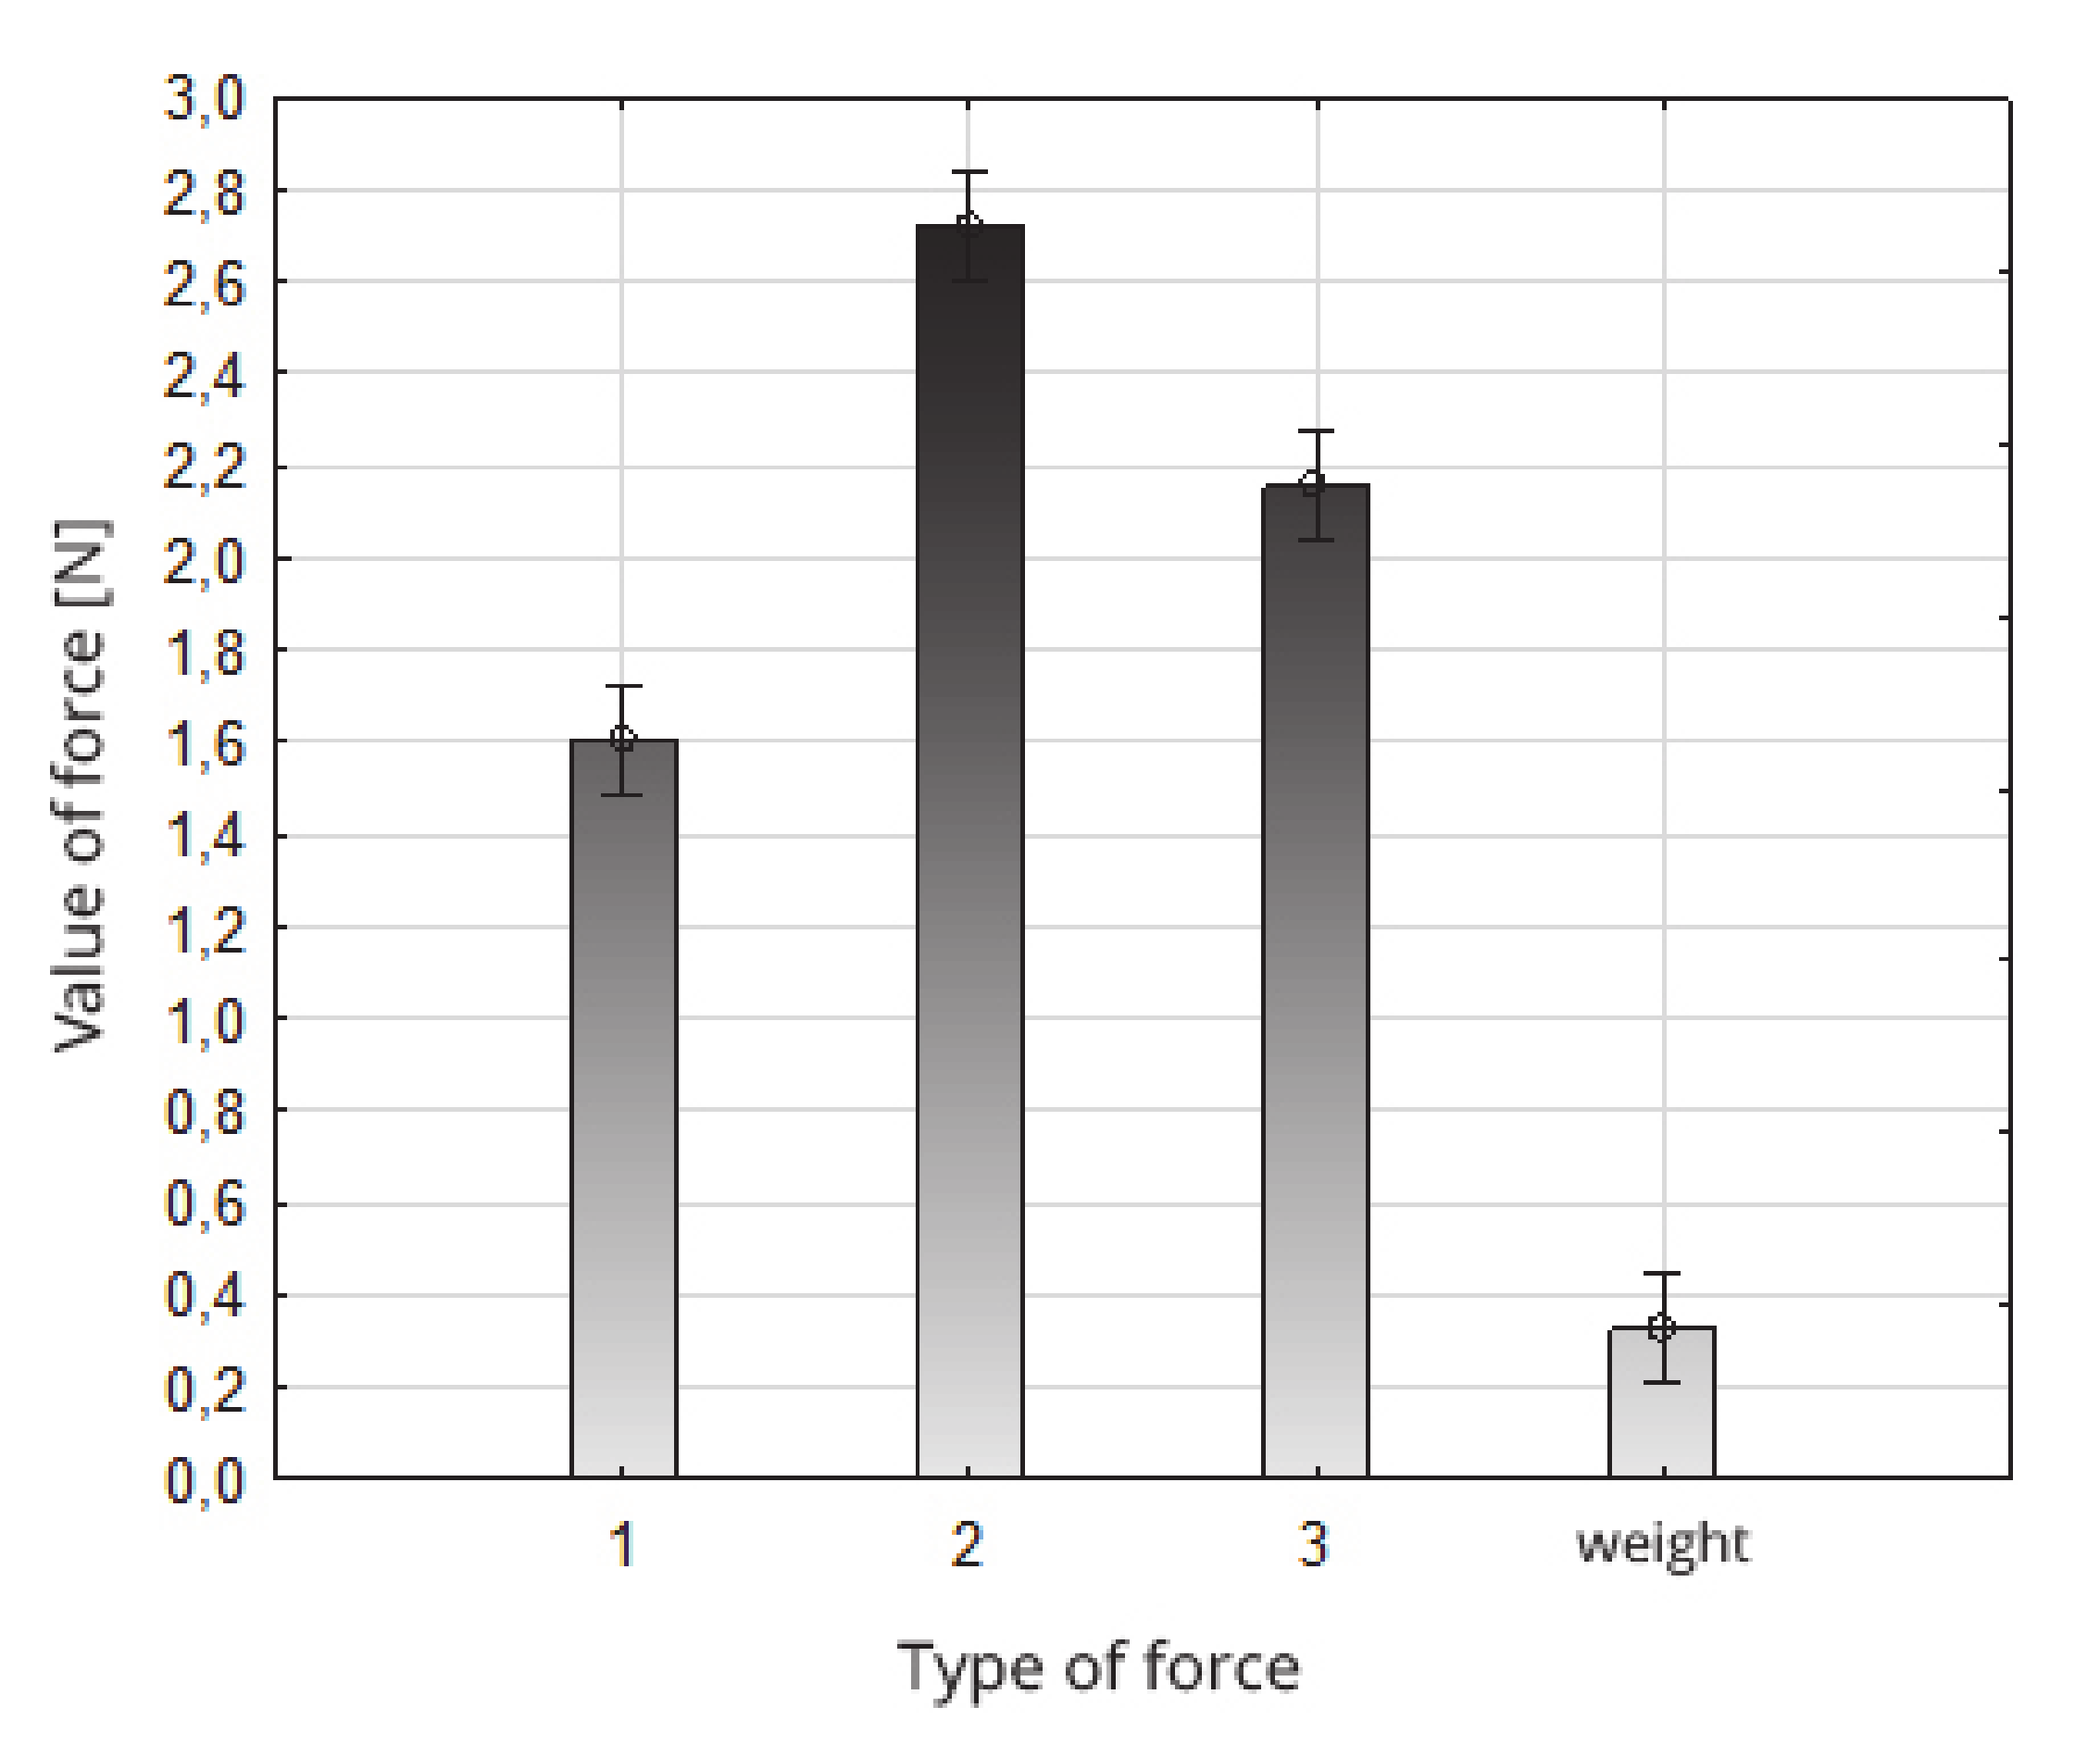
Figure 11.
Comparison of strawberry fruit suction forces in zones and suction directions 1–3 with their weight.
Figure 11.
Comparison of strawberry fruit suction forces in zones and suction directions 1–3 with their weight.
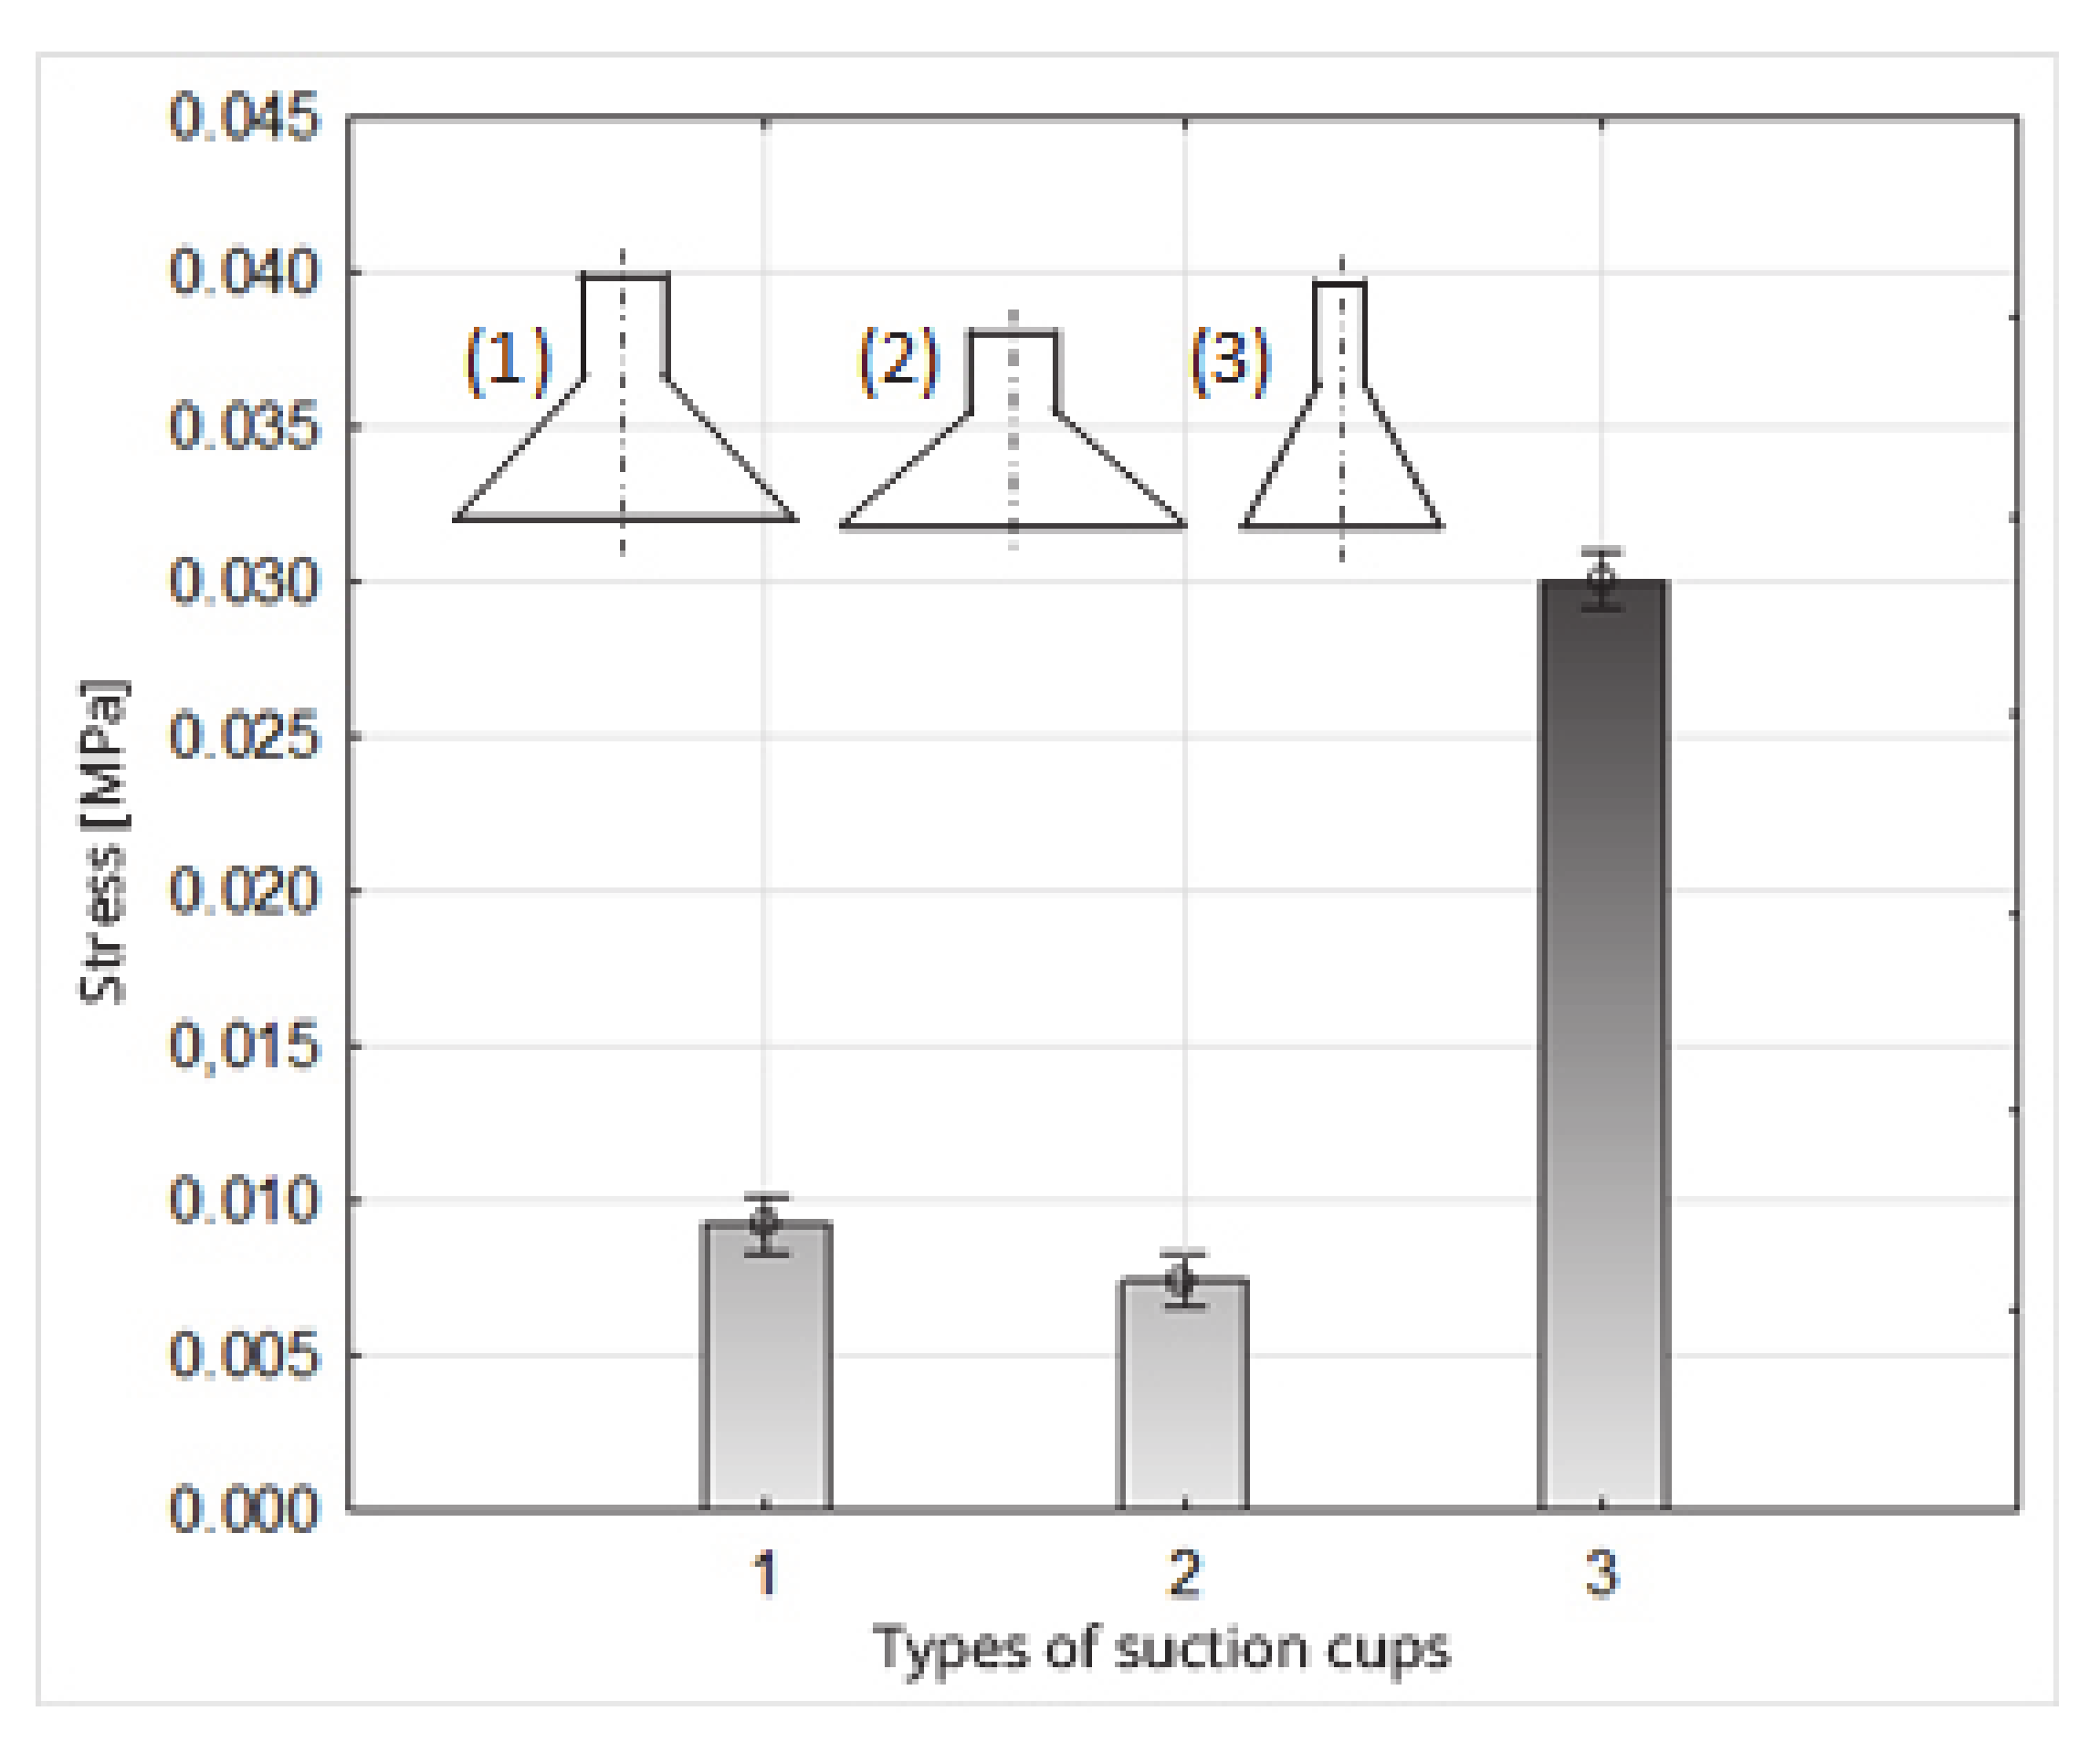
Figure 12.
Influence of the type of suction cup on the stress value.
Figure 12.
Influence of the type of suction cup on the stress value.
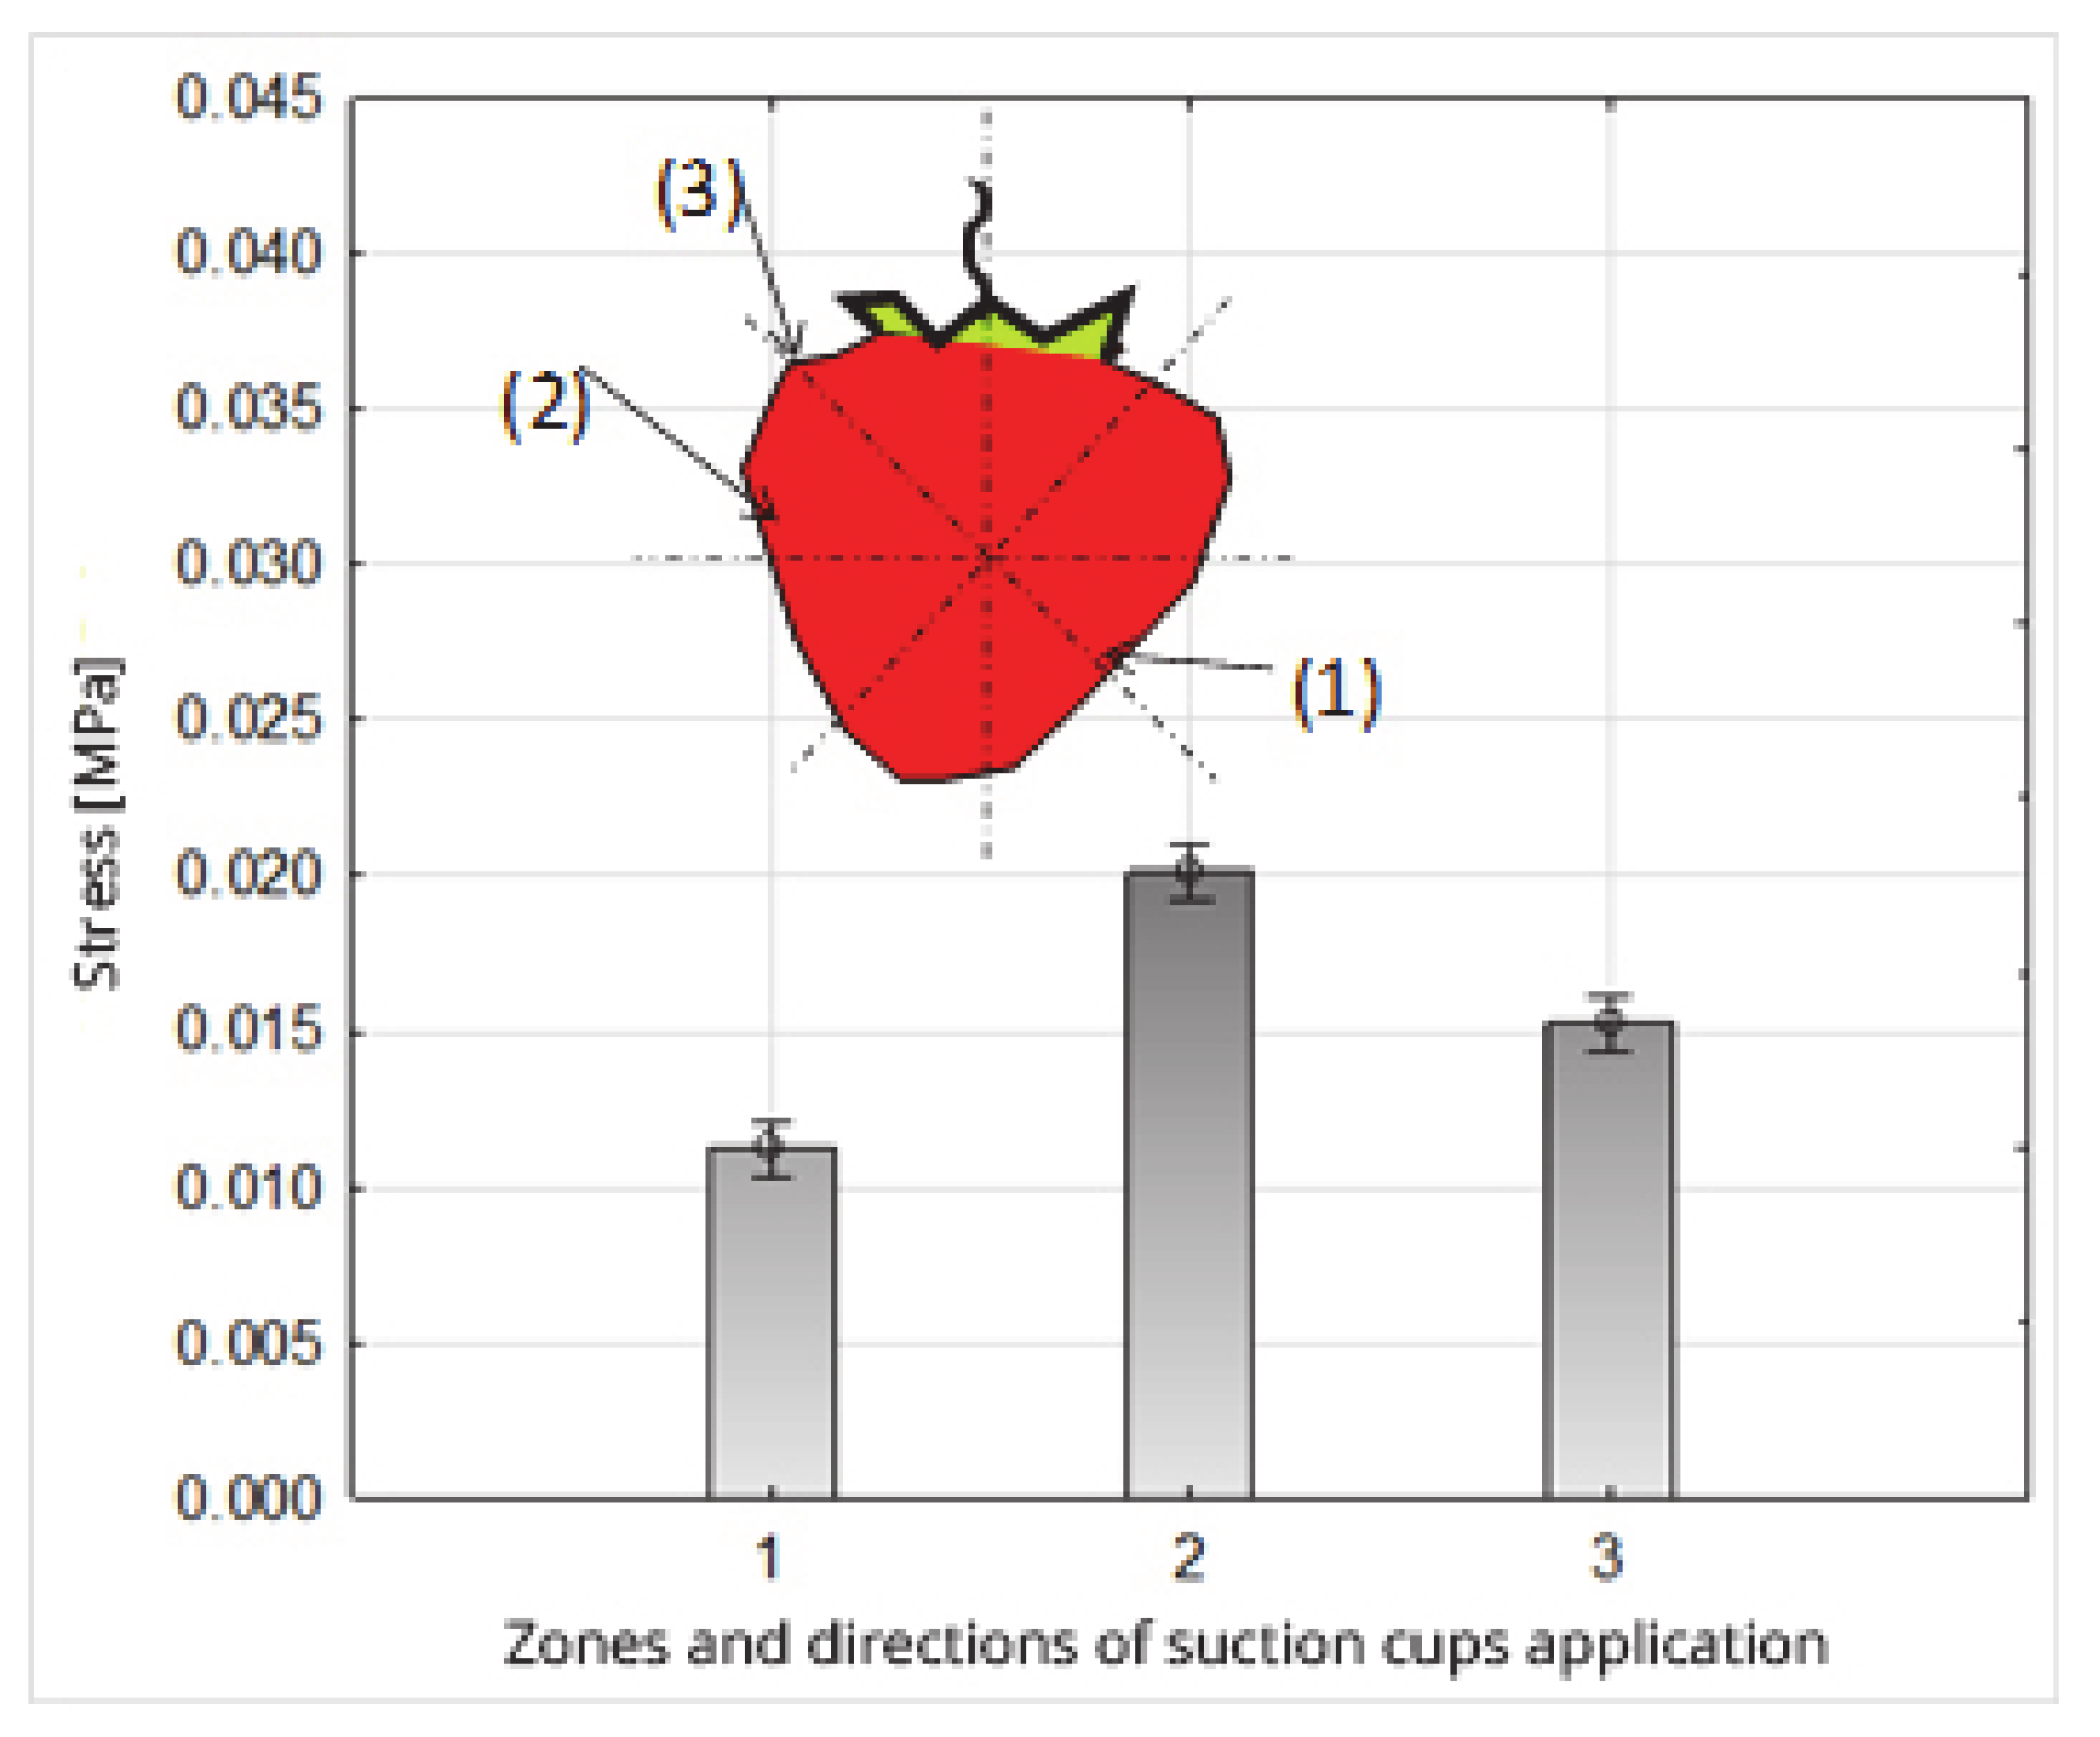
Figure 13.
Influence of the zones and directions of the suction cup application on the stress value.
Figure 13.
Influence of the zones and directions of the suction cup application on the stress value.
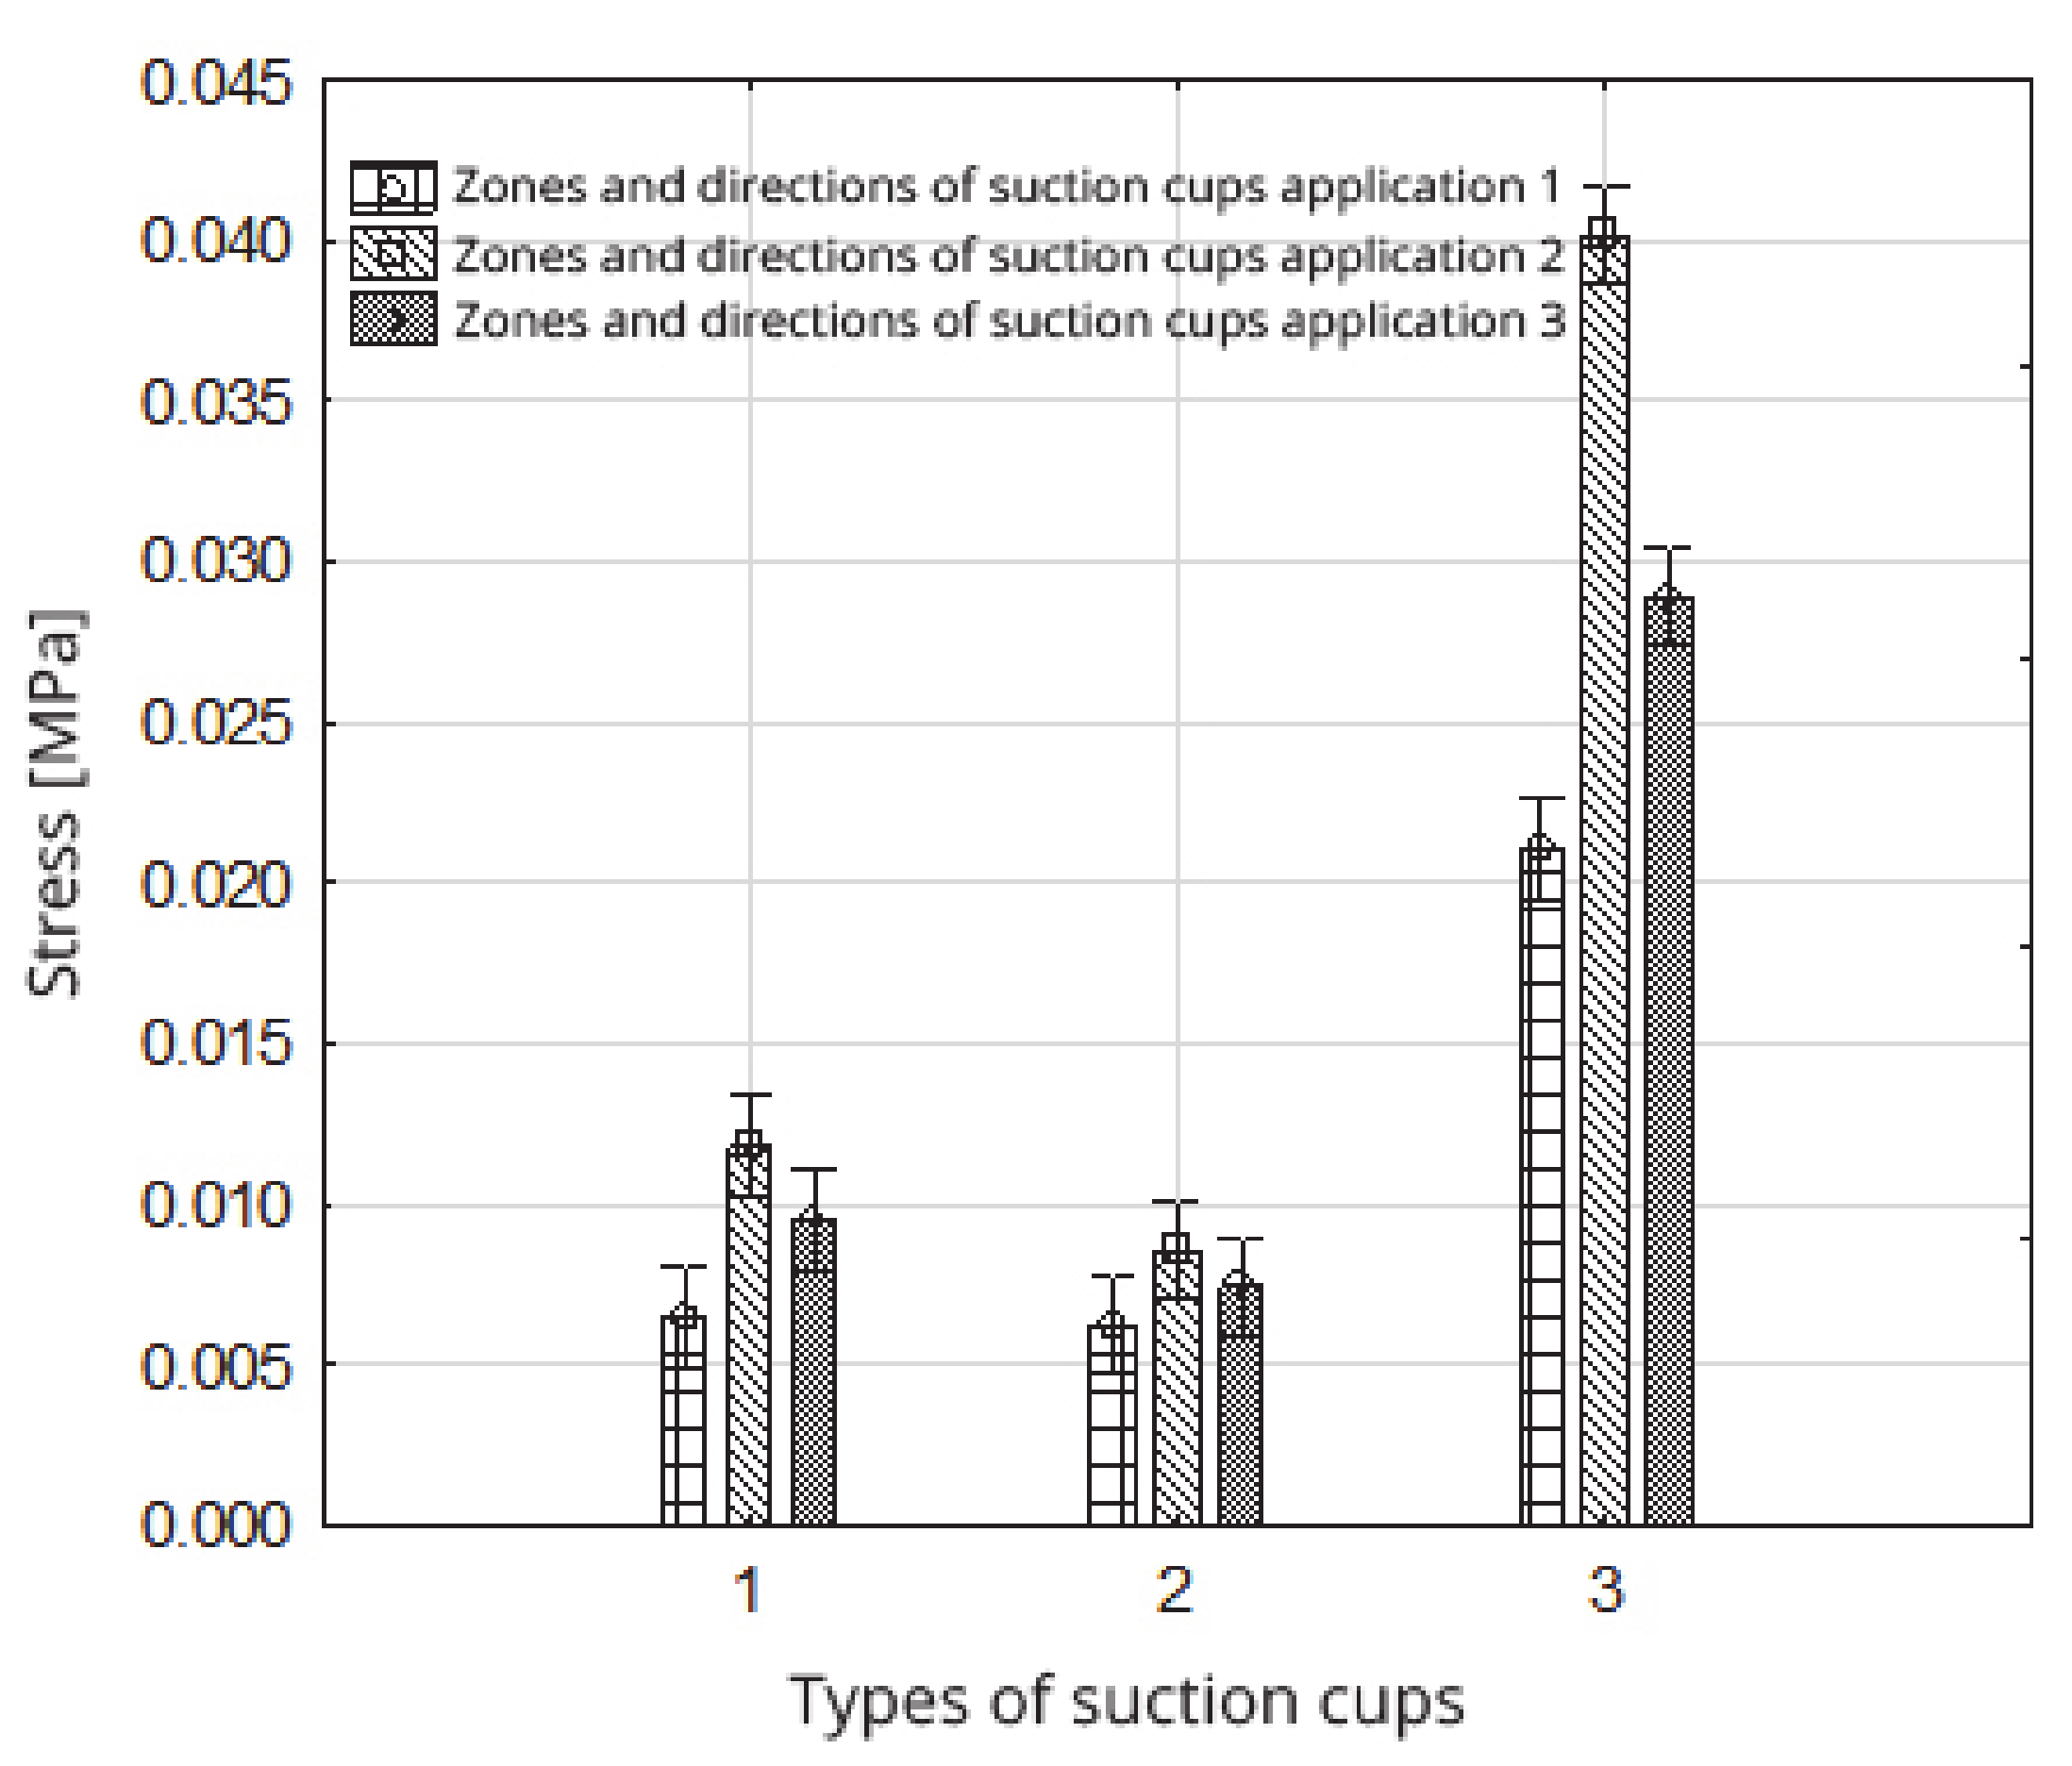
Figure 14.
Impact of the type of suction cups within the zones and directions of suction cup application on the stress value.
Figure 14.
Impact of the type of suction cups within the zones and directions of suction cup application on the stress value.
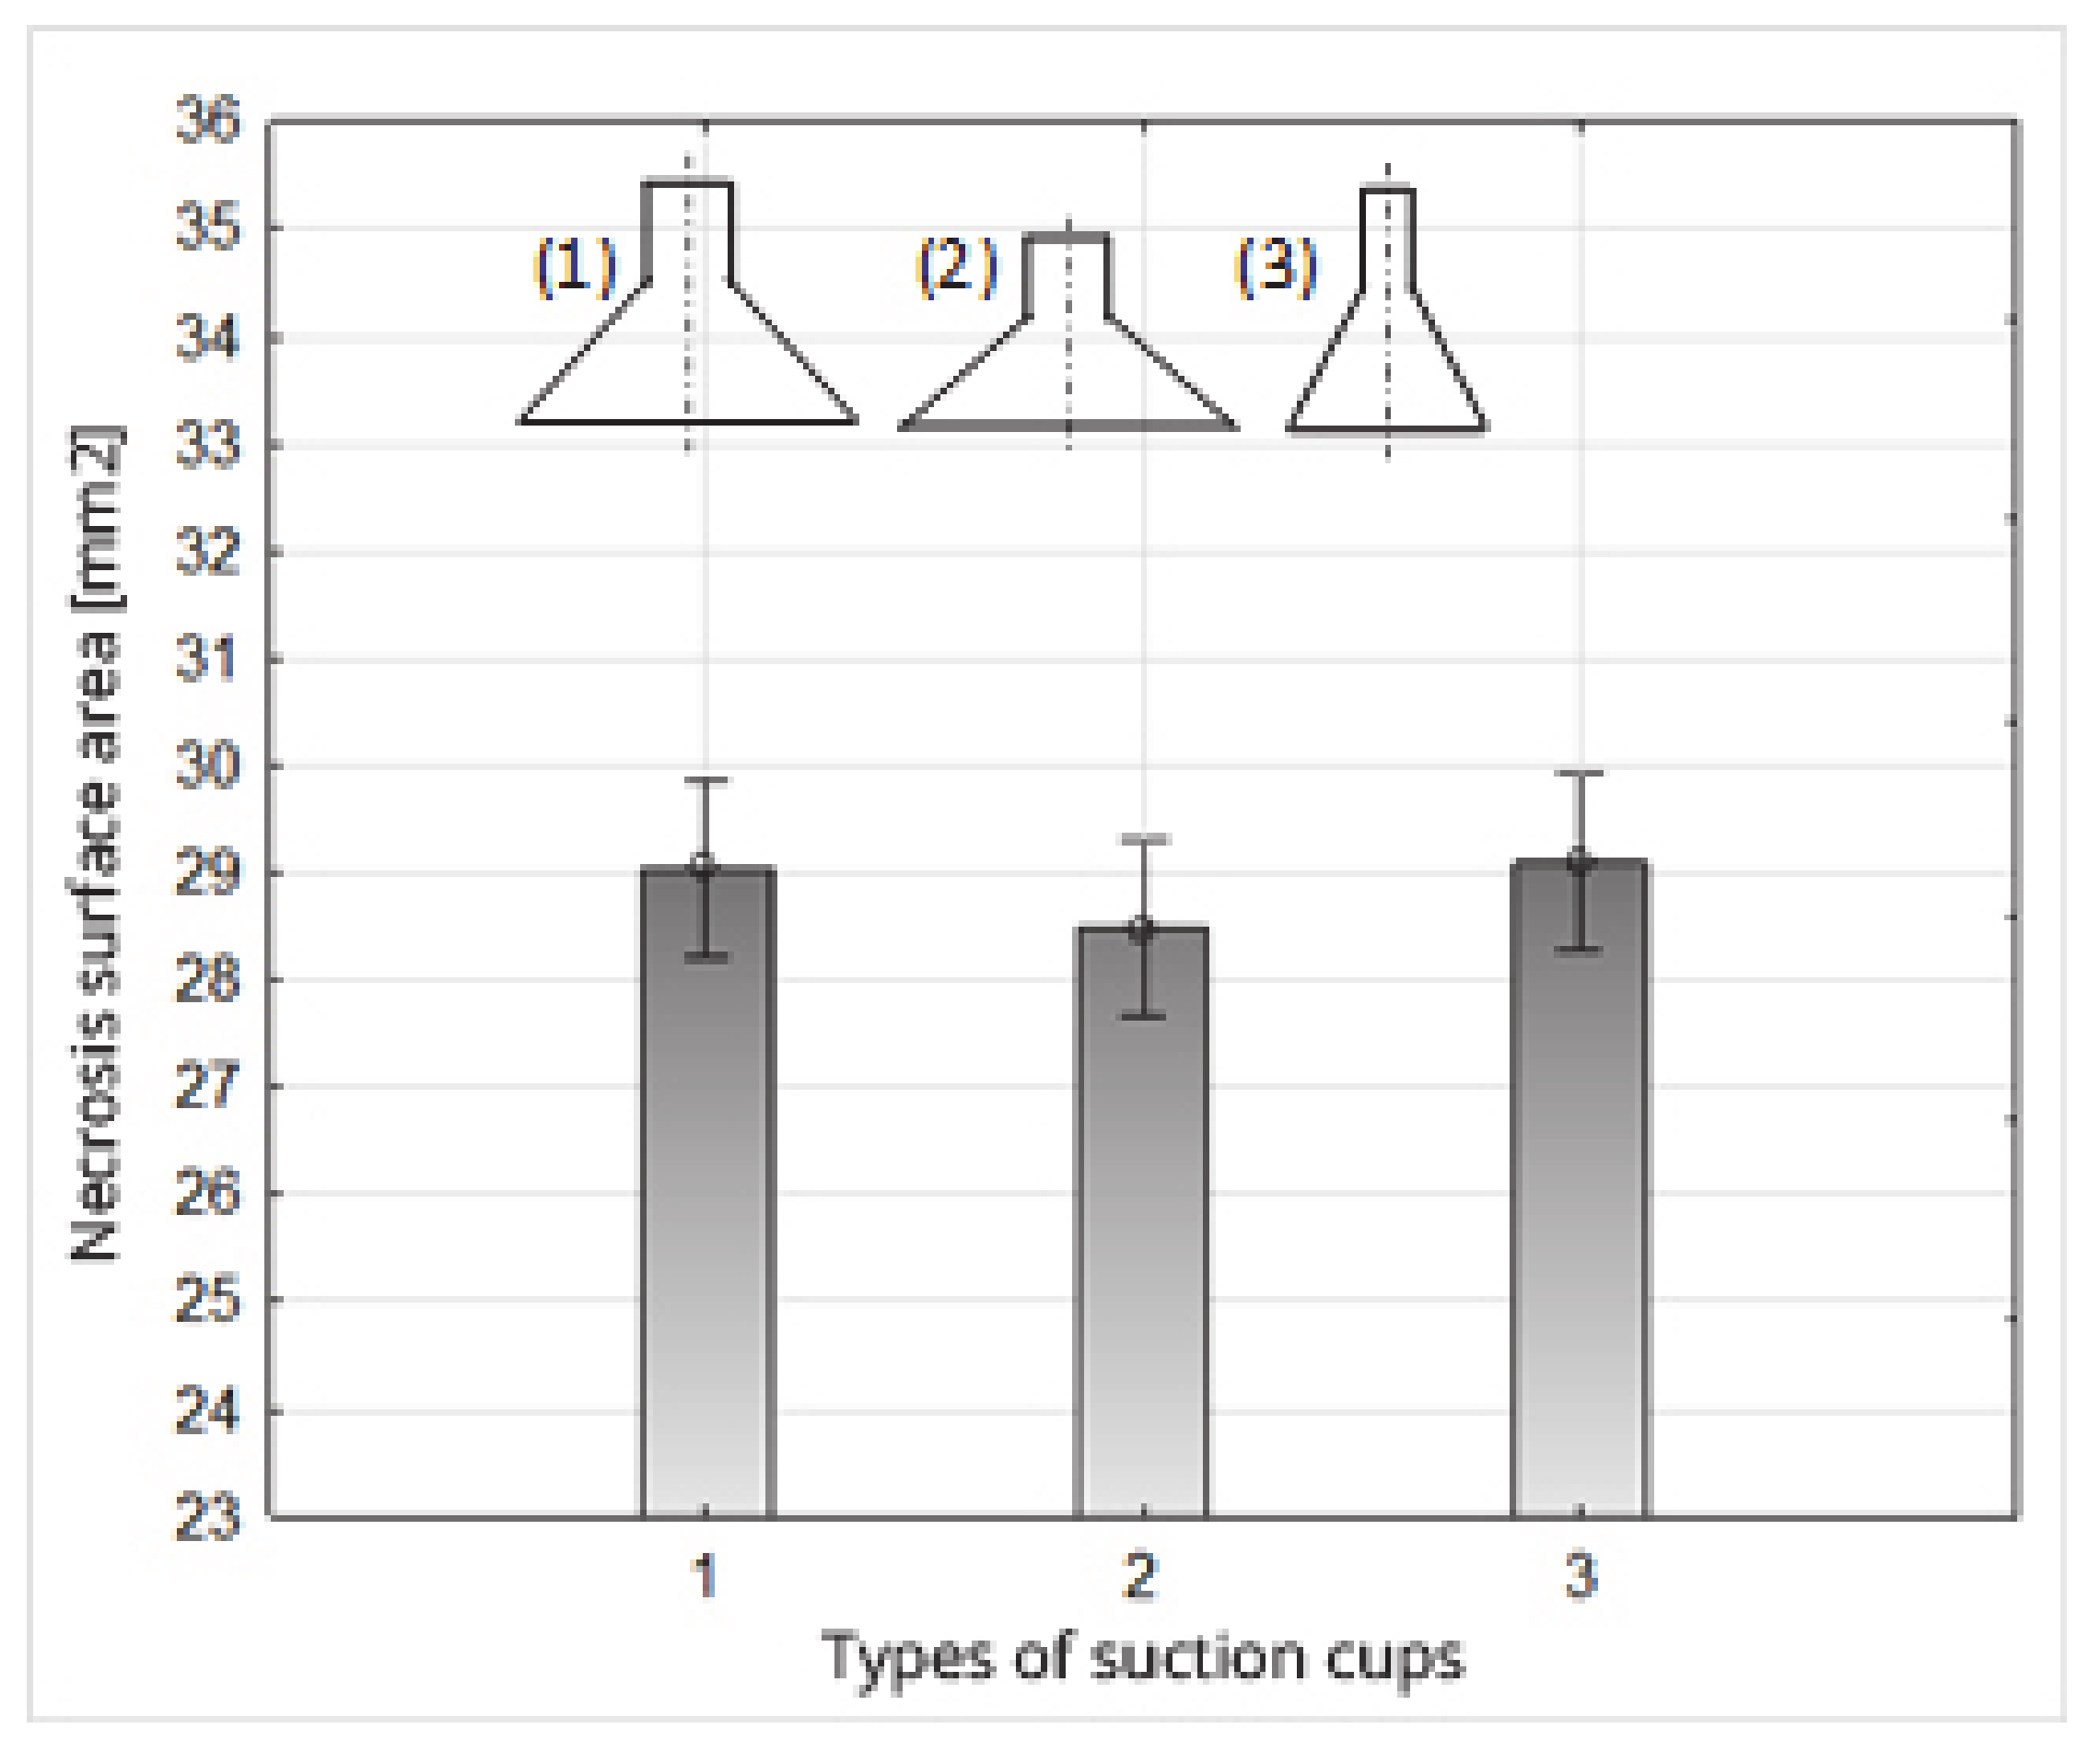
Figure 15.
Impact of the type of suction cups on the necrosis surface area.
Figure 15.
Impact of the type of suction cups on the necrosis surface area.
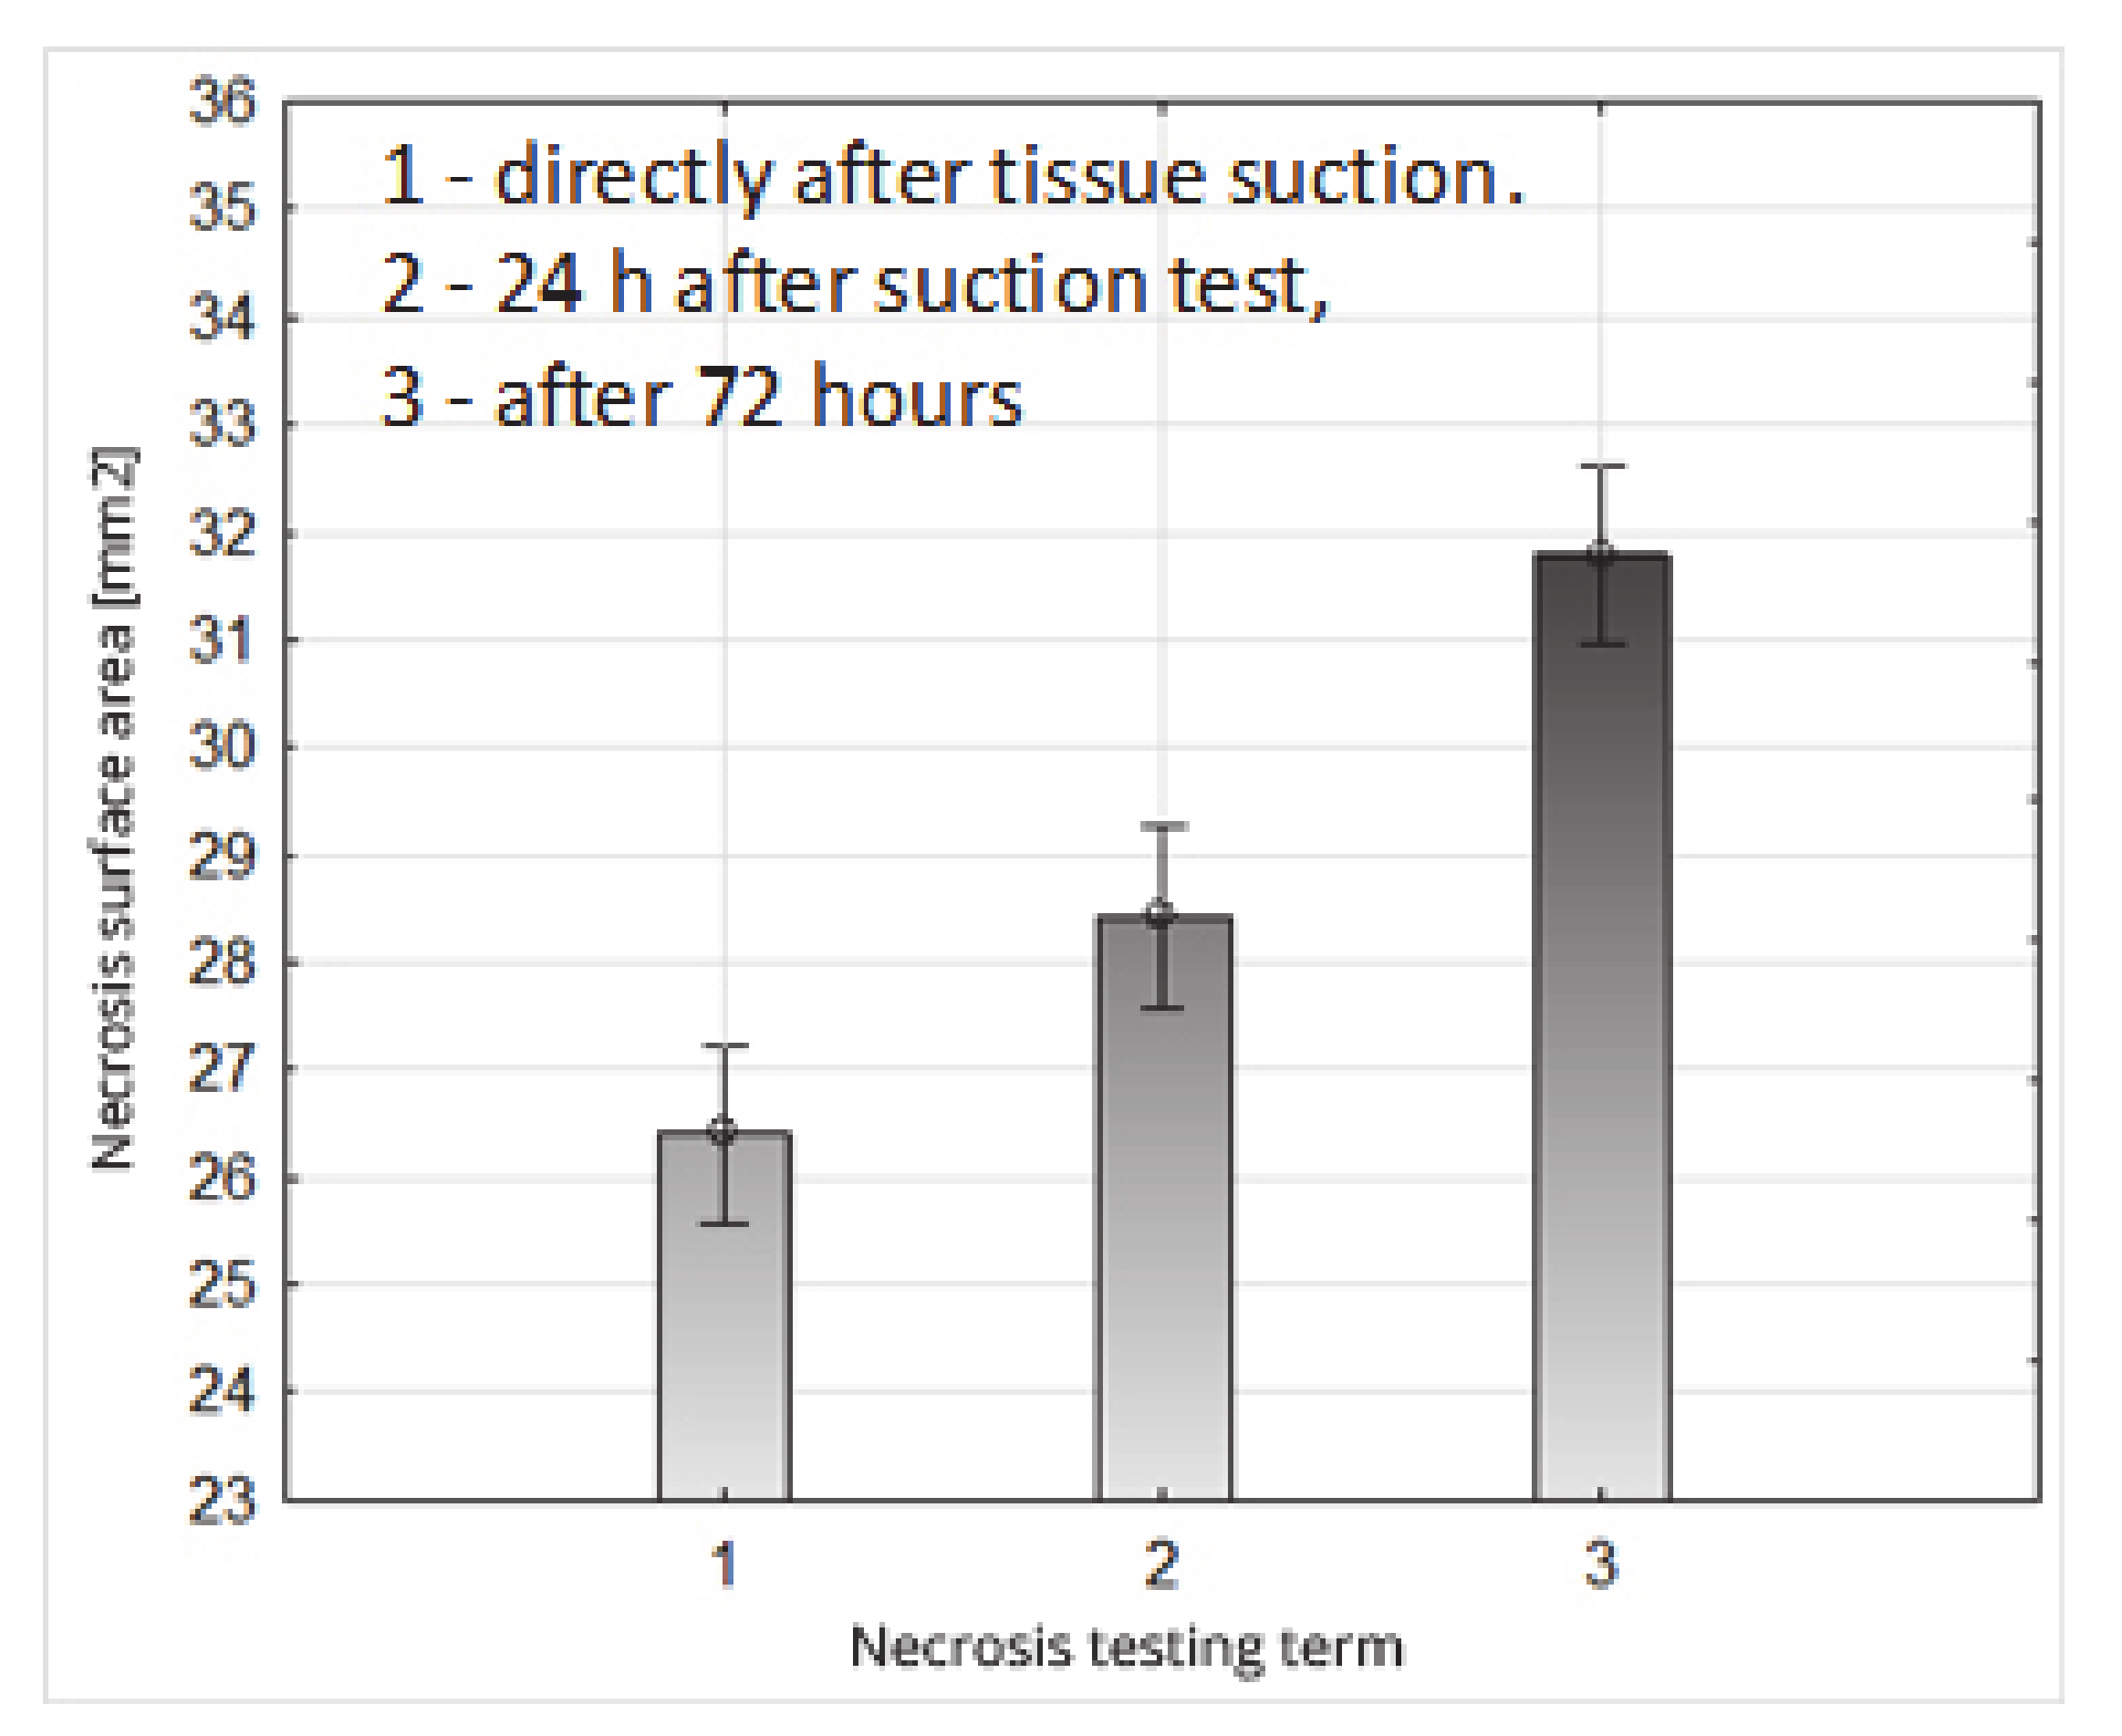
Figure 16.
Impact of the necrosis testing term on their surface area.
Figure 16.
Impact of the necrosis testing term on their surface area.
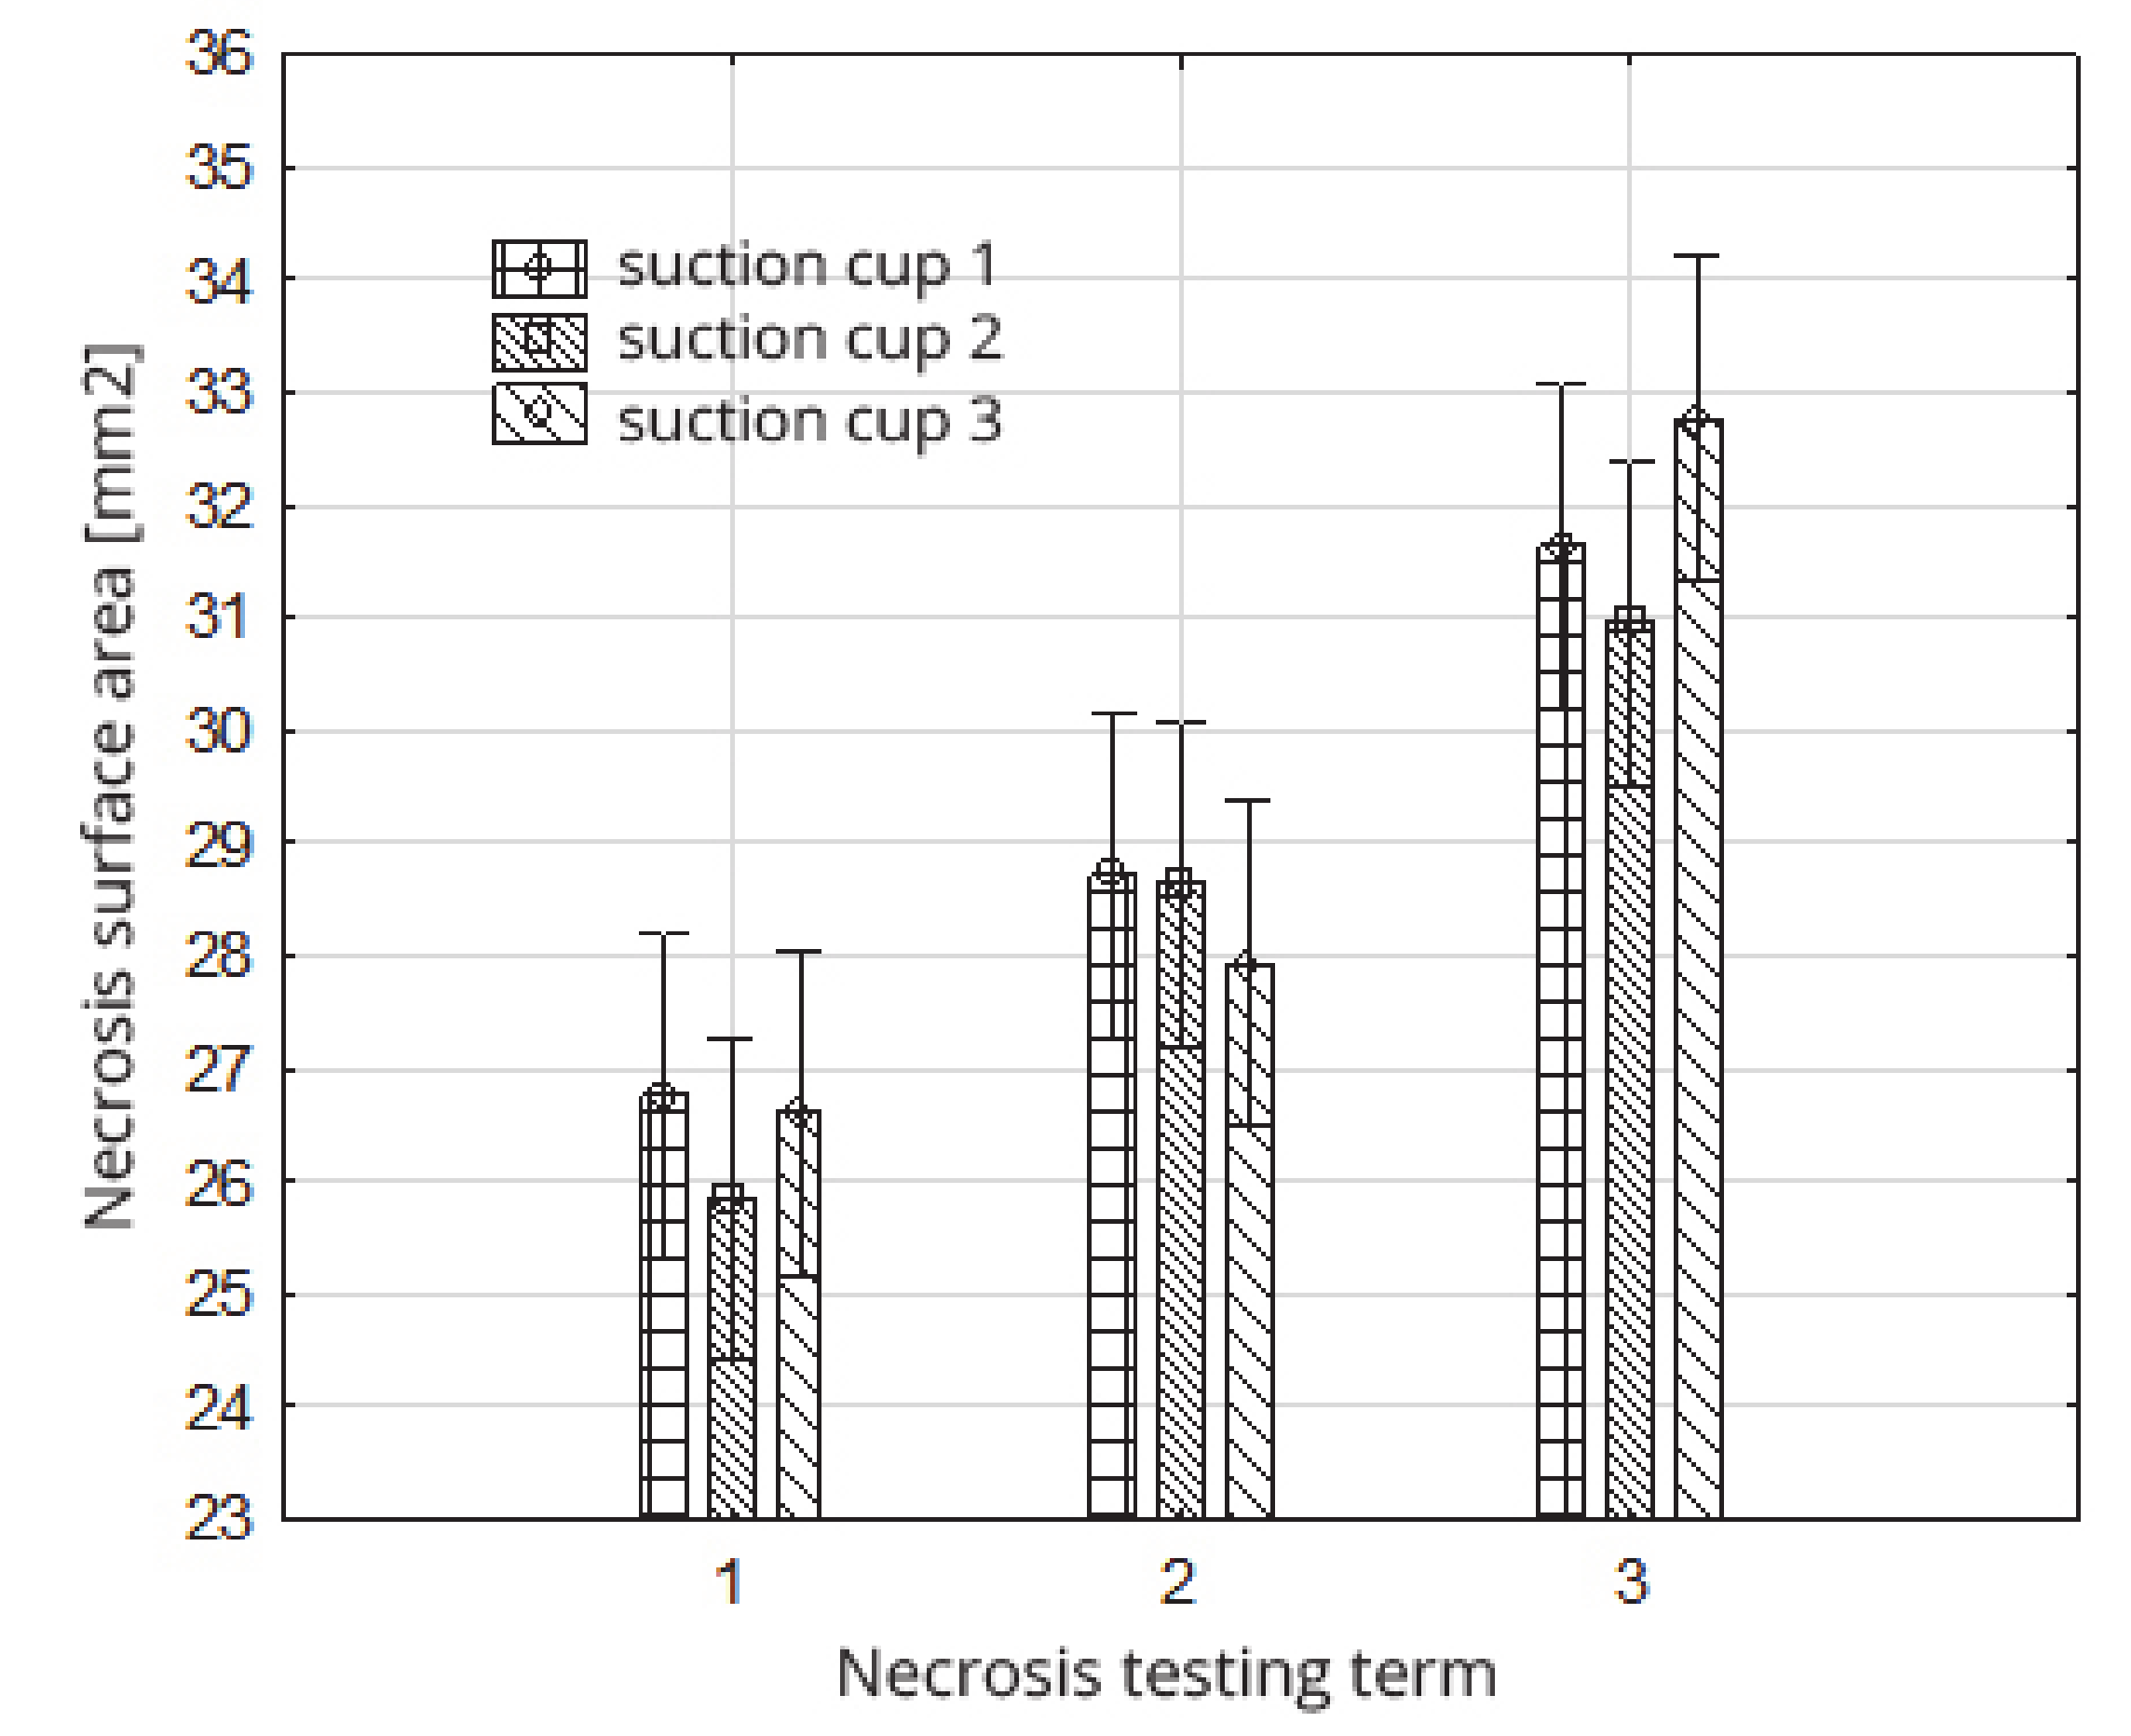
Figure 17.
Impact of the necrosis testing term on the necrosis surface within the type of suction cups.
Figure 17.
Impact of the necrosis testing term on the necrosis surface within the type of suction cups.
Table 1.
Characteristics of the suction cups used.
Table 1.
Characteristics of the suction cups used.
| Suction Cup Number | Geometric Dimensions of Suction Cup | Face Surfaces (A), mm2 | Type of Suction Cup | Suction Cup Sketch |
|---|
| din, mm | dout, mm | hs, mm |
|---|
| No 1 | 43 | 39 | 15 | 257.5 | medium deep |  |
| No 2 | 42 | 38 | 10 | 251.2 | plate |
| No 3 | 25 | 23 | 15 | 75.4 | medium deep |
Table 2.
Result of the analysis of variance with the effects of the interaction of the main factors—the impact of the type of suction cups, and the application zones and directions of the suction cups to the fruit—on the value of the suction force.
Table 2.
Result of the analysis of variance with the effects of the interaction of the main factors—the impact of the type of suction cups, and the application zones and directions of the suction cups to the fruit—on the value of the suction force.
| Qualitiv Predictor and Ineraction | Value of F-Snedecor Test | Probability Test |
|---|
| Intercept coefficient | 3739.75 | 0.00 |
| Types of suction cups {1} | 20.08 | 0.00 |
| Zones and directions of suction cups {2} | 84.72 | 0.00 |
| {1} x {2} | 5.50 | 0.00 |
Table 3.
The system of homogeneous groups (Duncan test); the effect of the type of suction cups on the value of the suction force.
Table 3.
The system of homogeneous groups (Duncan test); the effect of the type of suction cups on the value of the suction force.
| Suction Force (N) |
|---|
| Cups No 1 | Cups No 2 | Cups No 3 |
|---|
| 2.38 (1) | 1.86 (2) | 2.26 (1) |
Table 4.
System of homogeneous groups (Duncan test); the impact of zones and directions of suction cup application on the value of suction force.
Table 4.
System of homogeneous groups (Duncan test); the impact of zones and directions of suction cup application on the value of suction force.
| Suction Force (N) |
|---|
| Zones and Directions 1 for Applying Suction Cups | Zones and Directions 2 for Applying Suction Cups | Zones and Directions 3 for Applying Suction Cups |
|---|
| 1.60 (1) | 2.72 (3) | 2.16 (2) |
Table 5.
System of homogeneous groups (Duncan test); influence of suction cup types, as well as zones and directions of suction cup application on the value of suction force.
Table 5.
System of homogeneous groups (Duncan test); influence of suction cup types, as well as zones and directions of suction cup application on the value of suction force.
| Suction Force (N) |
|---|
| Zones and Directions 1 for Applying Suction Cups | Zones and Directions 2 for Applying Suction Cups | Zones and Directions 3 for Applying Suction Cups |
|---|
| Types of Suction Cups |
|---|
| 1 | 2 | 3 | 1 | 2 | 3 | 1 | 2 | 3 |
| 1.67 (1) | 1.56 (1) | 1.59 (1) | 3.03 (4) | 2.15 (2) (3) | 3.03 (4) | 2.44 (3) | 1.87 (1) (2) | 2.18 (2) (3) |
Table 6.
Result of the analysis of variance with the effects of the interaction of the major factors—the impact of the suction cup types, and the zones and directions of suction cup application on the value of stress.
Table 6.
Result of the analysis of variance with the effects of the interaction of the major factors—the impact of the suction cup types, and the zones and directions of suction cup application on the value of stress.
| Quality Predictor and Interaction | Value of F-Snedecor Test | Probability Test |
|---|
| Intercept Coefficient | 3518.88 | 0.00 |
| Types of Suction Cups {1} | 768.97 | 0.00 |
| Zones and Directions of Suction Cup Application {2} | 96.62 | 0.00 |
| {1}x{2} | 33.43 | 0.00 |
Table 7.
System of homogeneous groups (Duncan’s test); the effect of the type of suction cup on the stress value.
Table 7.
System of homogeneous groups (Duncan’s test); the effect of the type of suction cup on the stress value.
| Stress (MPa) |
|---|
| Cups No 1 | Cups No 2 | Cups No 3 |
| 0.0092 (2) | 0.0074 (1) | 0.0300 (3) |
Table 8.
System of homogeneous groups (Duncan test); the impact of the zones and directions of suction cup application on the stress value.
Table 8.
System of homogeneous groups (Duncan test); the impact of the zones and directions of suction cup application on the stress value.
| Stress (MPa) |
|---|
| Zones and Directions 1 for Applying Suction Cups | Zones and Directions 2 for Applying Suction Cups | Zones and Directions 3 for Applying Suction Cups |
| 0.0112 (1) | 0.0201 (3) | 0.0152 (2) |
Table 9.
System of homogeneous groups (Duncan test); the impact of the type of suction cups, as well as the zones and directions of the suction cup application on the value of stress.
Table 9.
System of homogeneous groups (Duncan test); the impact of the type of suction cups, as well as the zones and directions of the suction cup application on the value of stress.
| Stress (MPa) |
|---|
| Zones and Directions 1 for Applying Suction Cups | Zones and Directions 2 for Applying Suction Cups | Zones and Directions 3 for Applying Suction Cups |
| Types of Suction Cups |
| No 1 | No 2 | No 3 | No 1 | No 2 | No 3 | No 1 | No 2 | No 3 |
| 0.0065 (1) | 0.0062 (1) | 0.0210 (4) | 0.0118 (3) | 0.0085 (1) (2) | 0.0402 (6) | 0.0095 (2) | 0.0074 (1) (2) | 0.0289 (5) |
Table 10.
Result of the analysis of variance with the effects of the interaction of the main factors—the impact of the type of suction cups and the time of necrosis examination on the necrosis surface.
Table 10.
Result of the analysis of variance with the effects of the interaction of the main factors—the impact of the type of suction cups and the time of necrosis examination on the necrosis surface.
| Qualitiy Predictor and Ineraction | Value of F-Snedecor Test | Probability Test |
|---|
| Intercept Coefficient | 14037.54 | 0.00 |
| Time of Necrosis Examination {1} | 41.55 | 0.00 |
| Types of Suction Cups | 0.65 | 0.52 |
| {1}x{2} | 0.86 | 0.49 |
Table 11.
System of homogeneous groups (Duncan’s test); the impact of the necrosis test date on the necrosis surface.
Table 11.
System of homogeneous groups (Duncan’s test); the impact of the necrosis test date on the necrosis surface.
| Necrosis Surface Area (mm2) |
|---|
| Necrosis Testing Term 1 | Necrosis Testing Term 2 | Necrosis Testing Term 3 |
| 26.40 (1) | 28.43 (2) | 31.79 (3) |
Table 12.
Examples of necrosis and the average surface area values of their occurrence.
Table 13.
System of homogeneous groups (Duncan’s test); impact of the necrosis testing term and the suction cup type on the necrosis surface.
Table 13.
System of homogeneous groups (Duncan’s test); impact of the necrosis testing term and the suction cup type on the necrosis surface.
| Necrosis Surface Area (mm2) |
|---|
| Necrosis Testing Term 1 | Necrosis Testing Term 2 | Necrosis Testing Term 3 |
|---|
| Type of Sunction Cups |
|---|
| No 1 | No 2 | No 3 | No 1 | No 2 | No 3 | No 1 | No 2 | No 3 |
| 26.76 (1) (2) | 25.84 (2) | 26.60 (1) (2) | 28.72 (1) | 28.64 (1) | 27.92 (1) (2) | 31.64 (3) | 30.96 (3) | 32.76 (3) |


