Estimation of Individual Exposure to Erythemal Weighted UVR by Multi-Sensor Measurements and Integral Calculation


Abstract
1. Introduction
- (1)
- Photosensitive personal dosimeters and polysulphone film UV dosimeter are instruments that are frequently used to quantify an individual’s UV exposure [7,8]. They are light, commercially available and can be mounted on body part to study anatomical distribution of UVR [9]. However, their measurements are strongly related to the specificities of local environmental conditions and behavioral variations [8,10,11]. Moreover, most dosimeters are mounted on an individual’s shoulders, wrist, or head and therefore measure UVR from one direction (mostly above), which has been shown to underestimate full-body UVR exposure [6,8]. Recently a UVR diary app was developed to estimate personal UVR exposure, but it needs further improvement, especially for physical activity data [12].
- (2)
- Climatological approach using satellite data for the population UVR exposure level of national or regional scale can be used to demonstrate large area UVR condition. However, with a coarse resolution (e.g., 1.5 to 2 km), this approach can hardly be applied in site scale to reflect the human level UVR exposure and the interaction between the environment and the human body.
- (3)
- Some three-dimensional computer graphics techniques are used to estimate UVR exposure ratios (ERs), while referring to the fraction of the ambient UVR received by the body area, for different body parts based on anatomical and geometric calculations. Computer modeling of ER for the whole body and specific body parts has a high resolution of vertices on human skin (e.g., 13,476 vertices for the SimUVEx model developed by Religi et al. [13]) and, compared to field measurements, performs with high accuracy in terms of predicting the ER of a human body in an open area. However, this model is not applicable to real sites with complex shade conditions such as those provided by structure or vegetation. Additionally, the frequently used manikin model is designed and calculated for adults. No evidence has been found regarding the difference or uniformity of UVR exposure between children and adults. Due to children’s vulnerability in UVR risk assessments, special attention must be paid to the estimation of children’s UVR exposure.
Literature Review
2. Materials and Methods
2.1. Ambient UVR Data and Six Directional UVR Data Collection in College Station, TX
2.2. Exposure Ration Calculation for Children and Adults
2.3. Estimation of Child and Adult UVR Exposure by Ambient UVR Irradiance and ER
2.4. Estimation of Children’s and Adults’ UVR Exposure by Integral UVR Measurement
2.5. Field Measurement in Schoolyards
3. Results
3.1. Anatomical Body Part ER for Children and Adults during Four Seasons in College Station, Texas
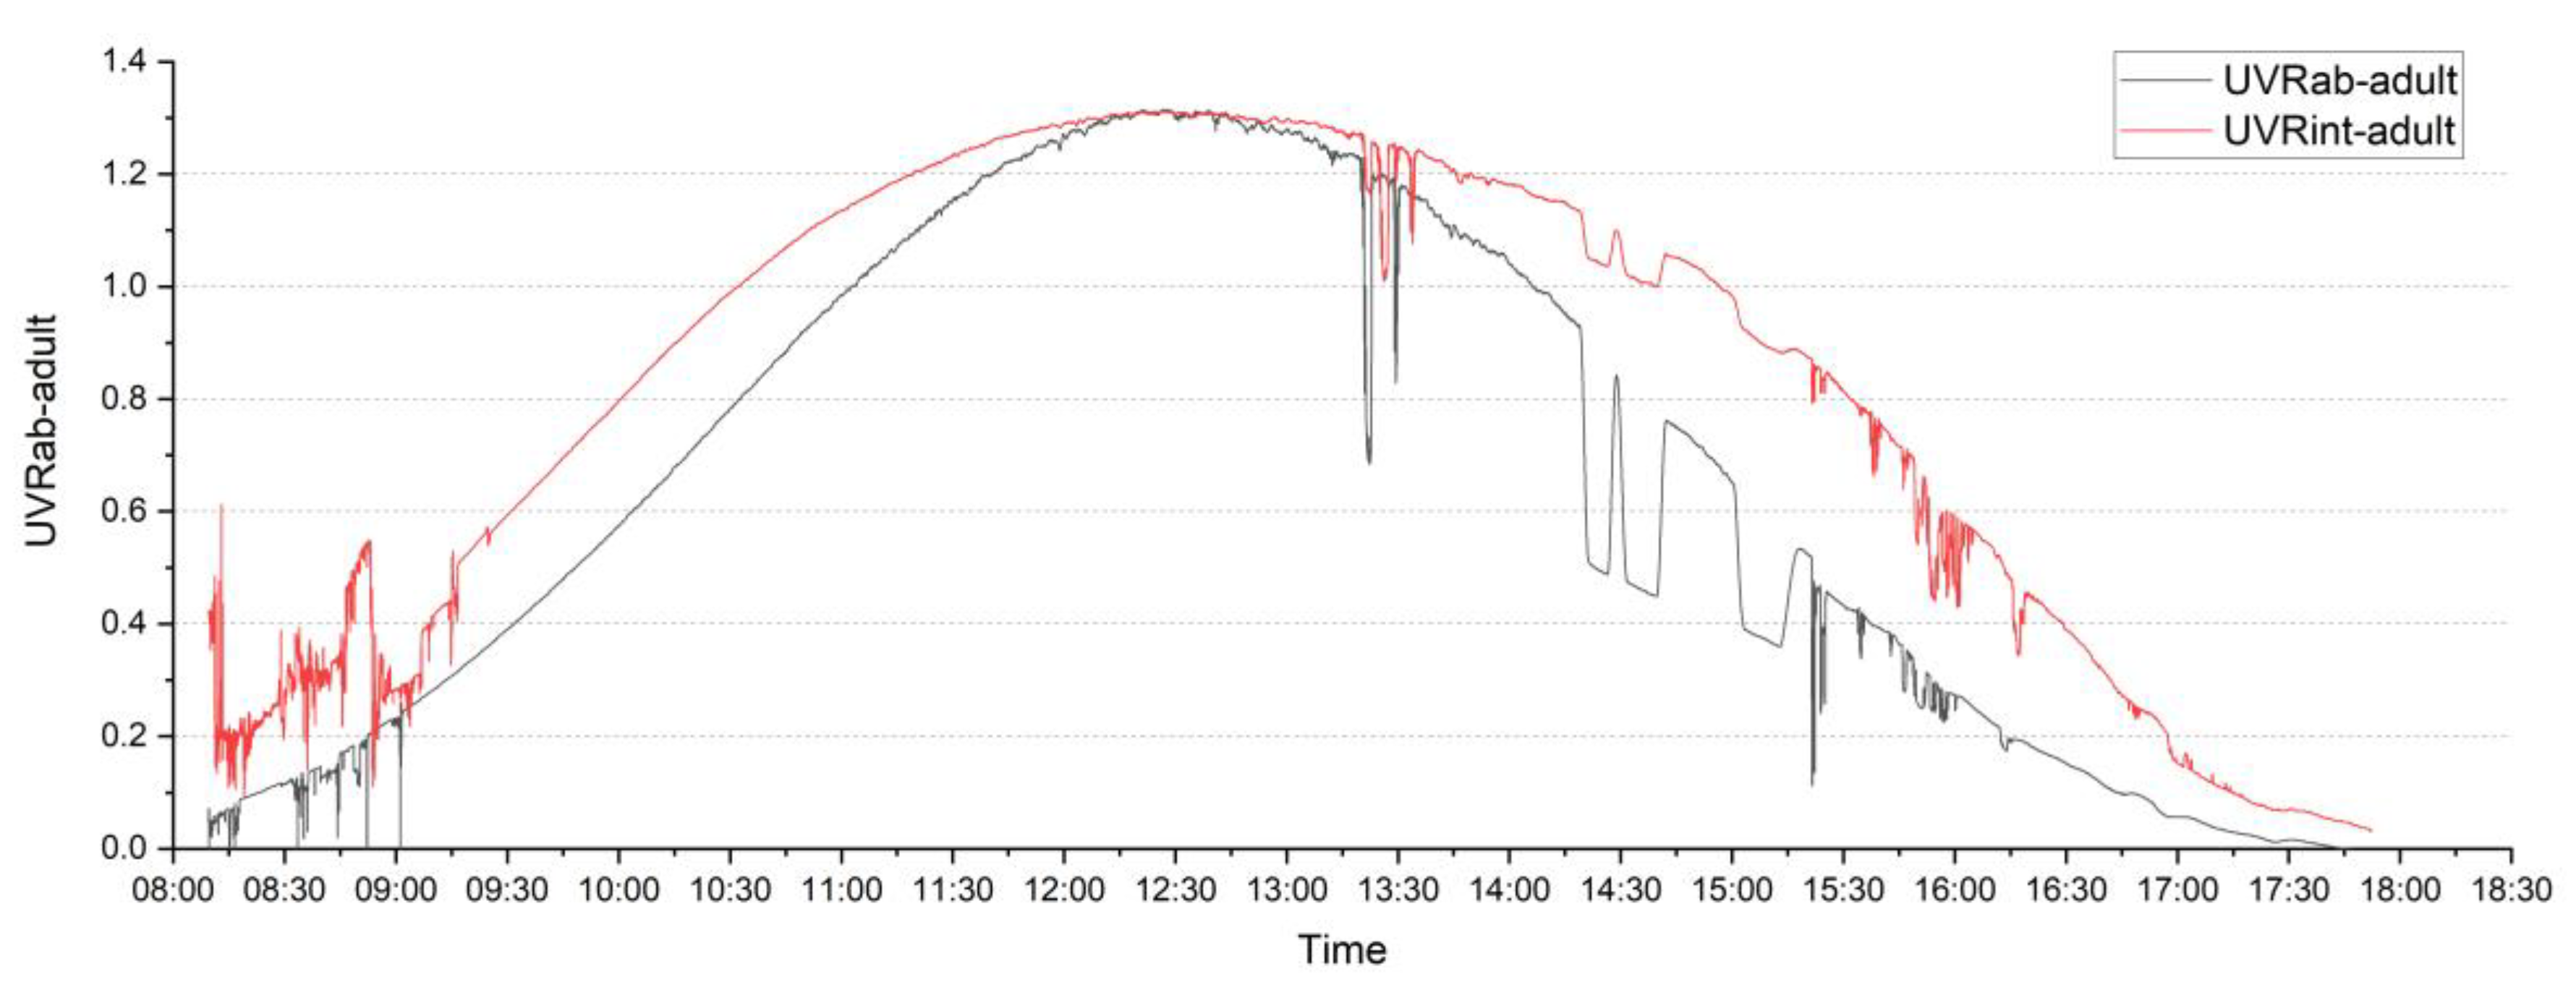
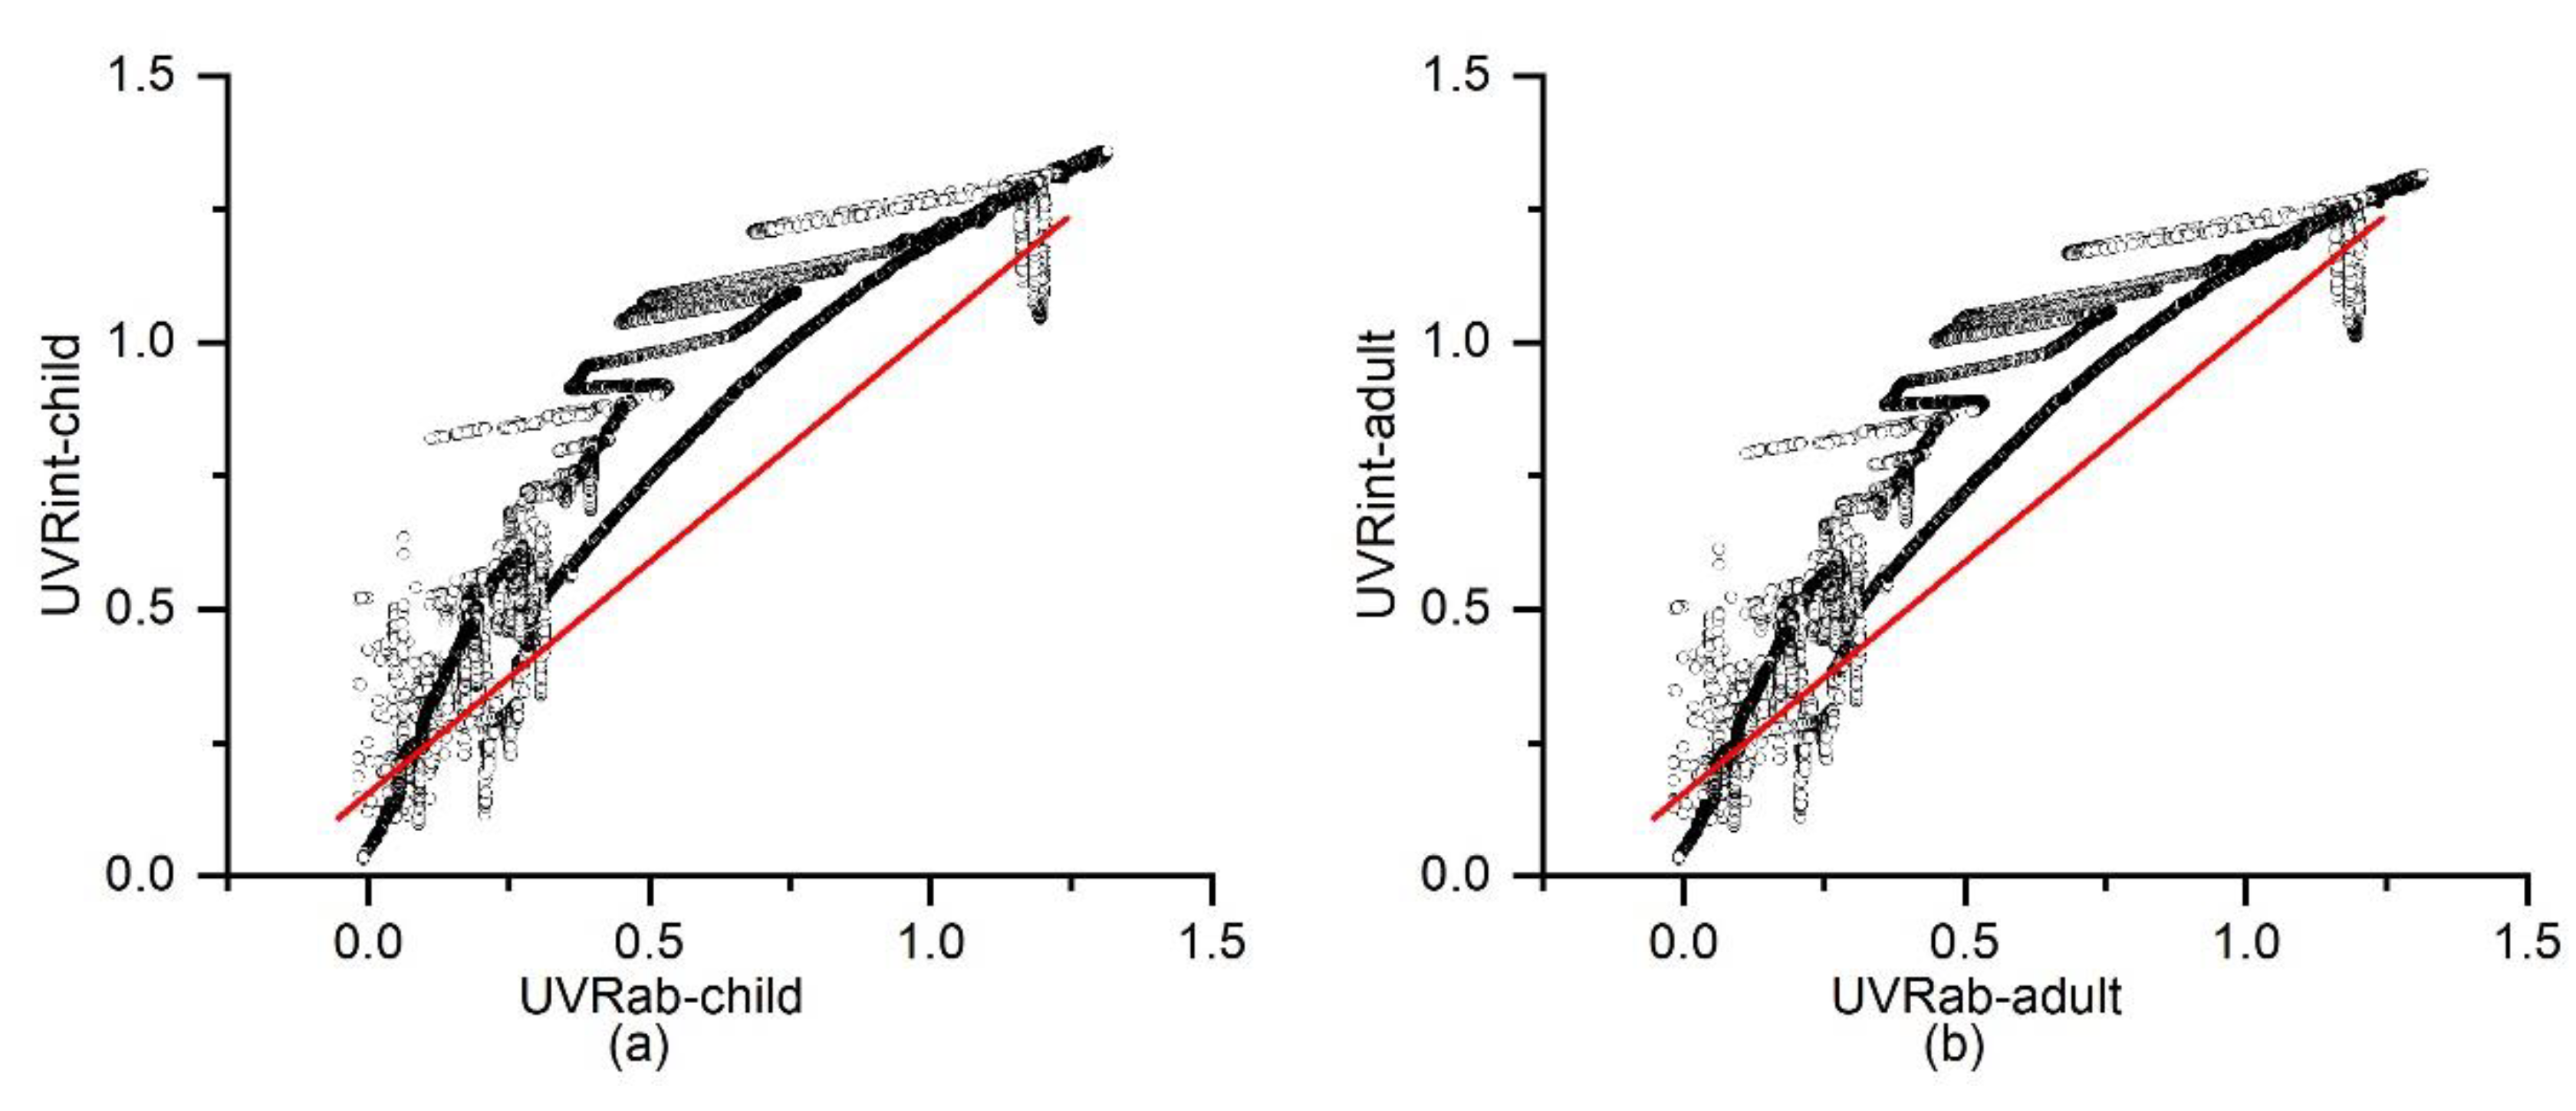
3.2. Comparison of Two Approaches for Measuring UVR Exposure Based on Field Measurement Data on 25 February 2020
3.3. Environmental UVR Amount of a Basketball Court
4. Discussion
Limitations
5. Conclusions
Author Contributions
Funding
Acknowledgments
Conflicts of Interest
References
- The Skin Cancer Foundation. Skin Cancer Facts & Statistic. Available online: https://www.skincancer.org/skin-cancer-information/skin-cancer-facts/ (accessed on 9 June 2020).
- Balk, S.J. Ultraviolet Radiation: A Hazard to Children and Adolescents. Pediatrics 2011, 127, e791–e817. [Google Scholar] [CrossRef] [PubMed]
- American Cancer Society. Cancer Facts & Figures 2018; American Cancer Society: Atlanta, GA, USA, 2020; pp. 19–20. [Google Scholar]
- Cestari, T.; Buster, K. Photoprotection in specific populations: Children and people of color. J. Am. Acad. Dermatol. 2017, 76, S110–S121. [Google Scholar] [CrossRef] [PubMed]
- Stamatas, G.N.; Nikolovski, J.; Luedtke, M.A.; Kollias, N.; Wiegand, B.C. Infant skin microstructure assessed in vivo differs from adult skin in organization and at the cellular level. Pediatric Dermatol. 2010, 27, 125–131. [Google Scholar] [CrossRef] [PubMed]
- Wong, J.R.; Harris, J.K.; Rodriguez-Galindo, C.; Johnson, K.J. Incidence of childhood and adolescent melanoma in the United States: 1973–2009. Pediatrics 2013, 131, 846–854. [Google Scholar] [CrossRef]
- Siani, A.M.; Casale, G.R.; Modesti, S.; Parisi, A.V.; Colosimo, A. Investigation on the capability of polysulphone for measuring biologically effective solar UV exposures. Photochem. Photobiol. Sci. 2014, 13, 521–530. [Google Scholar] [CrossRef]
- Schmalwieser, A.W.; Siani, A.M. Review on nonoccupational personal solar UV exposure measurements. Photochem. Photobiol. 2018, 94, 900–915. [Google Scholar] [CrossRef]
- Diffey, B. The early days of personal solar ultraviolet dosimetry. Atmosphere 2020, 11, 125. [Google Scholar] [CrossRef]
- Weihs, P.; Schmalwieser, A.; Reinisch, C.; Meraner, E.; Walisch, S.; Harald, M. Measurements of Personal UV Exposure on Different Parts of the Body During Various Activities. Photochem. Photobiol. 2013, 89, 1004–1007. [Google Scholar] [CrossRef]
- Appelbaum, J.; Peleg, I.; Peled, A. Multi-sensor for measuring erythemally weighted irradiance in various directions simultaneously. Theor. Appl. Climatol. 2016, 126, 339–350. [Google Scholar] [CrossRef]
- Hacker, E.; Horsham, C.; Allen, M.; Nathan, A.; Lowe, J.; Janda, M. Capturing ultraviolet radiation exposure and physical activity: Feasibility study and comparison between self-reports, mobile apps, dosimeters, and accelerometers. JMIR Res. Protoc. 2018, 7, e102. [Google Scholar] [CrossRef]
- Religi, A.; Moccozet, L.; Vernez, D.; Milon, A.; Backes, C.; Bulliard, J.L.; Vuilleumier, L. 2016 Prediction of anatomical exposure to solar UV: A case study for the head using SimUVEx v2. In Proceedings of the 2016 IEEE 18th International Conference on e-Health Networking, Applications and Services (Healthcom), Munich, Germany, 14–16 September 2016; pp. 1–6. [Google Scholar]
- Kerr, J.B.; Fioletov, V.E. Surface ultraviolet radiation. Atmos.-Ocean 2008, 46, 159–184. [Google Scholar] [CrossRef]
- Vanos, J.K.; McKercher, G.R.; Naughton, K.; Lochbaum, M. Schoolyard Shade and Sun Exposure: Assessment of Personal Monitoring During Children’s Physical Activity. Photochem. Photobiol. 2017, 93, 1123–1132. [Google Scholar] [CrossRef]
- Creech, L.L.; Mayer, J.A. Ultraviolet radiation exposure in children: A review of measurement strategies. Ann. Behav. Med. 1997, 19, 399–407. [Google Scholar] [CrossRef] [PubMed]
- Whiteman, D.C.; Valery, P.; McWhirter, W.; Green, A.C. Risk factors for childhood melanoma in Queensland, Australia. Int. J. Cancer 1997, 70, 26–31. [Google Scholar] [CrossRef]
- Khlat, M.; Vail, A.; Parkin, M.; Green, A. Mortality from melanoma in migrants to Australia: Variation by age at arrival and duration of stay. Am. J. Epidemiol. 1992, 135, 1103–1113. [Google Scholar] [CrossRef] [PubMed]
- Geller, A.C.; Colditz, G.; Oliveria, S.; Emmons, K.; Jorgensen, C.; Aweh, G.N.; Frazier, A.L. Use of sunscreen, sunburning rates, and tanning bed use among more than 10 000 US children and adolescents. Pediatrics 2002, 109, 1009–1014. [Google Scholar] [CrossRef]
- Cokkinides, V.; Weinstock, M.; Glanz, K.; Albano, J.; Ward, E.; Thun, M. Trends in sunburns, sun protection practices, and attitudes toward sun exposure protection and tanning among US adolescents, 1998–2004. Pediatrics 2006, 118, 853–864. [Google Scholar] [CrossRef]
- Pagels, P.; Wester, U.; Söderström, M.; Lindelöf, B.; Boldemann, C. Suberythemal Sun Exposures at Swedish Schools Depend on Sky Views of the Outdoor Environments—Possible Implications for Pupils’ Health. Photochem. Photobiol. 2015, 92, 201–207. [Google Scholar] [CrossRef]
- Boldemann, C.; Blennow, M.; Dal, H.; Mårtensson, F.; Raustorp, A.; Yuen, K.; Wester, U. Impact of preschool environment upon children’s physical activity and sun exposure. Prev. Med. 2006, 42, 301–308. [Google Scholar] [CrossRef]
- Gage, R.; O’Toole, C.; Robinson, A.; Reeder, A.; Signal, L.; Mackay, C. Wellington Playgrounds Uncovered: An Examination of Solar Ultraviolet Radiation and Shade Protection in New Zealand. Photochem. Photobiol. 2018, 94, 357–361. [Google Scholar] [CrossRef]
- Moise, A.F.; Büttner, P.G.; Harrison, S.L. Sun Exposure at School. Photochem. Photobiol. 1999, 70, 269–274. [Google Scholar] [CrossRef] [PubMed]
- Pope, S.J.; Godar, D.E. Solar UV geometric conversion factors: Horizontal plane to cylinder model. Photochem. Photobiol. 2010, 86, 457–466. [Google Scholar] [CrossRef] [PubMed]
- Streicher, J.J.; Culverhouse Jr, W.C.; Dulberg, M.S.; Fornaro, R.J. Modeling the anatomical distribution of sunlight. Photochem. Photobiol. 2004, 79, 40–47. [Google Scholar] [PubMed]
- Hoeppe, P.; Oppenrieder, A.; Erianto, C.; Koepke, P.; Reuder, J.; Seefeldner, M.; Nowak, D. Visualization of UV exposure of the human body based on data from a scanning UV-measuring system. Int. J. Biometeorol. 2004, 49, 18–25. [Google Scholar] [CrossRef]
- Vernez, D.; Milon, A.; Francioli, L.; Bulliard, J.-L.; Vuilleumier, L.; Moccozet, L. A Numeric Model to Simulate Solar Individual Ultraviolet Exposure. Photochem. Photobiol. 2011, 87, 721–728. [Google Scholar] [CrossRef]
- Vernez, D.; Milon, A.; Vuilleumier, L.; Bulliard, J.-L.; Koechlin, A.; Boniol, M.; Doré, J.F. A general model to predict individual exposure to solar UV by using ambient irradiance data. J. Expo. Sci. Environ. Epidemiol. 2015, 25, 113–118. [Google Scholar] [CrossRef][Green Version]
- Downs, N.; Parisi, A. Mean exposure fractions of human body solar UV exposure patterns for application in different ambient climates. Photochem. Photobiol. 2012, 88, 223–226. [Google Scholar] [CrossRef]
- Thorsson, S.; Lindberg, F.; Eliasson, I.; Holmer, B. Different methods for estimating the mean radiant temperature in an outdoor urban setting. Int. J. Climatol. 2007, 27, 1983–1993. [Google Scholar] [CrossRef]
- VDI. 1994 Environmental Meteorology, Interactions between Atmosphere and Surface; Calculation of Short-and Long Wave Radiation. Part I: Climate, VDI 3789, Part 2: VDI/DIN-Handbuch Reinhaltung der Luft; Band 1b: Düsseldorf, Germany, 1994. [Google Scholar]
- Shade UV sensor. Shade UV sensor—Funded by the National Cancer Institute. 2017. Available online: https://www.wearshade.com (accessed on 9 June 2020).
- Banerjee, S.; Hoch, E.G.; Kaplan, P.D.; Dumont, E.L. A comparative study of wearable ultraviolet radiometers. In Proceedings of the 2017 IEEE Life Sciences Conference (LSC), Sydney, Australia, 13–15 December 2017; pp. 9–12. [Google Scholar]
- Microsoft Band, Microsoft. Available online: https://www.microsoft.com/microsoft-band/en-us (accessed on 9 June 2020).
- June by Netatmo, Netatmo, 18-Jan-2016. Available online: https://www.junebynetatmo.com/en-US/site (accessed on 9 June 2020).
- UVA+B SunFriend wearable sun tracker, SunFriend. Available online: http://sunfriend.com/ (accessed on 10 June 2020).
- UV sensor Clip, Dakota watch. Available online: https://www.dakotawatch.com/index.php/uv-temp-sensor-clip-black.html (accessed on 10 June 2020).
- Sunsprite, Goodlux Technologies. Available online: https://www.sunsprite.com/ (accessed on 20 June 2020).
- United States Environmental Protection Agency. EPA UV Index Mobile App. Available online: https://www.epa.gov/enviro/uv-index-mobile-app (accessed on 9 June 2020).
- Lucas, R.M.; Neale, R.E.; Madronich, S.; McKenzie, R.L. Are current guidelines for sun protection optimal for health? Exploring the evidence. Photochem. Photobiol. Sci. 2018, 17, 1956–1963. [Google Scholar] [CrossRef] [PubMed]
- O’sullivan, S.B.; Schmitz, T.J.; Fulk, G.D. Physical Rehabilitation; F.A. Davis Company: Philadelphia, PA, USA, 2019. [Google Scholar]
- Boniol, M.; Verriest, J.-P.; Pedeux, R.; Doré, J.-F. Proportion of Skin Surface Area of Children and Young Adults from 2 to 18 Years Old. J. Investig. Dermatol. 2008, 128, 461–464. [Google Scholar] [CrossRef]
- Brown, R.D.; Gillespie, T.J. Estimating outdoor thermal comfort using a cylindrical radiation thermometer and an energy budget model. Int. J. Biometeorol. 1986, 30, 43–52. [Google Scholar] [CrossRef] [PubMed]
- National Oceanic and Atmospheric Administration. NOAA Solar Position Calculator; NOAA/ESRL: Boulder, CO, USA, 2019. Available online: https://www.esrl.noaa.gov/gmd/grad/solcalc/azel.html (accessed on 9 June 2020).


| Visible Percentage (%) | Percentage of Body Part Surface Area for an Adult (%) | Percentage of Body Surface Area for a Child * (%) | |
|---|---|---|---|
| Face | 38.62 | 3.9 | 6 |
| Skull | 61.96 | ||
| Forearm (external) | 56.68 | 5.9 | 5.7 |
| Upper arm (external) | 57 | 9.6 | 8.6 |
| Neck back | 71.4 | 2 | 2.7 |
| Top of shoulders | 53.16 | 12.8 | 12.2 |
| Belly | 43.66 | 2.9 | 2.8 |
| Upper back | 53.16 | 13.9 | 13.1 |
| Low back | 58.68 | ||
| Hand (back) | 54.78 | 4.7 | 4.7 |
| Shoulder | 64.82 | 1.9 | 1.9 |
| Upper Leg (front) | 51.24 | 18.3 | 17.6 |
| Lower leg (back) | 49.24 | 11.2 | 11.7 |
| (%) | (%) | (%) | (%) | (%) | |
|---|---|---|---|---|---|
| Head | 40.14 | 43.31 | 42.04 | 42.19 | 41.92 |
| Forearm | 46.57 | 49.75 | 48.49 | 48.64 | 48.36 |
| Upper arm | 46.89 | 50.08 | 48.81 | 48.96 | 48.68 |
| Bosom | 43.02 | 46.20 | 44.93 | 45.08 | 44.80 |
| Belly | 33.51 | 36.69 | 35.42 | 35.57 | 35.29 |
| Upper back | 43.02 | 46.20 | 44.93 | 45.08 | 44.80 |
| Hand | 44.65 | 47.83 | 46.57 | 46.71 | 46.44 |
| Shoulder | 54.83 | 58.02 | 56.76 | 56.90 | 56.62 |
| Upper Leg | 41.08 | 44.27 | 43.00 | 43.15 | 42.8 |
| Lower leg | 39.08 | 42.26 | 40.99 | 41.14 | 40.86 |
| Low back | 48.59 | 51.78 | 50.51 | 50.66 | 50.38 |
| Average | 43.76 | 46.94 | 45.68 | 45.83 |
| (%) | (%) | |
|---|---|---|
| Summer | 28.73 | 28.27 |
| Winter | 8.04 | 6.75 |
| Spring/Autumn | 16.98 | 16.68 |
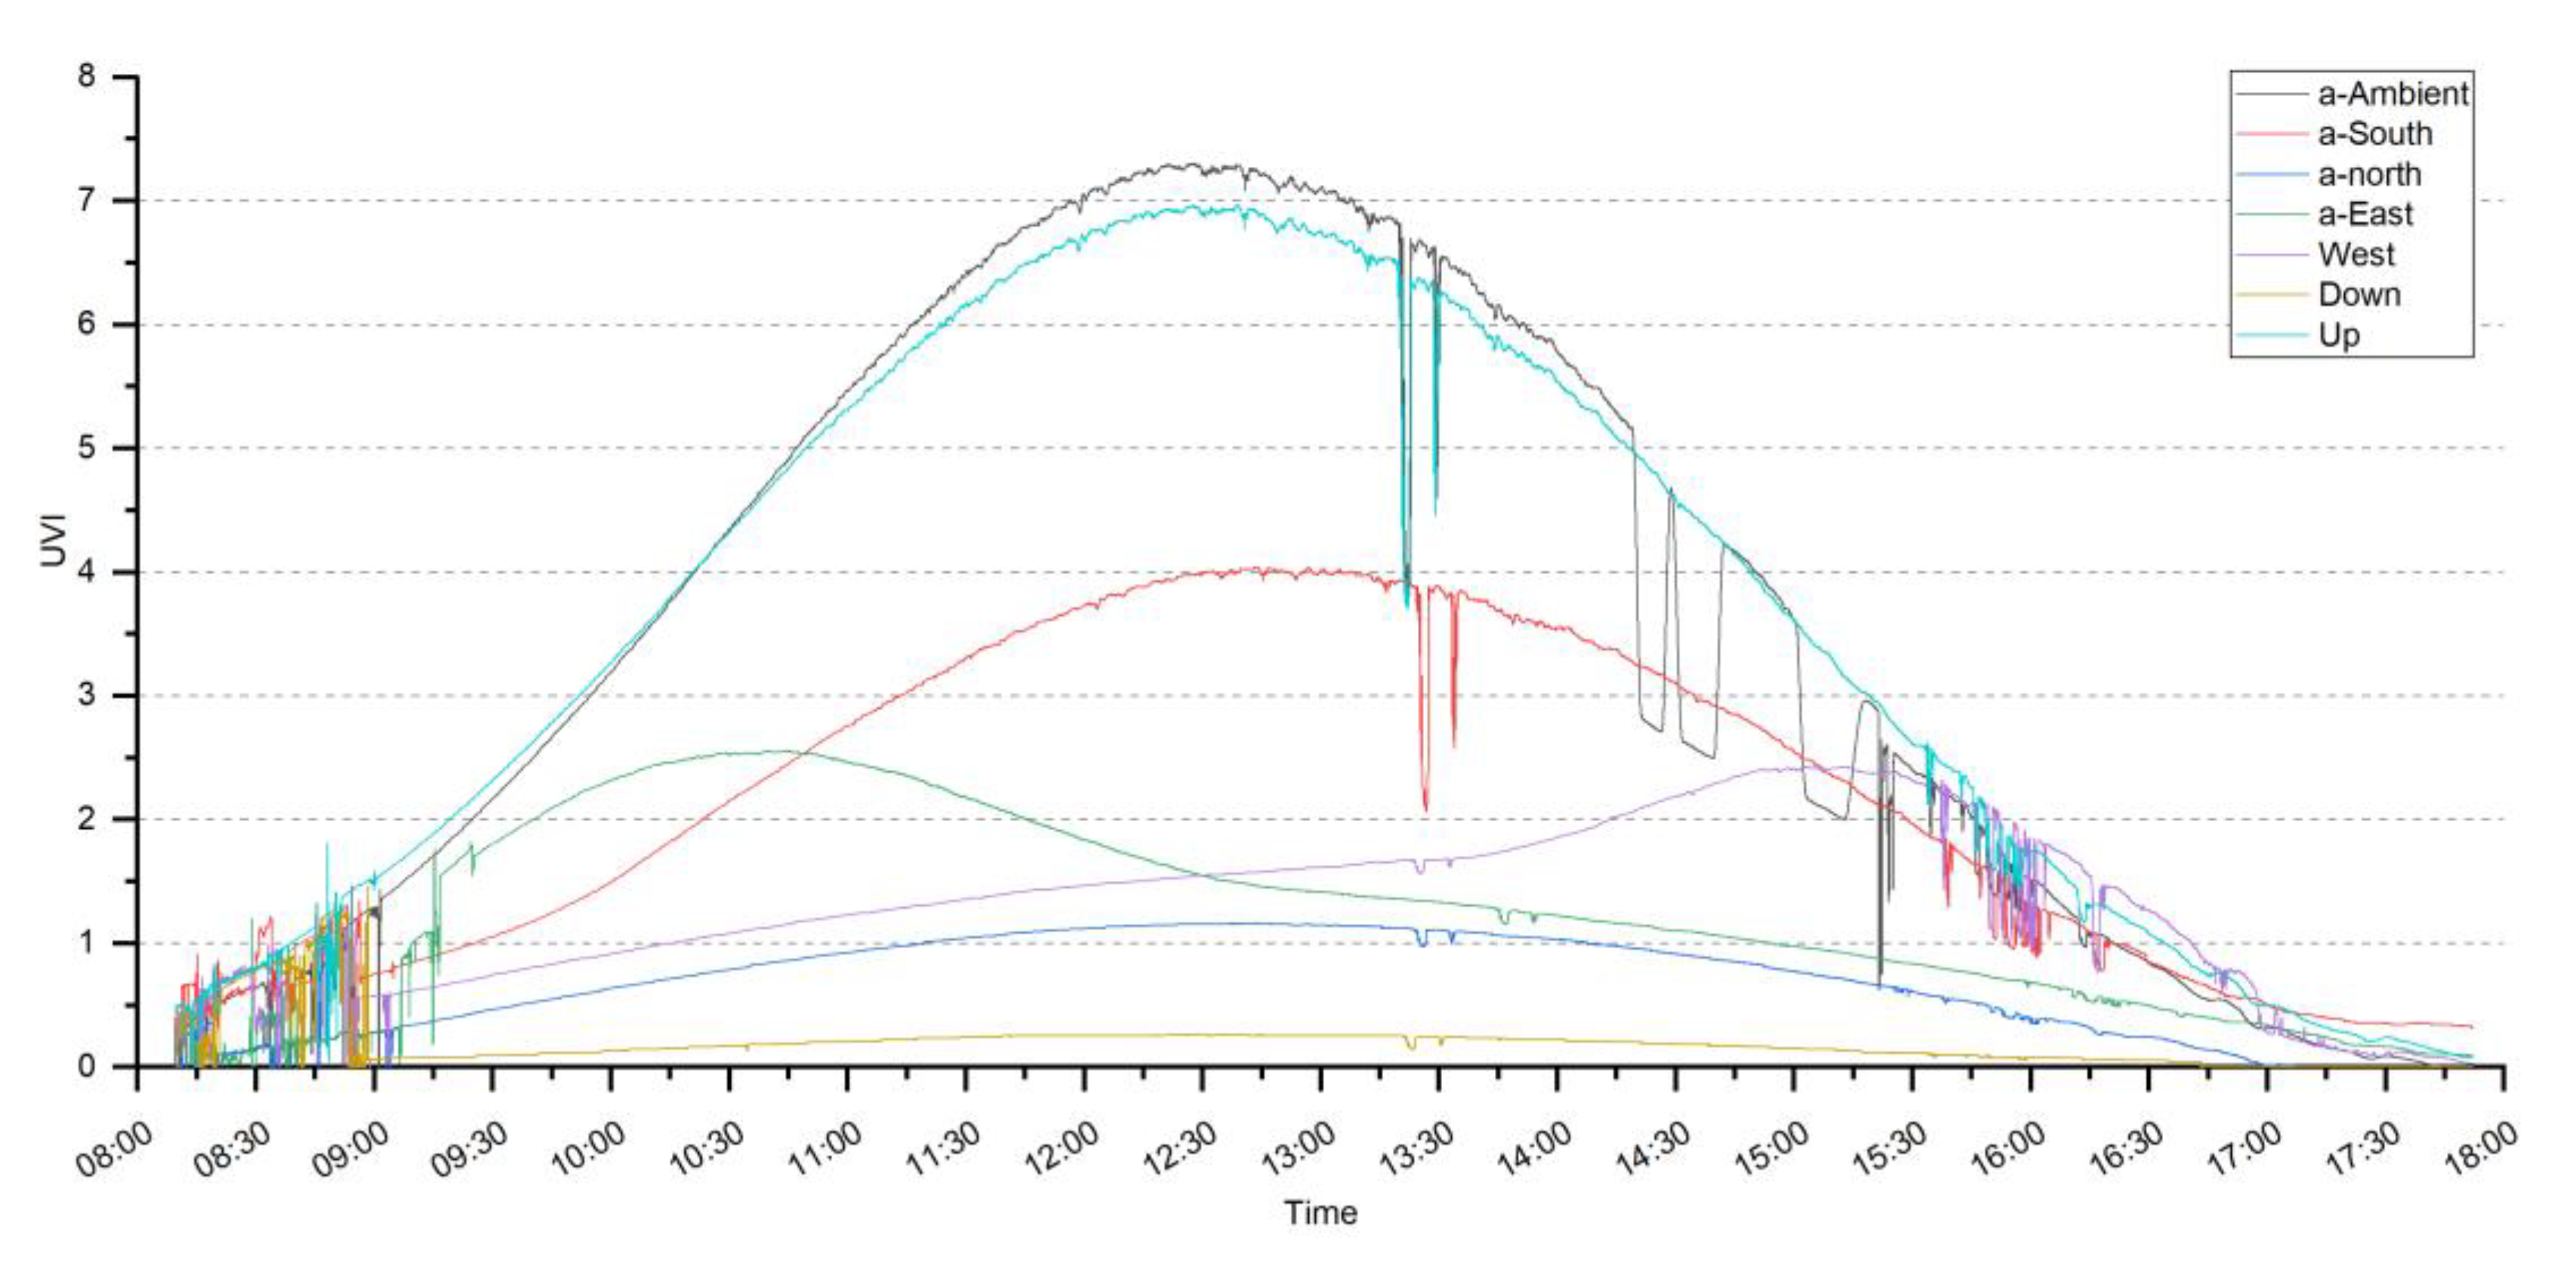
| Maximum (Proportion to Ambient Value%) | Mean (Proportion to Ambient Value%) | Std. Deviation | |
|---|---|---|---|
| Ambient | 7.31 | 3.41 | 2.58 |
| Up | 6.96 (95.2%) | 3.49 (102.3%) | 2.37 |
| South | 3.94 (53.9%) | 2.00 (58.7%) | 1.31 |
| north | 1.29 (17.6%) | 0.46 (13.5%) | 0.41 |
| East | 3.14 (43.0%) | 1.05 (30.8%) | 0.79 |
| West | 2.28 (31.2%) | 1.11 (32.6%) | 0.66 |
| Down | 1.14 (15.6%) | 0.13(3.8%) | 0.20 |
| Up | South | North | East | West | |
|---|---|---|---|---|---|
 |  |  |  |  | |
| SVF/SiVF | 0% | 9.10% | 13.53% | 14.50% | 8.63% |
| UVI | 0.15 | 0.63 | 0.57 | 0.54 | 0.75 |
© 2020 by the authors. Licensee MDPI, Basel, Switzerland. This article is an open access article distributed under the terms and conditions of the Creative Commons Attribution (CC BY) license (http://creativecommons.org/licenses/by/4.0/).
Share and Cite
Cheng, W.; Brown, R.; Vernez, D.; Goldberg, D. Estimation of Individual Exposure to Erythemal Weighted UVR by Multi-Sensor Measurements and Integral Calculation. Sensors 2020, 20, 4068. https://doi.org/10.3390/s20154068
Cheng W, Brown R, Vernez D, Goldberg D. Estimation of Individual Exposure to Erythemal Weighted UVR by Multi-Sensor Measurements and Integral Calculation. Sensors. 2020; 20(15):4068. https://doi.org/10.3390/s20154068
Chicago/Turabian StyleCheng, Wenwen, Robert Brown, David Vernez, and Daniel Goldberg. 2020. "Estimation of Individual Exposure to Erythemal Weighted UVR by Multi-Sensor Measurements and Integral Calculation" Sensors 20, no. 15: 4068. https://doi.org/10.3390/s20154068
APA StyleCheng, W., Brown, R., Vernez, D., & Goldberg, D. (2020). Estimation of Individual Exposure to Erythemal Weighted UVR by Multi-Sensor Measurements and Integral Calculation. Sensors, 20(15), 4068. https://doi.org/10.3390/s20154068