Article

Synthesis, Photophysical Characterization, and Sensor Activity of New 1,8-Naphthalimide Derivatives

by
Stanislava Yordanova-Tomova
1,
Diana Cheshmedzhieva
1,
Stanimir Stoyanov
1,
Todor Dudev
1 and
Ivo Grabchev
2,*
1
Faculty of Chemistry and Pharmacy, Sofia University “St. Kliment Ohridski”, 1 J. Baurchier blvd., 1164 Sofia, Bulgaria
2
Faculty of Medicine, Sofia University “St. Kliment Ohridski”, 1 Koziak str., 1407 Sofia, Bulgaria
*
Author to whom correspondence should be addressed.
Sensors 2020, 20(14), 3892; https://doi.org/10.3390/s20143892
Submission received: 13 June 2020 / Revised: 8 July 2020 / Accepted: 9 July 2020 / Published: 13 July 2020
(This article belongs to the Special Issue Development and Application of Chemosensors)

Abstract

:
Three new 1,8-naphthalimide derivatives M1M3 with different substituents at the C-4 position have been synthesized and characterized. Their photophysical properties have been investigated in organic solvents of different polarity, and their fluorescence intensity was found to depend strongly on both the polarity of the solvents and the type of substituent at C-4. For compounds M1 and M2 having a tertiary amino group linked via an ethylene bridge to the chromophore system, high quantum yield was observed only in non-polar media, whereas for compound M3, the quantum efficiency did not depend on the medium polarity. The effect of different metal ions (Ag+, Ba2+, Cu2+, Co2+, Mg2+, Pb2+, Sr2+, Fe3+, and Sn2+) on the fluorescence emission of compounds M1 and M2 was investigated. A significant enhancement has been observed in the presence of Ag+, Pb2+, Sn2+, Co2+, Fe3+, as this effect is expressed more preferably in the case of M2. Both compounds have shown significant pH dependence, as the fluorescence intensity was low in alkaline medium and has been enhanced more than 20-fold in acidic medium. The metal ions and pH do not affect the fluorescence intensity of M3. Density-functional theory (DFT) and Time-dependent density-functional theory (TDDFT) quantum chemical calculations are employed in deciphering the intimate mechanism of sensor mechanism. The functional properties of M1 and M2 were compared with polyamidoamine (PAMAM) dendrimers of different generations modified with 1,8-naphthalimide.

1. Introduction

Fluorescence analysis of various analytes is a highly sensitive analytical method. It is based on the interaction between the analyte and a receptor fragment bound to a fluorescent molecule, resulting in changes in its photophysical characteristics [1]. Since the interaction is at the molecular level, extremely low concentrations of analytes can be detected by this method, making it highly effective. Fluorescence sensors operating on the principle of photoinduced electron transfer (PET) are of great scientific interest, because their emission can be selectively ‘switched on’ or ‘switched off’ in the presence of analytes [2,3,4]. Various fluorescence chromophore systems such as 1,8-naphthalimide, benzanthrone, xanthene derivatives, etc. are used as a signal fragment in the design of PET sensor systems [5,6,7,8,9,10,11,12,13]. Very important among these are the derivatives of 1,8-naphthalimide, which depending on the nature of the C-4 substituents, may emit blue or yellow-green fluorescence [14,15,16,17]. In most cases, this position contains receptor fragments that can react with the analytes tested, which determines the color of the fluorescence emitted by the sensor [4,18,19]. In the design of sensing systems for the detection of metal ions or protons, 1,8-naphthalimides can be used as a signaling fragment. Tertiary amines attached to the chromophore system via an ethylene spacer are mainly used as receptors in the detection of metal ions and protons. Such 1,8-naphthalimides can be used as individual molecules [20,21,22,23,24] or incorporated into dendrimer structures [25,26,27,28], hyperbranched polymers [29,30], or linear polymers [31,32,33,34]. In this way, the selectivity and sensitivity of the sensors can be varied. In our previous works, we have been used 1,8-naphthalimides having as a substituent at the C-4 position N,N-dimethylethylenediamine residue or a similar cyclic system such as N-methylpiperazine for the peripheral modification of PAMAM dendrimers from zero (with four 1,8-naphthalimides) first (with eight 1,8-naphthalimides) and third (with 16 1,8-naphthalimides) generations. It has been shown that the sensor capacity of these dendrimers depends strongly on their generation [5,35,36].
In recent years, Density-functional theory (DFT) and Time-dependent density-functional theory (TDDFT)methods have proven themselves as useful and reliable tools for designing and developing fluorescence sensors [37,38]. They provide an accurate picture of the electronic structure of fluorescent compounds, thus giving insight into the intimate mechanism of relevant photophysical processes.
The aim of this work is to synthesize three new derivatives of 1,8-naphthalimide with substituents at the C-4 atom, respectively N,N-dimethylethylendiamino, N-methylpiperazine, and N-propylamine. The substituent bonded to the imide nitrogen atom was N-Acetylethylenediamine. Those derivatives can be considered as a part of the internal PAMAM dendrimer structure. The functional properties of the new compounds thus obtained were investigated and compared with those of the corresponding dendrimers.

2. Materials and Methods

UV/Vis absorption spectra were recorded on a “Thermo Spectronic Unicam UV 500” spectrophotometer. Fluorescence investigations were performed on a “Cary Eclipse” spectrophotometer. In all spectroscopic measurements, 1 cm path length synthetic quartz glass cells were used. The organic solvents (spectroscopic grade) used in this study were: chloroform (CHCl3), ethyl acetate (EtOAc), dichloromethane (DCM), 1,4-dioxane (Dioxane), dimethyl sulfoxide (DMSO), acetonitrile (MeCN), N,N-dimethylformamide (DMF), methanol (MeOH), and ethanol (EtOH).
The fluorescence quantum yield has been calculated on the basis of the absorption and fluorescence spectra by Equation (1).
Φ F = Φ st S u S st A st A u n Du 2 n Dst 2
where the ΦF is the emission quantum yield of the sample; Φst = 0.78 in ethanol [39] is the emission quantum yield of the standard (Coumarin 6); Ast and Au represent the absorbance of the standard and sample at the excited wavelength, respectively; Sst and Su are the integrated emission band areas of the standard and sample, respectively; nDst and nDu are the solvent refractive index of the standard and sample; and subscripts u and s refer to the unknown and standard, respectively.
The effect of the metal cations upon the fluorescence intensity was examined by adding a few µL of stock solution (c = 10−2 mol L−1) of the metal cations to a known volume of the monomer solution (3 mL). The addition was limited to 0.08 mL, so that dilution remains insignificant [40]. For all absorption and fluorescence measurements, the dye concentration in solutions was 1 × 10⁻⁵ M. FTIR spectra were recorded on a Bruker IFS-113v spectrometer, Bruker, Karlsruhe, Germany, by the KBr pellet technique at a 2 cm−1 resolution. The NMR spectra were obtained on a Bruker DRX-250 spectrometer, Bruker, Karlsruhe, Germany, operating at 250.13 and 62.90 MHz for 1H and 13C, respectively, using a dual 5 mm probe head. DMSO-d6 and tetramethylsilane were used as a solvent and an internal standard, respectively. Thin layer chromatographic (TLC) analysis was performed on silica gel plates (Fluka F60 254 20 × 20; 0.2 mm) using the solvent system n-heptane/acetone (1:1) as an eluent, if not mentioned otherwise. The following salts were used as a source for metal cations: MgCl2·6H2O, Pb(NO3)2, SrCl2, FeCl3·6H2O, AgNO3, CuSO4·5H2O, Co(NO3)2·6H2O, BaCl2·2H2O, and SnCl2·2H2O (Sigma-Aldrich, Taufkirchen, Germany).

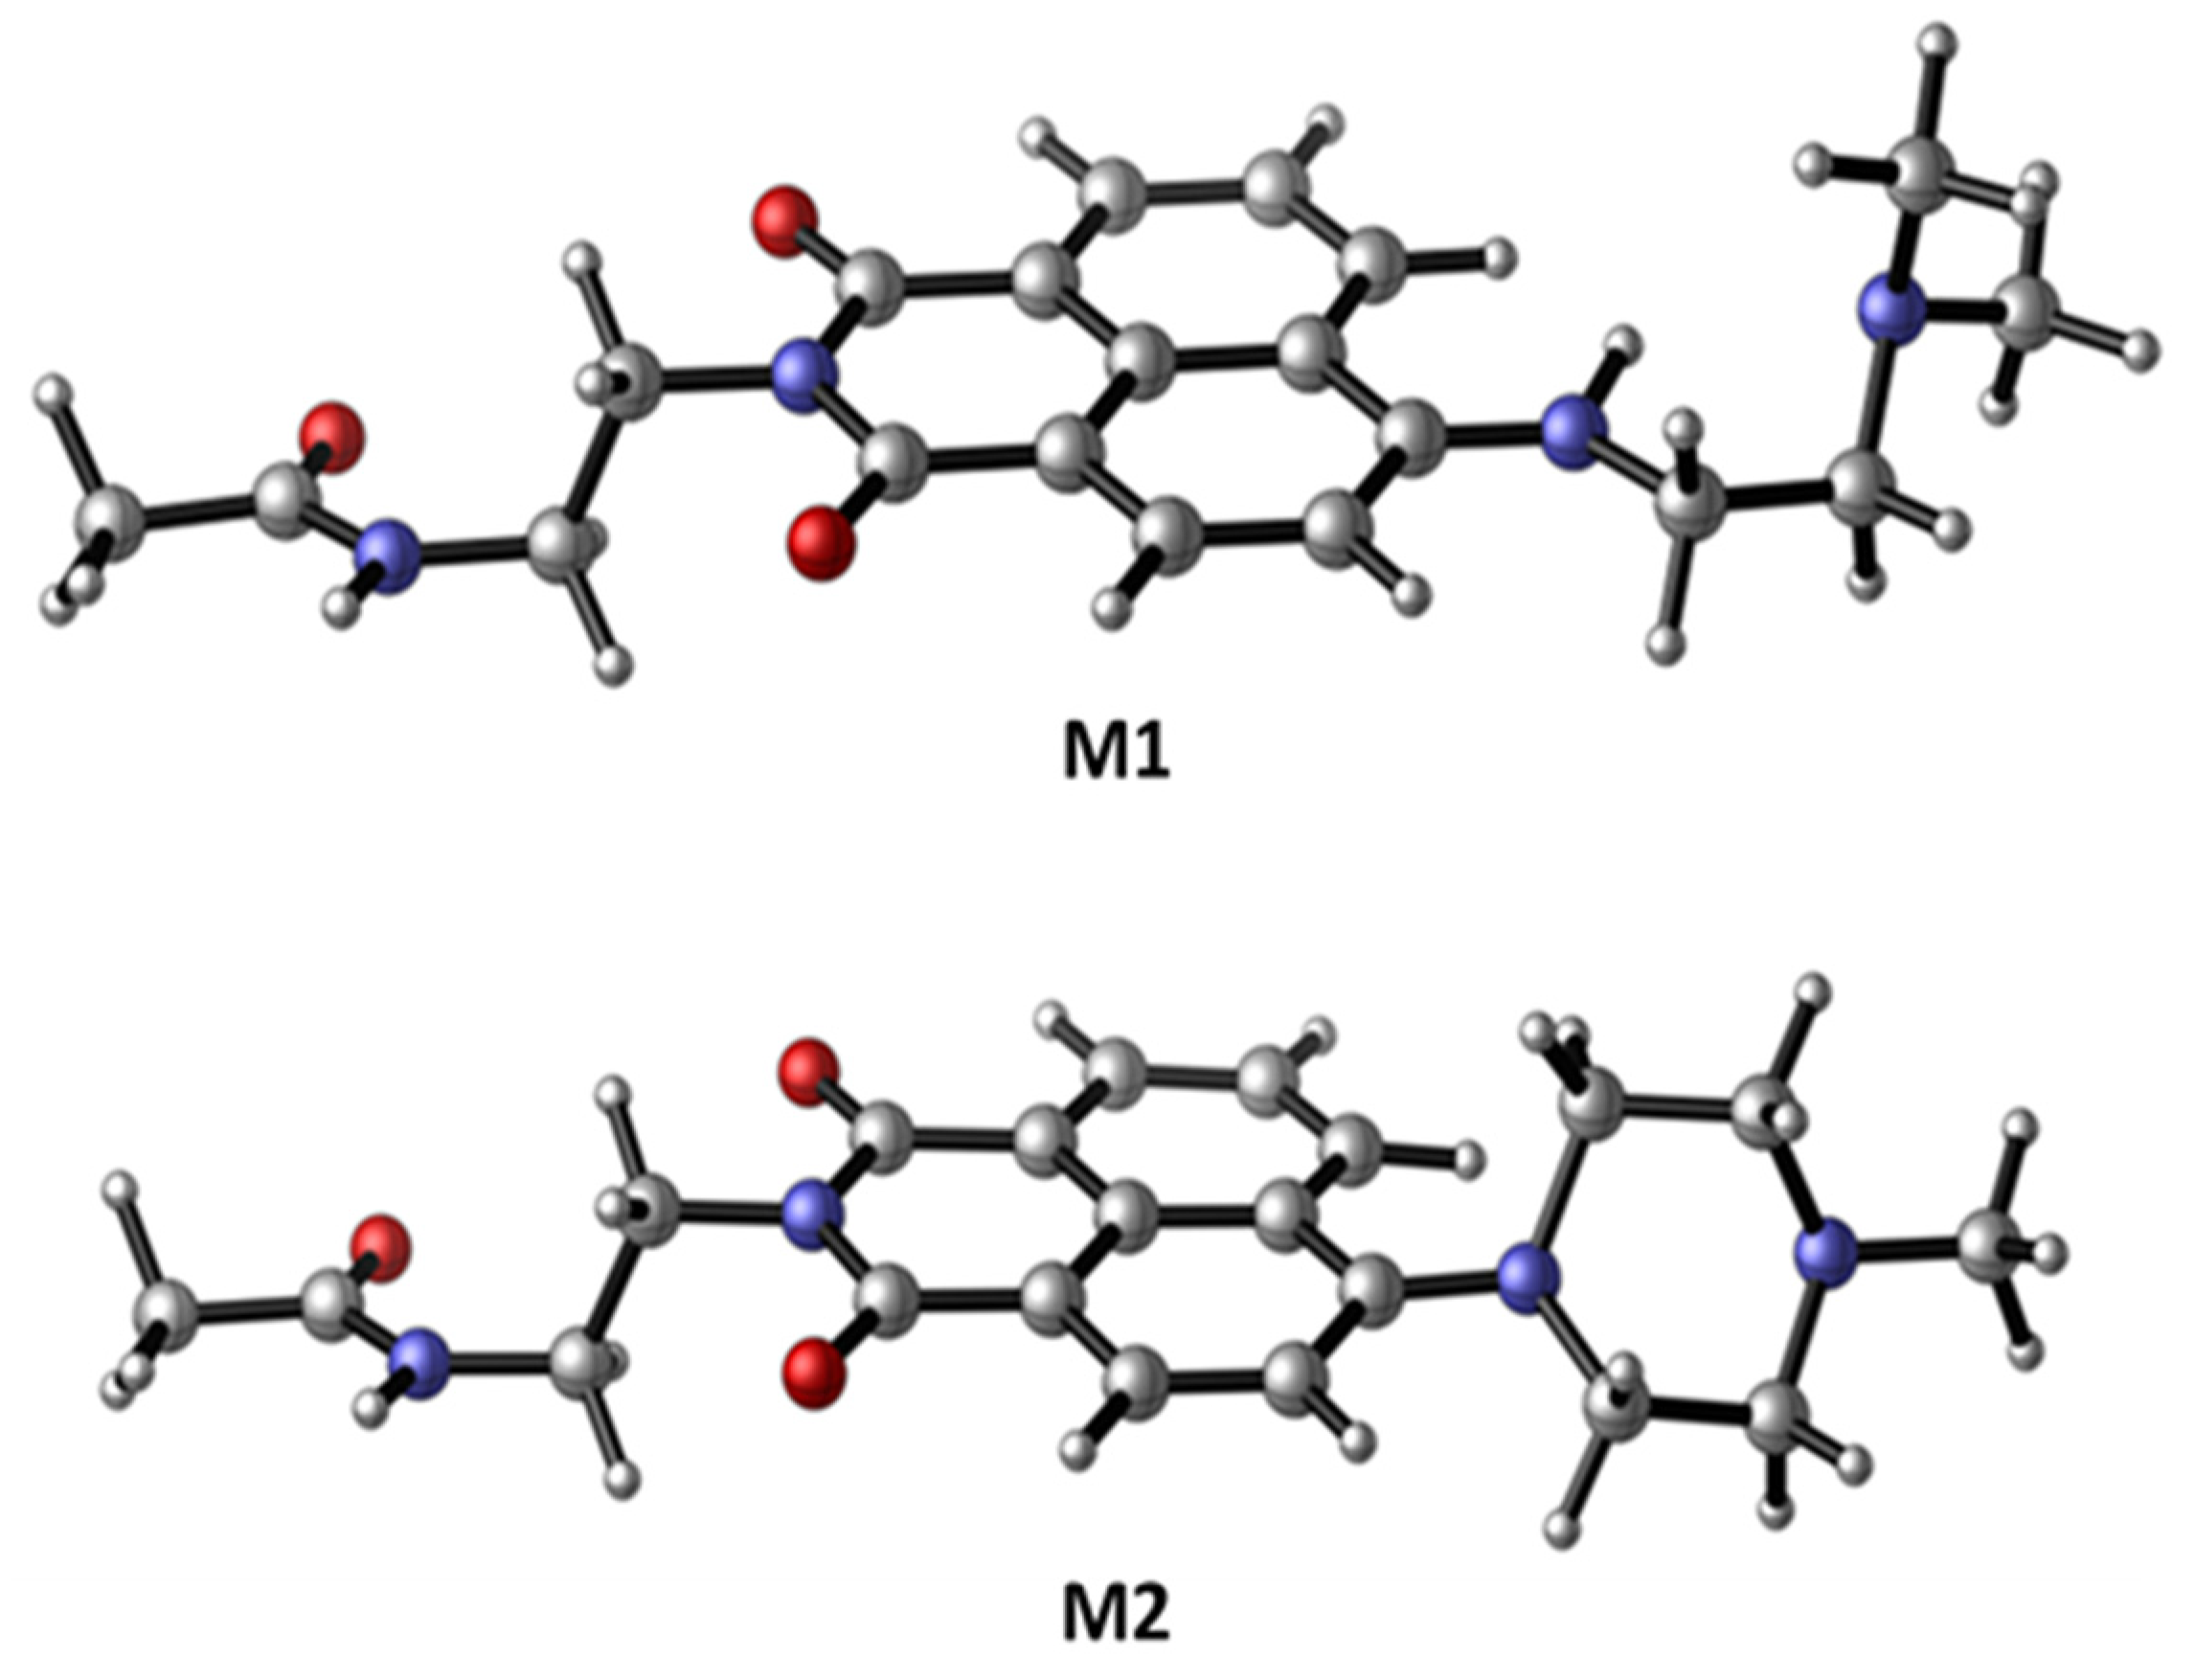
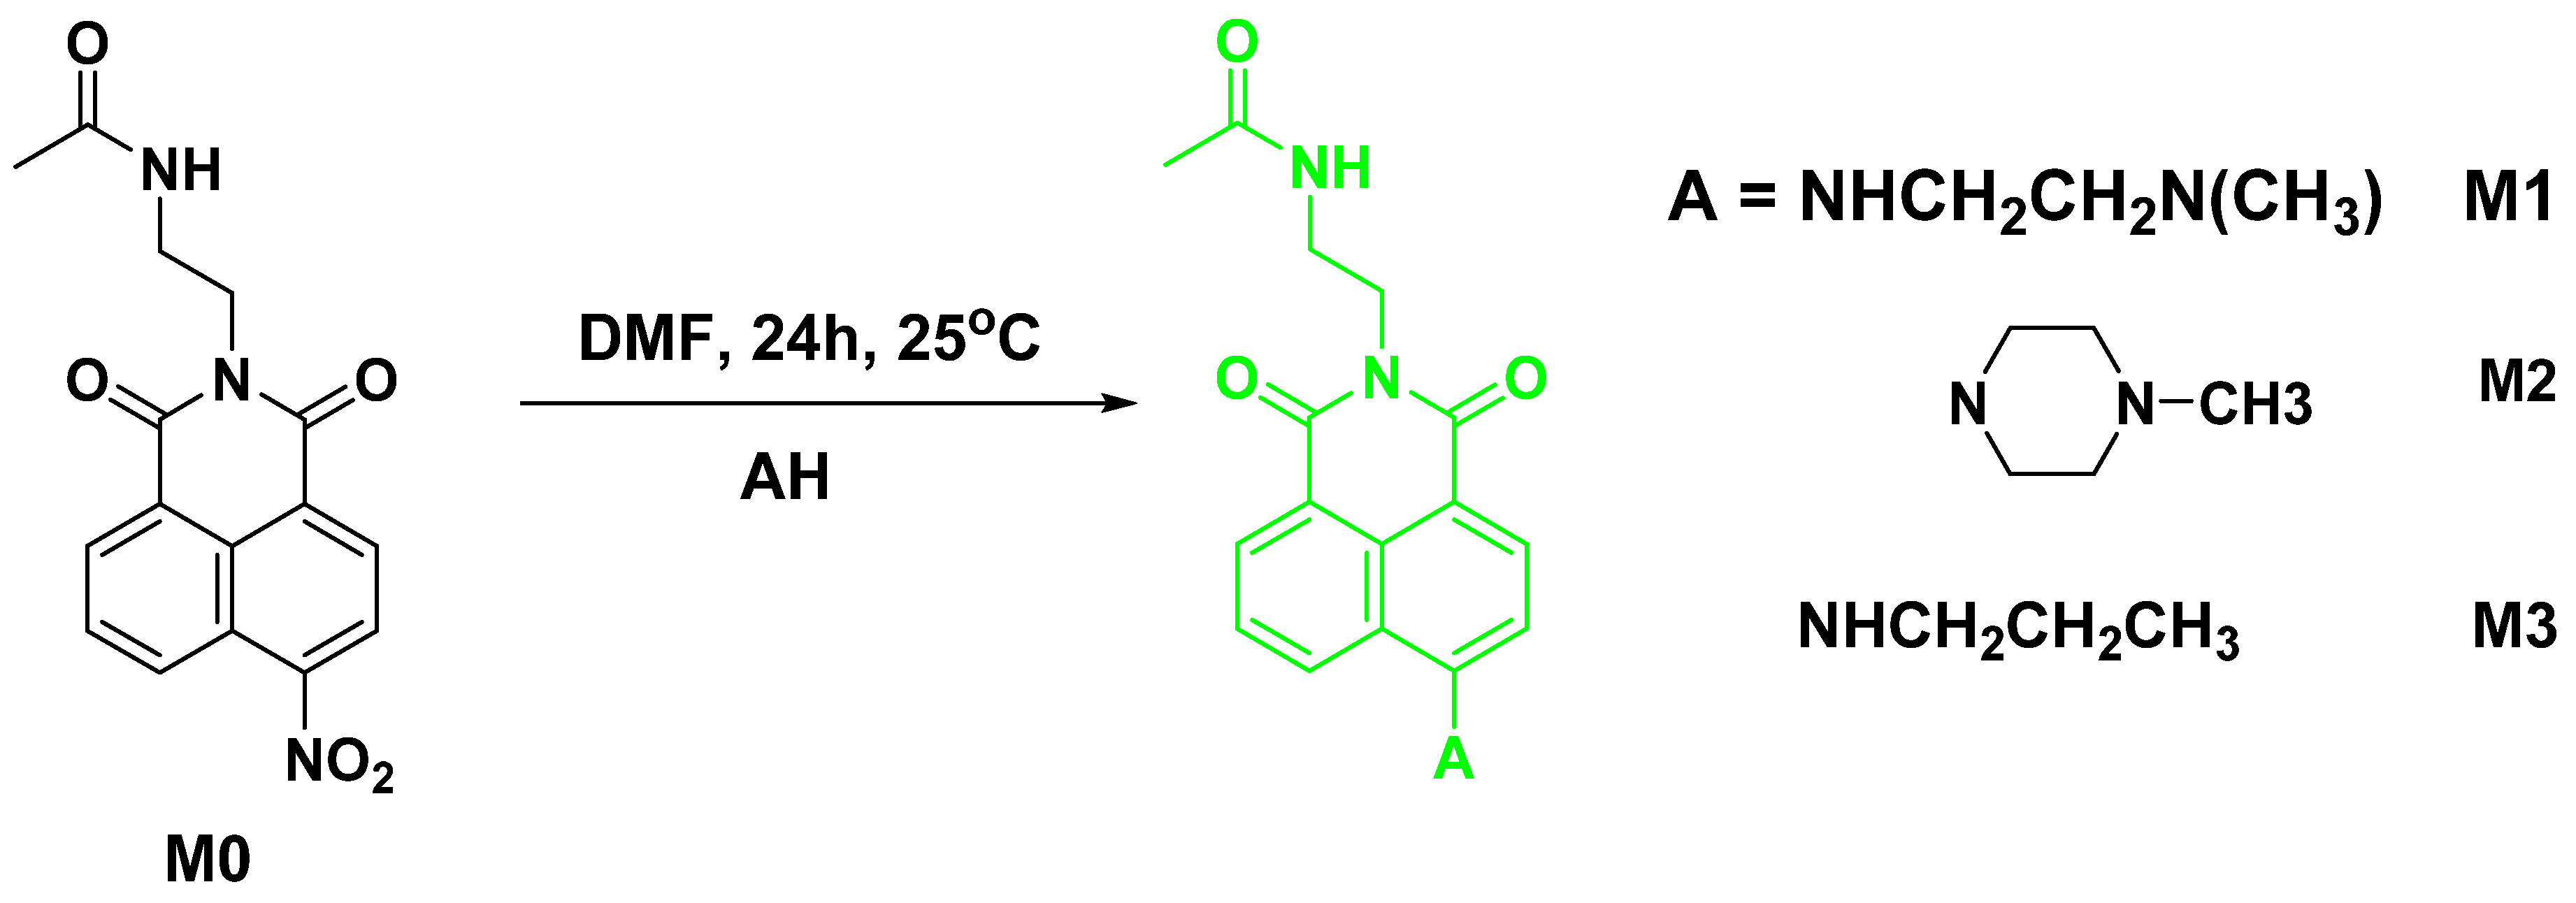
2.1. Synthesis of N-(2-(6-((2-(dimethylamino)ethyl)amino)-1,3-dioxo-1H-benzo[de]isoquinolin-2(3H)-yl)ethyl)acetamide M1

A mixture of M0 (0.002 mol) and N,N-dimethylethylendiamine (0.0025 mol) in 5 mL of DMF was stirred at room temperature for 24 h. After that, water (100 mL) was added to the solution, the precipitate was filtered off, washed several times with water, and then air-dried at 40 °C. Yield: 89%.
FT-IR (cm−1): 3323, 2956, 2931, 2872, 1683, 1629, 1558, 1350, 1105, 1062, 777, 758;
1H-NMR (250.13 MHz, DMSO-d6): 8.46–8.45 (d, J = 7.27 Hz, 1H), 8.42 (d, J = 8.17 Hz, 1H), 7.94 (t, J = 7.52 Hz, 1H), 7.80 (t, J = 7.82 Hz, 1H), 7.33 (d, J = 7.69 Hz, 1H), 4.09 (t, J = 7.89 Hz, 2H), 3.34 (q, 6H), 3.27 (s, 4H), 2.30 (s, 3H), 1.68 (s, 3H);
13C-NMR (62.9 MHz, DMSO-d6): d 169.8, 164.4, 163.5, 151.0, 134.7, 131.0, 130.1, 128.8, 124.6, 122.4, 120.5, 111.3, 108.1, 104.2, 45.0, 37.1, 23.0, 21.6, 12.0;
Anal.: Calcd. (%) for C20H24N4O3 (368.1): C 65.20; H 6.57; N 15.21. Found: C 65.13; H 6.50; N 15.28.

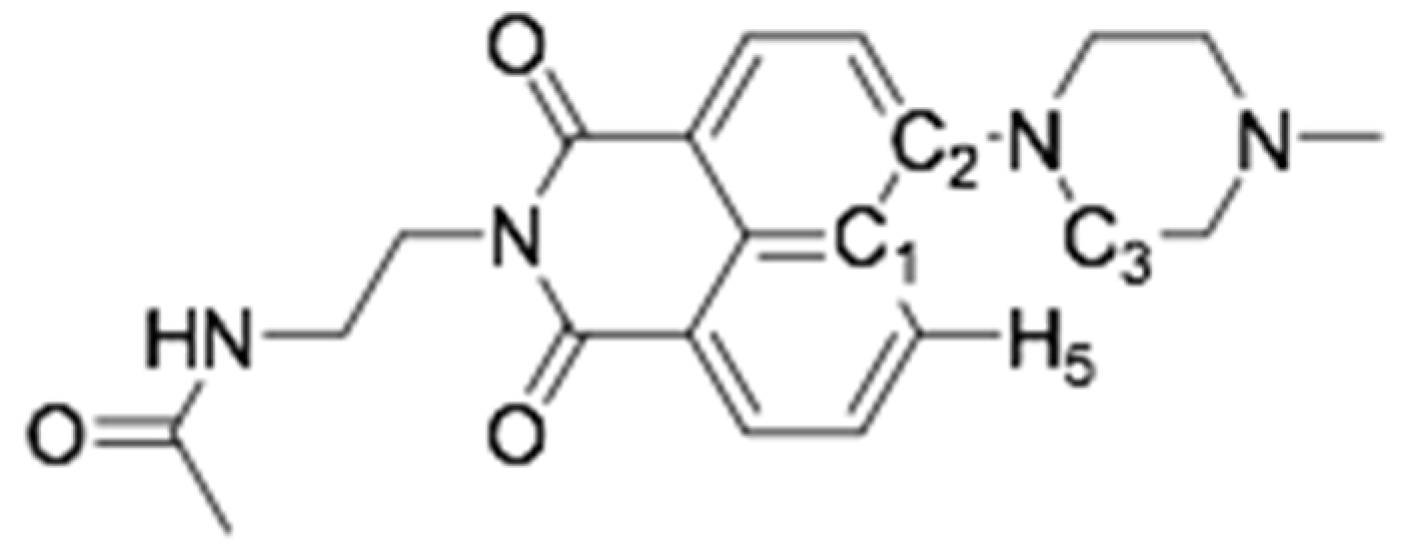
2.2. Synthesis of N-(2-(6-(4-methylpiperazin-1-yl)-1,3-dioxo-1H-benzo[de]isoquinolin-2(3H)-yl)ethyl)acetamide (M2)

The synthesis was carried out according to the procedure described for M1 using N-methylpiperazine as reactant. Yield: 86%.
FT-IR (cm−1): 3292, 2937, 2792, 1685, 1645, 1359, 1346, 1232, 1180, 1008, 786, 761;
1H-NMR (250.13 MHz, DMSO-d6): 8.89 (d, J = 7.07 Hz, 1H), 8.68 (d, J = 8.17 Hz, 1H), 8.20 (t, J = 7.55 Hz, 1H), 7.93 (t, J = 7.47 Hz, 1H), 7.87 (t, J = 7.21 Hz, 1H), 7.05 (d, J = 8.03 Hz, 1H), 4.33 (t, J = 7.20 Hz, 2H), 3.75 (t, J = 7.44 Hz, 2H), 2.75 (s, 6H), 1.97 (s, 3H);
13C-NMR (62.9 MHz, DMSO-d6), d: 169.8, 164.3, 163.8, 156.0, 132.5, 131.0, 130.8, 129.8, 126.5, 125.8, 123.3, 116.3, 115.5, 55.1, 53.0, 46.2, 36.9, 23.0;
Anal.: Calcd. (%) for C21H24N4O3 (380.3): C 66.30; H 6.36; N 14.73. Found C 66.39; H 6.31; N 14.79.

2.3. Synthesis of N-(2-(1,3-dioxo-6-(propylamino)-1H-benzo[de]isoquinolin-2(3H)-yl)ethyl)acetamide (M3)

The synthesis was carried out according to the procedure described for M1 using n-propylamine as reactant. Yield: 94%.
FT-IR (cm−1): 3332, 2995, 2777, 1678, 1654, 1361, 1188, 1109, 1062, 1022, 779, 754;
1H-NMR (250.13 MHz, DMSO-d6): 8.69 (d, J = 7.47 Hz, 1H), 8.41 (d, J = 8.33 Hz, 1H), 8.23 (d, J = 7.47 Hz, 1H), 7.94 (t, J = 7.11 Hz, 1H), 7.65 (t, J = 7.59 Hz, 1H), 7.61 (t, J = 7.84 Hz, 1H), 4.07 (t, J = 7.42 Hz, 2H), 3.09 (m, 2H), 1.73–1.64 (m, 4H), 0.98 (t, J = 8.01 Hz, 3H);
13C-NMR (62.9 MHz, DMSO-d6), d: 169.8, 164.4, 163.5, 150.9, 134.7, 131.1, 130.0, 128.7, 124.9, 122.4, 120.5, 108.3, 104.2, 57.3, 45.7, 41.3, 37.0, 23.0;
Anal.: Calcd. (%) for C19H21N3O3 (339.2): C 67.20; H 6.24; N 12.38. Found: C 67.31; H 6.28; N 12.30.

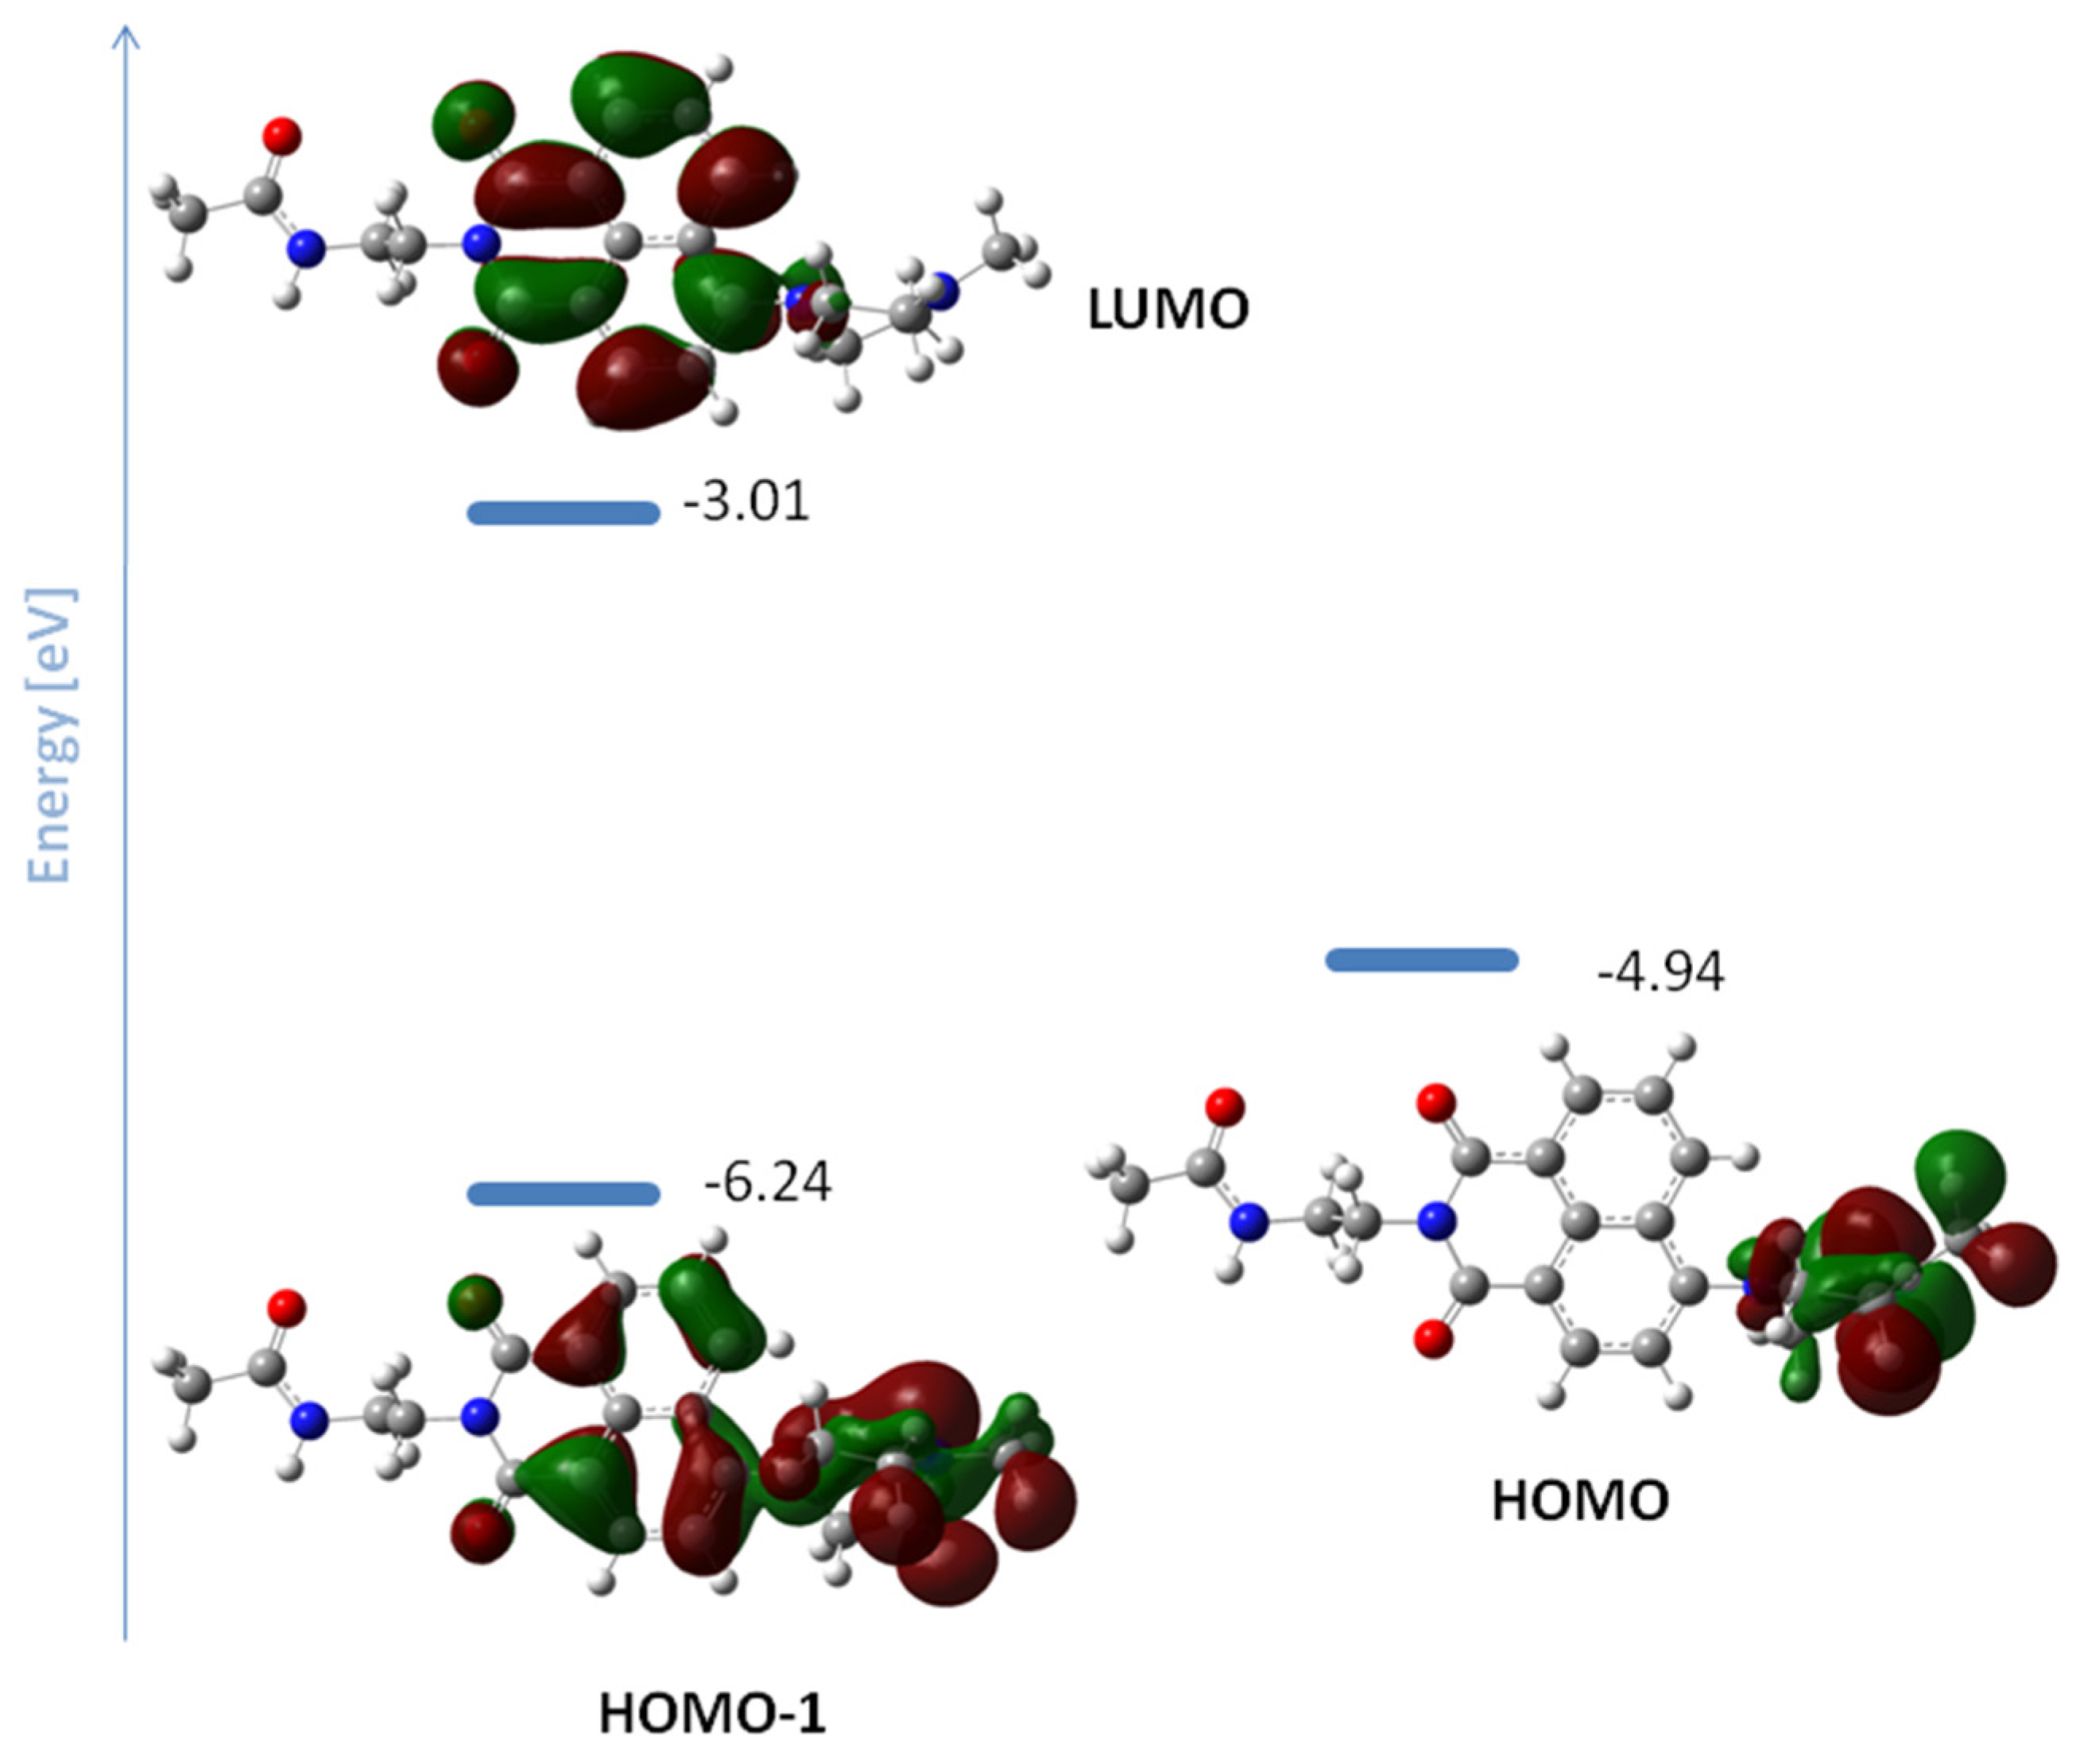
2.4. Computational Details

The geometry optimization and photophysical properties of compounds were modeled with G16 software package [41]. The optimization of the ground and excited state geometry for M1 and M2 was performed within DFT [42] and TDDFT [43,44,45] formalisms, respectively. The theoretical computations have been carried out using B3LYP [46,47], PBE0 [48,49], and M06-2X [50] functionals in conjunction with 6-31+G(d,p) [51] and 6-311++G(d,p) [52] basis sets. Vibrational frequencies were evaluated for each structure at the same method/basis set to verify that the structures are indeed a minimum of the potential energy surface, and no imaginary frequency was found. The absorption wavelengths were determined by TDDFT calculations of vertical excitations. To simulate the fluorescence, the optimization of the excited state, corresponding to HOMO→LUMO transition was performed at TDDFT. Solvent effects were examined at each step by means of PCM formalism [53,54]. All the computations were performed in acetonitrile to reproduce the experimental conditions.

3. Results

3.1. Synthesis of Compounds M1M3

4-((2-dimethylaminoethyl)amino)-N-(2-acetamidoethyl)-1,8-naphthalimide (M1), 4-(4-methylpiperazin-1-yl)-N-(2-acetamidoethyl)-1,8-naphthalimide (M2), and 4-(n-propylamino)-N-(2-acetamidoethyl)-1,8-naphthalimide (M3) were obtained in good yields by the nucleophilic substitution of 4-nitro-N-(2-acetamidoethyl)-1,8-naphthalimide (M0) using primary amines in DMF solution at room temperature for 24 h (Scheme 1) according the method described previously [55]. The choice of the substituent attached to the imide nitrogen atom of the chromophore system is due to the fact that the new compounds can be considered as a structural element of modified with 1,8-naphthalimides polyamidoamine (PAMAM) dendrimers from different generations [5,35,36].

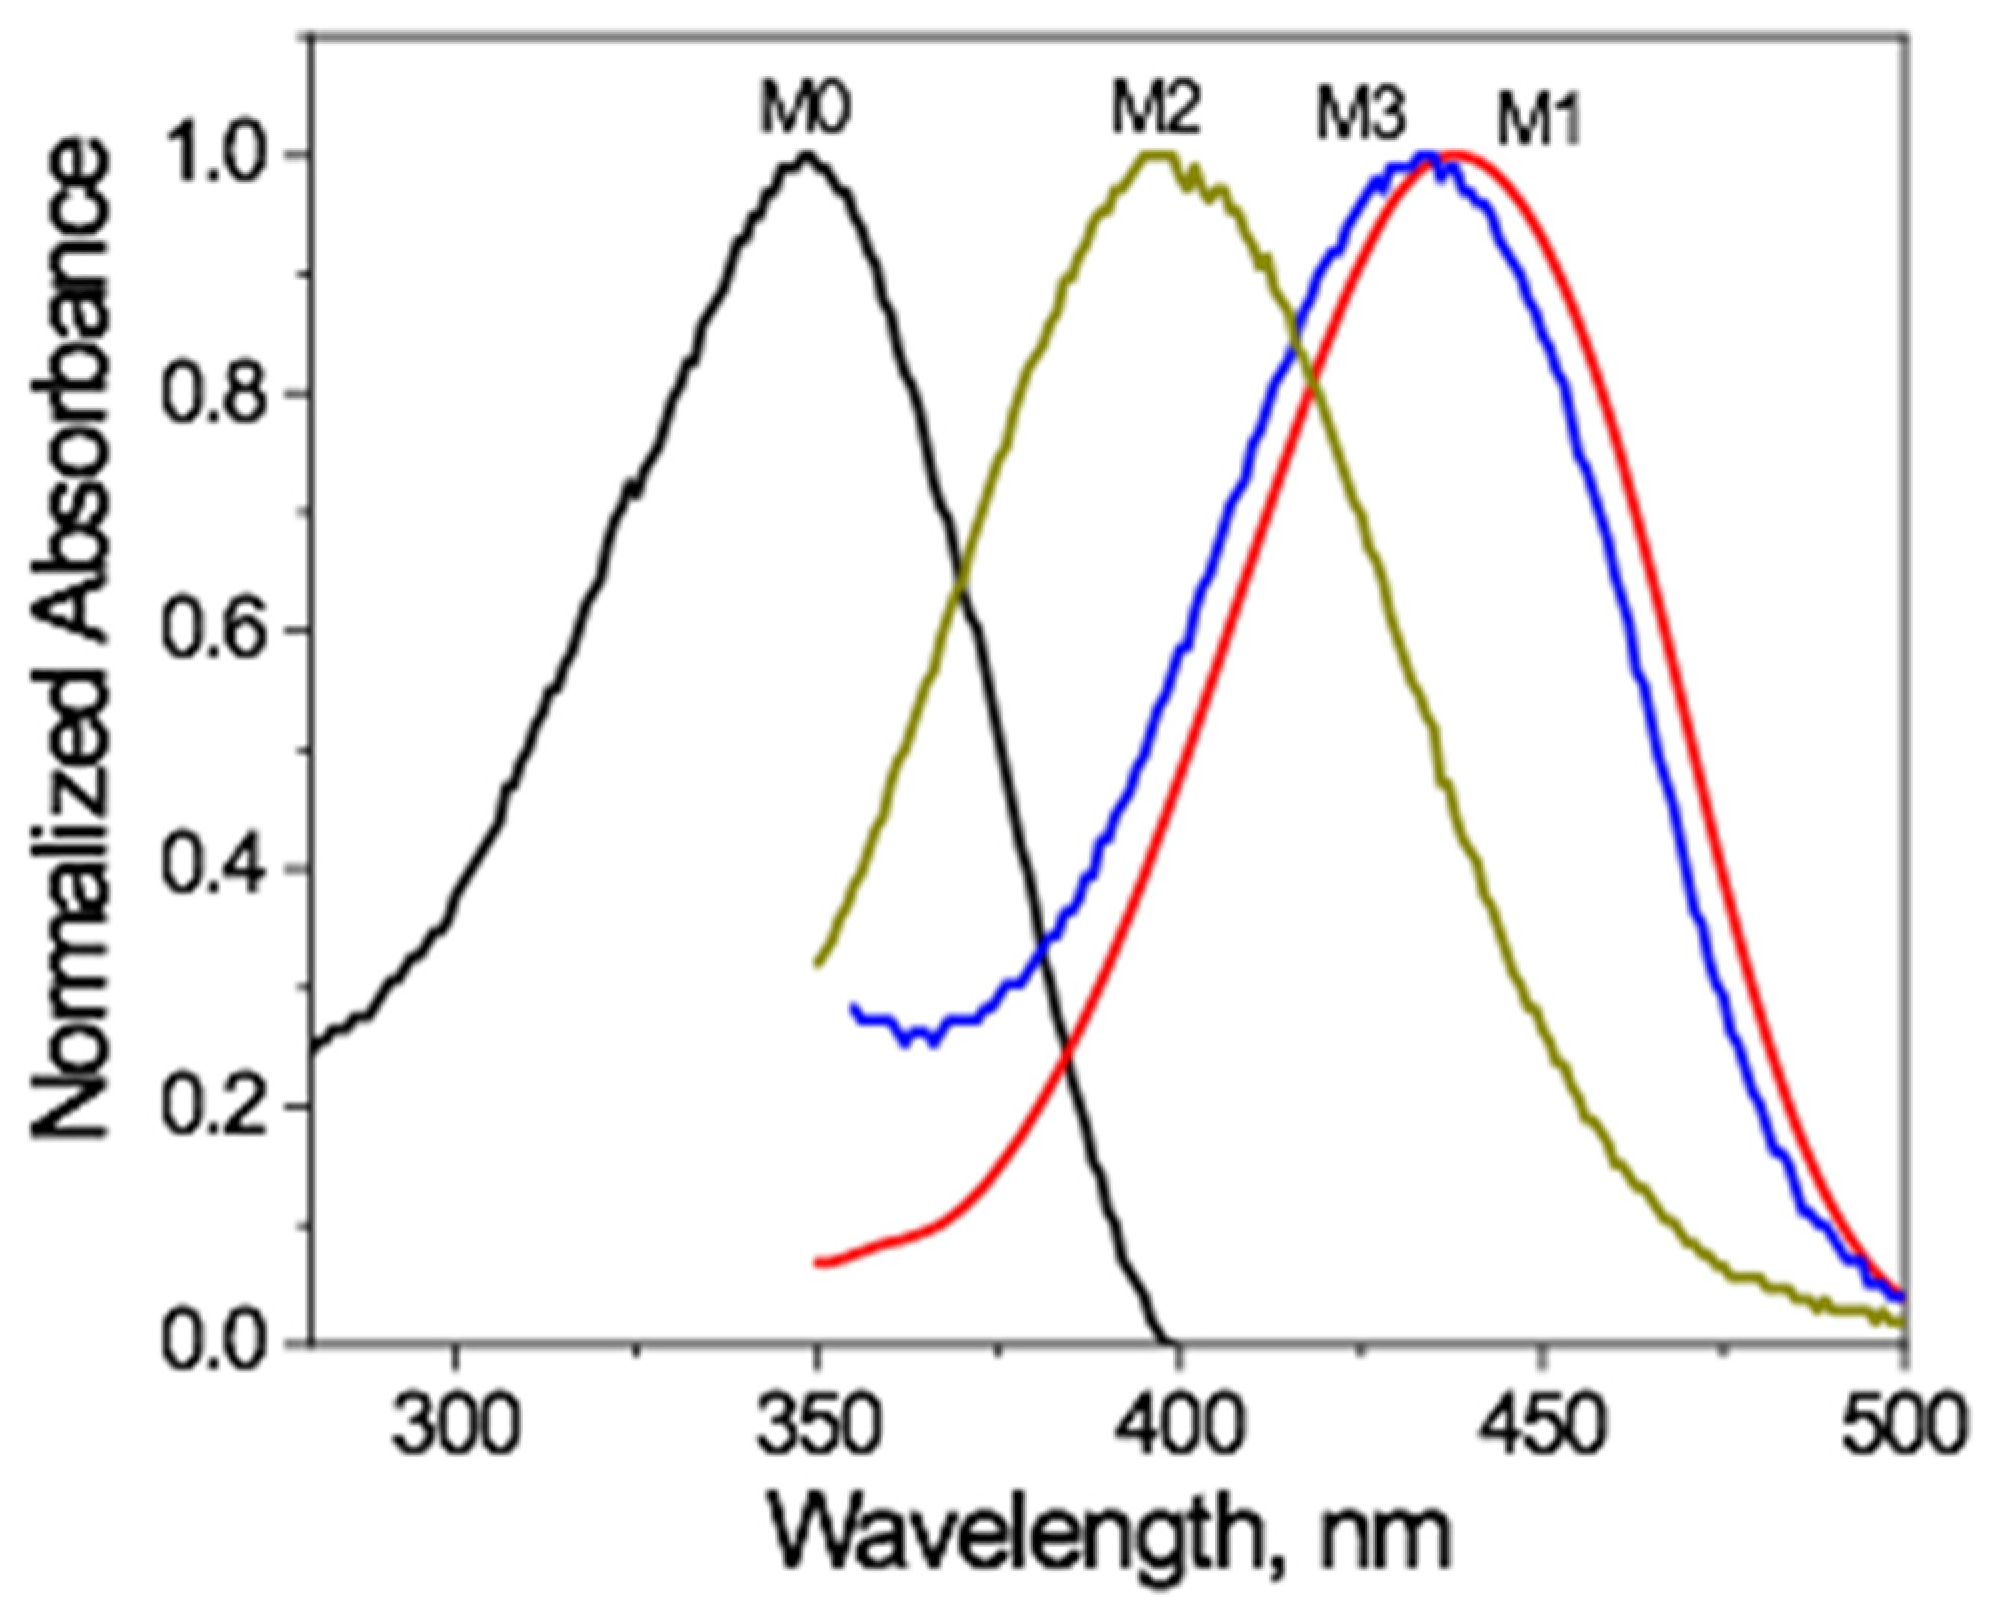
3.2. Spectral Properties

The spectral characteristics of newly synthesized compounds M1M3 have been evaluated in various organic solvents, and the results are summarized in Table 1: absorption (λabs) and fluorescence (λflu) maxima, Stokes shifts (ΔνSt), molar absorptivity (ε), and fluorescence quantum yield (Φst).
In all the studied organic solvents, the compounds have an intense yellow color. Their absorption maxima depend on the type of substituents at the C-4 position and are respectively at 426–436 nm for M1, 394–406 nm for M2, and 427–444 nm for M3. This values are typical for 1,8-naphthalimides with intramolecular charge transfer (CT) [56]. The CT transitions are manifested in a substantial bathochromic shift compared to nitro-substituted M0 (Figure 1) and the dependence of the maxima positions by the solvent polarity and especially their proton-donation ability. Similar behavior has been observed in the case of dendrimers [5,35,36].
From Figure 1, it can be seen that the absorption maximum of compound M2 is hypsochromically shifted by about 40 nm compared to those compounds M1 and M3, which have a mono-alkylamino group as a substituent on the C-4 group. This large difference can be explained by the interaction of the hydrogen atom at position C-5 and the substituents at C-4, which disrupts the planarity and respectively leads to a lower degree of conjugation [57]. All three compounds emit yellow-green fluorescence with maxima at the range 502–534 nm for M1 and M3. The respective maxima of M2 are slightly hypsochromically shifted compared to those of M1 and M3 (Table 1).
The Stokes shift is an important parameter indicating the difference between the structure and functional properties of the 1,8-naphtalimide fluorophores in their exited (S1) and ground (S0) states. It can be calculated by Equation (2).
Δ ν S t = ν a b s ν f l u = ( 1 λ a b s 1 λ f l u ) 10 7 cm 1
The obtained results have shown that the polarity of the organic solvents has a small effect on the Stokes shift values, while the type of substituent at C-4 shows a more significant effect. The presence of a cyclic amine leads to a larger Stokes shift.
An important characteristic of organic fluorophores, which are used as a signal unit in the design of fluorescent sensors, is their quantum efficiency. Quantum fluorescence yield ΦF has been used for quantitative characterization. In polar solvents, compounds M1 and M2 have a low quantum yield, which is enhanced in non-polar media. This effect can be explained by the photoinduced electron transfer (PET) [2,3,4]. In the case of M1, the dependence of the quantum yield on the polarity of the solvents is better expressed in comparison to M2. In compound M3, where PET is not possible, no such dependence has been observed. These results indicate that compound M1 and M2 are good candidates for fluorescent sensors for metal ions and protons based on PET.
The character of the transitions and the influence of the substituents at position C-4 on the spectral properties were also studied with DFT/TDDFT computations. Various conformers for M1 and M2 have been investigated at the B3LYP/6-31+G(d,p) and M062X/6-31+G(d,p) level of theory and later, only the most stable conformers of M1 and M2 were optimized at B3LYP/6-311++G(d,p) (Figure 2). Below, only the properties of the most stable conformers will be discussed.
Both compounds consist of two parts, the naphthalimide (NI) moiety and amino substituent at position C-4. The NI part represents the fluorophore, and the amino substituent is the chelating unit. The geometry optimization of M1 and M2 in the ground state showed indeed that there is a steric repulsion between the H atom at position 5 and the substituents at the nitrogen (numbering is given in Scheme 2). The dihedral angle τ(C1C2NH) between the naphthalimide plane and H from amino substituent in M1 is 14.5°, while the same angle τ(C1C2NC3) in M2 is 63.9°. In M1, the plane structure is maintained, thus favoring the interaction between the NI moiety and the lone pair of N atoms in the substituent, suggesting that an efficient p–p conjugation can operate between the donor and acceptor units in M1. The C–N bond in M1 is 1.353 Å and 1.396 Å in M2 at B3LYP/6-311++G(d,p) level of theory.
Absorption and emission spectra in acetonitrile were also theoretically estimated using TDB3LYP, TDPBE0, and TDM062X levels of theory. The predicted absorption wavelengths of the lowest electronic transitions and oscillator strength for M1 and M2 using different functionals are listed in Table 2. Benchmark calculations on the absorption properties of various systems have demonstrated that the expected accuracy of TDDFT is between 0.2 and 0.3 eV [59,60]. Note that such accuracy can only be reached with a physically reliable description of transitions where the surroundings of the fluorophores and the performance of the method strongly depend on the system and the chosen functional. Vertical excitation and de-excitation energies without any state-specific correction are reported herein.
The main difference in the optimized structures between the ground S0 and excited S1 states concern the C–N bond lengths and the angle τ(C1C2NC3). For M1, the plane molecular structure is preserved also in the first excited state S1. However, the geometry of M2 differs more dramatically between the ground and excited state—the dihedral angle τ(C1C2NC3) increased to 88.0° (from 63.9°). In addition, the C–N bond was elongated from 1.396 Å in S0 to 1.436 Å in S1 at the B3LYP/6-311++G(d,p) level of theory.
The trends of changes in electron densities can be illustrated through a molecular orbitals shape analysis. Figure 3 shows the ground state orbital energy levels of the highest occupied molecular orbital and the lowest unoccupied molecular orbital and the energy gap for M1 and M2 in acetonitrile.
The HOMO of M2 is delocalized over the naphthalimide moiety and the donor (N-methylpiperazine), while LUMO covers the acceptor part. The orbitals’ shape indicates that an effective intramolecular charge transfer occurs from the donor group toward the imide moiety. Hence, HOMO→LUMO transition is classified as an internal charge transfer (ICT) transition with contribution from N-methylpiperazine substituent. The small sensitivity toward solvation effect can be explained with the small change of dipole moment between the ground and excited states. The combination of a functional and basis set used for the spectral calculations proved to be reliable for the studied 1,8-naphthalimides. The ICT transition is simulated with good accuracy from the theoretical calculations. The B3LYP functional looks even “too good” for calculating the CT transition in M1 (Table 2). The calculated fluorescence maxima in acetonitrile for the M1 at B3LYP/6-311++G(d,p) level is 2.43 eV (510 nm), and the experimental value is 2.44 eV (509 nm). In the case of M2, it overrated the wavelength of the HOMO→LUMO transition (Table 2). The next transition S2 (HOMO-1→LUMO) correlates well with the experimental results. The ICT transition in M2 using M062X functional predicts that the S1 excited state consists of HOMO→LUMO (93%) and HOMO-1→LUMO (4%) transitions.
The excited state geometry for M2 was optimized at B3LYP/6-311++G(d,p) level and predicts the fluorescence maxima in acetonitrile at 2.56 eV (485 nm and oscillator strength f = 0.16), which is in an acceptable agreement with the experimental value (2.36 eV). Briggs and Besley stated that consideration of the MO only in the ground state is not sufficient to reliably predict the photoinduced electron transfer [61]. The energies and shape representation of the frontier molecular orbitals for optimized excited state S1 geometry of M2 obtained from TDB3LYP/6-311++G(d,p) computations are given in Figure 3.
As can be seen from Figure 4, in M2 the electron density of HOMO is distributed over the N-methylpiperazine moiety—the receptor, whereas HOMO-1 is localized also on the naphthalimide unit—the fluorophore. The electron density of LUMO is centered on the 1,8-naphthalimide part—the fluorophore. The lone pair orbitals of the amino groups in the receptor are of higher energies than those of the HOMO of fluorophore, which is a precondition for a typical reductive PET process. So, when excitation occurs, an electron would be transferred from the receptor to the fluorophore, which will lead to the quenching of M2 emission.

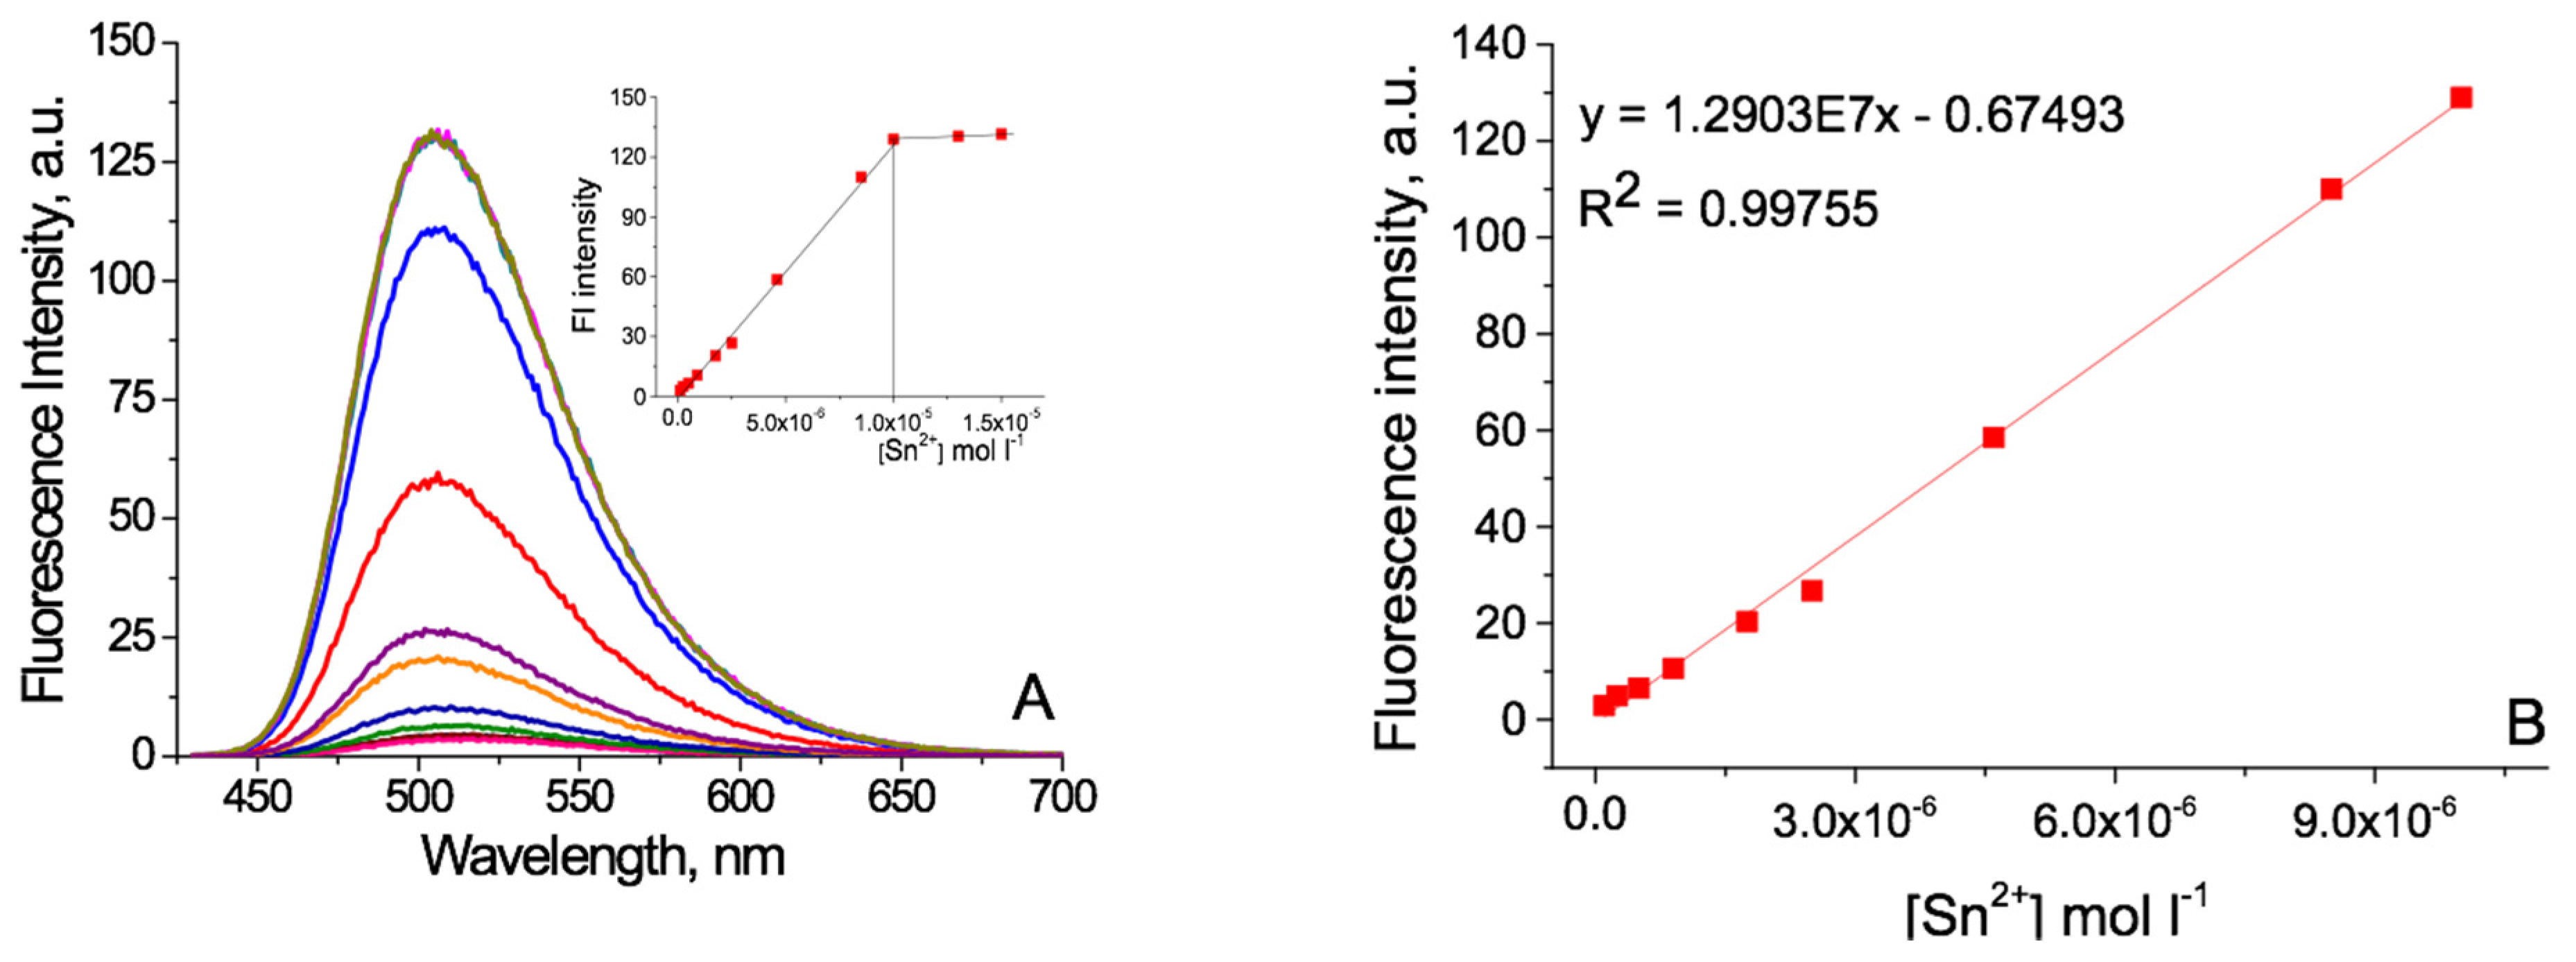
3.3. Detection Ability of Metal Cations of M1 and M2

The potential of M1 and M2 for detection of metal ions has been evaluated by titration with metal ions (Ag+, Mg2+, Sn2+, Pb2+, Sr2+, Cu2+, Co2+, Ba2+ and Fe3+,) in acetonitrile solution. As can be seen from the data in Table 2, the fluorescence intensities of M1 and M2 in acetonitrile are very low due to the PET effect. Also, the metal salts and their complexes are soluble in it. All of this makes acetonitrile a good solvent in the study of the sensor activity of the M1 and M2 ligands. After the addition of metal ions, the fluorescence of M1 and M2 is enhanced due to the quenching of the PET. This effect can be quantified using the enhancement of the fluorescence intensity (FE = I/Io), which is the ratio of the maximum fluorescence intensity (I, after the addition of metal ions) and the initial fluorescence intensity (Io, ligand before adding metal ions). Figure 5 shows the results obtained for FE for the compounds M1 and M2. FE has been recorded only when titrating with metal ions of groups IVA and VIIIB, which shows a good ability of the compounds to detect such elements. The highest values of FE for both compounds have been obtained for Fe(III) ions: FF = 32.5 for M1 and FF = 243.6 for M2. Some of the other metal ions, Sn2+, Co2+, Pb2+ when using M1 and Sn2+, Co2+ for M2 have similar values.
The structure of the complex between M2 and Fe3+ ion was fully optimized in gas phase at the B3LYP/6-31G(d) level of theory (Figure 6). Vibrational analysis was performed at the same level of theory. No imaginary frequency was found for the optimized structure, indicating a local minimum of the potential energy surface. The metal cation binds to both nitrogen atoms in a bidentate manner. The metal coordination number is 6 in agreement with the experimental observations. The other metal ions form the same complexes. When using M1 as a ligand, the complexes are formed with the two nitrogen atoms of the receptor fragment of the 1,8-naphthalimide structure (-NHCH2CH2N(CH3)2). These results are in very good accordance with our other research studies [5,24,27,32].
A representative example from the titrations of M1 has shown in Figure 7. In the presence of Sn2+ ions, its fluorescence intensity has been dramatically increased with a small change in the position of the fluorescence maxima (ΔλF = 6 nm).
The titration profile shows a linear increase of the signal as the concentration of the analyte increases, until the latter reaches the concentration of the compound M1, followed by a plateau, indicating a 1:1 metal-to-ligand ratio for the complex formation (Figure 7A). It should be noted that excellent signal-to-noise ratios are observed even for cation concentrations around and below 1 × 10⁻⁶ M. The dependence of the fluorescence intensity of M1 on the concentration of Fe (III) ions in the concentration range 0÷1 × 10⁻⁵ mol L−1 shows that very good linear dependence has been obtained R = 0. (Figure 7B) The limit of detection (LOD) = 5.77 × 10⁻⁷ mol L−1 and the limit of quantitation (LOQ) = 1.91 × 10⁻⁶ mol L−1 have been calculated on the basis of linear regression [24]. The results obtained for other metal ions have been in the same order. This indicates that M1 and M2 can be used for the detection of these metal ions in the environment at the ppm concentration range.

3.4. Influence of pH on the Fluorescence Intensity of the M1 and M2

In a water–ethanol mixture (1:4 v/v), the fluorescence emission of M1 and M2 has been studied by varying the pH values in the range pH = 3 ÷ 11 (Figure 8). The results show the high pH sensitivity of both compounds. In the case of M1, with increasing pH values up to 8, a plateau of the fluorescent intensity has been observed, after which it sharply decreases and at pH > 9, it maintains its low values. A similar dependence has been observed for compound M2, but the decrease in fluorescence intensity was smoother and started at pH = 5.5.
The quantitative pH dependence of the fluorescence intensity of compounds M1 and M2 was analyzed using Equation (3), and their pKa values have been calculated.
p H p K a = log [ ( I m a x I ) ( I I m i n ) ]
For compound M1, pKa was 7.79, while M2 has a slightly higher value pKa = 8.27. As can be seen from the figure, the fluorescent intensity is significantly higher in an acidic environment where it is possible to protonate the tertiary amino group from the receptor fragment and block the PET process. The observed pH value of the fluorescence intensity is more pronounced in the case of M2, where the fluorescence intensity increases by a factor of more than 50 upon the transition from alkaline to acidic medium, while in the case of M1, the increase is 18 times. A hypsochromic shift of the fluorescence maxima of 13 nm for M1 and 20 nm for M2 has also been observed. These results indicate that compounds M1 and M2 could be used as pH sensors.

4. Conclusions

The photophysical characteristics of three new 1,8-naphthalimide compounds (M1, M2, M3) have been evaluated in organic solvents of different polarity. The influence of the substituent at C-4 position has been investigated, and it was found that the chemical structure has a significant effect on these values. For compounds M1 and M2 containing tertiary amino groups connected to the chromophore system via an ethylene spacer, the fluorescence intensity depends strongly on the polarity of the medium. For compound M3, this dependence is negligible. This indicates that the tested compounds M1 and M2 can be used in the design of PET-based sensor systems. By using DFT and TDDFT computations, the sensor mechanism was rationalized, and the reductive PET mechanism was confirmed. The effects of different metal ions (Ag+, Ba2+, Cu2+, Co2+, Mg2+, Pb2+, Sr2+, Fe3+, and Sn2+) on the fluorescence intensity of the two compounds have been investigated. It has been shown that in the presence of Ag+, Pb2+, Sn2+, Co2+, and Fe3+ the fluorescence intensity is enhanced, and at compound M2, this effect has been better expressed. Both compounds exhibited pH dependence on the fluorescence intensity, which is low in an alkaline medium and enhanced in acidic medium.

Author Contributions

Conceptualization, I.G.; methodology, I.G., T.D.; formal analysis, S.Y.-T., D.C., and S.S.; investigation, S.Y.-T., S.S. and D.C.; writing—original draft preparation, I.G., D.C. and S.Y.-T.; visualization, S.Y.-T. and D.C.; supervision, I.G.; project administration, S.S.; funding acquisition, S.S. All authors have read and agreed to the published version of the manuscript.

Funding

This research was funded by Bulgarian National Science Fund, grant number KP 06-N29/12.

Conflicts of Interest

The authors declare no conflict of interest.

References

  1. Lakowicz, J.R. (Ed.) Principles of Fluorescence Spectroscopy, 3rd ed.; Springer US: Boston, MA, USA, 2006; ISBN 978-0-387-31278-1. [Google Scholar]
  2. Rurack, K. Flipping the light switch ‘ON’—The design of sensor molecules that show cation-induced fluorescence enhancement with heavy and transition metal ions. Spectrochim. Acta Part A Mol. Biomol. Spectrosc. 2001, 57, 2161–2195. [Google Scholar] [CrossRef]
  3. De Silva, A.P.; Gunaratne, H.Q.N.; Gunnlaugsson, T.; Huxley, A.J.M.; McCoy, C.P.; Rademacher, J.T.; Rice, T.E. Signaling recognition events with fluorescent sensors and switches. Chem. Rev. 1997, 97, 1515–1566. [Google Scholar] [CrossRef] [PubMed]
  4. Panchenko, P.A.; Fedorova, O.A.; Fedorov, Y.V. Fluorescent and colorimetric chemosensors for cations based on 1,8-naphthalimide derivatives: Design principles and optical signalling mechanisms. Russ. Chem. Rev. 2014, 83, 155–182. [Google Scholar] [CrossRef]
  5. Grabchev, I.; Qian, X.; Bojinov, V.; Xiao, Y.; Zhang, W. Synthesis and photophysical properties of 1,8-naphthalimide-labelled PAMAM as PET sensors of protons and of transition metal ions. Polymer (Guildf) 2002, 43, 5731–5736. [Google Scholar] [CrossRef]
  6. Xiao, Y.; Fu, M.; Qian, X.; Cui, J. A proton sponge-based fluorescent switch. Tetrahedron Lett. 2005, 46, 6289–6292. [Google Scholar] [CrossRef]
  7. Staneva, D.; Betcheva, R. Synthesis and functional properties of new optical pH sensor based on benzo[de]anthracen-7-one immobilized on the viscose. Dye. Pigment. 2007, 74, 148–153. [Google Scholar] [CrossRef]
  8. Staneva, D.; Betcheva, R.; Chovelon, J.-M. Fluorescent benzo[de]anthracen-7-one pH-sensor in aqueous solution and immobilized on viscose fabrics. J. Photochem. Photobiol. A Chem. 2006, 183, 159–164. [Google Scholar] [CrossRef]
  9. Staneva, D.; Grabchev, I. Heterogeneous sensors for ammonia, amines and metal ions based on a dendrimer modified fluorescent viscose fabric. Dye. Pigment. 2018, 155, 164–170. [Google Scholar] [CrossRef]
  10. Staneva, D.; Vasileva-Tonkova, E.; Grabchev, I. pH sensor potential and antimicrobial activity of a new PPA dendrimer modified with benzanthrone fluorophores in solution and on viscose fabric. J. Photochem. Photobiol. A Chem. 2019, 375, 24–29. [Google Scholar] [CrossRef]
  11. Georgiev, N.I.; Dimitrova, M.D.; Asiri, A.M.; Alamry, K.A.; Bojinov, V.B. Synthesis, sensor activity and logic behaviour of a novel bichromophoric system based on rhodamine 6G and 1,8-naphthalimide. Dye. Pigment. 2015, 115, 172–180. [Google Scholar] [CrossRef]
  12. Abebe, F.; Perkins, P.; Shaw, R.; Tadesse, S. A rhodamine-based fluorescent sensor for selective detection of Cu2+ in aqueous media: Synthesis and spectroscopic properties. J. Mol. Struct. 2020, 1205, 127594. [Google Scholar] [CrossRef]
  13. Mehta, R.; Luxami, V. Rhodamine-anthraquinone based dyad for rapid and selective sensing of Al3+ with potential application for real-time sampling and molecular logic circuits. Inorg. Chem. Commun. 2020, 115, 107863. [Google Scholar] [CrossRef]
  14. Panchenko, P.A.; Polyakova, A.S.; Fedorov, Y.V.; Fedorova, O.A. Chemoselective detection of Ag + in purely aqueous solution using fluorescence ‘turn-on’ probe based on crown-containing 4-methoxy-1,8-naphthalimide. Mendeleev Commun. 2019, 29, 155–157. [Google Scholar] [CrossRef]
  15. Fernández-Alonso, S.; Corrales, T.; Pablos, J.L.; Catalina, F. Surface modification of poly(ethylene-butyl acrylate) copolymers by microwave methodology and functionalization with 4-dimethylamino- N -(2-hydroxyethyl)-1,8-naphthalimide for acidity sensing. React. Funct. Polym. 2016, 107, 78–86. [Google Scholar] [CrossRef]
  16. Mohr, G.J. Synthesis of naphthalimide-based indicator dyes with a 2-hydroxyethylsulfonyl function for covalent immobilisation to cellulose. Sens. Actuators B Chem. 2018, 275, 439–445. [Google Scholar] [CrossRef]
  17. Marinova, N.V.; Georgiev, N.I.; Bojinov, V.B. Facile synthesis, sensor activity and logic behaviour of 4-aryloxy substituted 1,8-naphthalimide. J. Photochem. Photobiol. A Chem. 2013, 254, 54–61. [Google Scholar] [CrossRef]
  18. Aderinto, S.O.; Imhanria, S. Fluorescent and colourimetric 1, 8-naphthalimide-appended chemosensors for the tracking of metal ions: Selected examples from the year 2010 to 2017. Chem. Pap. 2018, 72, 1823–1851. [Google Scholar] [CrossRef]
  19. Sareen, D.; Kaur, P.; Singh, K. Strategies in detection of metal ions using dyes. Coord. Chem. Rev. 2014, 265, 125–154. [Google Scholar] [CrossRef]
  20. Shen, K.; Mao, S.; Shi, X.; Aderinto, S.O.; Xu, Y.; Wu, H. Development of a New 4-Amino-1,8-Naphthalimide Derivative as a Fluorescent Probe for Monitoring the Divalent Copper Ion. J. Appl. Spectrosc. 2018, 85, 665–672. [Google Scholar] [CrossRef]
  21. Oshchepkov, A.S.; Mittapalli, R.R.; Fedorova, O.A.; Kataev, E.A. Naphthalimide-Based Polyammonium Chemosensors for Anions: Study of Binding Properties and Sensing Mechanisms. Chem. Eur. J. 2017, 23, 9657–9665. [Google Scholar] [CrossRef]
  22. Georgiev, N.I.; Krasteva, P.V.; Bojinov, V.B. A ratiometric 4-amido-1,8-naphthalimide fluorescent probe based on excimer-monomer emission for determination of pH and water content in organic solvents. J. Lumin. 2019, 212, 271–278. [Google Scholar] [CrossRef]
  23. Spiteri, J.C.; Johnson, A.D.; Denisov, S.A.; Jonusauskas, G.; McClenaghan, N.D.; Magri, D.C. A fluorescent AND logic gate based on a ferrocene-naphthalimide-piperazine format responsive to acidity and oxidizability. Dye. Pigment. 2018, 157, 278–283. [Google Scholar] [CrossRef] [Green Version]
  24. Staneva, D.; Grabchev, I.; Betcheva, R. Sensor potential of 1,8-naphthalimide and its dyeing ability of cotton fabric. Dye. Pigment. 2013, 98, 64–70. [Google Scholar] [CrossRef]
  25. Grabchev, I.; Staneva, D.; Betcheva, R. Fluorescent Dendrimers As Sensors for Biologically Important Metal Cations. Curr. Med. Chem. 2012, 19, 4976–4983. [Google Scholar] [CrossRef]
  26. Soršak, E.; Valh, J.V.; Urek, Š.K.; Lobnik, A. Application of PAMAM dendrimers in optical sensing. Analyst 2015, 140, 976–989. [Google Scholar] [CrossRef]
  27. Grabchev, I.; Dumas, S.; Chovelon, J.-M.; Nedelcheva, A. First generation poly(propyleneimine) dendrimers functionalised with 1,8-naphthalimide units as fluorescence sensors for metal cations and protons. Tetrahedron 2008, 64, 2113–2119. [Google Scholar] [CrossRef]
  28. Staneva, D.; Vasileva-Tonkova, E.; Bosch, P.; Grabchev, I. A new green fluorescent tripod based on 1,8-naphthalimide. Detection ability for metal cations and protons and antimicrobial activity. J. Photochem. Photobiol. A Chem. 2017, 344, 143–148. [Google Scholar] [CrossRef]
  29. Medel, S.; Bosch, P.; Grabchev, I.; de la Torre, M.C.; Ramírez, P. Click chemistry to fluorescent hyperbranched polymeric sensors. 2. Synthesis, spectroscopic and cation-sensing properties of new green fluorescent 1,8-naphthalimides. Eur. Polym. J. 2016, 74, 241–255. [Google Scholar] [CrossRef]
  30. Vasileva-Tonkova, E.; Grozdanov, P.; Nikolova, I.; Staneva, D.; Bosch, P.; Medel, S.; Grabchev, I. Evaluation of antimicrobial, biofilm inhibitory and cytotoxic activities of a new hiperbranched polymer modified with 1,8-naphthalimide units. Biointerface Res. Appl. Chem. 2018, 8, 3053–3059. [Google Scholar]
  31. Wenxun, G.; Yaqing, Z.; Botian, L.; Liming, T. Fluorescent sensor of copper(II) ions based on PMBA microtubes with 4-methoxy-1,8-naphthalimide groups. React. Funct. Polym. 2020, 146, 104400. [Google Scholar] [CrossRef]
  32. Grabchev, I.; Sali, S.; Betcheva, R.; Gregoriou, V. New green fluorescent polymer sensors for metal cations and protons. Eur. Polym. J. 2007, 43, 4297–4305. [Google Scholar] [CrossRef]
  33. Sali, S.; Guittonneau, S.; Grabchev, I. A novel blue fluorescent chemosensor for metal cations and protons, based on 1,8-naphthalimide and its copolymer with styrene. Polym. Adv. Technol. 2006, 17, 180–185. [Google Scholar] [CrossRef]
  34. Zhao, P.; Jiang, J.; Leng, B.; Tian, H. Polymer Fluoride Sensors Synthesized by RAFT Polymerization. Macromol. Rapid Commun. 2009, 30, 1715–1718. [Google Scholar] [CrossRef]
  35. Grabchev, I.; Bojinov, V.; Chovelon, J.M. Synthesis, photophysical and photochemical properties of fluorescent poly(amidoamine) dendrimers. Polymer (Guildf) 2003, 44, 4421–4428. [Google Scholar] [CrossRef]
  36. Yordanova, S.; Grabchev, I.; Stoyanov, S.; Petkov, I. New detectors for metal cations and protons based on PAMAM dendrimers modified with 1,8-naphthalimide units. J. Photochem. Photobiol. A Chem. 2014, 283, 1–7. [Google Scholar] [CrossRef]
  37. Salman, H.; Tal, S.; Chuvilov, Y.; Solovey, O.; Abraham, Y.; Kapon, M.; Suwinska, K.; Eichen, Y. Sensitive and selective PET-based diimidazole luminophore for Zn II ions: A structure-activity correlation. Inorg. Chem. 2006, 45, 5315–5320. [Google Scholar] [CrossRef] [PubMed]
  38. Lee, H.; Hancock, R.D.; Lee, H.-S. Role of Fluorophore–Metal Interaction in Photoinduced Electron Transfer (PET) Sensors: Time-Dependent Density Functional Theory (TDDFT) Study. J. Phys. Chem. A 2013, 117, 13345–13355. [Google Scholar] [CrossRef]
  39. Reynolds, G.A.; Drexhage, K.H. New coumarin dyes with rigidized structure for flashlamp-pumped dye lasers. Opt. Commun. 1975, 13, 222–225. [Google Scholar] [CrossRef]
  40. Ramachandram, B.; Saroja, G.; Sankaran, B.; Samanta, A. Unusually High Fluorescence Enhancement of Some 1,8-Naphthalimide Derivatives Induced by Transition Metal Salts. J. Phys. Chem. B 2000, 104, 11824–11832. [Google Scholar] [CrossRef]
  41. Frisch, M.J.; Trucks, G.W.; Schlegel, H.B.; Scuseria, G.E.; Robb, M.A.; Cheeseman, J.R.; Scalmani, G.; Barone, V.; Petersson, G.A.; Nakatsuji, H.; et al. Gaussian 16 Revision 16.A.03. Available online: https://gaussian.com/g09citation/. (accessed on 13 July 2020).
  42. Labanowski, J.K.; Andzelm, J.W. (Eds.) Density Functional Methods in Chemistry; Springer: New York, NY, USA, 1991. [Google Scholar]
  43. Casida, M.E.; Chong, D.P. Recent Advances in Density Functional Methods; World Scientific: Singapore, 1995; Volume 1, ISBN 978-981-02-2442-4. [Google Scholar]
  44. Furche, F.; Ahlrichs, R. Adiabatic time-dependent density functional methods for excited state properties. J. Chem. Phys. 2002, 117, 7433–7447. [Google Scholar] [CrossRef]
  45. Scalmani, G.; Frisch, M.J.; Mennucci, B.; Tomasi, J.; Cammi, R.; Barone, V. Geometries and properties of excited states in the gas phase and in solution: Theory and application of a time-dependent density functional theory polarizable continuum model. J. Chem. Phys. 2006, 124, 094107. [Google Scholar] [CrossRef]
  46. Becke, A.D. Density-functional thermochemistry. III. The role of exact exchange. J. Chem. Phys. 1993, 98, 5648–5652. [Google Scholar] [CrossRef] [Green Version]
  47. Becke, A.D. Density-functional thermochemistry. IV. A new dynamical correlation functional and implications for exact-exchange mixing. J. Chem. Phys. 1996, 104, 1040–1046. [Google Scholar] [CrossRef]
  48. Perdew, J.P.; Ernzerhof, M.; Burke, K. Rationale for mixing exact exchange with density functional approximations. J. Chem. Phys. 1996, 105, 9982–9985. [Google Scholar] [CrossRef]
  49. Adamo, C.; Barone, V. Toward reliable adiabatic connection models free from adjustable parameters. Chem. Phys. Lett. 1997, 274, 242–250. [Google Scholar] [CrossRef]
  50. Zhao, Y.; Truhlar, D.G. The M06 suite of density functionals for main group thermochemistry, thermochemical kinetics, noncovalent interactions, excited states, and transition elements: Two new functionals and systematic testing of four M06-class functionals and 12 other function. Theor. Chem. Acc. 2008, 120, 215–241. [Google Scholar] [CrossRef] [Green Version]
  51. Petersson, G.A.; Bennett, A.; Tensfeldt, T.G.; Al-Laham, M.A.; Shirley, W.A.; Mantzaris, J. A complete basis set model chemistry. I. The total energies of closed-shell atoms and hydrides of the first-row elements. J. Chem. Phys. 1988, 89, 2193–2218. [Google Scholar] [CrossRef]
  52. Krishnan, R.; Binkley, J.S.; Seeger, R.; Pople, J.A. Self-consistent molecular orbital methods. XX. A basis set for correlated wave functions. J. Chem. Phys. 1980, 72, 650–654. [Google Scholar] [CrossRef]
  53. Cossi, M.; Barone, V.; Cammi, R.; Tomasi, J. Ab initio study of solvated molecules: A new implementation of the polarizable continuum model. Chem. Phys. Lett. 1996, 255, 327–335. [Google Scholar] [CrossRef]
  54. Tomasi, J.; Mennucci, B.; Cammi, R. Quantum Mechanical Continuum Solvation Models. Chem. Rev. 2005, 105, 2999–3094. [Google Scholar] [CrossRef]
  55. Grabchev, I.; Moneva, I.; Bojinov, V.; Guittonneau, S. Synthesis and properties of fluorescent 1,8-naphthalimide dyes for application in liquid crystal displays. J. Mater. Chem. 2000, 10, 1291–1296. [Google Scholar] [CrossRef]
  56. Alexiou, M.S.; Tychopoulos, V.; Ghorbanian, S.; Tyman, J.H.P.; Brown, R.G.; Brittain, P.I. The UV-visible absorption and fluorescence of some substituted 1,8-naphthalimides and naphthalic anhydrides. J. Chem. Soc. Perkin Trans. 2 1990, 837–842. [Google Scholar] [CrossRef]
  57. Stoyanov, S.; Petrov, P.; Stoyanova, M.; Dangalov, M.; Shivachev, B.; Nikolova, R.; Petkov, I. 4-Amino-3-nitro naphthalimides—Structures and spectral properties. J. Photochem. Photobiol. A Chem. 2012, 250, 92–98. [Google Scholar] [CrossRef]
  58. Legault, C.Y. CYLview, 1.0b. Université de Sherbrooke. 2009. Available online: http://www.cylview.org (accessed on 13 July 2020).
  59. Guido, C.A.; Mennucci, B.; Jacquemin, D.; Adamo, C. Planar vs. twisted intramolecular charge transfer mechanism in Nile Red: New hints from theory. Phys. Chem. Chem. Phys. 2010, 12, 8016. [Google Scholar] [CrossRef]
  60. Jacquemin, D.; Mennucci, B.; Adamo, C. Excited-state calculations with TD-DFT: From benchmarks to simulations in complex environments. Phys. Chem. Chem. Phys. 2011, 13, 16987. [Google Scholar] [CrossRef] [PubMed]
  61. Briggs, E.A.; Besley, N.A. Density Functional Theory Based Analysis of Photoinduced Electron Transfer in a Triazacryptand Based K + Sensor. J. Phys. Chem. A 2015, 119, 2902–2907. [Google Scholar] [CrossRef] [Green Version]
Scheme 1. Synthesis of monomeric fluorescent sensors M1M3.
Sensors 20 03892 sch001
Figure 1. Normalized absorbance spectra of all compounds in acetonitrile.
Sensors 20 03892 g001
Figure 2. B3LYP/6-311++G(d,p) optimized geometries of M1 and M2 in acetonitrile [58].
Sensors 20 03892 g002
Scheme 2. Chemical structure of M2.
Sensors 20 03892 sch002
Figure 3. Shape representation of the ground state HOMO and LUMO of M1 and M2 in acetonitrile from B3LYP/6-311++G(d,p) computations.
Sensors 20 03892 g003
Figure 4. Energies and shape representation of HOMO-1, HOMO, and LUMO, for the excited state of M2 in acetonitrile from TDB3LYP/6-311++G(d,p) computations.
Sensors 20 03892 g004
Figure 5. Fluorescence enhancement factors of M1 (A) and M2 (B) in acetonitrile solution at c = 1 × 10⁻⁵ mol L−1.
Sensors 20 03892 g005
Figure 6. Optimized structure for the complex of M2 dye with Fe3+ ion from B3LYP/6-31G(d) computations. Color scheme: C—green, O—red, H—light gray, Fe—cyan.
Sensors 20 03892 g006
Figure 7. Fluorescence spectra (A) of M1 (c = 1 × 10⁻⁵ mol L−1) in acetonitrile solution at different concentrations of Sn2+ cations (from 0 to 1.5 × 10⁻⁵ mol L−1) in the order of increasing intensity, and linear calibration curve (B) at the region from 0 to 1 × 10⁻⁵ mol L−1.
Sensors 20 03892 g007
Figure 8. Normalized fluorescence of M1 and M2 depending on the pH of the methanol/water solution (1:4 v/v).
Sensors 20 03892 g008
Table 1. Photophysical properties of the studied 1,8-maphthalimide derivatives in solvents of different polarity.
DMSODMFMeCNMeOHEtOHCH2Cl2DioxaneEtOAcCHCl3
M1
λabs (nm)429438432436436434426426433
λflu (nm)516523509520522509508510505
ΔνSt (cm−1)393037113502370537793395378938663293
ԑ 10−3 (L mol−1 cm−1)14.314.114.717.015.017.012.714.015.9
ΦF0.0060.0090.120.0190.0170.3580.2740.220.53
M2
λabs (nm)406403399396397406395394402
λflu (nm)520527525518520514506509499
ΔνSt (cm−1)540058396015594859585175555457344836
ԑ 10−3 (L mol−1 cm−1)7.19.010.610.910.411.211.210.110.5
ΦF0.0070.0030.0020.0080.0070.010.0540.0310.064
M3
λabs (nm)444440434442444432427431433
λflu (nm)529523521534528508502510502
ΔνSt (cm−1)361936073848389835833463349935943371
ԑ 10−3 (L mol−1 cm−1)7.59.59.811.39.711.29.29.510.0
ΦF0.590.4240.4010.2590.3340.5330.5510.4670.552
Table 2. TDDFT calculated absorption (λabs) wavelengths and oscillator strength f (in parentheses) of M1 and M2 in acetonitrile.
Dye λ m a x a b s / eV
ExpB3LYPPBE0M062x
6-311++G(d,p)
M12.872.87 (0.3284)2.98 (0.3551)3.23 (0.4709)
M23.112.68 (0.1899)
3.10 (0.1154)
2.81 (0.2332)
3.27 (0.0977)
3.27 (0.4251)

